Article

Vulnerability of Maize Farming Systems to Climate Change: Farmers’ Opinions Differ about the Relevance of Adaptation Strategies

1
INRAE, UMR1248 AGIR, Université de Toulouse, F-31320 Castanet-Tolosan, France
2
INRAE, UR MIAT, Université de Toulouse, F-31320 Castanet-Tolosan, France
3
INPT ENSAT, UMR1248 AGIR, Université de Toulouse, F-31320 Castanet-Tolosan, France
*
Author to whom correspondence should be addressed.
Sustainability 2022, 14(14), 8275; https://doi.org/10.3390/su14148275
Submission received: 19 May 2022 / Revised: 28 June 2022 / Accepted: 29 June 2022 / Published: 6 July 2022

Abstract

:
Climate change has negative impacts on maize cultivation in southwestern France, such as soil erosion and water stress. The vulnerability of maize farming systems to climate change must be assessed before considering potential adaptation strategies. This study focused on eliciting and understanding criteria that maize growers use to assess the vulnerability of their farming systems to climate change. To this end, we surveyed maize growers in two consecutive stages: a qualitative stage, to elicit vulnerability criteria, and a quantitative stage, to test the genericity of criteria related to the adaptation strategies. The qualitative stage identified 144 criteria that farmers used to assess vulnerability to climate change, while the quantitative stage showed that farmers’ opinions about the adaptation strategies differed. Many factors explained these differences, including structural (e.g., soil type) and psychological factors (e.g., interest in agroecology). Our typology of farmers revealed that their interest in agroecology and technology, as well as their perceptions of the risks of climate change and their attachment to their production systems, influence the type of adaptations they identify as relevant (i.e., intensification strategies, slight adjustments or agroecological innovations). Farmers’ perceptions should be considered when providing individual advice and assessing vulnerability, by including criteria related to their psychological characteristics.

1. Introduction

Farmers must increasingly address the global increase in temperature and annual variations in rainfall [1]. In France, a 6 °C increase in the mean summer temperature is expected by the end of the 21st century; although annual variations in rainfall are not expected, large monthly variations are predicted [2,3]. Higher temperatures will increase soil evaporation and crop transpiration, which will increase water demand and consumption, which will in turn influence the surface water balance and the potential for severe drought [4,5,6]. In addition to thermal and hydric stresses, the increased frequency and intensity of extreme climatic events can result in soil erosion due to floods, droughts or storms [6]. Droughts would have a particularly severe impact on summer-irrigated crops. In southwestern France, maize cropping systems already suffer from these climate phenomena [7,8]. Consequently, farmers must adapt their farming systems to reduce their farms’ vulnerability to climate change [9]. Farmers have access to many adaptation strategies [10], such as changing varieties or crop species, changing sowing density and modifying the schedule of cropping operations [7,11,12,13,14,15]. However, adaptation decisions can fail, either by not achieving the objectives, or worse, by increasing vulnerability [16]. Therefore, the vulnerability of maize farming systems must be assessed before considering adaptation strategies to address climate change. More specifically, a better understanding of maize farming systems and the determinants of adaptive capacity can allow public policies and agricultural advising to enhance the agroecological transition.
The Intergovernmental Panel on Climate Change (IPCC) defines climate change vulnerability as “the degree to which a system is susceptible to, and unable to cope with, adverse effects of climate change, including climate variability and extremes” [1]. Vulnerability is a function of (i) exposure (i.e., characterized by the intensity, frequency and duration of perturbations), (ii) sensitivity (i.e., degree to which the exposure influences the system) and (iii) adaptive capacity (i.e., ability to implement adaptations to address perturbations) [17]. This conceptual framework combines biophysical and socio-economic factors to determine vulnerability [18].
The need to assess vulnerability has already been discussed [19,20,21] but is rarely rendered operational due to its complexity. Two main approaches are used to assess the vulnerability, or the related concept of resilience, of agricultural systems [22]: (i) the quantitative analysis of agricultural system outputs, in which vulnerability is assessed by studying dynamics related to the perturbations of agricultural outputs, such as yield or economic net return [20,23,24], and (ii) the quantitative or qualitative evaluation of predefined properties associated with vulnerability or resilience [25,26,27]. In the latter approach, vulnerability is assessed by considering the properties of the system identified using expert knowledge or the literature [28,29].
Most vulnerability and resilience assessment studies are based on a dynamic performance approach. However, this approach is limited to easily recordable components, and often focuses on only one type of performance, mainly yield [22,30,31], whereas assessing multiple types of performance is essential [19]. Moreover, these studies rarely focus on assessing vulnerability at the farm scale, even though all the dimensions of a farming system must be considered. Identifying the determinants of vulnerability to climate change requires a systemic approach, since vulnerability is a complex problem and can be influenced by diverse factors such as crop management and the financial status of the farm. Moreover, decisions about adaptation strategies are made at the farm level [30,32]. The predefined property approach can focus on a broader scale by using indicators to consider different components of agricultural systems, including adaptive capacity [28]. Despite this advantage, few agricultural studies have used a predefined property approach [33].
Many studies considered only the dimensions of exposure and sensitivity when assessing climate change vulnerability, ignoring the adaptive capacity of farmers [34]. However, Marshall et al. [35] showed that farmers’ perceptions of their skills, their satisfaction with the adaptations they implement and their willingness to change, strongly influence their adaptive capacity. Consequently, farmers’ perceptions will influence the vulnerability of their farms [35]. Previous studies have stressed the importance of cognition (i.e., the administration and implementation of information) on vulnerability [36,37,38]. For example, Marshall et al. [35] showed that less vulnerable farmers were well integrated into social networks. In the literature, there are several empirical studies studying farmers’ adaptive capacity specifically regarding climate change impacts [39,40,41,42,43]. Some of these studies use individual interviews with farmers to obtain their perceptions about climate change [39,40,43], while other studies base their data collection on participative methods such as focus groups [41,42]. The data analysis conducted to identify the determinants of adoption can be based on Pearson correlation [40], mathematical models [39] such as the logit model [43], and factorial analysis using PCA and ANOVA [41]. The results of these studies show that adaptive capacity is influenced by the individual characteristics of the farmers, such as access to extension services [39,42], perceptions of risks [40,43], access to information [39,43], or the level of knowledge [39,41].
Ultimately, studying adaptive capacity is essential to identify criteria for assessing the vulnerability of farming systems.
Most assessment methods are based on an objective approach (i.e., external judgements [44]) to identify performance indicators that measure the dynamics of vulnerability or identify properties that influence vulnerability. Although scientists have taken responsibility for designing these indicators, farmers are able to identify the determinants of vulnerability on their own farms [44] and can understand their situations [45] in relation to climate change. Using the determinants of vulnerability identified by farmers will help legitimize this set of indicators [44,46]. Moreover, considering farmers’ personal characteristics (i.e., cognitive and psychological factors) when assessing farm vulnerability is crucial for advisors to provide specific guidelines based on each farmer’s situation [35]. Jones [44] highlighted that subjective approaches can consider farmers’ knowledge and experience of resilience, along with the factors that contribute to them, and can complement objective approaches.
This study aimed to identify and understand the criteria that maize growers use to assess the vulnerability of their farming systems to climate change. The criteria for assessing vulnerability were elicited (i) at the farm level (ii) to include the adaptive-capacity dimension of vulnerability, using (iii) a predefined property approach and (iv) a subjective approach based on farmers’ perceptions. We conducted a two-stage survey with maize growers: one group of farmers was surveyed to elicit vulnerability criteria, and another group was surveyed to test the genericity of adaptation strategy criteria and understand farmers’ opinions about the relevance of adaptations. We assumed that farmers’ psychological and cognitive factors would explain their opinions. This study will help understand farming with a more systemic approach, by knowing to what extend the farmer’s subjectivity needs to be considered when investigating vulnerability to climate change.

2. Materials and Methods

2.1. Conceptual Framework

We developed a conceptual framework that combines the Drivers–Pressures–State-Impacts–Responses (DPSIR) model developed by Smeets et al. [47] and the three dimensions of vulnerability defined by the IPCC (i.e., exposure, sensitivity and adaptive capacity) [17]. The DPSIR model represents causal interactions between a system and its environment: a driving force (D) creates pressure (P) on a system in a given state (S), which creates impacts (I). In response to these impacts, the system responds (R) with adaptations [47,48].
We developed the following framework to explore farm vulnerability to climate change (Figure 1): climate change variables are driving forces (D) (e.g., rainfall) that produce pressures (P) (e.g., excess water) that influence the state of cropping systems (S). This degradation of cropping systems has impacts on the farm (I) (e.g., soil erosion) that require adaptation strategies (R) (e.g., reduction in soil tillage). We added a supplementary component to the DPSIR model in our framework, since implementing adaptation strategies requires the resources of the farm (e.g., availability of equipment, financial situation) and of the farmer (e.g., knowledge, perceptions) (F). Along with climate change pressures, other driving forces can pressure the system, such as market volatility, regulations and citizens’ opinions. We considered only the negative aspects of climate change in our conceptual framework, although it could include positive aspects (e.g., increasing CO2 concentrations increase plant growth).

2.2. Overview of the Survey Design

We used an empirical approach that had two consecutive stages to include qualitative and quantitative approaches (Table 1). The qualitative stage aimed to elicit vulnerability criteria from a group of expert farmers. We considered “criteria” instead of “indicators” since we focused on identifying the determinants of vulnerability and not on measuring them. The three dimensions of vulnerability were addressed in this stage. The four-step interviews were based directly on our conceptual framework, since we asked each farmer to describe the following information: (i) pressures related to climate change (P) and impacts (I) the farmer observes on the farm; (ii) ways to measure the state of the cropping system (S); (iii) adaptation strategies the farmer implements or wishes to implement (R) and (iv) farm and farmer resources required to implement the adaptations (F). The discussion was facilitated using visual aids (i.e., a board and climate graphs) and the encouragement of the interviewer.
We designed the questionnaire for the second stage based on the results of the first stage. The first survey revealed a diversity of adaptation strategy criteria elicited from expert farmers. Thus, the second stage of the survey focused on the “adaptation strategies” dimension of our conceptual framework. We tested the genericity of the adaptation strategy criteria obtained in the qualitative survey by asking a larger sample of farmers to select criteria and indicate their relevance. To this end, we created a card game, with each card representing one adaptation strategy criterion (e.g., reduce soil tillage). We then used statistical analysis to explain farmers’ opinions via explanatory factors such as the characteristics of the farm and farmer.

2.3. Case Study

The study was conducted in the Occitanie region in southwestern France, within a 100 km radius around the city of Toulouse. Southwestern France is known for its maize production, as it supplies 39% of the national production of the crop [49]. In 2020, Occitanie counted 131,706 hectares of grain maize, including 102,094 irrigated hectares, representing 8% and 15% of the national area of grain maize, respectively [50]. The temperature in Occitanie continues to increase, which has a negative impact on maize cultivation. Higher temperatures in May and June cause problems during reproductive stages, such as pollen degradation and difficulty with absorbing nutrients [5,6]. An increase in summer droughts creates the need for more irrigation water for maize, meaning that maize farms economically depend on irrigation in 6 out of 10 years, on average [49]. Farmers interviewed in the qualitative and quantitative stages came from several departments in the Occitanie region—Tarn, Tarn et Garonne, Gers and Haute-Garonne (Figure 2)—to ensure that we included a diversity of maize farming systems in southwestern France. Access to irrigation differs between the departments, as does soil type, historical types of farm production, climate conditions and the social environment. All farmers interviewed grew irrigated maize (i.e., popcorn, waxy, grain or seed) on at least one field. The Chamber of Agriculture in the region provided contacts for farmers for both stages of the survey.
To elicit criteria in the qualitative stage, we recruited a small sample of expert farmers (13, all male) who were sensitive to climate change and already adopting innovations for adaptation. The interviews, conducted from February to April 2021, lasted 0.75–3 h. For the quantitative stage, we interviewed a sample of 32 maize farmers (all male) representative of the study area in terms of areas and types of production. The interviews, conducted in June and July 2021, lasted 1–3 h.

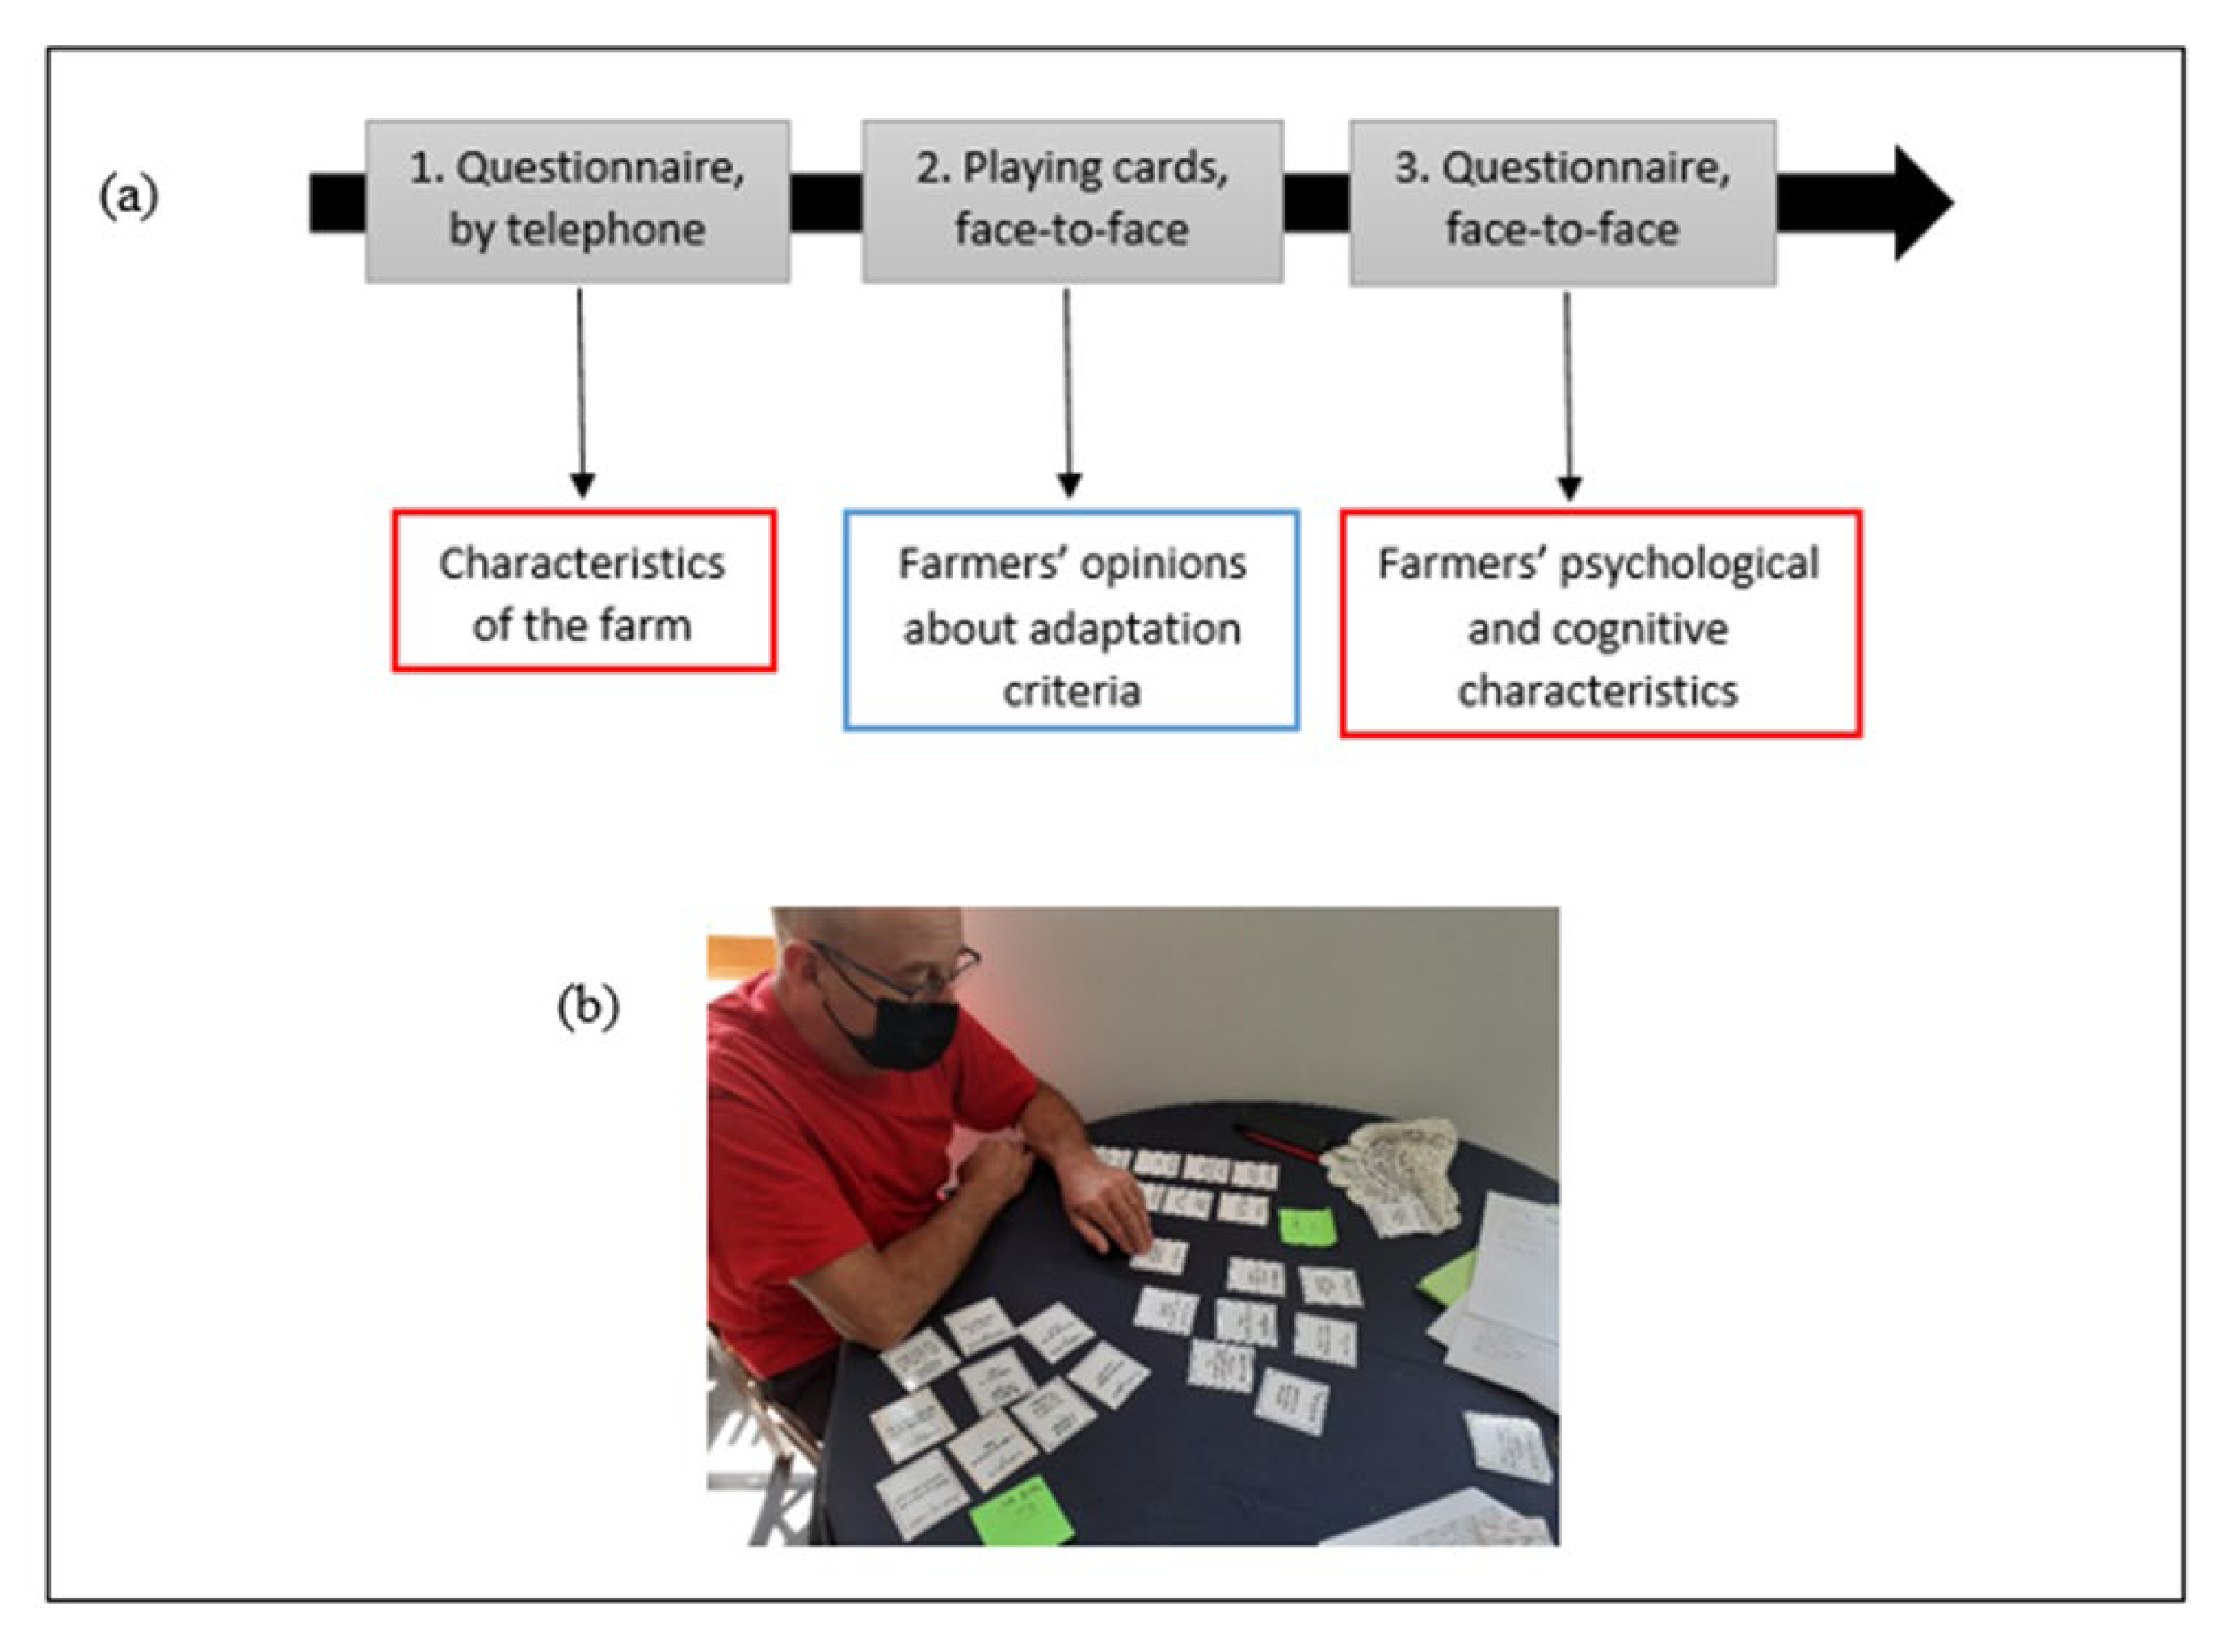
2.4. Data Collection

For the qualitative stage of the survey, two visual aids were used to support the interviews. First, the interviewer showed climate graphs and discussed them with the farmer, and then encouraged the farmer to express his opinions about the climate pressures and impacts he observed on his farm. After discussing the graphs, the farmer was asked to observe a board representing components of the farming system (Figure 3) and explain how climate change manifests and influences each component. The facilitator encouraged the farmer to identify sensitive elements in his farming system and adaptations he had implemented (or wanted to implement). For each adaptation the farmer identified, the facilitator asked which resources it required. At the end of the interview, the facilitator asked the farmer to summarize the strengths and weaknesses of his farming system in relation to climate change. All interviews were audio recorded to ensure that data were collected accurately.
To design the questionnaire for the quantitative survey, we identified a list of explanatory variables and made assumptions about their influence on farmers’ opinions about adaptation strategy criteria. We then summarized the extensive list of adaptation strategy criteria obtained in the qualitative stage to (i) identify more general criteria, (ii) avoid redundant criteria and (iii) reduce the number of criteria. We reduced the initial list of adaptation strategy criteria from 50 to 41. The data collection process was divided into three steps (Figure 4a):
  • Farmers responded to a questionnaire by telephone to identify the farm characteristics that were potential explanatory variables. The questionnaire was divided into eight categories defined according to expert knowledge, including general information, material resources, water resources, soil resources, financial resources, crops and rotation, human resources and individual resources.
  • Farmers were asked to assess the adaptation strategy criteria in a semi-structured interview using the 41 playing cards that represented the adaptation strategy criteria. The interviewer asked the farmer to select the four most relevant cards and the four least relevant cards for reducing vulnerability (Figure 4b).
  • The farmer’s cognitive and psychological characteristics were identified using a face-to-face questionnaire (Table 2). This questionnaire supplemented the telephone questionnaire by adding new potential explanatory factors.
Figure 4. (a) Main steps of the quantitative survey, showing explanatory variables (red) and the variables explained (blue), and (b) a farmer playing the card game used in the quantitative survey.
Sustainability 14 08275 g004

2.5. Data Processing and Analysis

For the qualitative survey, each interview was transcribed into monographs. We then identified, via farmers’ comments, elements that were related to the dimensions of the conceptual framework. We collected and classified these elements into a database, and for each element, we determined the associated criteria using agronomic expertise. Finally, we removed redundant criteria and counted the number of times that each criterion was mentioned.
The data collected in the second stage of the survey yielded a database composed of 32 rows (farmers) × 156 columns (explanatory variables) × 41 criteria (explained variables). The statistical challenge was to analyze a database that had many more variables than individuals. Before analyzing the data, we cleaned them in several steps (Appendix A). The cleaning procedure left 25 explanatory variables (Appendix B) for the 32 farmers and 41 explained variables.
To study the distribution of the adaptation strategy criteria among farmers, we developed a typology of these criteria based on farmers’ opinions and the number of times they had been mentioned. Classification consisted of multiple correspondence analysis (MCA) followed by hierarchical clustering on principal components (HCPC). We used three additional statistical methods to understand differences in the criteria chosen (Figure 5). We developed regression trees for criteria that were mentioned by at least five farmers. The regression tree method allows for the consideration of local interactions among variables, and is relevant for samples with many variables compared to the number of individuals [6]. We then performed a logistic regression of each criterion and its associated first explanatory variable identified by the regression tree. Finally, we practiced a classification of farmers based on their assessment of the adaptation strategy criteria and studied the distribution of explanatory variables in each cluster. The objective was to create a typology of farmers according to their choice of adaptations, and thus identify explanatory variables for these choices.
The statistical analysis was performed using R software [51], with the MCA and HCPC functions of the FactoMineR package [52] for classifications. The rpart [53] and rpart. plot [54] packages were used for regression trees, and the mlogit package [55] was used for logistic regressions.

3. Results

3.1. Participants

The utilized agricultural area (UAA) varied among the 13 expert farmers involved in the qualitative survey. The mean UAA of 198 ha (standard deviation = 89 ha) was much larger than that of field-crop farms in the region (i.e., 83 ha) [56]. The mean area under irrigated maize was 52 ha (±32 ha), which was also much larger than that of field-crop farms in the region (i.e., 28 ha).
The mean age and number of labor units of the 32 farmers interviewed in the quantitative survey were representative of field-crop farms in the region. Their farms had a much larger mean UAA and irrigated area (199 and 60 ha, respectively) than those of field-crop farms in the region (99 and 21 ha, respectively). More than 50% of their revenue came from maize production, while the mean was 36% for field-crop farms in the region. A larger percentage of them practiced organic agriculture than the mean percentage of field-crop farms in the region.

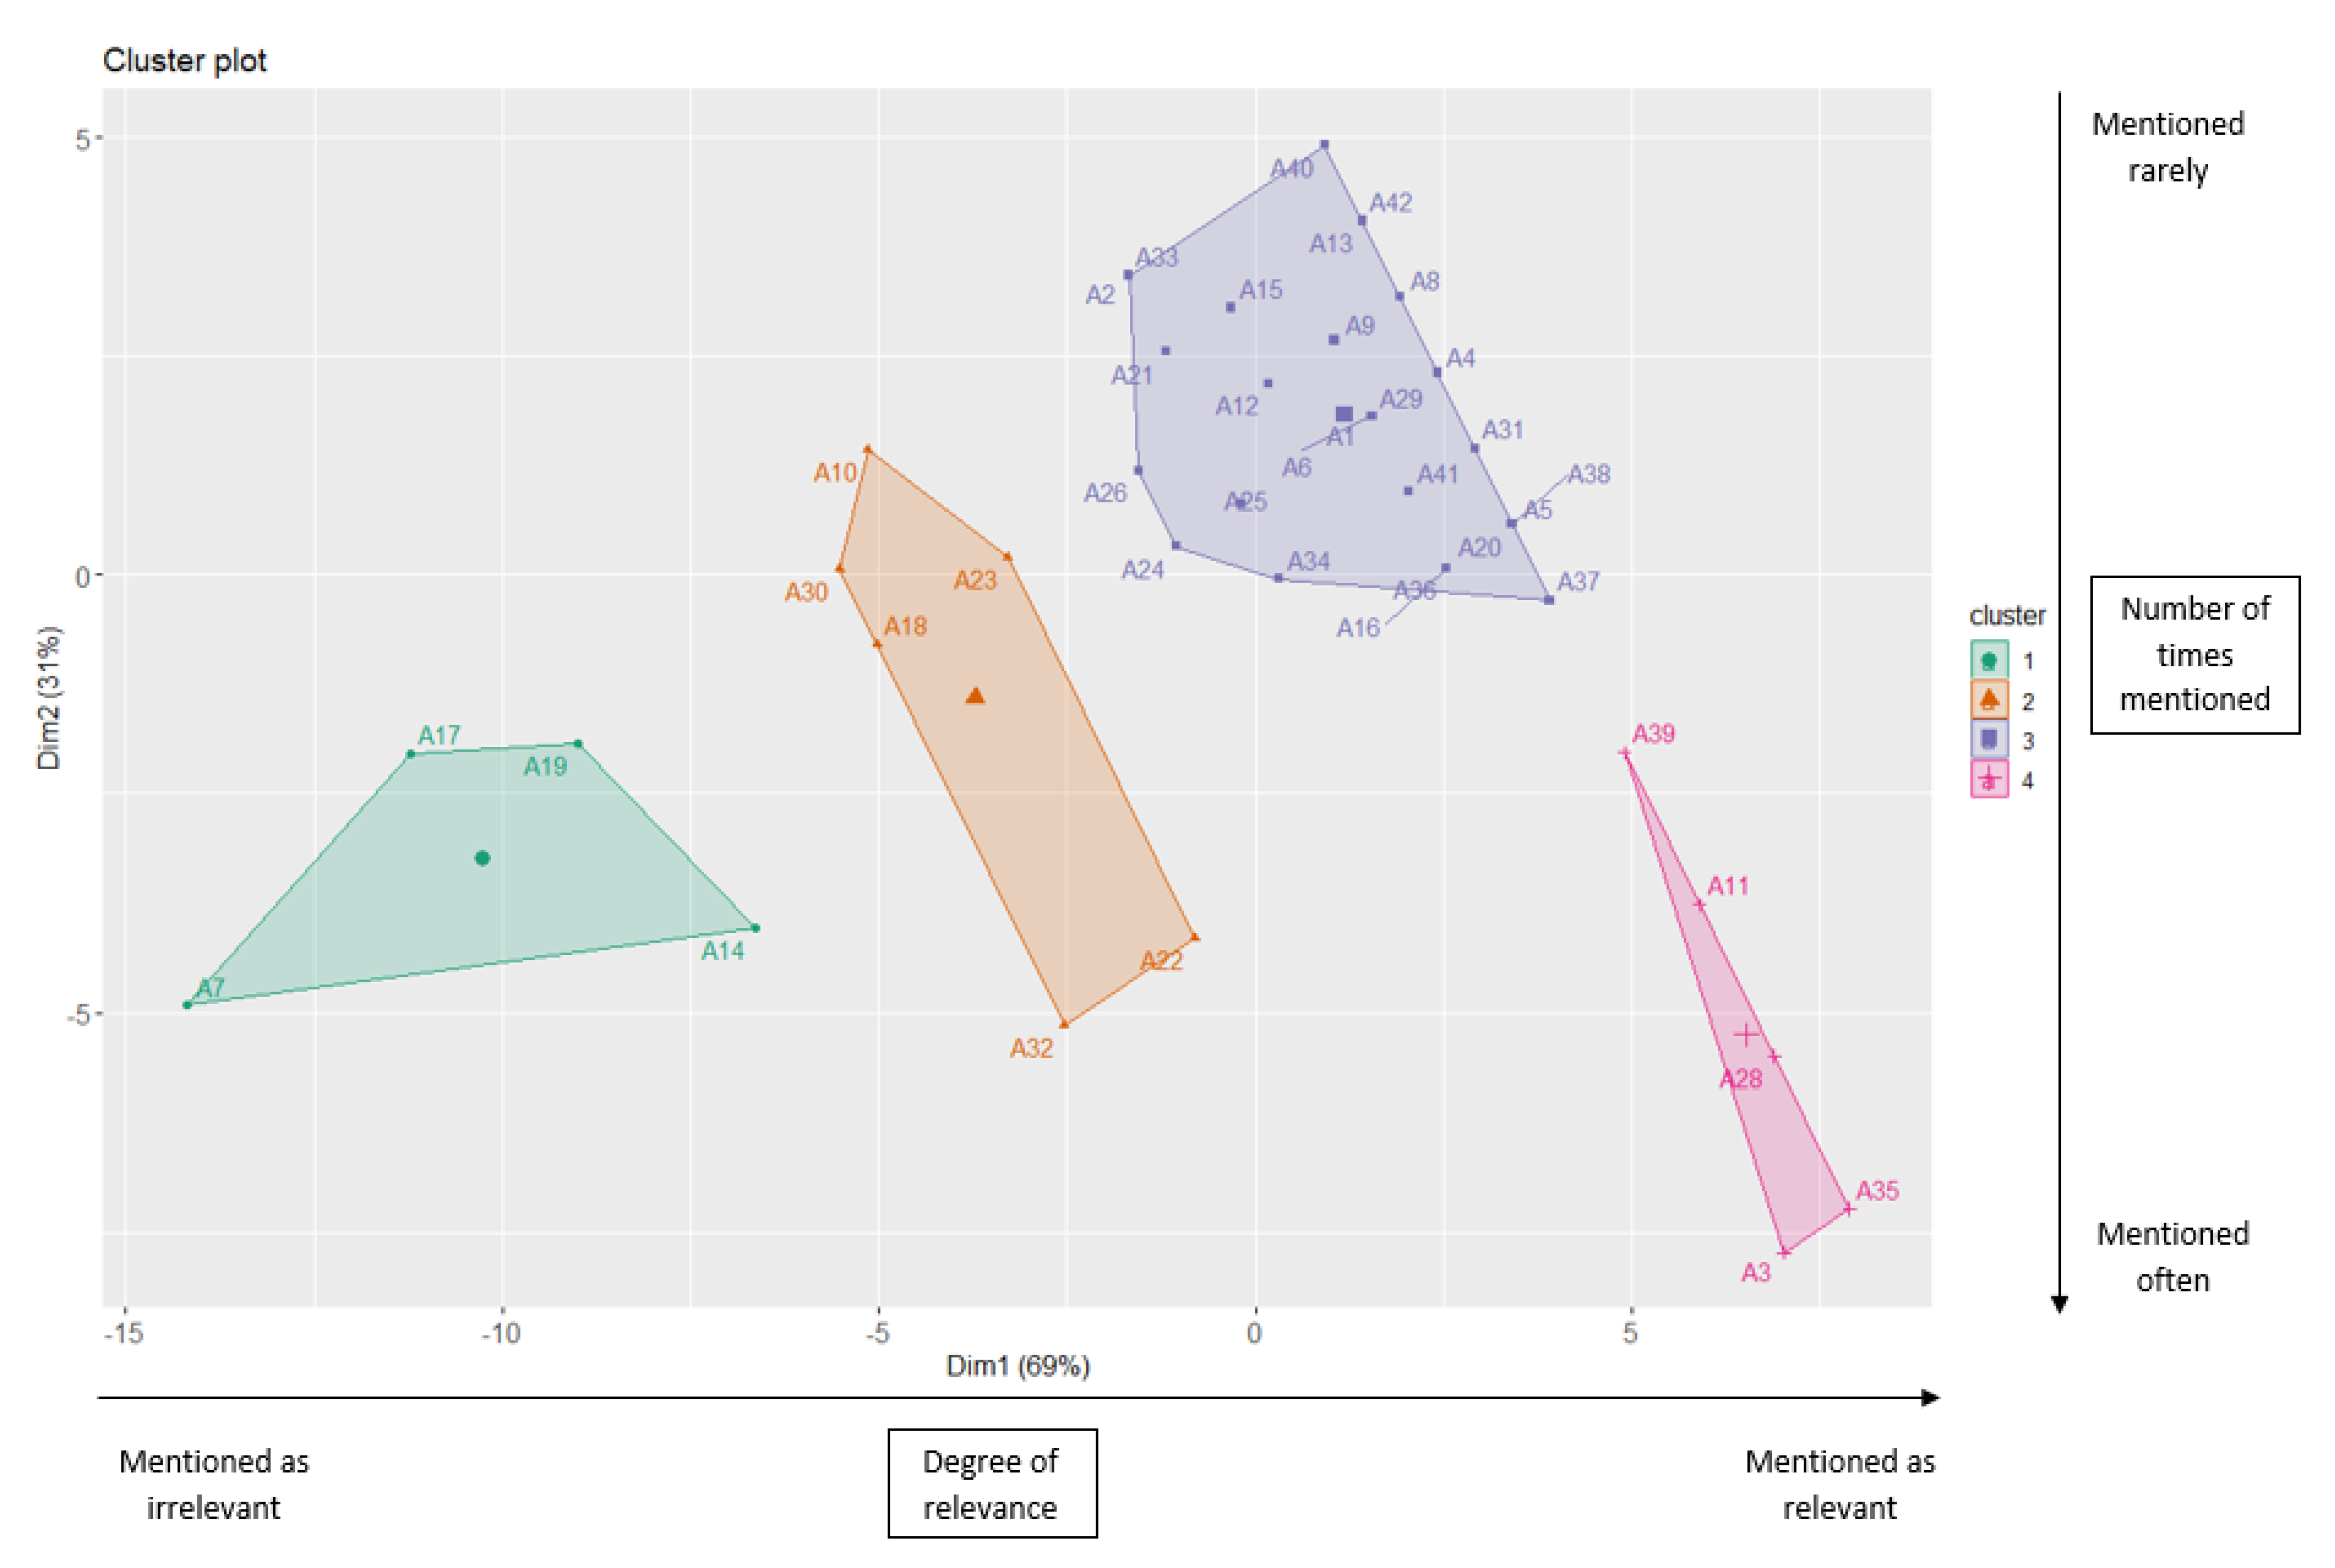
3.2. Distribution of the Criteria Elicited from Farmer Interviews

The qualitative stage of the survey resulted in a list of 144 criteria distributed among all dimensions of the conceptual framework (Figure 6). The least represented sub-dimension of vulnerability was “farm resources” (nine criteria). Most of its criteria concerned traditional financial assessments of a farm, such as income, gross profit and debt, which all farmers mentioned. The most represented sub-dimension was “adaptation strategies” (50 criteria), which was the most diversified sub-dimension among the 13 expert farmers interviewed.
Among the 50 adaptation strategy criteria, only three were mentioned by all farmers: “increase water storage”, “diversify water sources” and “irrigate winter crops”. All of these criteria were related to water use, which was not surprising in a context of water scarcity. Conversely, 22 adaptation strategy criteria were mentioned only once, such as “partner with a beekeeper”, “plant mixed crops” and “introduce livestock”. Appendix C shows the number of times that each of the 50 adaptation strategy criteria was mentioned.

3.3. Differing Opinions about Adaptation Strategy Criteria among Farmers

The MCA and HCPC of the 41 adaptation strategy criteria according to their relevance for farmers (dimension 1) and the number of times they were mentioned (dimension 2) identified four clusters (Figure 7). Cluster 1 grouped criteria that tended to be considered irrelevant and that were mentioned often, while cluster 4 grouped criteria that tended to be considered relevant and which were mentioned often. Farmers considered the following adaptation strategy criteria to be particularly irrelevant for reducing vulnerability to climate change: “introduce livestock production unit” (A14), “convert to organic farming” (A19), “buy new land” (A17) and “stop growing maize” (A7). Criteria considered particularly relevant for reducing vulnerability to climate change included “use sensors” (A38), “use a maize variety resistant to hydric stress” (A11), “return harvest residues to the soil” (A27), “increase irrigation efficiency” (A34) and “plant cover crops” (A3). A11, A27 and A34 concerned technology or strategies for managing water, while A27 and A3 concerned strategies and crop practices for managing the soil. Cluster 2 grouped criteria that were mostly irrelevant and rarely mentioned (A10, A18, A23, and A29) along with criteria that generated highly contrasting opinions and were mentioned often (A22, A31). For example, farmers disagreed greatly about the criteria “stop plowing” (A22) and “build or develop a reservoir” (A31). Some farmers considered “stop plowing” a solution to improve soil fertility and control erosion (mentioned as relevant seven times), while other farmers considered it a high risk for crop productivity due to potential problems with weed management and crop establishment (mentioned as irrelevant six times). Cluster 3 grouped criteria that were rarely mentioned and about which farmers’ opinions differed, such as “use mechanical weeding” (A24), “practice strip tillage” (A26), “practice direct seeding” (A25) and “diversify water sources” (A33). For example, several farmers agreed that direct seeding was a way to maintain soil quality (mentioned as relevant three times), while other farmers mentioned that equipment costs and uncertainty in productivity made this practice too risky for the financial situation of their farm (mentioned as irrelevant three times).

3.4. Explaining Differences in Opinions about the Adaptation Strategy Criteria

For six criteria, logistic regressions confirmed the significant (p < 0.05) influence of the first explanatory variable revealed in the regression tree (Table 3). Of the six explanatory factors identified, three were related to farmer characteristics (i.e., age, perceptions of climate change risks, and interest in agroecology) and the other three were related to farm characteristics (i.e., soil types, number of crops).
To supplement the regression methods, we performed the HCPC of farmers based on their opinions of the adaptation strategy criteria (i.e., relevant, not selected, irrelevant). The four clusters it identified contained significant differences in farmers’ opinions about the adaptation strategy criteria (Table 4). For each cluster, we identified the adaptation strategy criteria that characterized the cluster the most (Appendix E) and studied the distribution of the 25 explanatory variables (Table 4). Farmers in cluster 1, who adopted slight adaptation strategies, had a similar medium-sized UAA for the sample. These farmers perceived climate change as a threat but had little interest in agroecological practices, which was consistent with the results of the regressions (farmers with high interest in agroecology did not perceive “irrigate winter crops” as relevant). All farmers in cluster 2, who were associated with intensification strategies, practiced conventional agriculture. All of these farmers used more than 2000 m3 ha−1 to irrigate and were highly attached to their production system, which explained why they perceived conversion to organic agriculture as irrelevant, as well as their choice of intensification adaptations. Cluster 3 could not be explained by the structural and cognitive variables tested. Cluster 4 (attend training courses and diversify crops) grouped farms with few labor units and clay-limestone soil. They did not plow, had a high interest in agroecological practices and technologies, and had a moderate attachment to their production system. These farmers grew at least four crops in 2020, which was consistent with their opinion that diversifying crops reduced vulnerability to climate change.

4. Discussion

4.1. Psychological Factors That Influence Opinions about the Adaptation Strategy Criteria

The statistical analysis showed that psychological factors explained some of the differences in farmers’ opinions about the relevance of the adaptation strategy criteria. Regressions revealed that farmers who perceived the risks of climate change as low perceived the criterion “variety resistant to hydric stress” (A11) as relevant to reducing vulnerability to climate change. Since these farmers were not threatened by climate change, they perceived that slight adjustments, such as changing the variety, were sufficient. Conversely, farmers who perceived high risks prioritized larger adaptations, such as changing the crop pattern. He et al. [57] demonstrated that risk cognition (i.e., individual perception of risks) has a positive influence on adaptive behavior toward climate change. Willaume et al. [58] also related farmers’ perceptions of climate change to the type of adaptations they implemented; regarding the “efficiency–substitution–redesign” transition model, farmers with low risk perception tended to choose “substitution” strategies.
Gbetibouo et al. [39] highlighted that farmers’ perceptions of climate change are partly influenced by their access to information. Several studies highlighted the importance of cognition, such as the implementation of information [36,38]. Farmers’ involvement in a social network would improve adaptive capacity [59]. However, our results indicated that the variable “favorite information source” was not a factor that influenced farmers’ opinions about adaptation strategies.
The regressions also highlighted that farmers with high interest in agroecological practices did not perceive “irrigate winter crops” as a relevant adaptation. These farmers may prioritize the conservation of resources, which is a fundamental principle of agroecology. Overall, “interest in agroecology” and commitment to change are determinants of adaptive capacity [35]. Farmers with low interest in agroecology and technology, and with very high risk aversion, tended to perceive slight adjustments as relevant for reducing vulnerability to climate change. Similarly, farmers who practiced conventional agriculture and were highly attached to their production system prioritized intensification adaptations. Conversely, farmers with a high interest in agroecology and technology, and a moderate attachment to their production system, were more likely to perceive innovative agroecological adaptations as relevant to reduce vulnerability to climate change. This confirms that perceptions of innovation (either agroecological practices or technology) [60], attachment to place [35] and resistance to change [60] are key factors that influence the adoption of strategies. Based on our results, high risk aversion seemed to be associated with slight adjustments. Indeed, high risk aversion is a barrier to adaptive behavior [61,62]. Other studies have demonstrated the influence of risk aversion on adaptive behavior [60,63].
Our results confirm that farmers’ perceptions influence their adaptive capacity and thus the vulnerability of their farming systems [35]. Adaptation strategies that farmers implement to address climate therefore vary and depend on their cognitive and psychological profiles. Our study could be replicated with a bigger sample in order to confirm our results. Other factors, such as moral concerns (including environmental awareness), intuition and personality [60,64], can also influence the adaptive capacity of farmers and should be considered in future studies to more fully understand farmers’ opinions about the relevance of adaptation strategies.

4.2. An Original Method Based on Combined Approaches

Our approach for assessing farm vulnerability is original, since we based the identification of vulnerability properties on farmers’ expertise, while predefined property approaches are usually based on the literature and/or scientific expertise [28,29]. Thus, our approach was more likely to yield a comprehensive set of indicators that can be managed and adopted easily by farmers and which are appropriate for the farming context. As Wienroth [65] explained in the “let’s RULE” model, an innovation should be reliable, useful and legitimate. Another original aspect of our study is the participative and interdisciplinary approach involving behavioral economics.
Similar to Dessart et al. (2019), who proposed a key theoretical framework for our study, our conceptual framework and the choice of the psychological and cognitive factors investigated do not rely on one specific theoretical framework, but are guided by various theories or models of behavior (such as the theory of planned behavior or the theory of expected utility). Indeed, since there is no unified theory of behavior to date and most theories cover only a certain aspect of decision-making [66], our approach allowed us to gather the different behavioral factors that are fundamental to explaining decision-making and, more specifically, the adoption of coping strategies.
One strength of our survey was its combination of qualitative and quantitative approaches, for which we developed original methods to render the concept of vulnerability operational. In the qualitative stage of the survey, criteria were elicited using climate scenarios and a board that represented major components of a farm (e.g., water resources, the farmer’s network, equipment). In the quantitative stage of the survey, using cards to represent criteria made the interview playful and interesting for the farmers interviewed.
For the statistical analysis, using a variety of statistical models (i.e., regression trees, logistic regression and classification) enabled us to obtain robust and complementary results. The regression trees were able to consider non-additive effects, combined effects and interactions [6,67] by sequentially dividing responses according to the most relevant explanatory variabale (i.e., by minimizing the locally explained variance). In comparison, the logistic regressions isolated the effects of each variable [68]. The classification provided results that were complementary to those of the regressions and thus improved the understanding of farmers’ opinions about adaptation strategy criteria.
The novelty of this study regarding our results is that we highlighted the important role of the psychological and cognitive profiles of maize growers in their choice of adaptation strategies to address climate change.
The main disadvantage of our study was the small sample size of the quantitative survey (32 farmers). Although the sample was representative of the region, our results cannot be considered general. However, our goal was to test the genericity of adaptation strategy criteria within a group of farmers and not to describe farmers’ opinions about the adaptation strategy criteria in the region. We successfully met this goal, since we demonstrated farmers’ differing opinions about the adaptation strategy criteria and identified explanatory variables.

4.3. The Need to Reconsider Advising and Support Strategies for Farmers

Our results showed that farmers use different adaptation strategy criteria to assess farm vulnerability. Similar to Jones et al. [44], who demonstrated that resilience is not the same for everyone, we determined that vulnerability is also not the same for everyone. Our quantitative focus on adaptations demonstrates that relevant options depend strongly on individual choice, which indicates the need to challenge the genericity of commonly accepted adaptation strategies in the literature. They are presented as universal, but few studies have focused on the conditions of the success or failure of these adaptations in farming systems [10,69]. Misusing adaptations can negatively impact farming systems [16]. Our results indicate that farmers perceive that certain adaptations might increase the vulnerability of their farms. In this case, several studies mention “maladaptations” [10,69,70,71,72,73], which occur when adaptation decisions are made using inaccurate assumptions or failing to consider the potential negative external effects of adaptations (e.g., the degradation of biodiversity, increase in emissions, new or higher costs that farmers did not consider) [74]. This indicates the need to reconsider advising and support strategies for farmers, since public policies and advisor support are often allocated and applied the same way within a region. More individual advising could ensure that farmers adopt adaptation strategies better, as long as farmers’ perceptions are considered when developing the recommendations. To this end, discussions with farmers about the vulnerability of their farms are essential before recommending any adaptation strategy. Based on our results, the adoption of agroecological practices is influenced by farmers’ interest in agroecology and perception of the risks of climate change. Therefore, agricultural advising and public policies could improve access to information through specific awareness and training campaigns to increase the adoption of agroecological practices.

4.4. From Theoretical Results to More Operational Aspects

Various actions could be performed in order to enhance agroecological transition among the maize farming systems in southwestern France. Regarding agricultural advising, there is a need for individual support and groups of discussions and trainings in order to help farmers improve their knowledge on adaptation strategies. Small groups of farmers could be initiated by institutes and private companies advising farmers. A material support for discussion could be a serious game on adaptation strategies and their effects on farms’ vulnerability to climate change. Simulated tests of adaptation strategies in virtual conditions could help farmers make decision to adopt specific adaptations and be aware of issues they could face. Farmers’ networks that share values and stakes, and which are specifically dedicated to climate adaptation and managed by the Agriculture Chamber, could be created, as it was in the context of pesticide use, with the Defi Zero Phyto network. These networks could offer workshops and visits on farms in order to share experiences and show agroecological innovations. On-farm experiments could be carried out via collaborations between research institutes and farmers, in order to obtain both viewpoints regarding the relevance of the tested adaptations. Finally, public policies could enhance the agroecological transition by allocating subsidies for farmers who wish to implement agroecological innovations (such as subsidies to buy cover crop seeds or a direct seeder).

4.5. Toward an Assessment Method That Includes the Adaptive Capacity of Farmers

In the context of a vulnerability assessment, the dimension of adaptive capacity regarding farmers’ internal resources (i.e., psychological and cognitive) requires a specific focus, whereas existing assessment methods often ignore this aspect of vulnerability. One issue is to consider the diversity of farmers’ perceptions when developing a tool based on indicators, since farmers who have the same farming system characteristics will not implement the same strategies if their perceptions differ. Our study showed that assessments of adaptive capacity should include criteria and indicators related to psychological factors such as the perception of the risks of climate change, attachment to the production system and interest in agroecological practices. Farmers’ opinions need to be compared to objective viewpoints when considering the relevance of adaptation strategies to reduce vulnerability to climate change. Farmers’ opinions about adaptation strategy criteria might not agree with scientists’ viewpoints due to differences in knowledge, experience and perceptions. This subjective approach for assessing adaptation strategies should be supplemented by consulting the literature and scientific experts to create a typology of relevant adaptations depending on the farming system. Combined with a method for assessing vulnerability, this typology would help advisors provide farmers with effective adaptations, which would result in the development of resilient farming systems. The criteria identified in our qualitative survey related to sensitivity and exposure should also be compared to scientific knowledge to design a multicriteria method for assessing vulnerability to climate change.

5. Conclusions

Our study rendered the concept of vulnerability operational by comprehensively identifying its determinants. We developed a conceptual framework that combines the DPSIR model and the concept of vulnerability defined by the IPCC. We identified criteria that farmers use to assess the vulnerability of their farming systems. The criteria of adaptation strategies are diverse and differ among farmers. The statistical analysis using complementary methods showed that farmers’ opinions about adaptation strategies are influenced by structural factors (e.g., soil structure), the characteristics of the farmer (e.g., age), the cropping system (e.g., number of crops), as well as cognitive and psychological factors such as risk aversion, attachment to the production system and the perceptions of the risks of climate change. Our study highlighted that farmers’ opinions of adaptation strategies are not general, even within the same region. This implies that agricultural advising should be more individualized. The results confirmed our hypothesis that farmers’ cognitive and psychological resources influence their adaptive capacity. The relevance of adaptations does not only depend on agronomic or economic performance, but also on farmers’ perceptions. Therefore, futures studies dealing with the performance assessment of adaptations should include indicators regarding the level of congruence with farmers’ psychological and cognitive profiles. Finally, our study helped to understand farmers’ perceptions of the vulnerability assessment, which is the initial step in designing a method to assess the vulnerability of maize farming systems to climate change. Future studies should compare farmers’ perceptions of adaptation strategies, sensitivity and exposure criteria to scientific expertise in order to develop a set of indicators.

Author Contributions

Conceptualization and methodology, M.A., S.C., J.-E.B. and M.W.; writing—original draft preparation, M.A., S.C. and J.-E.B.; investigation, M.A.; formal analysis, M.A.; writing—review and editing, M.A., S.C., J.-E.B. and M.W.; funding acquisition, M.W. All authors have read and agreed to the published version of the manuscript.

Funding

This research was funded by INRAE as part of the VACCARM project of the ACCAF metaprogram, project under S2I 00000285, MP-P10182.

Informed Consent Statement

Informed consent to participate and publish was obtained from each participant in the study.

Data Availability Statement

Survey instruments and codes used in this study are available from the authors upon request.

Acknowledgments

The authors thank Hélène Raynal, who helped design the statistical analysis, and the trainees who helped collect data. The authors also thank the English proofreading reviewers.

Conflicts of Interest

The authors declare no conflict of interest. The funders had no role in the design of the study; in the collection, analysis or interpretation of data; in the writing of the manuscript; or in the decision to publish the results.

Appendix A

The data were cleaned in four major steps (Figure A1). We removed (i) 56 explanatory variables with low heterogeneity (e.g., sex), (ii) 46 explanatory variables that were poorly understood or confusing during the interviews and (iii) 10 strongly correlated variables. In the last step, we sorted the 46 remaining explanatory variables into the eight categories that were previously identified (i.e., general information, water resources, soil resources, human resources, financial resources, crops and rotation, material resources, individual resources) and selected no more than four variables per category to keep those that were the most general. This final step left 25 explanatory variables for the 32 farmers and 41 explained variables.
Figure A1. Diagram of the data cleaning procedure.
Sustainability 14 08275 g0a1

Appendix B

Description of the 25 explanatory variables.
Table A1. Structural and material variables in the questionnaire.
CategoryVariableValues
General informationUtilized agricultural areaSmall_farm (<100 ha); medium_farm (100–200 ha); large_farm (200–300 ha); very_large_farm (>300 ha)
Production systemAll conventional; Organic
Human resourcesLabor units (LU)1_LU; 2_LU; 3_and_more
Individual resourcesEducationCAP_BEP; Bachelor; Engineer_Masters; Education_Other
Age<35; 35–50; >50
Water resourcesType of water sourceWatercourse; Lake; Well; Watercourse_lake; Watercourse_lake_well
Volume for maize irrigation in 2020<2000 m3; 2000–3000 m3; >3000 m3
Irrigable areaAll_irrigable; Fields_non_Irrigable
Equipment resourcesNumber of pivots on the farm0_pivot; 1_3 Pivots; >3Pivots
Volume of grain storageNone; <1000 T; 1000–2000 T; >2000 T
Soil resourcesSoil typeAC (Clay-limestone); AL (Clay-loam); SL (Sandy loam); B (Boulbènes); Others
Financial resourcesNumber of paid activities1; 2; 3
Percentage of revenue from maize in 2020<15%; 15–30%; 30–50%; >50%
Crops and rotationDistance between fields<1 km; 1–5 km; 6–14 km; >14 km
Number of crops in 20201–3; 4–6; >6
Soil tillage for maizeDeep tillage with inversion; Deep tillage without inversion; Reduced tillage (including no tillage)
Precocity index for maizeIP_Early (<400); IP_Late (>400); IP_Unknown

Appendix C

Table A2. Number of times each of the 50 adaptation criteria elicited in the qualitative survey was mentioned. Total number of mentions: 170.
CriterionNumber of Mentions
Increase water storage13
Diversify water sources13
Irrigate winter crops13
Plant cover crops12
Stop plowing11
Use sensors10
Use a weather station7
Extend the rotation6
Advance the sowing date for maize6
Diversify paid activities6
Self-sufficiency in water5
Reduce the precocity for maize5
Diversify crops4
Partner with a livestock farmer to obtain manure4
Buy new land3
Buy more irrigation quota3
Diversify production3
Balance winter and summer crops3
Reduce soil tillage3
Buy new seeding equipment2
Convert to organic agriculture2
Practice mechanical weeding2
Increase irrigation efficiency2
Hire an employee2
Use modulation2
Shorten water turns2
Return harvest residues to the soil2
Modify the irrigation strategy2
Improve grain storage1
Reduce the frequency of field operations1
Stop growing maize1
Plant mixed crops1
Increase grain storage1
Advance the date of the first irrigation1
Lime the soil1
Bury reels for irrigation1
Scaring practices for wells1
Practice green tillage1
Join a group of employers1
Plant legume crops1
Use decision-support tools1
Use a decision-support tool for irrigation1
Partner with a beekeeper1
Introduce a livestock production unit1
Practice sylviculture1
Use a specific modulation for fertilizer1
Use a tall maize variety1
Use a maize variety resistant to hydric stress 1
Practice direct selling1
Sell stored maize before summer1

Appendix D

Table A3. The 41 selected adaptation strategy criteria for the quantitative stage of the survey.
Crop pattern and rotationExtend the rotationA1
Plant mixed cropsA2
Plant cover cropsA3
Diversify cropsA4
Balance winter and summer cropsA5
Plant legumesA6
Maize cultivationStop maize cultivationA7
Advance the sowing date for maizeA8
Reduce the precocity for maizeA9
Use a tall maize varietyA10
Use a maize variety resistant to hydric stressA11
Farm scale strategyImprove grain storage and commercializationA12
Diversify commercialization modesA13
Introduce a livestock production unitA14
Make a partnership with a neighboring farmerA15
Diversify production units and/or paid activitiesA16
Buy new landsA17
Hire an employeeA18
Convert to organic farmingA19
Buy new equipmentA20
Cultural practicesReduce the frequency of field operationsA21
Stop plowingA22
Lime the soilA23
Perform mechanical weedingA24
Practice direct seedingA25
Practice strip-tillageA26
Return harvest residues to the soilA27
Use modulation for inputs A28
Water resourceBuy more quota for irrigationA29
Improve/renew equipment for irrigationA30
Build or enlarge a reservoirA31
Advance the date of the first irrigation for maizeA32
Diversify water sourcesA33
Increase irrigation efficiencyA34
Irrigate winter cropsA35
Modify the frequency and/or number of water turnsA36
Sources of informationUse decision-support toolsA37
Use sensorsA38
Use a weather stationA39
Attend training coursesA40
Confront sources of informationA41

Appendix E

Table A4. Distribution of criteria within each of the four clusters identified by hierarchical clustering on principal components. See Table 3 in the article for definitions of the criteria codes.
ClusterCriteriaCla/ModMod/ClaGlobalp ValueV Test
1A36 relevant
A5 relevant
50
50
100
100
12.90323
12.90323
0.01290323
0.01290323
2.486429
2.486429
2A32 relevant
A31 relevant
A24 irrelevant
A19 irrelevant
83.33333
100.00000
100.00000
58.33333
45.45455
27.27273
36.36364
63.63636
19.354839
9.677419
12.903226
38.709677
0.0138045121
0.0367074527
0.0104878436
0.0485031501
2.462310
2.089003
2.559316
1.972933
3A32 irrelevant
A16 relevant
A17 irrelevant
100.00000
100.00000
76.92308
57.14286
28.57143
71.42857
25.80645
12.90323
41.93548
0.0003806699
0.0318131257
0.0037953858
3.553134
2.146751
2.894685
4A41 relevant
A4 relevant
A23 irrelevant
75.000000
60.000000
100.000000
75
75
50
12.903226
16.129032
6.451613
0.003495948
0.008580963
0.012903226
2.920389
2.628313
2.486429
Cla/mod: percentage of individuals with the modality inside the class (or cluster). Mod/cla: percentage of individuals of the class (or cluster) with the modality.

References

  1. IPCC Climate Change 2021: The Physical Science Basis; Contribution of Working Group I to the Sixth Assessment Report of the Intergovernmental Panel on Climate Change; Cambridge University Press: Cambridge, MA, USA, 2021.
  2. Chaouche, K.; Neppel, L.; Dieulin, C.; Pujol, N.; Ladouche, B.; Martin, E.; Salas, D.; Caballero, Y. Analyses of precipitation, temperature and evapotranspiration in a French Mediterranean region in the context of climate change. Comptes Rendus Geosci. 2010, 342, 234–243. [Google Scholar] [CrossRef]
  3. Olesen, J.E.; Trnka, M.; Kersebaum, K.C.; Skjelvåg, A.O.; Seguin, B.; Peltonen-Sainio, P.; Rossi, F.; Kozyra, J.; Micale, F. Impacts and adaptation of European crop production systems to climate change. Eur. J. Agron. 2011, 34, 96–112. [Google Scholar] [CrossRef]
  4. Peters, K.; Breitsameter, L.; Gerowitt, B. Impact of climate change on weeds in agriculture: A review. Agron. Sustain. Dev. 2014, 34, 707–721. [Google Scholar] [CrossRef] [Green Version]
  5. Zhang, J.T.; Yang, J.; An, P.L.; Ren, W.; Pan, Z.H.; Dong, Z.Q.; Han, G.L.; Pan, Y.Y.; Pan, S.F.; Tian, H.Q. Enhancing soil drought induced by climate change and agricultural practices: Observational and experimental evidence from the semiarid area of northern China. Agric. For. Meteorol. 2017, 243, 74–83. [Google Scholar] [CrossRef]
  6. Praveen, B.; Sharma, P. A review of literature on climate change and its impacts on agriculture productivity. J. Public Aff. 2019, 21, e2483. [Google Scholar] [CrossRef]
  7. Senthilkumar, K.; Bergez, J.E.; Leenhardt, D. Can farmers use maize earliness choice and sowing dates to cope with future water scarcity? A modelling approach applied to south-western France. Agric. Water Manag. 2015, 152, 125–134. [Google Scholar] [CrossRef]
  8. Caubel, J.; Garcia de Cortazar-Atauri, I.; Vivant, A.C.; Launay, M.; de Noblet-Ducoudré, N. Assessing future meteorological stresses for grain maize in France. Agric. Syst. 2018, 159, 237–247. [Google Scholar] [CrossRef]
  9. Howden, S.M.; Soussana, J.F.; Tubiello, F.N.; Chhetri, N.; Dunlop, M.; Meinke, H. Adapting agriculture to climate change. Proc. Natl. Acad. Sci. USA 2007, 104, 19691–19696. [Google Scholar] [CrossRef] [Green Version]
  10. Juhola, S.; Glaas, E.; Linnér, B.-O.; Neset, T.-S.S. Redefining maladaptation. Environ. Sci. Policy 2016, 55, 135–140. [Google Scholar] [CrossRef] [Green Version]
  11. Bindi, M.; Olesen, J.E. The responses of agriculture in Europe to climate change. Reg. Environ. Chang. 2011, 11, 151–158. [Google Scholar] [CrossRef]
  12. Cammarano, D.; Payero, J.; Basso, B.; Stefanova, L.; Grace, P. Adapting wheat sowing dates to projected climate change in the Australian subtropics: Analysis of crop water use and yield. Crop Pasture Sci. 2012, 63, 974–986. [Google Scholar] [CrossRef] [Green Version]
  13. Moradi, R.; Koocheki, A.; Nassiri Mahallati, M.; Mansoori, H. Adaptation strategies for maize cultivation under climate change in Iran: Irrigation and planting date management. Mitig. Adapt. Strateg. Glob. Chang. 2013, 18, 265–284. [Google Scholar] [CrossRef]
  14. Brunel-Saldias, N.; Martinez, I.; Seguel, O.; Ovalle, C.; Acevedo, E. Structural characterization of a compacted alfisol under different tillage systems. J. Soil Sci. Plant Nutr. 2016, 16, 689–701. [Google Scholar] [CrossRef] [Green Version]
  15. Holzkämper, A. Varietal adaptations matter for agricultural water use—A simulation study on grain maize in Western Switzerland. Agric. Water Manag. 2020, 237, 106202. [Google Scholar] [CrossRef]
  16. Barnett, J.; O’Neill, S. Maladaptation. Glob. Environ. Chang. 2010, 20, 211–213. [Google Scholar] [CrossRef]
  17. IPCC Climate Change 2007: Impacts, Adaptations and Vulnerability; Contribution of Working Group II to the Fourth Assessment Report of the Intergovernmental Panel on Climate Change; Cambridge University Press: Cambridge, UK, 2007; ISBN 9780521880107.
  18. Füssel, H.M.; Klein, R.J.T. Climate change vulnerability assessments: An evolution of conceptual thinking. Clim. Chang. 2006, 75, 301–329. [Google Scholar] [CrossRef]
  19. Darnhofer, I.; Bellon, S.; Dedieu, B.; Milestad, R. Adaptiveness to enhance the sustainability of farming systems. A review. Agron. Sustain. Dev. 2010, 30, 545–555. [Google Scholar] [CrossRef] [Green Version]
  20. Martin, G.; Magne, M.-A.; Cristobal, M.S. An Integrated Method to Analyze Farm Vulnerability to Climatic and Economic Variability According to Farm Configurations and Farmers’ Adaptations. Front. Plant Sci. 2017, 8, 1483. [Google Scholar] [CrossRef] [Green Version]
  21. Sneessens, I.; Randrianasolo, H.; Sauvee, L.; Ingrand, S. A quantitative approach to assess farming systems vulnerability: An application to mixed crop-livestock systems. In Proceedings of the 11th Research Seminar on Social Science, Lyon, France, 14–15 December 2017; pp. 1–20. [Google Scholar]
  22. Dardonville, M.; Bockstaller, C.; Therond, O. Review of quantitative evaluations of the resilience, vulnerability, robustness and adaptive capacity of temperate agricultural systems. J. Clean. Prod. 2021, 286, 125456. [Google Scholar] [CrossRef]
  23. Andrés Ferreyra, R.; Podestá, G.P.; Messina, C.D.; Letson, D.; Dardanelli, J.; Guevara, E.; Meira, S. A linked-modeling framework to estimate maize production risk associated with ENSO-related climate variability in Argentina. Agric. For. Meteorol. 2001, 107, 177–192. [Google Scholar] [CrossRef]
  24. Barkaoui, K.; Roumet, C.; Volaire, F. Mean root trait more than root trait diversity determines drought resilience in native and cultivated Mediterranean grass mixtures. Agric. Ecosyst. Environ. 2016, 231, 122–132. [Google Scholar] [CrossRef]
  25. Biggs, R.; Schlüter, M.; Biggs, D.; Bohensky, E.L.; Burnsilver, S.; Cundill, G.; Dakos, V.; Daw, T.M.; Evans, L.S.; Kotschy, K.; et al. Toward principles for enhancing the resilience of ecosystem services. Annu. Rev. Environ. Resour. 2012, 37, 421–448. [Google Scholar] [CrossRef] [Green Version]
  26. Cabell, J.F.; Oelofse, M. An Indicator Framework for Assessing Agroecosystem Resilience. Ecol. Soc. 2012, 17, 18. [Google Scholar] [CrossRef]
  27. Wiréhn, L.; Danielsson, Å.; Neset, T.S.S. Assessment of composite index methods for agricultural vulnerability to climate change. J. Environ. Manag. 2015, 156, 70–80. [Google Scholar] [CrossRef]
  28. Urruty, N.; Tailliez-Lefebvre, D.; Huyghe, C. Stability, robustness, vulnerability and resilience of agricultural systems. A review. Agron. Sustain. Dev. 2016, 36, 1–15. [Google Scholar] [CrossRef] [Green Version]
  29. Dardonville, M.; Urruty, N.; Bockstaller, C.; Therond, O. Influence of diversity and intensification level on vulnerability, resilience and robustness of agricultural systems. Agric. Syst. 2020, 184, 102913. [Google Scholar] [CrossRef]
  30. Reidsma, P.; Ewert, F.; Lansink, A.O.; Leemans, R. Adaptation to climate change and climate variability in European agriculture: The importance of farm level responses. Eur. J. Agron. 2010, 32, 91–102. [Google Scholar] [CrossRef]
  31. Dong, Z.; Pan, Z.; An, P.; Wang, L.; Zhang, J.; He, D.; Han, H.; Pan, X. A novel method for quantitatively evaluating agricultural vulnerability to climate change. Ecol. Indic. 2015, 48, 49–54. [Google Scholar] [CrossRef]
  32. Nicholas, K.A.; Durham, W.H. Farm-scale adaptation and vulnerability to environmental stresses: Insights from winegrowing in Northern California. Global Environ. Chang. 2012, 22, 483–494. [Google Scholar] [CrossRef]
  33. Gil, J.; Cohn, A.S.; Duncan, J.; Newton, P.; Vermeulen, S. The resilience of integrated agricultural systems to climate change. WIREs Clim. Chang. 2017, 8, e461. [Google Scholar] [CrossRef]
  34. Bouttes, M.; San Cristobal, M.; Martin, G. Vulnerability to climatic and economic variability is mainly driven by farmers’ practices on French organic dairy farms. Eur. J. Agron. 2018, 94, 89–97. [Google Scholar] [CrossRef]
  35. Marshall, N.A.; Stokes, C.J.; Webb, N.P.; Marshall, P.A.; Lankester, A.J. Social vulnerability to climate change in primary producers: A typology approach. Agric. Ecosyst. Environ. 2014, 186, 86–93. [Google Scholar] [CrossRef]
  36. Acosta-Michlik, L.; Rounsevell, M.D.A. From Generic Indices to Adaptive Agents: Shifting Foci in Assessing Vulnerability to the Combined Impacts of Climate Change and Globalization. IHDP Update 2005, 14–16. [Google Scholar]
  37. Acosta-Michlik, L.; Espaldon, V. Assessing vulnerability of selected farming communities in the Philippines based on a behavioural model of agent’s adaptation to global environmental change. Glob. Environ. Chang. 2008, 18, 554–563. [Google Scholar] [CrossRef]
  38. Callo-Concha, D.; Ewert, F. Using the Concepts of Resilience, Vulnerability and Adaptability for the Assessment and Analysis of Agricultural Systems. Chang. Adapt. Socio-Ecol. Syst. 2014, 1, 1–11. [Google Scholar] [CrossRef] [Green Version]
  39. Gbetibouo, G. Understanding Farmers’ Perceptions and Adaptations to Climate Change and Variability; International Food Policy Research Institute Internship: Washington, DC, USA, 2009. [Google Scholar]
  40. Marshall, N.A.; Park, S.E.; Adger, W.N.; Brown, K.; Howden, S.M. Transformational capacity and the influence of place and identity. Environ. Res. Lett. 2012, 7, 034022. [Google Scholar] [CrossRef] [Green Version]
  41. Baca, M.; Läderach, P.; Haggar, J.; Schroth, G.; Ovalle, O. An integrated framework for assessing vulnerability to climate change and developing adaptation strategies for coffee growing families in mesoamerica. PLoS ONE 2014, 9, e88463. [Google Scholar] [CrossRef] [Green Version]
  42. Comoé, H.; Finger, R.; Barjolle, D. Farm management decision and response to climate variability and change in Côte d’Ivoire. Mitig. Adapt. Strateg. Glob. Chang. 2014, 19, 123–142. [Google Scholar] [CrossRef]
  43. Saha, M.K.; Abdul, A.; Biswas, A.; Meandad, J.; Ahmed, R.; Prokash, J.; Sakib, F.M. Factors Affecting to Adoption of Climate-smart Agriculture Practices by Coastal Farmers’ in Bangladesh. Am. J. Environ. Sustain. Dev. 2019, 4, 113–121. [Google Scholar]
  44. Jones, L. Resilience isn’t the same for all: Comparing subjective and objective approaches to resilience measurement. Wiley Interdiscip. Rev. Clim. Chang. 2019, 10, e552. [Google Scholar] [CrossRef] [Green Version]
  45. Perrin, A.; Cristobal, M.S.; Milestad, R.; Martin, G. Identification of resilience factors of organic dairy cattle farms. Agric. Syst. 2020, 183, 102875. [Google Scholar] [CrossRef]
  46. Binder, C.R.; Feola, G.; Steinberger, J.K. Considering the normative, systemic and procedural dimensions in indicator-based sustainability assessments in agriculture. Environ. Impact Assess. Rev. 2010, 30, 71–81. [Google Scholar] [CrossRef]
  47. Smeets, E.; Weterings, R.; Centre, T.N.O.; Bosch, P.; Büchele, M.; Gee, D. Environmental Indicators: Typology and Overview. Technical Report N°25; European Environment Agency: Copenhagen, Denmark, 1999. [Google Scholar]
  48. Lairez, J.; Feschet, P.; Aubin, J.; Bockstaller, C.; Bouvarel, I. Agriculture et Développement Durable: Guide Pour L’évaluation Multicritère. Available online: https://books.google.fr/books?hl=fr&lr=&id=RpxmCwAAQBAJ&oi=fnd&pg=PA7&dq=guide+d%27évaluation+multicritère+définition+critère&ots=-0hN6CaMtX&sig=-askjH7E1gpT3Ra3xwOkhm0say4#v=onepage&q=critère&f=false (accessed on 10 May 2021).
  49. DRAAF. Analyse Économique des Exploitations Agricoles Irriguant du Maïs Grain; DRAAF: Marseille, France, 2017; Volume 2014. [Google Scholar]
  50. DRAAF. Occitanie Bilan 2020 Grandes Cultures; DRAAF: Marseille, France, 2020. [Google Scholar]
  51. Lopez, O.; Milhaud, X.; Thérond, P. Arbres de régression et de classification (CART). L’actuariel 2015, 15, 42–44. [Google Scholar]
  52. R Core Team. R: The R Project for Statistical Computing. Available online: https://www.r-project.org/ (accessed on 10 August 2020).
  53. Husson, A.F.; Josse, J.; Le, S.; Mazet, J.; Husson, M.F. Package ‘FactoMineR’. Available online: http://factominer.free.fr (accessed on 10 August 2020).
  54. Therneau, T.M.; Atkinson, E.J. An Introduction to Recursive Partitioning Using the RPART Routines; Mayo Foundation: Rochester, MI, USA, 2022. [Google Scholar]
  55. Milborrow, A.S. Package ‘rpart.plot’. Available online: http://www.milbo.org/rpart-plot/index.html (accessed on 10 August 2021).
  56. Croissant, Y. Mlogit: Random utility models in r. J. Stat. Softw. 2020, 95, 1–41. [Google Scholar] [CrossRef]
  57. DRAAF. Occitanie L’irrigation Contribue à 18% de la Valeur de la Production Agricole; DRAAF: Marseille, France, 2018. [Google Scholar]
  58. He, R.; Jin, J.; Kuang, F.; Zhang, C.; Guan, T. Farmers’ risk cognition, risk preferences and climate change adaptive behavior: A structural equation modeling approach. Int. J. Environ. Res. Public Health 2020, 17, 85. [Google Scholar] [CrossRef] [Green Version]
  59. Willaume, M.; Rollin, A.; Casagrande, M. Farmers in southwestern France think that their arable cropping systems are already adapted to face climate change. Reg. Environ. Chang. 2014, 14, 333–345. [Google Scholar] [CrossRef]
  60. Martin-Clouaire, R. Modelling Operational Decision-Making in Agriculture. Agric. Sci. 2017, 8, 527–544. [Google Scholar] [CrossRef] [Green Version]
  61. Dessart, F.J.; Barreiro-Hurlé, J.; Van Bavel, R. Behavioural factors affecting the adoption of sustainable farming practices: A policy-oriented review. Eur. Rev. Agric. Econ. 2019, 46, 417–471. [Google Scholar] [CrossRef] [Green Version]
  62. Roussy, C.; Ridier, A.; Chaib, K. Adoption d’innovations par les agriculteurs: Rôle des perceptions et des préférences. Work. Pap. SMART—LERECO 2015, 15–03, 1–22. [Google Scholar]
  63. Albert, M.; Couture, S.; Willaume, M.; Bergez, J.É.; Faivre, R. Decision-Making Process Factors Explain Some of the Heterogeneity of Irrigation Practices among Maize Farmers in Southwestern France. Water 2021, 13, 3504. [Google Scholar] [CrossRef]
  64. Reynaud, A.; Couture, S. Stability of risk preference measures: Results from a field experiment on French farmers. Theory Decis. 2012, 73, 203–221. [Google Scholar] [CrossRef] [Green Version]
  65. Nuthall, P.L.; Old, K.M. Intuition, the farmers’ primary decision process. A review and analysis. J. Rural. Stud. 2018, 58, 28–38. [Google Scholar] [CrossRef]
  66. Wienroth, M. Value beyond scientific validity: Let’s RULE (Reliability, Utility, LEgitimacy). J. Responsible Innov. 2020, 7, 92–103. [Google Scholar] [CrossRef]
  67. Schlüter, M.; Baeza, A.; Dressler, G.; Frank, K.; Groeneveld, J.; Jager, W.; Janssen, M.A.; McAllister, R.R.J.; Müller, B.; Orach, K.; et al. A framework for mapping and comparing behavioural theories in models of social-ecological systems. Ecol. Econ. 2017, 131, 21–35. [Google Scholar] [CrossRef]
  68. Breiman, L.; Friedman, J.; Olshen, R.; Group, C.S.-I. Classification and Regression Trees; Wadsworth: Belmont, CA, USA, 1984. [Google Scholar]
  69. Larmarange, J. Régression Logistique Binaire, Multinomiale et Ordinale. Available online: https://larmarange.github.io/analyse-R/analyse-R.pdf (accessed on 10 May 2021).
  70. Neset, T.-S.; Juhola, S.; Wiréhn, L.; Käyhkö, J.; Navarra, C.; Asplund, T.; Glaas, E.; Wibeck, V.; Linnér, B.-O. Supporting Dialogue and Analysis on Trade-Offs in Climate Adaptation Research With the Maladaptation Game. Simul. Gaming 2020, 51, 378–399. [Google Scholar] [CrossRef] [Green Version]
  71. Rickards, L.; Howden, S.M. Transformational adaptation: Agriculture and climate change. Crop Pasture Sci. 2012, 63, 240–250. [Google Scholar] [CrossRef]
  72. Magnan, A.K.; Schipper, E.L.F.; Burkett, M.; Bharwani, S.; Burton, I.; Eriksen, S.; Gemenne, F.; Schaar, J.; Ziervogel, G. Addressing the risk of maladaptation to climate change. Wiley Interdiscip. Rev. Clim. Chang. 2016, 7, 646–665. [Google Scholar] [CrossRef]
  73. Holzkämper, A. Adapting agricultural production systems to climate change—What’s the use of models? Agriculture 2017, 7, 86. [Google Scholar] [CrossRef] [Green Version]
  74. Wiréhn, L. Nordic agriculture under climate change: A systematic review of challenges, opportunities and adaptation strategies for crop production. Land Use Policy 2018, 77, 63–74. [Google Scholar] [CrossRef]
Figure 1. Conceptual framework for assessing vulnerability that combines the Drivers (D)–Pressures (P)–State (S)–Impacts (I)–Responses (R) model and the concept of vulnerability.
Sustainability 14 08275 g001
Figure 2. Location of the farms of the maize growers interviewed during the first, qualitative stage (initial surveys) (blue) and the second, quantitative stage (deeper surveys) (orange). Map data: 2020, Google.
Sustainability 14 08275 g002
Figure 3. The board used in the qualitative survey that represented the components of a farm.
Sustainability 14 08275 g003
Figure 5. Statistical analysis of the quantitative survey.
Sustainability 14 08275 g005
Figure 6. Distribution of the criteria in the conceptual framework.
Sustainability 14 08275 g006
Figure 7. Classification of adaptation strategy criteria according to farmers’ opinions. Numbers refer to the 41 adaptation strategy criteria (Appendix D).
Sustainability 14 08275 g007
Table 1. Characteristics of the qualitative and quantitative stages of the survey.
Qualitative StageQuantitative Stage
ObjectiveElicit criteria for assessing vulnerabilityTest the genericity of the adaptation strategy criteria and explain farmers’ opinions
ParticipantsExpert farmers (13)Farmers representative of the Occitanie region (32)
Survey methodSemi-structured interviews on the farmSemi-structured interviews on the farm
MaterialsPoster/board representing farm resources; climate graphsCards for adaptation strategy criteria
Conceptual framework dimensionsAll dimensions (i.e., exposure, sensitivity and adaptive capacity)Adaptive capacity
Analysis methodMonography; expert classificationData cleaning; statistical analysis (regressions, clustering)
Table 2. Cognitive and psychological variables and the associated elicitation technique in the questionnaire.
Cognitive and Psychological FactorsVariablesElicitation Technique in the QuestionnaireResponses Analyzed
Perceptions of climate changeThreat of climate changeDichotomous question Yes or no
Level of climate change pressureMultiple-choice questionLow, medium or high
Agroecological practicesDegree of interest in agroecological practicesSelf-assessment: score from 1–10 (high interest)Low (1–3), medium (4–6) or high (7–10)
Resistance to changeDegree of attachment to the production systemSelf-assessment: score from 1–10 (high interest)Low (1–3), medium (4–6) or high (7–10)
InnovationsDegree of interest in technologySelf-assessment: score from 1–10 (high interest)Low (1–3), medium (4–6) or high (7–10)
ReactivityDegree of planningSelf-assessment: score from 1–10 (high planning)Low (1–3), medium (4–6) or high (7–10)
AssistanceFavorite information sourceMultiple-choice questionAdvisors, farmers, technology or laboratory
Risk aversionDegree of risk aversionLottery gameHigh (1–3), medium (4–6) or low (7–10)
Table 3. Results of regression trees and logistic regressions, with detailed results from logistic regressions. *** p < 0.001; ** p < 0.05; * p < 0.1.
CriterionAssessed RelevanceFirst Explanatory Variable in the Regression TreeLogistic Regression Results
DirectionSignificance
A11: variety resistant to hydric stressRelevantPerceptions of climate change risks: low+0.0368 **
A27: return harvest residues to the soilRelevantSilty clay soil+0.0292 **
A29: buy more irrigation quotaIrrelevant1–3 crops
4–6 crops
(in the rotation)
-
-
0.03279 **
0.00324 ***
A31: build or develop a reservoirIrrelevant“Boulbènes” soil (clayey sand)+0.0184 **
A34: increase irrigation efficiencyRelevantAge > 50
Age 35–50
-
-
0.0207 **
0.0601 *
A35: irrigate winter cropsRelevantInterest in agroecology: high-0.0334 **
Table 4. Distribution of the 20 significant explanatory variables within each cluster. Shaded cells identify variables for which farmers’ opinions differed within a cluster. The variables of age, water source, the precocity of the maize variety, reactivity and sources of information were tested but are not shown because they were non-significant (i.e., different in all clusters).
Cluster 1: Slight AdjustmentsCluster 2: Intensification StrategiesCluster 3: Diversification of ActivitiesCluster 4: Agroecological Innovations
Number of farmers211144
Relevant adaptations to reduce vulnerability to climate changeA5: Balance summer and winter crops; A36: Irrigate winter cropsA30: Renew irrigation equipment; A31: Build or develop a reservoir A16: Diversify paid activities A4: Diversify crops; A40: Attend training courses
Irrelevant adaptations to reduce vulnerability to climate change A19: Convert to organic agriculture; A24: Perform mechanical weedingA17: Buy new land; A32: Build or develop a reservoirA23: Lime the soil
Utilized agricultural area (ha)100–200 (medium size)
Production system Conventional
Labor units (full-time equivalent)1 <2
EducationBachelor’s degree
Volume of water (m3 ha−1) >2000 <3000
Irrigable areaNon-irrigable fields Non-irrigable fields
Soil structure Clay-limestone
Number of pivotsNone
Volume of grain storage (t)<1000
Number of paid activities2
Percentage of revenue from maize 30–50%
Distance between plots (km)>14
Number of crops4–6 ≥4
Soil tillageReduced tillage No plowing
Climate change threatYes Yes
Perception of risks from climate changeMedium to high Medium to high
Interest in agroecologyLow High
Attachment to production system Medium to high Medium
Interest in technologyLow High
Risk aversionVery high
Publisher’s Note: MDPI stays neutral with regard to jurisdictional claims in published maps and institutional affiliations.

