Article

Para Rubber (Hevea brasiliensis) Feedstock for Livelihoods Opportunities in Southern Thailand: Analysis of Socioeconomic Productivity Potentials and Security

by
John Nyandansobi Simon
1,
Narissara Nuthammachot
1,*,
Kuaanan Techato
1,2,
Kingsley Ezechukwu Okpara
1,
Sittiporn Channumsin
3,*,
Rungnapa Kaewthongrach
3 and
Md. Sujahangir Kabir Sarkar
4
1
Faculty of Environmental Management, Prince of Songkla University, Songkhla 90110, Thailand
2
Environmental Assessment and Technology for Hazardous Waste Management Research Center, Prince of Songkla University, Songkhla 90110, Thailand
3
Space Technology Research Center, Geo-Informatics and Space Technology Development Agency (GISTDA), Chonburi 20230, Thailand
4
Department of Economics and Sociology, Patuakhali Science and Technology University, Dukmi 8602, Bangladesh
*
Authors to whom correspondence should be addressed.
Sustainability 2022, 14(16), 10142; https://doi.org/10.3390/su141610142
Submission received: 5 July 2022 / Revised: 8 August 2022 / Accepted: 10 August 2022 / Published: 16 August 2022

Abstract

:
Para rubber feedstock production potential was explored in Hat Yai district. The study focused on the respondent’s socioeconomic status, feedstock production potential, and mapped the relevant actors along the supply chain. Structured questionnaires were administered to 117 respondents chosen through random and purposeful sampling. The descriptive statistics, linear regression models, feedstock potential model, and Simpson’s diversity index were used to analyze the data. The findings showed average ages of 54.4 and 48.4 for farmers and processors respectively, with above 40% literacy. Seventy-six percent of the plantations’ land belongs to the respondents with corresponding average yields of 9.5 tons/yr and 1082.5 logs for latex and parawood as the main products. Farmers and processors had a mean annual para rubber income of USD 6341.35 and 2.55 million USD, respectively. The analysis revealed a significant relationship between plantation size and feedstock supply; the theoretical feedstock potential is 831,630.91 tons and is highly diverse (Simpson’s diversity index of 0.75), indicative of high potential for sustainable production and consumption. The study highlights that low latex prices alone cannot account for the decline in rubber feedstock yield, due to the high cost of new land, the inability of farmers to expand plantations, and four interlinked feedstock supply lines existing in the study area.

1. Introduction

Rubber trees (Hevea brasiliensis) are primarily cultivated for latex production; nonetheless, they also produce timber for industry, and logging residues have been indicated to be used for energy production, coupled with other merchandises. Several plant species are known to produce natural rubber, but due to quality and economic considerations, the best candidate for a source of natural rubber is the rubber tree (Hevea brasiliensis) [1]. Natural rubber production has increased dramatically globally, from 6.8 million metric tons in 2000 to 13.6 million metric tons in 2019. This was because of increased demand [2]. As of 2018, Asia Pacific accounted for 91 percent of global natural rubber output [3], with Southeast Asia leading the way. According to the International Rubber Study Group, Southeast Asia produced 11,183,000 tons of rubber in 2014, compared to a global average of 12,070,000 tons [4]. Since 1993, Thailand has been the world’s leading producer of natural rubber, accounting for 31.5% of global production in 2019. Thailand accounted for 34% of the world’s natural rubber production in 2013, sequel to the “rubber boom” at that time, as occasioned by the increased global demand for non-synthetic rubber which offered good prices that led to increasing expanses of environmentally valuable and protected lands being cleared for rubber plantations indiscriminately. However, in 2019 Thailand was still the world’s largest natural rubber producer, but accounted for 31.5% of the global production, indicative of a declining rate which is attributed to decreased prices of fresh latex after the ‘boom’. Natural rubber production is expected to be maintained due to its indispensability in the manufacturing sector [5,6], but output has not increased substantially, implying that this failure cannot be explained solely by price fluctuations.
Rubber has the potential to contribute to economic development, but the existing cultivation, processing, and marketing methods do not optimize the benefits that farmers and processors of rubber products will realize. The process of adding value to natural rubber could increase income generation and job creation. For instance, smallholder rubber farmers sell approximately 95% of their total production as raw unprocessed rubber lumps, which results in slim profit margins. Natural rubber marketing is unlike other agricultural products in that it is an industrial business enterprise; it is highly specialized and strict due to the product requirements involved. Inadequacy of coordinated marketing has been identified as a significant impediment to the growth of rubber production. For example, most farmers can barely give details of what happens to their produce beyond the intermediate processor along the value chain. The farmers rely on various marketing agencies to drive their sales, who in turn count on rubber manufacturers for the final say on that. Clearly, the natural rubber sector needs a robust understood marketing system. Therefore, there are questions about what other factors contributed to the natural rubber production downturn, what value-adding responsibilities producers and processors play to maximize their profits, who the stakeholders are and what roles they play in the natural rubber supply chain. Amongst others, these have not been adequately investigated analytically. Moreover, most literature discussing the para rubber tree and its feedstock generally does not vividly distinguish different types of feedstock products, by whom they are produced, to whom they are sold [7] and the socioeconomic status of the stakeholders involved. Comprehensive analysis of feedstock, intermediates, and products is needed in any biomass conversion process, and unfortunately, has not really been explored and characterized in much detail.
Para rubber is critical to Thailand’s economy, primarily in terms of foreign exchange earnings, feedstock sourcing for agro-based industries, and job creation and sustenance of livelihoods through a variety of value addition levels. The Thailand natural rubber industry, which is dominated by smallholders (70%), has suffered a decline in output, despite the potentials of the crop as a major foreign exchange earner [8,9], earning more than rice [10]. Southern Thailand has been known to be an accustomed core for para rubber plantation in the country [11,12], containing over 60% of the country’s total plantations with roughly 1.0 million households owning para rubber plantations [13]. Recently, the Thai government has proposed initiatives targeting rubber and rubber products development aimed at the continued supply of international standard rubber and rubber products, and business opportunity development for both local and foreign investors associated with the concept of ‘rubber city’ [14]. These initiatives can only be effective and sustainable with the understanding of the prevailing realities in a rubber hub such as Hat Yai district, which, for some decades now, has conservatively been a nucleus of rubber industry development and related innovations.
Currently, natural rubber makes some important polymer materials for society, and has become an essential cradle material used in the manufacture of a wide range of goods. About 40,000 products can be produced from natural rubber [15]. This material has been implicated chiefly in the manufacture of automobile parts, medical supplies, chemicals, clothing, and packaging materials, among others. The woody part can make a decent stuff for the industrial production of woody merchandise (e.g., sawn timber, plywood, particle board, furniture). Twigs can be recycled for charcoal fabrication while leaves can be carbonized for briquette making. Moreover, rubber tree-based biomass residuals such as dead stands, twigs, and trunks can be transformed into other usable sorts of energy for combustion and transportation systems. Energy from biological procedures is necessary for driving sustainable development [16,17]. Moreover, rubber plantations have proven to be extremely commercial, hence driving the cultivation communities’ economy. Some distinct socio-ecological benefits of (Hevea brasiliensis) bioeconomy may include reduced reliance on fossilized fuels; lessened carbon dioxide emissions, hence climate change mitigation; delivery of energy; and several other valuable byproducts. In terms of socioeconomic and livelihoods, the significance lies in its role in the facilitation of entrepreneurial activities in cultivation regions where a wide range of stakeholders interact, thereby creating jobs that sustain livelihoods, and consequently the economy.
The para rubber sector value chain should be seen to reflects diverse levels of a feedstock supply chain potentials that ranges from biomass crop support; bioenergy for advanced biofuels; bio refinery, renewable chemical, and bio-based product manufacturing support; to bio-based markets. The connections between these supply chains are what will ensure sustainability, hence a profitable rubber enterprise. The security of feedstock is a critical component of ensuring the sustainability of renewable energy from biomass [18]. Numerous studies have been conducted on the issue of biobased products and bioenergy feedstock security. For instance, an investigation was performed on the energy production prospects of biomass in ecological systems in China in order to address the country’s biomass shortage, which is impeding the progression of the country’s bioeconomy and bioenergy industries [19]. According to [20], approximately 8 million tons (dry weight) of para-rubber waste wood is collected from agriculture and the furniture industry in Thailand each year, which can be used as feedstock to produce 5.32 million tons of wood pellets annually [13]. As of the year 2020, Thailand had produced 4.7 million metric tons of natural rubber [3]. Thai researchers conducting a study on the security of feedstock supply for prospective bioethanol production in Thailand found that higher feedstock increment is essential to meet long-term needs for bioethanol [21]. Moreover, a study quantifying India’s biomass possibilities for energy and biofuel production discovered that energy crop and agroforestry products are promising feedstock [22]. The critical issue of feedstock security analysis is the accessibility and variety of feedstock that will be sufficient to meet future demand for bio-based products and energy [23], taking into account input and output potentials. However, the relevant actors along the rubber value chain and the various types of para rubber feedstock products, how much of these feedstock products are accessible, and their reliability in sustainable utilization become questions to address. This study is conceived with an intent to explore the socioeconomics of para-feedstock production potentials and security, substantiate the range of products produced and analyze the economic opportunities of the para rubber tree as an important resource in the study area. The findings of this study will serve as a new benchmark for the rubber industry’s future development. While this study is focused on the study area, the findings and perspectives will aid in the management of feedstock for energy and non-energy commodity production in other regions within and beyond Thailand with comparable environment and processing situations.

2. Materials and Methods

2.1. Area and Scope of the Study

The study was conducted in Hat Yai district in Songkhla province of southern Thailand. Hat Yai district is located at 7°1′ N 100°28′ E, the district covers an area of 852.796 km2, and the climate of the region is described as a tropical monsoon in the Köppen–Geiger climate classification scheme. The average temperature ranges between 22 and 35 °C depending on the season, and the total yearly rainfall is 1720 mm (Thai Meteorological Department). The soil is clayey-skeletal with little phosphorus and potassium, and it is non-fertile soil according to the Land Development Department’s classification [24]. Para rubber (Hevea brasiliensis (Muell. Arg.)) plantations occupy 1.8 million hectares in southern Thailand [25] and in Songkhla Province, covering virtually 300,000 hectares [24], and 36,313.1 (42.6%) hectares of the land in Hat Yai district is covered with rubber tree plantations. The prolific biomass resources, economic growth, and enormous human population associated with the study area were amongst other reasons informing its choice for para rubber feedstock potential assessment as an important research area for sustainable development.

2.2. Sources and Types of Data

The primary data were collected with the aid of a set of well-structured questionnaires, which were used to gather the information from a range of stakeholders with a focus on the farmers and processors. The questionnaire combined open-ended questions and multiple-choice questions with predefined answers offering respondents the possibility to choose and rank among several options. For these questions, an optional space was provided to elaborate on the answer. This open part is considered of great importance for a survey of this kind as it contributes to improving the interpretation of its overall results and provides additional valuable material. Some of the data sourced were information on socioeconomic status, farm or factory size, quantities of inputs and outputs, knowledge of supply links, and profit made, among others. To ensure the reliability and validity of the data, it was ascertained that all respondents had substantial economic experience and were not para rubber industry novices. Furthermore, after establishing the survey’s face validity, it was piloted with a subset of the intended respondents and compared to data from key informants and direct observation. After testing the questionnaire, the survey was administered to the respective respondents using three trained enumerators under the supervision of the first author. Structured questionnaire, participatory tools, Market sketch, rapid market appraisal, quantitative market study, key informant interviews, structured direct observations were also used in this work.

2.3. Sampling Procedure and Sampling Size

A two-stage sampling procedure involving purposive and a random sampling techniques random sampling technique at 95% confidence level and 8.6% margin error was used in selecting 117 respondents. Stage one was the purposive selection of Khuan Lang, Khu Tao, Kho Hong, Khlong Hae, Khlong U Ta Phao, Chalung, Thung Yai, Thung Tam Sao, Tha Kham, Nam Noi, Ban Phru, and Pha sub districts being the major rubber-producing sub districts in Hat Yai district. The second stage was the random selection of respondents: 96 farmers involved in para rubber cultivation in each of the 12 sub districts from the 2010 directory of para rubber farmers were accessed from the Rubber Research Institute of Thailand and the Thai Rubber Association. Furthermore, because association leaders were involved, ethical concerns were easily complied with through this channel. It is common that, when conducting a study of this nature, it is crucial to consider ethical considerations such as respondents’ willingness, ability to utilize survey tools and more. For example, a study remarked that rubber farmers were chosen based on the diversity of their intercropping vegetation and their desire and ability to participate in information collection [26]. The list comprises of farmers whose plantation would have attained tapping age; gestation period for rubber is 7 years. Twenty-one processors (7 from each type of enterprise) were also randomly selected from different clusters that include latex, wood, and other processors. A total of 117 respondents, comprising 96 para rubber farmers and 21 processors, were interviewed for the study. Like most studies, this design might have limitations. Data sampling is susceptible to biases, as respondents can manipulate the data and enumerators may exclude certain subgroups. This could lead to invalid or inferential statistical procedures, and it can become ineffective as the population size increases. To mitigate the likely limitations, respondents involved in rubber production and processing were selected from the membership of the Thai Rubber Association and the Thai Rubber Processor Association, respectively. All students were interviewed based on their expertise and comprehension of the rubber industry’s dynamics.

2.4. Statistics of Respondents Sampled

One hundred and seventeen respondents were sampled for the study, and a total of 109 were found useful for the study. These represent about 93% of the total response rate (Table 1).

2.5. Analytical Techniques

Data were entered and analyzed in MS Excel using descriptive statistics which were frequency counts, a pie chart, percentages, means and mode. Collinearity and Pearson correlation analyses were explored to check the relationship between continuous and categorical variables, respectively. Moreover, linear regression models were used to evaluate the factors affecting farmers’ feedstock supply, a feedstock potential model was used to estimate the theoretical feedstock potential from the perspective of processors, and the Simpson’s diversity index was used to evaluate feedstock diversity. The value chain was mapped using a functional approach. At each node of the value chain, the fundamental processes, enterprises involved, product flow, and quantity of product were determined and represented.

2.5.1. Evaluating the Para Rubber Farmers Feedstock Supply

To determine the factors associated with farmers feedstock production potential, a linear regression model was used. The regression models are denoted as follows:
Y 1 = β 0 + β 1 X 1 + β 2 X 2 + β 3 X 3 + β 4 X 4 + β 5 X 5 + ε t
Y 2 = β 0 + β 1 X 1 + β 2 X 2 + β 3 X 3 + β 4 X 4 + β 5 X 5 + ε t
where β 0 is the average product supply or wood produced for all the farmers, β 1 , β 2 , β 3 , β 4 , β 5 are regression coefficients, X1, X2, X3, X4 and X5 are plantation size, plantation age, other farms owned, purpose of plantation, and inter-cropping respectively, while Y1 and Y2 are latex- and wood-related product supply, respectively.

2.5.2. Assessing the Theoretical Quantity and Fraction of Potential Para Rubber Feedstocks

The potential quantity of feedstock was evaluated because it is critical for increasing the production of a wide variety of products and energy. The potential quantity of feedstock was calculated by subtracting the total quantity of feedstock from the product. The net feedstock balance was determined by deducting anticipated feedstock necessities from the estimated available feedstock resource. The following equation was used to estimate the accessible feedstock categories [13,21,27].
P Q i = T Q i j   C F i ,   j × I I m p u t   i , j j   C F i , j × O O u t p u t   i , j  
where: P Q i denotes the potential quantity of feedstock i for bio-based product production in the study area (ton/year), T Q i denotes the total quantity of feedstock i in the study area over a period (tonne/year), and C F i ,   j denotes the conversion factor used to convert the quantity of feedstock i for producing product j . I I m p u t   i , j denotes the total supply of product j as an input (tonne/year), whereas O O u t p u t   i , j denotes the total supply of product j as an output (tonne/year).
The average conversion factor was determined using data from three clusters of latex and wood processors with varying operations and raw materials handled (Table 2).

2.5.3. Assessing the Para Rubber Feedstock Diversity across the Value Chain

Variance was used as a metric of variability to determine how feedstock categories are spread to ensure their security; the formula for computing variance is as follows.
σ 2 = ( X i μ ) 2 / N
where:
σ 2 is the estimate of variance;
μ is the population mean; and
Xi is the ith data point out of N total data points.
Simpson’s diversity index was used to determine the diversity of feedstock supply in relation to feedstock security and value chain potential. This index, when used to assess long-term supply security and the diverse distributions of products and energy flows within a system, can broaden additional opportunities and channels for partnership and interdependence within the value chain and energy utilization [28]. The Simpson’s diversity index formula is as follows:
D = ( n i × ( n i 1 ) ) / ( N × ( N 1 ) )  
where:
n i is the number of individuals in the ith species; and
N is the total number of individuals in the community.

3. Results

3.1. Demographic Characterization Analysis of Para Rubber Farmers and Processors in the Study Area

Table 3 presents the demographic characteristics of the rubber farmers and processors. From these pooled results, a composition of 64%, 55% and 36%, 45% indicates the distribution of males and females as farmers and processors, respectively. This shows that, there were more male farmers, with a reasonable number of female processors. The modal age range for both farmers and processors was 51–70 with respective means of 54.4 and 48.4, implying that the most the farmers and processors were above youthful ages. Farmers average family size is 4.4 and for processors it is 3.9, both of which mostly range between 3–4 members. Most farmers (40%) have elementary educational attainment, with a few (17%) of them having vocational education. For processors, the reverse is the case as 35% had vocational educational attainment, with only 15% having elementary education. Generally, the demographic distribution showcases that more males were involved in the rubber production and supply process, and the population of rubber farmers and processors was composed more of older persons than the younger ones in the area. Moreover, more technical know-how was involved in processing than mere cultivation.

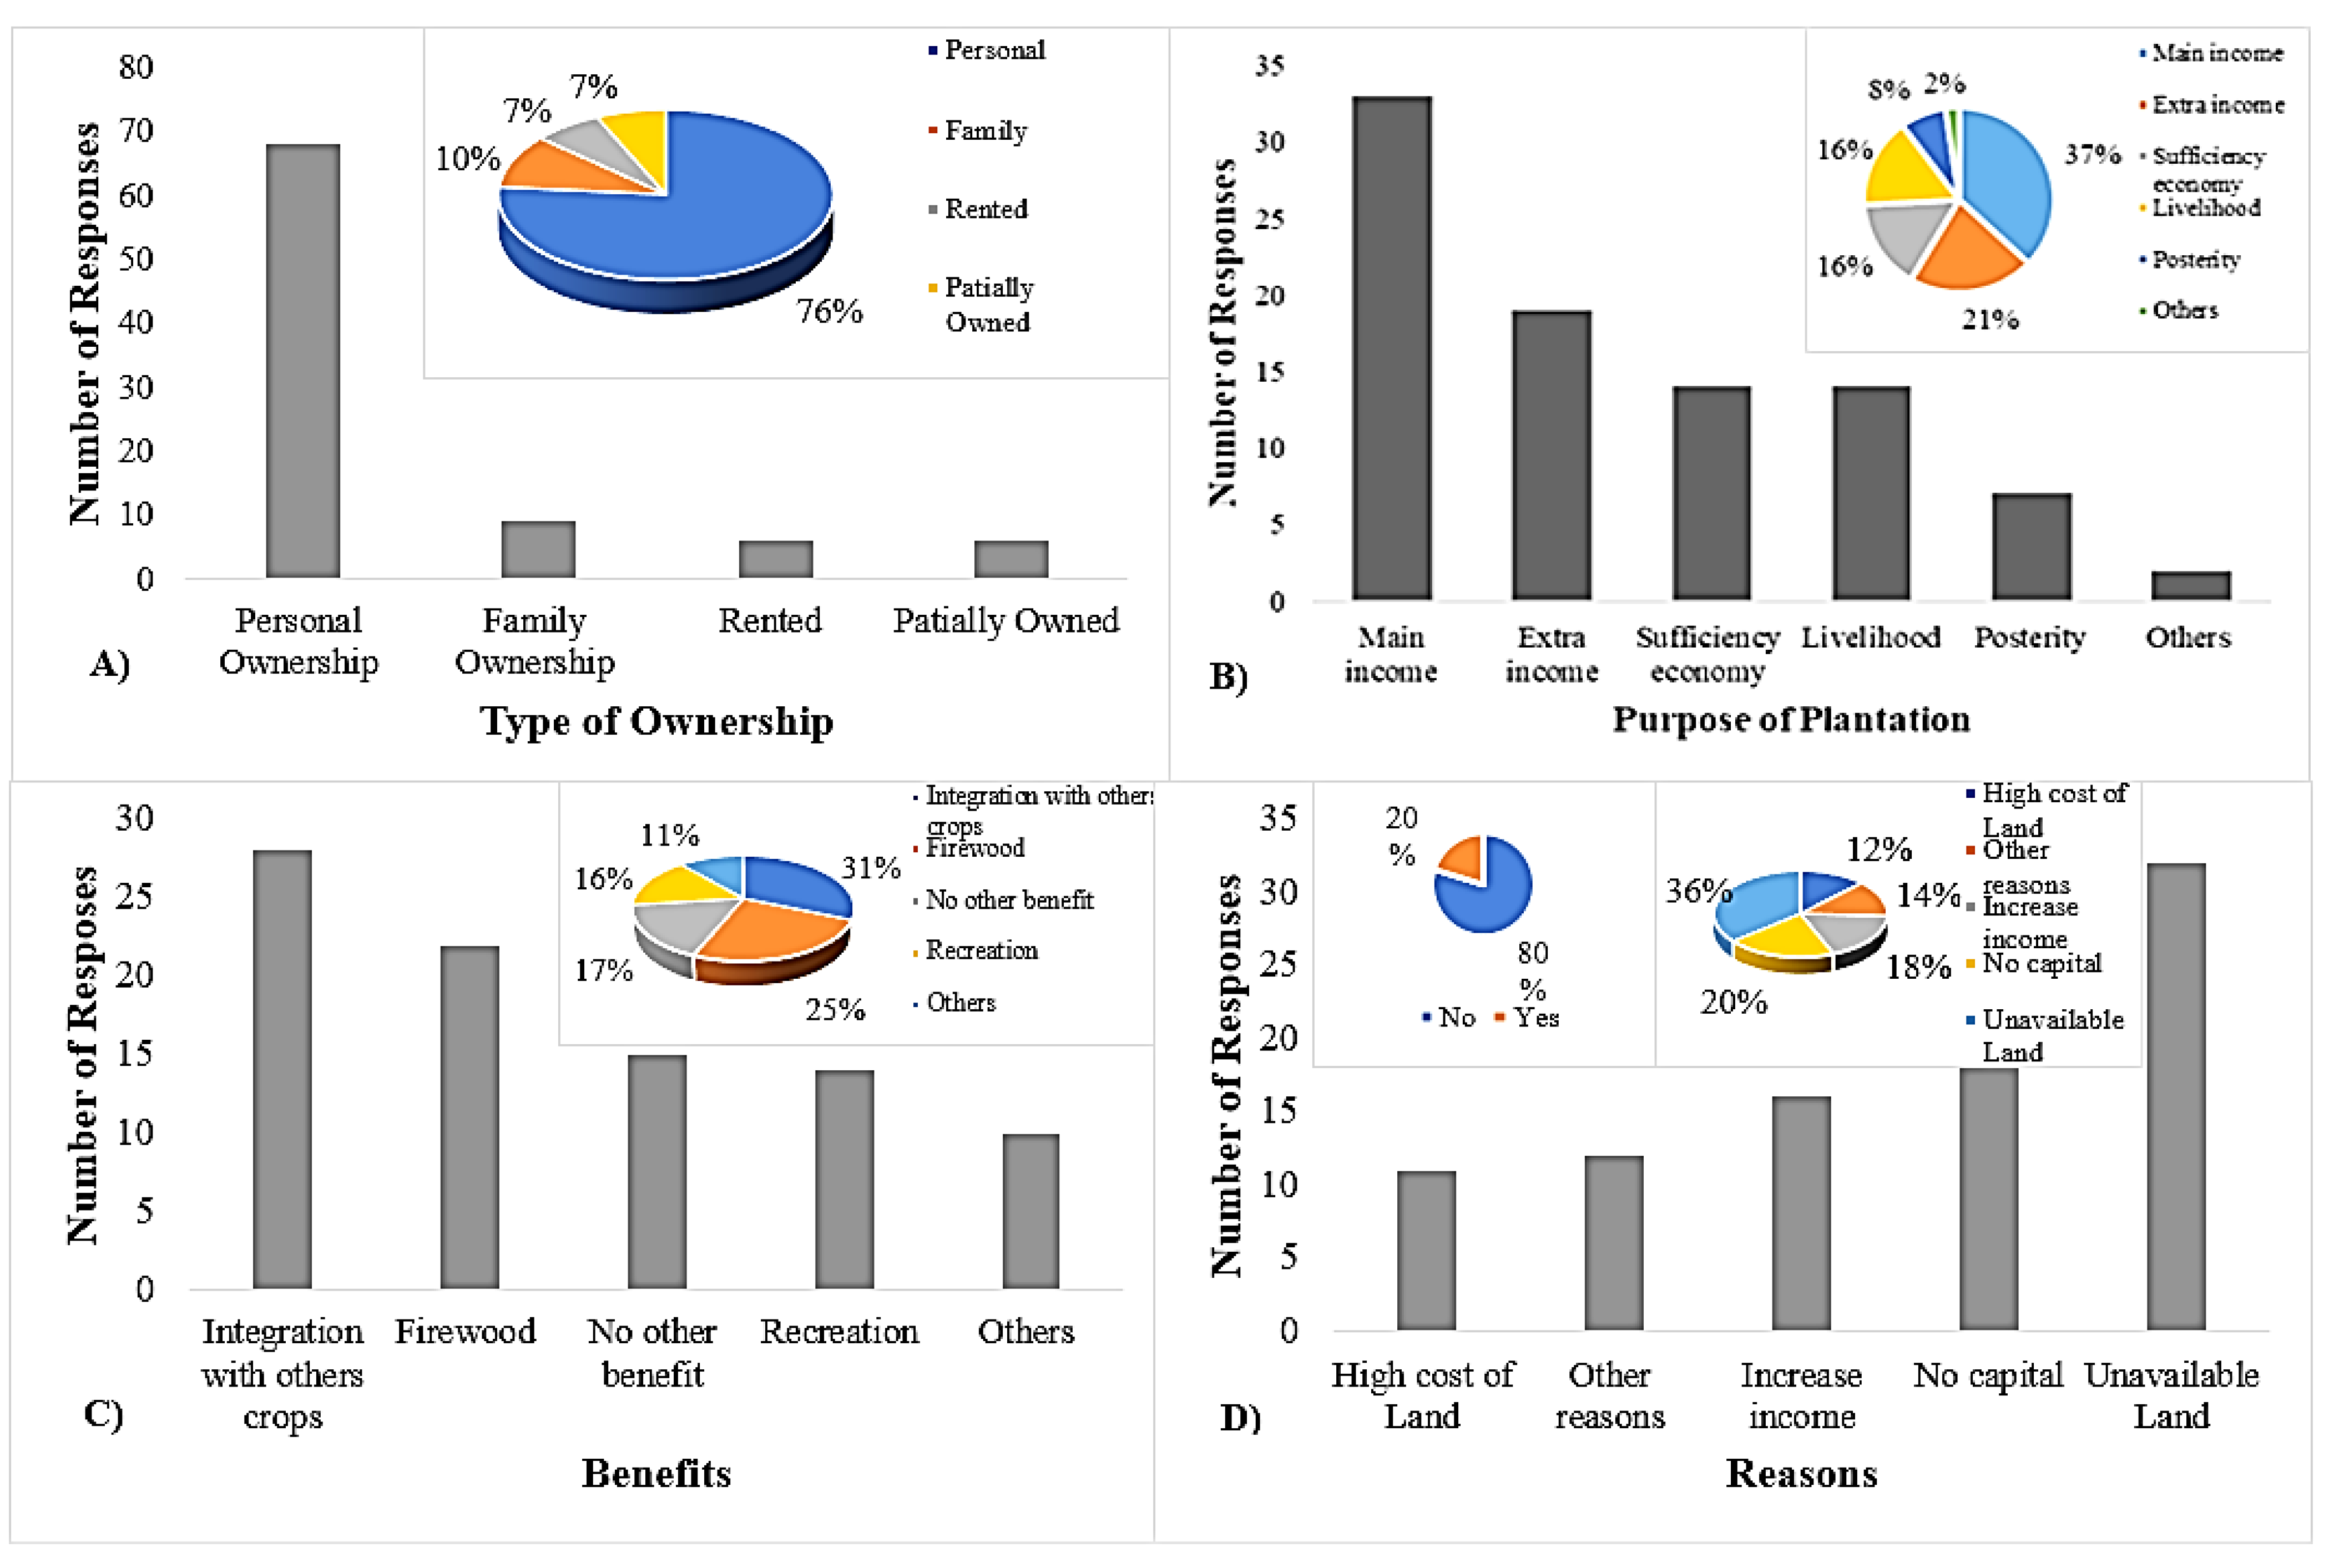
3.2. Para Rubber Plantation Ownership and Rubber Land Use Analysis in the Study Area

The plantation ownership and establishment analysis are shown in Figure 1. The results revealed that, most plantations were personally owned by the respondents representing 76%, while only 7% were either partially owned or rented. The analysis revealed that, as high as 21% of the plantations were established for the primary purpose of main income generation source, with only 2% were established for other reasons not categorized. Moreover, some secondary benefits were also derived from the plantations, most of such benefits ranges from integration of the plantation with other crops, firewood, recreation, and others. The results indicate that most secondary benefits were derived from integration with other crops, representing 31%, with the least benefit categorized as others (11%). However, most farmers were not willing to expand their plantations; this category represents 80% compared to only 20% who had expansion plans. The analysis of reasons why plantation owners were willing or not to expand indicates that as many as 36% of the respondents were not willing due to unavailability of land, with the lowest proportion (12%) citing the high cost of land. From the pooled data, it is indicated that the modal plantation age range was 11–15 years with a mean age of 17.4 years old. The sizes of plantations owned by the respondents showed a modal size range of 0.96–1.6 hectares with a mean size of 2.6 hectares. Moreover, the results showed that 30% of the plantations exist without integration with any crop, while the remaining part were integrated mostly with papaya (15%), and some with coconut and others (Table 4). In southern Thailand, there are a number of communities with intricate orchards dominated by rubber. The means of para rubber land use suggested that there is considerable rubber-related product production potential, which is in an active phase of productivity, with a corresponding initiative of sustainable utilization of the plantation across the study area.

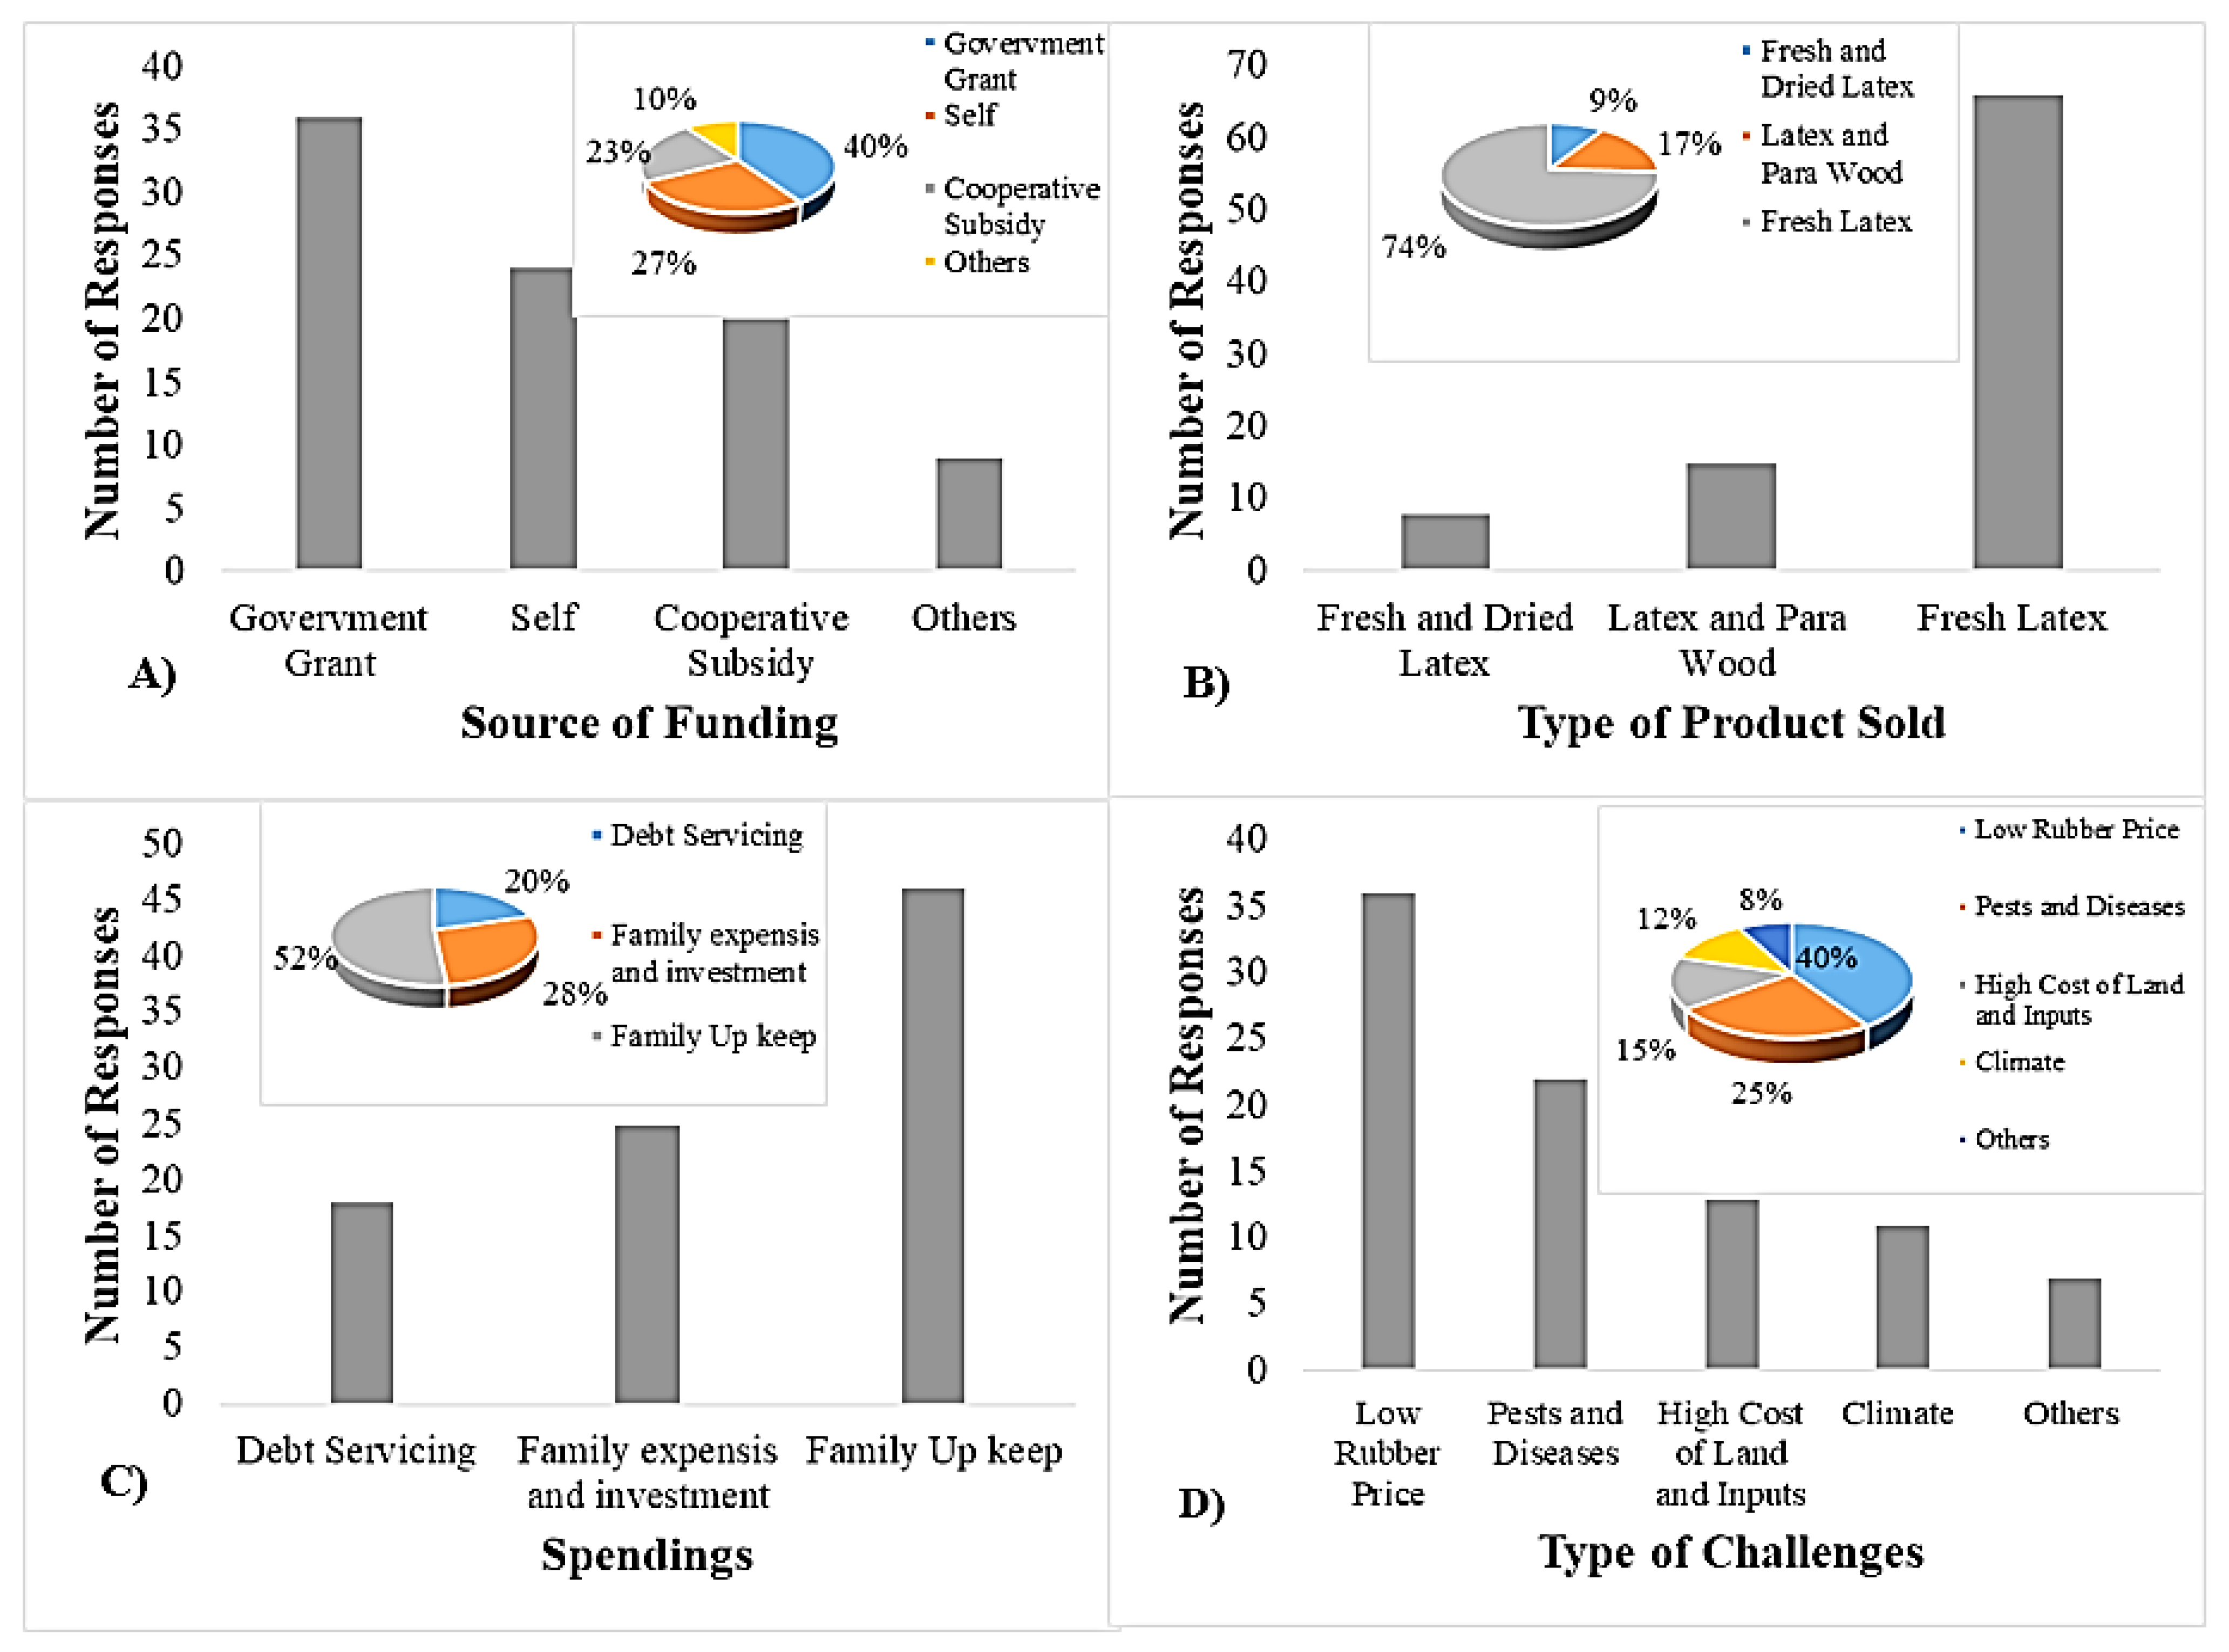
3.3. Para Rubber Plantation Owners’ Production and Economic Status Analysis in the Study Area

The pooled data of monthly income and expenditure status of the respondents showed a modal of both income and expenditure ranges to be between USD 310.19–930.58 with means of USD 1079.05 and 937.03, respectively. The analysis of the annual para rubber products production potential showed that farmers primarily supply latex and parawood. The modal annual production ranges were between 6000–10,999 kg and within a decade 1.0–1009 with corresponding means of 9455.4 kg and 1082.5 for latex and parawood, respectively. Moreover, the analysis of annual para rubber-based income generation showed a highest range between USD 31.02–3101.93 with a mean income of USD 6341.35 (Table 5). The results suggest that para rubber is a valuable resource which support livelihoods and economic development in the study area.
The analysis of production and supply dynamics revealed that most (40%) of the plantation establishments were funded by government grants, with only 10% being funded by other means. The products traded from the plantation were mainly fresh latex (74%) latex and parawood. The analysis also revealed that most of the proceeds from para rubber sales were used for family upkeep; this represented 52%, while 20% was utilized in debt servicing. The analysis of challenges associated with the entire production process revealed that low prices of fresh latex constituted the biggest (40%) challenge (Figure 2). These analyses indicated that para rubber production received recognition as a driver of household economy; hence it is capable of impacting the farmers, yet low prices of major and regular products tended to demoralize enhancement across the study area.

3.4. Factors Associated with Para Rubber Farmers Feedstock Supply in Hat Yai District

Results from the regression analysis indicated that the average latex supply among all the farmers was 3528.1 kg (Table 6). The plantation size had a significant association with the amount of latex supply. An increase of 1 hectare in the land size significantly increased the latex supply by 1310.1 kg. The number of farms owned apart from latex was positively associated with latex supply, although the association was not statistically significant. The analysis also showed that farmers who cultivated para rubber as their main source of livelihood had 4676.4 kg more product supply than farmers who used their farms as source of extra income. Farmers who inter-cropped their farms significantly produced 4107.8 kg more than farmers without inter-crops.
The average amount of parawood supplied by the farmers was 271.52 kg (Table 7). The size of plantation showed significant association with the amount of parawood supplied. From the results, increasing the land size by 1 hectare corresponded to a 246.19 kg increase in wood production. All other factors had no significant effects on the wood production.

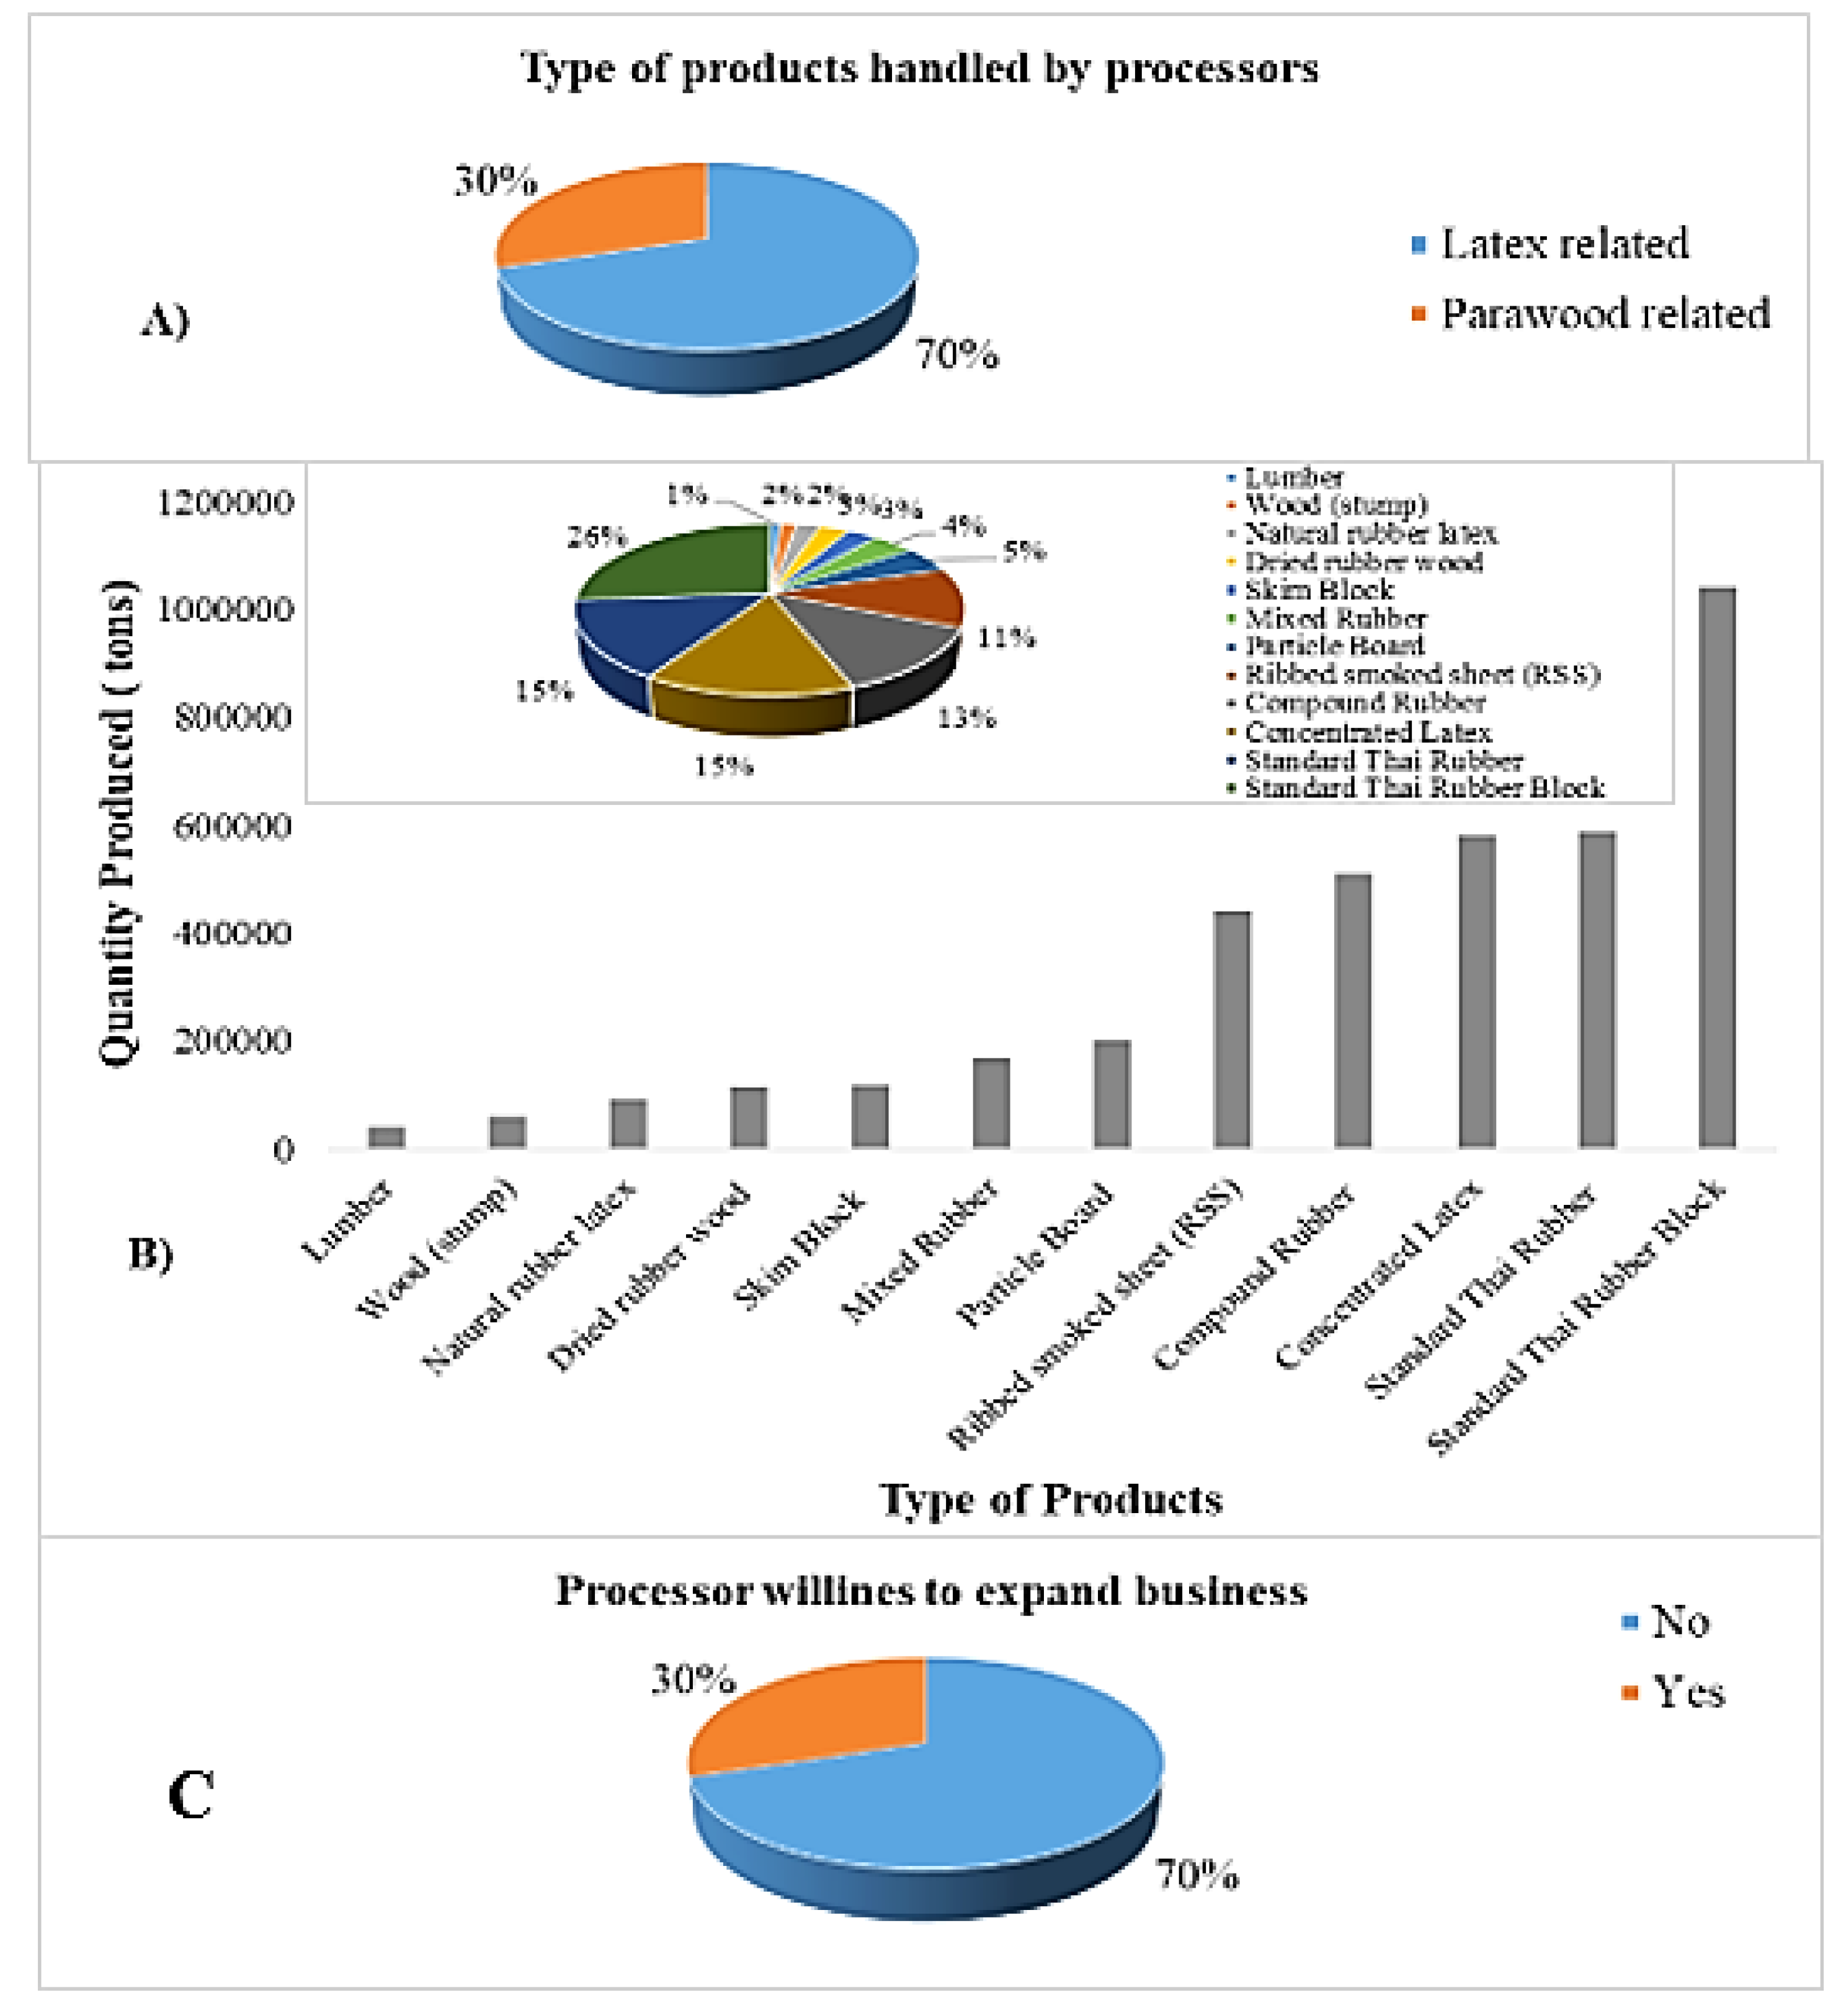
3.5. Rubber Processors’ Production and Economic Potentials Analysis in the Study Area

The socioeconomic profile of the processing companies is shown in Table 8; the results revealed a mean of 27.9 years of processing operation by the respondents and the modal years’ range was between 18–39 years. The modal range for workforce was between 40–54 persons, with a mean value of 63.8 for the workforce. Moreover, the analysis of the annual income of processors revealed that the modal range was above 3.10 million USD and the mean annual income of processors was 2.55 million USD.
The pooled data analysis of the processors’ production capacity revealed that 70% and 30% of the respondents handled latex related and parawood-related processing, respectively. The most processed product was the standard Thai rubber block representing 26%, while the least was lumber (1%) amongst a wide range of products processed (Figure 3). However, the result revealed that 70% of the processors were not willing to expand their businesses. From the analyses above, more latex related processing facilities exist and the most processed is rubber block, yet a good number of these facilities are not willing to expand their business in the study area due to economic instability.

3.6. Para Rubber Feedstock Potential Security Analysis in Hat Yai District

The theoretical feedstock potential (PQ) of the various clusters of processors is presented in Table 9 by feedstock category. The result indicates that the study area possesses 340,968.68, 241,173.09, and 249,489.14 tons of wet latex, dry latex, and wood-related feedstock.
From the results, the Simpson’s diversity index is 0.75 (Table 10) which is high enough and indicative of good potential for feedstock security and can be used to calibrate the supply-side diversity, which is critical for material flow system since increasing the variance and balance of end-use sectors improve efficiency and adaptability.
Latex and parawood feedstocks find widespread use in a variety of industries, including automotive, medical, packaging, chemical, construction, furniture, and household items. For instance, latex is a nonfungible and important biopolymer that is used to manufacture more than 50,000 rubber products, including tires and medical gloves [29], and possesses special features that synthetic rubber cannot really match [30]. The woody material has been used in the manufacturing of a variety of products and energy generation in the form of timber, wood residues, wood-based materials, woodware, and wood chips. However, numerous studies conclude that using products is more ecologically friendly than removing standing trees [31]. Increased yields and improved management will improve the performance of feedstock sources [32]. According to the findings of [33], agrotechnical considerations, vegetation type, and yield cycle influence not just output, but also the qualitative characteristics of biomass. While the use of bio-based products and biofuels may mitigate the effects of reduced haulage, the total cost of bio-based products and bioenergy may rise when particularly in comparison to solely using bio-based residues [34]. A well-designed feedstock supply trend can boost biomass plant income, feedstock supply quantities, and farmer willingness to participate [35]. The pattern of different yields influences the efficiency of energy and non-energy outputs; whole tree product utilization is significantly more efficient than considering only stem wood [36].

3.7. Para Rubber Feedstock Supply Chain and Economic Opportunities Analysis in the Study Area

Table 11 presents the para rubber feedstock supply channels. The analysis para rubber feedstock supply chain revealed that all types of the para rubber feedstock undergo four tiers along the supply chain with the corresponding input suppliers, key activities, operators, and key products traded at each tier. From the analysis, the trend suggests that a range of products traded tend to increase with increasing tier, implying increasing economic opportunities across the supply tiers.

4. Discussion

The demographic trends were in good conformity with the results of [12] who reported the modal age range of farmers to be between 51–60 years old, with 67% having at least elementary education attainment, and family sizes >3 among other parameters in their assessment of socioeconomic characteristics of forest stewardship council-certified famers in Rayong and Songkhla provinces According to the pooled data, it appears that the sector is mostly male, implying that more men were interested in rubber production and processing. This may be a function of the tremendous amount of labor required in rubber production. The sample’s low representation of youth and middle-aged categories may reflect their derogatory attitudes toward agriculture. Processors have higher literacy and technological proficiency than their counterparts in rubber production. In essence, it may be that they needed the requisite knowledge and skills to improve their efficiency in each of the various aspects of processing and marketing, including effective communication, good record keeping, and inventing better methods, among others. Moreover, similar trends have been reported by [37] in their study of the rubber value chain in Nigeria. They reported that most rubber farmers were males, aged and had some form of formal education attainment. Attributing the trend to value placement on agriculture and education, coupled with gender perception. However, being educated will make it easier for farmers to adopt new and improved techniques, as they are more likely to learn quickly and spread innovations. Larger family size and youth involvement could indeed represent an important source of labor for rubber production and perhaps other agricultural and non-agricultural activities. This will mitigate low efficiency, which is a result of management diversity, a labor shortage, especially during the tapping season, a high cost of production, and limited opportunities for off-farm jobs.
Largely, the results imply that most para rubber plantations were established on owners’ lands with a primary aim to generate income; however, there seemed to be a sought alternative use on the lands to minimize risk and maximize benefits, yet land availability has constrained the expansion of plantations across the study area. The findings varied from the previous assertions of authors such as [38], who found that the most important reasons for unwillingness to expand plantations to be majorly economical in their work analyzing the problems and potential solutions for small-scale rubber farmers in Songkhla province. The present finding implies that the most important factor, low net production in the area, is both socioecological and socioeconomic, since land unavailability was found to be the most important reason why most farmers are unwilling to expand their plantations. This situation may be attributed to the possibility that many plantations have expanded to their maximum limits induced by urbanization among other factors, which fuels the land accessibility constraints among even the few willing farmers. These, coupled with low rubber prices, will leave no option for the farmers other than to just maintain the status quo in their production capacities. Rubber production of small-scale farming systems in Thailand provides farmers with a stable source of income [39]. Intercropping para rubber has been a long-time practice with small farmer holders in this area; if the farmer has good management in place, income can be significantly increased by integrating intercropping or animal husbandry into the farming system. In [40], it is reported that the integration of rubber with fruit crops and native vegetables provides a significant household income in Songkhla. However, the decision to intercrop depends on several factors such as edaphic, marketing, land, and labor availability.
The present study’s results in part concur with the reported findings of [38], who found that most para rubber plantations in this same area integrated crops as intercrops with pineapple, rice, corn, vegetables, and other annual crops in that order. However, the present findings present papaya as the most commonly integrated crop across the study area, implying that there has been a shift in attention from the usual cropping system and land use to suit the eminent realities presented by dynamics relating to the rubber enterprise among producers over the past two decades. The present results revealed that a good number of farmers could not integrate their plantations with any crop; this probably is due concerns of interference due to crop competition that could incur greater management costs, the high value of para rubber, fear of reduced yield and extra labor requirements, which are among the reasons why some farmers are skeptical of integration in plantations. Similar trends of farmers’ annual para rubber income have been reported by [12]; they reported that a significant proportion (27.1%) of rubber farmers had income from rubber plantations of USD 1551.00–3101.93 per year. Rubber will undoubtedly remain a valuable product in the modern age, and because of a positive mindset and ability to adapt, the rubber industry has remained a source of economic strength in this region. As a result, the rubber industry’s dynamics have an impact on the smallholder’s lifestyle and socioeconomic status in their society. It is clear from these findings that, without para rubber plantations, the farmers’ other sources of monthly income and expenditure margins are not wide enough, implying that savings and investments will consequently be constrained and hence will hamper economic growth and development. With the para rubber enterprise, however, farmers are comfortable to channel the proceeds for family upkeep, investments and debt servicing; the majority of rubber farmers, 88.33 percent, had debts totaling an average of 10,868.46 USD [12].
The para-rubber trees are an economically viable resources in the study area, primarily for natural rubber production from the age of seven almost continuously throughout its life; additionally, diseased and spent trees (mostly over 25 years old) are harvested for parawood when the latex yield has significantly decreased. This allows owners to continue to derive economic benefits from the resource, thereby earning a livelihood and facilitating local economic functions. An appraisal of the annual feedstock production capacity of the area implies an impressive potential, which is essential for energy and non–energy supplies. However, despite the recognition and value attached to the para rubber enterprise, farmers face a lot of challenges that impede the productivity of their plantations. These include low latex prices, termites and blasts infestations, drought, and high input costs among others. These constraints are capable of inflicting socioeconomic hardships such as more debts, reserved life, decreased self-esteem, and inequity and inequality on the citizens induced by decreased productivity and income. Moreover, while a good proportion of farmers accessed a government grant as a mean of encouraging production, a significant number exist who still fund the establishment of their plantation by themselves. Similar trends were reported by the works of [38]; when they analyzed the problems and potential solutions for small-scale rubber farmers in Songkhla province, they found the major constraints to rubber production to be low price of the product, deficient expertise, and pest/disease among others which they attributed to the absence of bargaining price insurance potential, a deficit in management knowledge and the high cost of living. For these challenges to linger for over two decades, it implies that important aspects such as product marketing and insurance have not received needed reform; moreover, other factors such as climate change which influence weather related elements and biodiversity most have compounded the challenges. Establishment of a robust, inclusive para rubber business system and biotechnological innovation adoption could be ‘a game changer’ in the rubber sector.
Rubber farmers’ outputs have been positively influenced by plantation size, intercropping, and source of livelihood, and these variables have increased concurrently with rubber feedstock yields. This study found that a larger rubber plantation is the best indicator of increased para rubber feedstock production in Hat Yai district. This finding is consistent with those of [4,41,42,43,44], who reported that the size of plantations resulted in high levels of latex production in Nigeria, Thailand, and Sri Lanka, respectively. This finding reinforces and confirms the implication that land scarcity and related issues are contributing to the decline in feedstock supply, as indicated by many farmers who were unable to increase their yields due to it in the current study. Furthermore, a similar tendency of a negative coefficient of plantation age has been observed by other researchers such as [42], who attributed the trend to technical efficiency factor. Intercropping and the utilization of plantations as a source of livelihood; these factors were positively associated with feedstock output, implying that farmers are investing significantly more in modern plantation cultural practices such as optimal input supply and sustainable farm operations in order to maximize profit. Generally, these results indicate that rubber processing has been a common practice, and an important employer of labor with a reasonable income generation potential over the past three decades across the study area. This trend confirms the findings of [45], who reported that most of these processing facilities are concentrated in this study’s area relative any other province within the southern region. The localization of the rubber processing facilities in this region may be the function of the rubber resource abundance induced by optimum cultivation conditions, industrialization/urbanization and commercial potentials coupled with the strategic location particularly of Hat Yai city, where most of the processing plants are located. There is no doubt that the rubber processing sector drives both the micro and regional economy across the southern region through their respective production, workforce, and income generation capacities.
Remarkably, Thailand’s parawood sawing and energy related industry is still in its growing stage, with small and medium-sized sawmills dominating the enterprises. Previously, the parawood trunks that remained after latex processing were used as firewood on the plantation or in charcoal manufacture [39]. The underdevelopment of the wood sector could be attributed to the greater emphasis on the latex, longer time taken (mostly when trees are spent) to derive benefit from woody derivative relative to latex, tedious labor/technology, logistics involved, inaccessibility of plantations or proximity to processing facility, and an unstandardized marketing system. However, the added value generated by parawood is becoming increasingly important to smallholders, as the market price of rubberwood timber has improved. This might have been occasioned by increased demand for wood and related feedstock as induced by growing innovations in construction, furniture, energy, and other applications. For instance, the feedstock supply of wood pellets in Thailand from para rubber waste wood, economic waste wood and fast-growing trees wood could yield 5.32 million tons of wood pellets across Thailand [13]. Therefore, with a sustainability mindset setting up a system involving the feedstock cultivation, wood energy-related plants and the consumers, if optimized, could reduce the time and use of fuel. This will encourage production of wood pellets and other energy resources and support the security of energy production in Thailand because the feedstock is domestically obtainable. The potential amount of feedstock is related to the future production and consumption of a diverse range of products in the study area. The findings corroborate those of [13], who stated that Thailand has enough para rubber feedstock potential that is densely concentrated in the southern region. This sufficient potential can be attributed to favorable climatic conditions for para rubber production, socioeconomic and socioecological factors, as well as the presence of processing plants in Hat Yai. Therefore, feedstock security becomes critical for the long-term production and consumption of para rubber, and its diversity can help ensure sustainability. Latex and parawood feedstocks find widespread use in a variety of industries, including automotive, medical, packaging, chemical, construction, furniture, and household items. For instance, latex is a nonfungible and important biopolymer that is used to manufacture more than 50,000 rubber products, including tires and medical gloves [29], and possesses special features that synthetic rubber cannot really match 2021) [30]. The woody material has been used in the manufacturing of a variety of products and energy generation in the form of timber, wood residues, wood-based materials, woodware, and wood chip. However, numerous studies conclude that using products is more ecologically friendly than removing standing trees [31]. Increased yields and improved management will improve the performance of feedstock sources [32]. According to the findings of [33], agrotechnical considerations, vegetation type, and yield cycle influence not just output, but also the qualitative characteristics of biomass. While the use of bio-based products and biofuels may mitigate the effects of reduced haulage, the total cost of bio-based products and bioenergy may rise when particularly in comparison to solely using bio-based residues [34]. A well-designed feedstock supply trend can boost biomass plant income, feedstock supply quantities, and farmer willingness to participate [35]. The pattern of different yields influences the efficiency of energy and non-energy outputs; utilization of whole-tree products is significantly more efficient than considering only stem wood [36].
Thailand’s natural rubber supply chain is composed of three distinct components; these includes upstream, midstream and downstream industries. Conceptually, it is assumed that the upstream productions focus on the growing and harvesting of rubber and parawood on plantations, the operators (growers, tappers and loggers) have begun to engage in some kind of simple processing such as production of dried (cup lump, scraps, sheets, and crepe rubber) and some wood primary products (dried wood, various graded wood). Almost all upstream production in Thailand is consumed as inputs into the domestic midstream industry since their products are cradles for midstream processing facilities; midstream productions, or natural rubber processors, take rubber produced from plantations and convert this into intermediate products, (ribbed smoked sheets (RSS), technically specified rubber (TSR), concentrated latex, compound rubber and skim rubber) and wood products (chipped/ground wood, sawdust and wood wastes) which variously have the qualities and properties required as inputs to downstream manufacturers in both domestic and international markets; and downstream producers, or producers of rubber products (tires, latex gloves, condoms, elastics, rubber shoes, chemicals and adhesives, etc.) and wood and energy-related merchandise (particle boards, furniture, and wood pellets and briquettes). However, the reality of rubber supply chain in Hat Yai district begins on the plantation, where rubber farmers grow fresh latex that is preprocessed into simple rubber products such as field latex, unsmoked sheets, and cup-lumps. These resulting products are sold via defined local market traders, which may include the general market, cooperatives, and dealers. These traders deliver the primary rubber products to the processing plants, which process the intermediate rubber products such as rubber blocks, concentrated latex, and other types before supplying them to domestic or export manufacturing customers. Moreover, from the findings of this work, most farmers supply fresh latex, implying that the preprocessing is achieved mostly by rubber cooperatives who act as middlemen and preprocessors, thereby interfering with farmers’ opportunity of value addition to maximize profit [46]. This could be attributed to the fact that most farmers do not have access to preprocessing technology such as rollers and other accessories for rolling unsmoked sheets or have the requisite ‘know–how’ of the process. The same scenario is applicable to the parawood supply chain. Typically, dealers or middlemen purchase wood from rubberwood plantations, and they are also responsible for wood supply. Over the last decade, about 80% of Thai sawn parawood has been exported, mostly to China, Vietnam, and Malaysia, with the remaining 20% being used in Thai furniture plants [39].

5. Conclusions

Although the rubber tree remains a significant global resource, Thailand is a significant global supplier, with most of the production coming from the country’s southern region, where the resource has remained an economic gem, involving farmers, processors, manufacturers, and other related stakeholders in a traditional supply chain. For both farmers and processors common operational challenges relates to product low prices and unstable economic situation. The rate of para rubber plantation expansion may eventually stagnate due to threshold attainment of available and accessible land owned by farmers, identified as key constraints responsible for stagnant expansion. However, numerous enterprises and products derivable from the rubber feedstock value chain were identified in this work. Furthermore, the rubber feedstock supply tiers presented some specific outcomes, which can reinforce the rubber feedstock value addition points to be effective and sustainable. One key inferred factor depressing the production capacity may be the scarcity of a well-established and organized inclusive supply and marketing network that promotes value addition, regulates profit margins, provides price insurance, and provides business support services to participating actors. This way, renewed interest can be generated because everyone benefits; the more efficient the scheme, the more valuable and exciting it becomes. Even though, this study has two important shortcomings that could be addressed in future research. First, the spatial scope of the evaluation was limited by the study’s design, sample size, and data access. Second, the investigation centered on rubber producers and processors, limiting the data analysis to these categories of actors in the sector. These findings have brought to the spotlight important aspects of the para rubber sector for further investigations; the authors plan to research further into the potentials associated with this resource for facilitating circular economy transition for sustainable development in the study area.

Author Contributions

Conceptualization, J.N.S.; methodology, J.N.S. and N.N.; software, J.N.S. and N.N.; validation, K.E.O.; formal analysis, K.E.O.; investigation, S.C., R.K. and K.T.; resources, K.E.O.; data curation, N.N.; writing—original draft preparation, J.N.S.; writing—review and editing, M.S.K.S. and J.N.S.; supervision, N.N. and K.T.; Validation, M.S.K.S.; project administration, S.C., R.K. and K.T.; funding acquisition, R.K. and S.C. All authors have read and agreed to the published version of the manuscript.

Funding

This research was supported by Prince of Songkla University under grant number ENV6502112N. This work was also funded by Geo-Informatics and Space Technology Development Agency (Public Organization): GISTDA.

Conflicts of Interest

The authors declare no conflict of interest.

References

  1. Rubber Board. The Rubber Tree 2015. Available online: http://www.rubberboard.org.in/public (accessed on 15 August 2020).
  2. Liu, R.; Yang, L.; He, C. Analysis on the Dynamics between Price and Production of Natural Rubber in the World. Guangxi Acad. Agric. Sci. 2019, 50, 2359–2367. [Google Scholar]
  3. Tiseo, I.; Chemicals & Resources Plastic & Rubber/Statista. Global Production of Natural Rubber 2000–2020. Chemicals & Resources. 2021. Available online: https://www.statista.com/statistics/275387/global-natural-rubber-production/ (accessed on 11 September 2021).
  4. International Rubber Study Group Statistical Summary of World Rubber Situation. 2015. Available online: http://www.rubberstudy.com/documents/WebSiteData_Aug2015.pdf (accessed on 20 September 2020).
  5. Sharib, S.; Halog, A. Enhancing Value Chains by Applying Industrial Symbiosis Concept to the Rubber City in Kedah, Malaysia. J. Clean. Prod. 2017, 141, 1095–1108. [Google Scholar] [CrossRef]
  6. Oktora, S.I.; Firdani, A.M. Natural Rubber Economics between China and Southeast Asia: The Impact of China’s Economic Slowdown. J. Asian Financ. Econ. Bus. 2019, 6, 55–62. [Google Scholar] [CrossRef]
  7. Ruamsook, K.; Thomchick, E. Market Opportunity for Lignocellulosic Biomass Background Paper: Multi-Tier Market Reference Framework; Center for Supply Chain Research Department of Supply Chain & Information Systems Smeal College of Business: Philadelphia, PA, USA, 2014; pp. 1–109. [Google Scholar]
  8. Win, H.E. Economic Importance of Rubber in Thailand; Food and Fertilizer Technology Center for the Asian and Pacific Region (FFTC-AP): Bangkok, Thailand, 2017; Available online: https://ap.fftc.org.tw/article/1240 (accessed on 18 July 2019).
  9. Rubber Research Institute of Thailand Thailand Rubber Statistics 2019. Available online: https://www.researchgate.net/institution/Rubber_Research_Institute_of_Thailand (accessed on 23 November 2021).
  10. Sirimaporn, L.; Jing, Z.; Jiajun, Z.; Tianxiang, L.; De, Z. Rubber Crop Diversity and Its Infuential Factors in Thailand. J. Rubber Res. 2021, 24, 461–473. [Google Scholar] [CrossRef]
  11. Emery, R. Thailand’s Rubber Price Issues Not Caused by Lack of Rubber Processing 2016. Available online: https://tdri.or.th/en/2016/03/rubber-price-problem2/ (accessed on 6 December 2020).
  12. Kongmanee, C.; Ahmed, F. Assessing Socio-Economic Characteristics of FSC Certified Rubber Farmers and Their Attitudes to Apply FSC Standards in Rubber Plantation: A Case Study in Thailand. Int. J. Manag. (IJM) 2020, 11, 1359–1372. [Google Scholar]
  13. Saosee, P.; Sajjakulnukit, B.; Gheewala, S.H. Feedstock Security Analysis for Wood Pellet Production in Thailand. Energies 2020, 13, 5126. [Google Scholar] [CrossRef]
  14. Thaiturapaisan, T. Thailand’s Drought Crisis 2016: Understanding It without the Panic. SCB Economic Intelligence Centre. 2016. Available online: https://www.scbeic.com/en/detail/product/2127 (accessed on 24 March 2019).
  15. Arias, M. What Is Natural Rubber and Why Are We Searching for New Sources? Front. Young Minds. 2019, 7, 100. [Google Scholar] [CrossRef]
  16. European Commission. Directorate-General for Research and Innovation. In Study on Impacts of EU Actions Supporting the Development of Renewable Energy Technologies; Publications Office: Copenhagen, Denmark, 2019. [Google Scholar]
  17. Men, X.; Wang, F.; Chen, G.-Q.; Zhang, H.-B.; Xian, M. Biosynthesis of Natural Rubber: Current State and Perspectives. IJMS 2018, 20, 50. [Google Scholar] [CrossRef]
  18. Njakou Djomo, S.; Ac, A.; Zenone, T.; De Groote, T.; Bergante, S.; Facciotto, G.; Sixto, H.; Ciria Ciria, P.; Weger, J.; Ceulemans, R. Energy Performances of Intensive and Extensive Short Rotation Cropping Systems for Woody Biomass Production in the EU. Renew. Sustain. Energy Rev. 2015, 41, 845–854. [Google Scholar] [CrossRef]
  19. Yan, P.; Xiao, C.; Xu, L.; Yu, G.; Li, A.; Piao, S.; He, N. Biomass Energy in China’s Terrestrial Ecosystems: Insights into the Nation’s Sustainable Energy Supply. Renew. Sustain. Energy Rev. 2020, 127, 109857. [Google Scholar] [CrossRef]
  20. Kasikorn Research Center. Market Opportunity of Wood Pellet in Thailand; Kasikorn Research Center: Bangkok, Thailand, 2019; Available online: https://kasikornresearch.com/th (accessed on 4 October 2020).
  21. Silalertruksa, T.; Gheewala, S.H. Security of Feedstocks Supply for Future Bio-Ethanol Production in Thailand. Energy Policy 2010, 38, 7476–7486. [Google Scholar] [CrossRef]
  22. Usmani, R.A. Potential for Energy and Biofuel from Biomass in India. Renew. Energy 2020, 155, 921–930. [Google Scholar] [CrossRef]
  23. Saosee, P.; Sajjakulnukit, B.; Gheewala, S.H. Environmental Externalities of Wood Pellets from Fast-Growing and Para-Rubber Trees for Sustainable Energy Production: A Case in Thailand. Energy Convers. Manag. X 2022, 14, 100183. [Google Scholar] [CrossRef]
  24. Hytönen, J.; Nurmi, J.; Kaakkurivaara, N.; Kaakkurivaara, T. Rubber Tree (Hevea Brasiliensis) Biomass, Nutrient Content, and Heating Values in Southern Thailand. Forests 2019, 10, 638. [Google Scholar] [CrossRef]
  25. Kampan, P. Sustainability and Competitiveness of Thailand’s Natural Rubber Industry in Times of Global Economic Flux. ASS 2017, 14, 169. [Google Scholar] [CrossRef]
  26. Kittitornkool, J.; Kaewwongsri, P.; Tongkam, P.; Bumrungsri, S.; Sawangchote, P. Livelihoods of Small-Scale Rubber Farmers: A Comparative Study of Rubber Agroforestry Systems and Monocropping Rubber Plots in Southern Thailand. Kasetsart J. Soc. Sci. 2019, 40, 420–426. [Google Scholar]
  27. Fischer, G.; Prieler, S.; van Velthuizen, H.; Berndes, G.; Faaij, A.; Londo, M.; de Wit, M. Biofuel Production Potentials in Europe: Sustainable Use of Cultivated Land and Pastures, Part II: Land Use Scenarios. Biomass Bioenergy 2010, 34, 173–187. [Google Scholar] [CrossRef]
  28. Lo, L. Diversity, Security, and Adaptability in Energy Systems: A Comparative Analysis of Four Countries in Asia. 3 November 2011, pp. 2401–2408. Available online: https://www.researchgate.net/publication/269131265_Diversity_Security_and_Adaptability_in_Energy_Systems_a_Comparative_Analysis_of_Four_Countries_in_Asia (accessed on 25 July 2019).
  29. Cherian, S.; Ryu, S.B.; Cornish, K. Natural Rubber Biosynthesis in Plants, the Rubbertransferase Complex, and Metabolic Engineering Progressand Prospects. Plant Biotechnol. J. 2019, 17, 2041–2061. [Google Scholar] [CrossRef]
  30. Salehi, M.; Cornish, K.; Bahmankar, M.; Naghavi, M.R. Natural Rubber-Producing Sources, Systems, and Perspectives for Breeding and Biotechnology Studies of Taraxacum Kok-Saghyz. Ind. Crops Prod. 2021, 170, 113667. [Google Scholar] [CrossRef]
  31. Smyth, C.; Kurz, W.A.; Rampley, G.; Lemprière, T.C.; Schwab, O. Climate Change Mitigation Potential of Local Use of Harvest Residues for Bioenergy in Canada. GCB Bioenergy 2017, 9, 817–832. [Google Scholar] [CrossRef]
  32. Dias, G.M.; Ayer, N.W.; Kariyapperuma, K.; Thevathasan, N.; Gordon, A.; Sidders, D.; Johannesson, G.H. Life Cycle Assessment of Thermal Energy Production from Short-Rotation Willow Biomass in Southern Ontario, Canada. Appl. Energy 2017, 204, 343–352. [Google Scholar] [CrossRef]
  33. Stolarski, M.J.; Szczukowski, S.; Tworkowski, J.; Wróblewska, H.; Krzyżaniak, M. Short Rotation Willow Coppice Biomass as an Industrial and Energy Feedstock. Ind. Crops Prod. 2011, 33, 217–223. [Google Scholar] [CrossRef]
  34. Quirion-Blais, O.; Malladi, K.T.; Sowlati, T.; Gao, E.; Mui, C. Analysis of Feedstock Requirement for the Expansion of a Biomass-Fed District Heating System Considering Daily Variations in Heat Demand and Biomass Quality. Energy Convers. Manag. 2019, 187, 554–564. [Google Scholar] [CrossRef]
  35. Zhang, X.; Luo, K.; Tan, Q. A Feedstock Supply Model Integrating the Official Organization for China’s Biomass Generation Plants. Energy Policy 2016, 97, 276–290. [Google Scholar] [CrossRef]
  36. Bentancor, L.; Hernández, J.; del Pino, A.; Califra, Á.; Resquín, F.; González-Barrios, P. Evaluation of the Biomass Production, Energy Yield and Nutrient Removal of Eucalyptus Dunnii Maiden Grown in Short Rotation Coppice under Two Initial Planting Densities and Harvest Systems. Biomass Bioenergy 2019, 122, 165–174. [Google Scholar] [CrossRef]
  37. Nosa Betty, A. Natural Rubber Value Chains: A Game Changer for Smallholders; Rubber Research Institute of Nigeria: Abuja, Nigeria, 2018; pp. 1–34. [Google Scholar]
  38. Somboonsuke, B.; Shivakoti, G.P.; Demaine, H. Agricultural Sustainability through Empowerment of Rubber Smallholders in Thailand. Asia-Pac. J. Rural. Dev. 2001, 11, 65–89. [Google Scholar] [CrossRef]
  39. Albarracín, G.; Kalame, F.B.; Glover, E.; Koskipää, T.; Makkonen, S.; Na, C. Rubber Plantations in Southern Thailand: Management and Social and Economic Functions; Group report for “Tropical Forest Landscape Restoration in SE Asia: Proceedings of EU Asia Link FORRSA Course, Thailand. 2006, Volume 28. Available online: https://patricklepetit.jalbum.net/_AGRICULTURE/LIBRARY/Rubber%20Plantations.pdf (accessed on 4 July 2022).
  40. Viswanathan, P.K. Emerging Smallholder Rubber Farming Systems in India and Thailand: A Comparative Economic Analysis. Asian J. Agric. Dev. 2008, 5, 20. [Google Scholar]
  41. Adomi, E.E.; Ogbomo, M.O.; Inoni, O.E. Gender Factor in Crop Farmers’ Access to Agricultural Information in Rural Areas of Delta State, Nigeria. Libr. Rev. 2003, 52, 388–393. [Google Scholar] [CrossRef]
  42. Poungchompu, S.; Chantanop, S. Factor Affecting Technical Efficiency of Smallholder Rubber Farming in Northeast Thailand. Am. J. Agric. Biol. Sci. 2015, 10, 83–90. [Google Scholar] [CrossRef]
  43. Sriyalatha, M.A.K. Factors Affecting Natural Rubber Production: Case Studyof Small Rubber Farmers In Kalutara District, Sri Lanka. IOSR J. Bus. Manag. (IOSR-JBM) 2018, 20, 64–73. [Google Scholar]
  44. Giroh, D.Y. Analysis of Improved Production Practices in Small Holder Natural Rubber Plantation for Sustainable Natural Rubber Industry in Nigeria. Eur. J. Appl. Sci. 2020, 9, 1–15. [Google Scholar]
  45. Chanchaichujit, J.; Saavedra-Rosas, J.F. The Elements of the Natural Rubber Industry Supply Chain. In Using Simulation Tools to Model Renewable Resources: The Case of the Thai Rubber Industry; Chanchaichujit, J., Saavedra-Rosas, J.F., Eds.; Springer International Publishing: Cham, Switzerland, 2018; pp. 19–40. ISBN 978-3-319-55816-5. [Google Scholar]
  46. Chambon, B.; Duangta, K.; Promkhambut, A.; Lesturgez, G. Field Latex Production in Southern Thailand: A Study on Farmers’ and Traders’ Practices That May Affect the Quality of Natural Rubber Latex Delivered to the Factories. J. Rubber Res. 2020, 23, 125–137. [Google Scholar] [CrossRef]
Figure 1. (A) Analysis of para rubber plantation ownership. (B) Analysis of the purpose of establishing para rubber plantations. (C) Analysis of secondary benefits derived from plantation. (D) Analysis of willingness to expand plantations with reasons by respondents (Para rubber farmers).
Sustainability 14 10142 g001
Figure 2. (A) Analysis of the source of funding for running the plantation. (B) Analysis of the main category of products produced and sold. (C) Analysis of utilization of income from plantation. (D) Analysis of challenges associated with the plantations by the respondents (para rubber farmers).
Sustainability 14 10142 g002
Figure 3. (A) Analysis of type of products handled. (B) Quantity of annual production. (C) wiliness to expand business by the respondents (para rubber processors).
Sustainability 14 10142 g003
Table 1. Distribution of Respondents Sampled.
Category of RespondentsLocationNumber of Sampled RespondentsNumber of Valid for StudyResponse Rate (%)
Para rubber farmersKhuan Lang88100
Khu Tao8787.5
Kho Hong8787.5
Khlong Hae88100
Khlong U Ta Phao8787.5
Chalung88100
Thung Yai8787.5
Thung Tam Sao88100
Tha Kham88100
Nam Noi8787.5
Ban Phru88100
Pha Tong8675
Subtotal968992.71
Para rubber processors Hat Yai (Dry Latex cluster)7685.7
Hat Yai (Wet Latex cluster)77100
Hat Yai (Parawood cluster)77100
Subtotal212095.24
Total 11710993.2
Computed from surveyed data.
Table 2. Conversion factor for three processor clusters.
VariableDry Latex ClusterWet Latex ClusterParawood Cluster
Raw material (ton)356,190571,300318,400
Product produced (ton)285,900358,900239,290
Conversion factor (Raw material/Product produced)1.231.591.33
Average conversion factor1.38
Table 3. Demographic distribution analysis of para rubber farmers and processors respondents.
Para Rubber FarmersPara Rubber Processors
Variable Description NN TotalN%VariableDescriptionNN TotalN%
SexMale578964SexMale112055
Female328936Female92045
Farmer age range10–303893Processor age range10–3032015
31–5031893531–5072035
51–7045895151–7092045
>70108911>701205
Mean54.489 Mean48.420
Median55.2 Median50.5
Farmer family size1–23893Processor family size1–252025
3–45089563–492045
5–63089345–642020
7–858967–81205
>81891>81205
Mean4.489 Mean3.920
Median4.2 Median3.6
Farmer educational levelElementary368940Processor educational levelElementary32015
Secondary168918Secondary42020
Tertiary228925Tertiary62030
Vocational158917Vocational72035
N is number of responses.
Table 4. Distribution analysis of para rubber plantation ages, sizes and land use owned by respondents (para rubber farmers).
VariablesDescriptionNN TotalN%
Plantation age6–108899
11–15338937
16–20308934
21–256897
26–306897
31–354894
>352892
Mean17.489
Median16.1
Plantation size (in Hectares)0.16–0.8108911
0.96–1.6258928
1.76–2.4228925
2.56–3.2138915
3.36–4.05896
4.16–4.84895
4.96–5.64894
5.76–6.43893
10.56–11.21891
>11.22892
Mean2.689
Median12.7
Plantation land useNo integration278930
Integrated with Papaya138915
Integrated with Pineapple108911
Integrated with Vegetables8899
Integrated with Banana8899
Integrated with Durian5896
Integrated with Rambutan5896
Integrated with Jackfruit5896
Integrated with Coconut4894
Integrated with Others4894
N is the number of responses.
Table 5. Distribution analysis of monthly income and expenditure and plantation annual production and income generation by the respondents (Para rubber farmers).
VariableDescriptionNN TotalN%
Monthly income (USD)<310.194895
310.19–930.58438948
961.60–1861.16358939
1892.18–3101.935896
>3101.932892
Mean1079.0589
Median908.22
Monthly expenditure (USD)<310.19168918
310.19–930.58368940
961.60–1861.16328936
1892.18–3101.934895
>3101.931891
Mean937.03
Median810.38
Annual fresh latex production (kg)1000–5999218924
6000–10,999348938
11,000–15,999158917
16,000–20,9996897
21,000–25,9993893
26,000–30,9998899
>30,0002892
Mean9455.489
Median8030.8
Wood production in seven (7) years (logs)10–1009728981
1010–20092892
2010–30096897
3010–40094895
4010–50091891
5010–60093893
>60091891
Mean1082.589
Median627.4
Annual income from para rubber products (USD)31.02–3101.93378942
3132.95–6203.86208922
6234.88–9305.79148916
9336.81–12,407.725896
12,438.74–15,509.654895
15,540.67–18,611.583893
18,642.60–21,713.512892
21,744.53–24,815.442892
24,846.45–27,917.361891
>27,917.361891
Mean6341.3589
Median4280.66
N is the number of responses.
Table 6. Determinants of para rubber farmers latex feedstock supply in Hat Yai district.
FactorCoefficientStandard Errort-Valuep-Value
Average latex supply3528.12822.61.250.215
Plantation size1310.1388.33.370.001 **
Plantation Age−115.2136.6−0.840.401
Other farms owned608.4316.21.920.058
Purpose of plantation
Extra income1
Main livelihood4676.41752.32.670.009 **
Others1674.82757.80.610.545
Intercropping
No1
Yes4107.81593.62.580.011 *
** p-value < 0.01; * p-value < 0.05.
Table 7. Determinants of para rubber farmers woody feedstock supply in Hat Yai district.
FactorCoefficientStandard Errort-Valuep-Value
Average parawood supplied271.52619.150.440.662
Plantation size246.1985.182.890.005 **
Plantation Age−19.8829.97−0.660.509
Other farms owned−24.4969.36−0.350.725
Purpose of plantation
Extra income1
Main livelihood471.53384.391.2270.223
Others237.66604.940.3930.695
Intercropping
No1
Yes234.93349.580.6720.503
** p-value < 0.01.
Table 8. Distribution analysis of operation duration processing, workforce, and annual income generation from para rubber by the respondents (Para rubber processors).
VariableDescriptionNN TotalN%
Number of years of operation1–1752025
18–2862030
29–3962030
40–501205
>5022010
Mean27.920
Median26.7
Workforce10–2422010
25–3932015
40–5472035
55–691205
85–9922010
100–12042020
>1201205
Mean63.820
Median50.2
Annual income (Million USD)<1.2442020
1.24–1.8622010
1.89–2.481205
2.51–3.101205
>3.10122060
Mean2.5520
N is the number of responses.
Table 9. Theoretical para rubber feedstock potential for three cluster of processors.
VariableQuantity (Tons)CFTQ (Tons)PQ (Tons)
Theoretical feedstock production311,4731.331,245,890831,630.91
Wet latex cluster (41%)127,7041.33510,815340,968.68
Dry latex cluster (29%)90,3271.33361,308241,173.09
Parawood cluster (30%)93,4421.33373,767249,489.14
Table 10. Para rubber feedstock diversity analysis based on its tiers of supply chain in Hat Yai.
Category Actors PopulationObservations (N)Mean (μ)Standard Deviation (σ)Variance (σ²)Simpson’s Index (D)Simpson’s Reciprocal Index (1/D)Simpson’s Diversity Index (1-D)
Tier 1Agro input suppliers 7410.32.868.190.253.980.75
Tier 2Rubber farmers 8
Tier 3Cooperative dealers14
Tier 4Industrial biorefineries12
Table 11. Para rubber feedstock supply tiers and economic opportunity potentials.
TiersTier 1Tier 2Tier 3Tier 4
Variable
Input Suppliers-Rubber seedling nurseries
-Agro input shops
-Rubber cooperative societies
-Government agencies
-Para rubber farmers
-Rubber community cooperative societies
-Loggers
-Cooperative dealers
-Sawmills
-Industrial biorefineries
-Wood-based panel processing
Key Activities-Growing
-Managing
-Harvesting
-Screening raw biomass materials
-Grading raw biomass materials
-Refine raw biomass
-Produce refined and intermediate products
-Manufacture industrial biomaterials
-Process industrial biomaterial for specific uses
Operators/Potential customer-Para rubber plantations
-Tappers
-Loggers
-Preprocessors (Cooperative dealers)
-Sawmills
-Industrial biorefineries
-Wood-based panel processing
-Manufacturing industries
Key Products tradedEnergyNon- EnergyEnergyNon-EnergyEnergyNon-EnergyEnergyNon-Energy
-Parawood
-Twigs
-Stump
-firewood
-Fresh latex
-Cup lump
-Parawood
-Graded energy wood (various dimensions)
-Charcoal
-Dried wood
-Natural rubber latex (low & high ammonia)
-Latex coagulate grades (STR5L & STR5CV60)
-Uncooked
sheet (STR10, STR10CV, STR20 & STR20CV)
-Ribbed smoked sheet (RSS1, RSS2, RSS3, RSS4, &
RSS5)
-Graded wood (various dimensions)
-Ground wood
-Chipped wood
-waste wood
-Sawdust
-Ribbed smoked sheet (RSS)
-Air dried sheet
-Concentrated Latex
-Compound Rubber
-Skim crepe
-Skim Block
-Standard Thai rubber block
-Ground wood
-Chipped wood
-Wooden containers and frames
-Wood pellets
-Briquettes
-Various automobile parts e.g., (Tires, fan belt, radiator hose)
-Various rubber packaging and other materials e.g., rubber bands, toys, bathroom slippers
-Medical items e.g., (Gloves and Condoms)
-Various rubber- based chemicals e.g., (resins, foam, adhesives, and paints)
-Furniture. e.g., (tables and chairs)
-Poles and scaffoldings
-Cellulosic fibers
-Particle boards
-Parquet board
-Dehydrated wood coatings
Publisher’s Note: MDPI stays neutral with regard to jurisdictional claims in published maps and institutional affiliations.

