Article

Quantifying Co-Benefits and Trade-Offs between Forest Ecosystem Services in the Gan River Basin of South China

1
Key Laboratory of Land Surface Pattern and Simulation, Institute of Geographical Sciences and Natural Resources Research, Chinese Academy of Sciences, Beijing 100101, China
2
National Marine Data and Information Service Center, Tianjin 300171, China
3
College of Horticulture Science and Technology, Hebei Normal University of Science and Technology, Qinhuangdao 066004, China
4
Department of Computational Social Science, George Mason University, 4400 University Drive, Fairfax, VA 22030, USA
*
Author to whom correspondence should be addressed.
Sustainability 2022, 14(14), 8271; https://doi.org/10.3390/su14148271
Submission received: 17 April 2022 / Revised: 22 May 2022 / Accepted: 31 May 2022 / Published: 6 July 2022

Abstract

:
Forest ecosystem services are intrinsically linked. We design a spatially explicit approach to quantify and analyze the co-benefits and trade-offs between the main forest ecosystem services. Our goal is to develop criteria for forest management that include ecosystem service interactions. Chinese fir and pine plantations provide the largest portion of the overall ecosystem services currently provided. They are volume stock and water yield service hotspots, but these have negative effects on soil retention and carbon storage, causing environmental problems. The natural forests (broad-leaf and bamboo forests) are carbon storage and volume stock hotspots and show the lowest erosion modulus. Thus, their protection, combined with expanding the plantation area under forest management should be considered in order to increase ecosystem service synergies. In contrast, an increased area of broad-leaf plantations reduces water yield service due to their lower water production capacity, in comparison with plantations of fast-growing species. Our study shows that the inclusion of ecosystem services as part of forest management could provide opportunities for optimal allocation of forest resources and sustainable utilization. Management based only on economically beneficial ecosystem services can be detrimental to the forest ecosystem and can cause environmental problems.

1. Introduction

Forests are the most biologically diverse ecosystems on land, home to more than 80% of the terrestrial species of animals, plants and insects. They also provide shelter, jobs and security for forest-dependent communities [1,2], around 1.6 billion people, including more than 2000 indigenous cultures, who depend on forests for their livelihood. In response to the need to quickly produce large quantities of wood products, the global plantation area was increased by over 3.2 million ha between 2010 and 2015, whereas natural forest area decreased by 6.5 million ha [3,4,5,6]. This reduced ecological benefits and caused environmental problems such as soil or biodiversity loss or increased damage by forest pests [1,7,8,9]. For better protection and utilization of forest resources, the United Nations Sustainable Development Goal 15 proposed to “protect, restore and promote sustainable use of terrestrial ecosystems, sustainably manage forests, combat desertification, and halt and reverse land degradation and halt biodiversity loss”; it also mentioned the importance of implementing policies, plans, research and projects on management, conservation and sustainable development of all types of forests and forest-based resources. This also includes forest lands and other areas from which forest benefits can be derived. Forests can provide multiple ecosystem services (e.g., carbon sequestration, water yield and timber); thus, research attention has recently been focused on ecosystem services and their interactions [10,11,12,13] in an effort to develop strategies to conserve and manage forests. The perspective of ecosystem services clearly can contribute to developing sound forest management policies and planning actions [14]. However, it remains unclear how ecosystem services relate to different types or different regions and to what extent forest resource allocation will ensure the sustainability of ecosystem services [15,16]. Some environmental managers have discussed the relationship between ecosystem services and forest fragmentation, in relation to forest diversity and forest cover change, from a regional perspective [17,18,19,20,21]. They concluded that ecosystem services are connected with many characteristics of forest resources and that different regions (and types) of forest resources might need different management strategies [15,22,23].
Quantifying and mapping ecosystem services has proven to be an effective method to understand the spatial relationships between ecosystem services [2,24,25], but quantifying the levels and values of these relationships has proven difficult [25]. The reported synergy or trade-off relationships between forest ecosystem services often differ from one study to the next [2,26,27,28], leading to the application of different management strategies for different regions [14,29]. There is a need to investigate the interactions of ecosystem services in the world at different levels, from global to regional to local scales.
The red soil hilly region in South China presents a good opportunity to study the relationships between, and spatial heterogeneity of, forest ecosystem services, due to its long history and forest ecosystem diversity [30]. This region supports large areas of natural secondary forest, as well as Chinese fir (Cunninghamia lanceolate) and Masson pine (Pinus massoniana) plantations. These are useful for comparison of ecosystem services in an artificial forest versus a natural forest. Our study focused on the Gan River Basin (GRB), which included 18 nature reserves with typical broad-leaf forest ecosystems of native tree species (e.g., Castanopsis fargesii, Schima superba and Cinanmomum camphora). These reserves are important for maintaining the stability of the local environment and for preserving areas subject to little recent human disturbance [31,32,33]. Currently, only about 14% of the forest ecosystems in the GRB are natural, and the rest are plantation forests [34,35,36]. Management plans for forests and sustainable development have been proposed by the local Forest Bureaus, but they have been independent, fragmented and applied slowly due to, among other causes, the conflict of interest between the stakeholders. A new overall forest management plan must be proposed by the local Forest Bureaus to reconcile the conservation of the forest or other natural resources with their sustainable use and to promote the implementation of ecological compensation for nature reserves. Thus, this area is an appropriate place to define forest management strategies that are based on ecosystem service interactions. With this study, we attempted to evaluate the spatial co-benefits or possible trade-offs between forest ecosystem services that might help in developing a forest management strategy to achieve maximum overall benefits of multiple ecosystem services.
The aim of the study is to determine the spatial distribution and congruence among the carbon storage, water supply, soil water retention and volume accumulation services that are likely to appeal to stakeholders when defining the forest management strategies. We examine the synergies and trade-offs between different ecosystem services on a regional scale, and based on forest type, to illustrate the implications of developing a forest management plan that could coordinate with the local environment and maximize the supply of ecosystem services. The study aims to answer the following questions: (i) How much of the study area produces each service, and how much of each service is generated by each forest type? (ii) For the whole region and for different forest types, to what extent do the four ecosystem services overlap? (iii) What are typical trade-offs or synergies by forest type, and which forest type is the most important provider of sustainable ecosystem services?

2. Materials and Methods
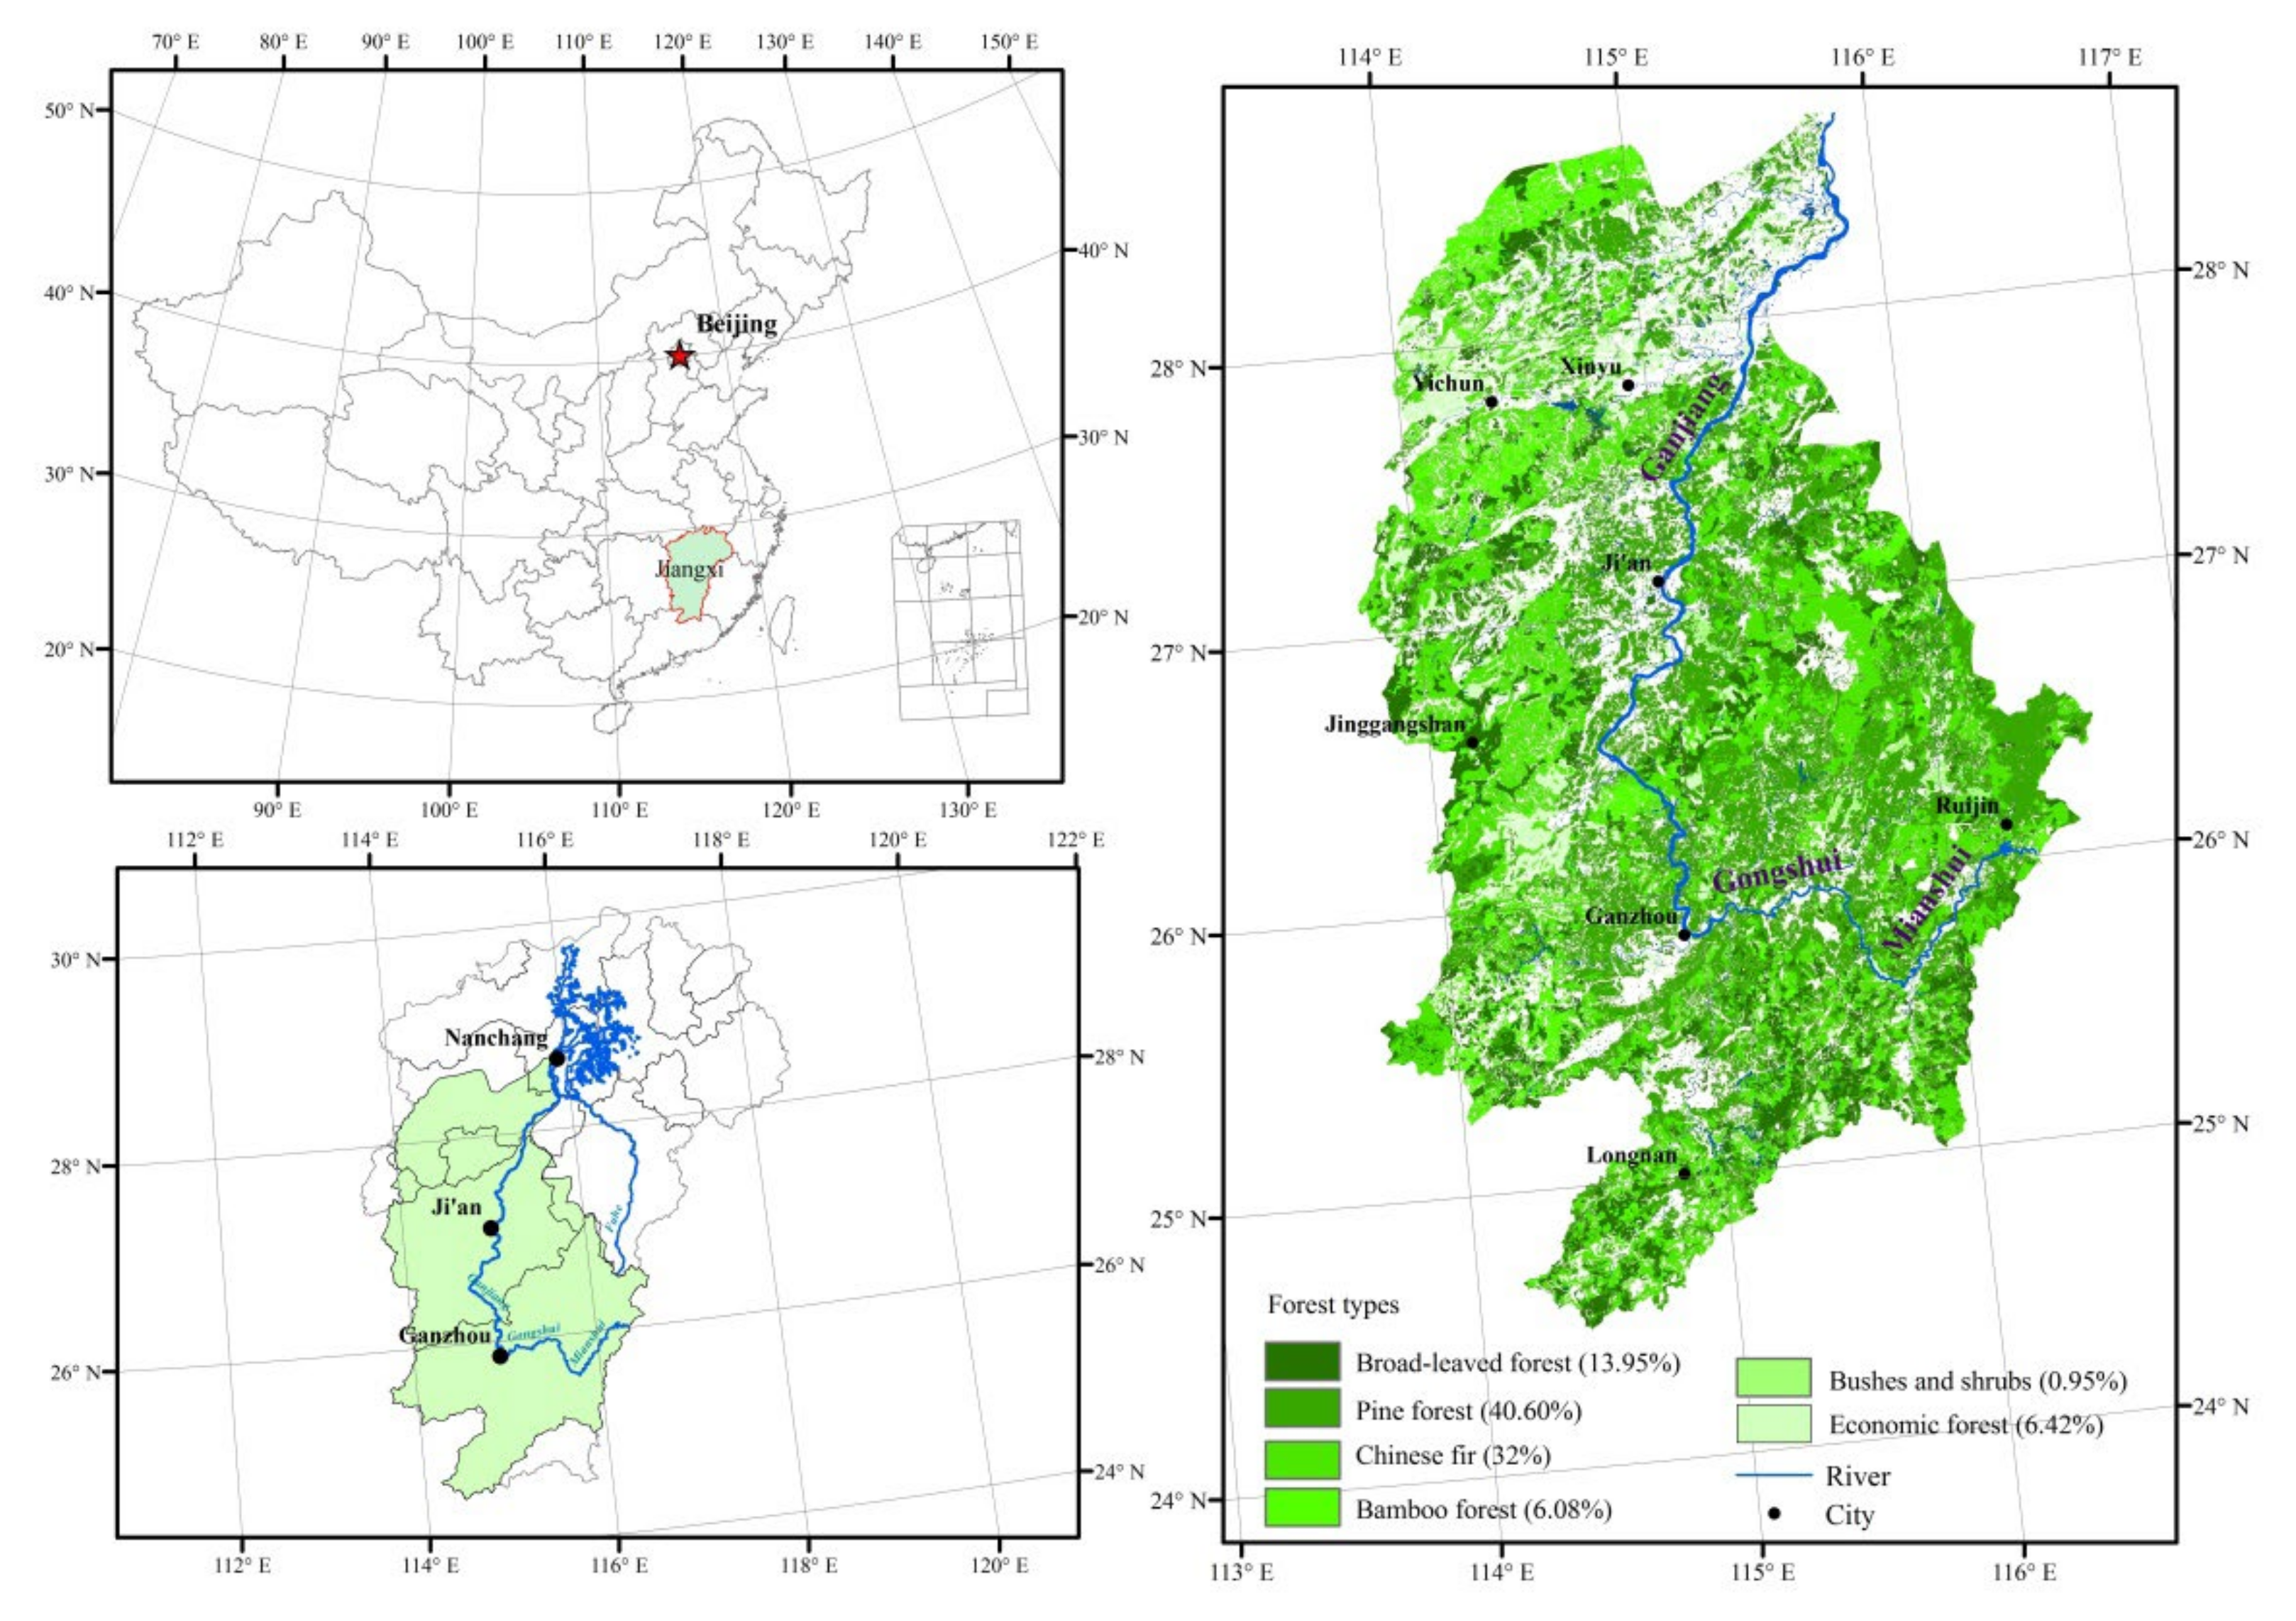
2.1. Study Area

The study was conducted in the Gan River Basin (24°29′–28°42′ N, 113°42′–116°38′ E) (GRB, Figure 1), which is a typical region in the red soil hilly region in South China. The Gan River, one of the eight major tributaries of the Yangtze River, is 823 km long and flows northward into Poyang Lake near the city of Nanchang. The GRB is located in southwestern Jiangxi Province (China) and occupies an area of 83,500 km2, in which the forested area is 6.11 × 10⁴ km2 and the population is approximately 20,000,000 (China statistical yearbook 2012). The basin mainly comprises hilly areas, occupying 64.7% of the total area. The regional economic activity is essentially based on metallurgy, hydropower and the development of local natural resources, particularly timber and forestry by-products. The GRB is characterized by a subtropical monsoon climate. The average temperature is 17.8–19.7 °C, and the distribution of seasonal and annual rainfall is uneven. Less rainfall occurs in autumn and winter, whereas more occurs in spring and summer, averaging 1341–2207 mm annually. The relative humidity is 75–83%. The zonal soil type in the GRB is mountain red soil, which is mainly distributed in regions at elevations below 600 m and is vulnerable to wind erosion. In addition to red soil, yellow, yellow-brown and mountain meadow soils can be found at higher elevations [30,37].
Forests are widely distributed in the GRB (coverage 73.2%). The zonal vegetation is characterized as subtropical broad-leaf forest, dominated by tree species such as Castanopsis fargesii, Schima superba and Cinanmomum camphora, and these have the potential to become the cover vegetation for a great portion of the land in the GRB. However, due to the overuse of forest resources and the “high-intensity harvesting” management strategy during the 19th and 20th centuries, this previous forest largely disappeared and the remainder was spatially fragmented [32]. Currently, the broad-leaf forest occupies a small proportion of its potential area, much of which instead is now plantations of Masson pine or Chinese fir. Indeed, native forest ecosystems throughout the GRB have suffered substantial degradation from the heavy demand for timber production and the spread of rapid-turnover plantations. Presently, plantations occupy 44,344 km2, and a large part of this area is characterized by pure, simple community structure and young trees, spatially clustered and extensively managed. These conditions have given rise to many environmental problems, including decrease in biological diversity, exacerbation of forest pest issues and soil and nutrient loss [35].

2.2. Methodology

2.2.1. Ecosystem Services Evaluation

An integrated approach utilizing ecological models and Geographic Information Systems software was used to quantify and map the main forest ecosystem services in the GRB (Figure 2). The InVEST model (Integrated Valuation of Ecosystem Services and Trade-offs) is a tool widely used for evaluation of ecosystem services and was chosen to assess regional forest ecosystem services in the GRB, including carbon storage, water yield and soil retention. The InVEST model employs a production function approach to ecosystem services based on regional environmental conditions and uses processes to specify its outputs [38].
For carbon storage in forests in the GRB, four carbon “pools” (of each forest type) were aggregated in the carbon module included in the InVEST model, including aboveground biomass, belowground biomass, soil and dead organic matter based on the spatial distribution map of each forest type and the carbon density data from the 6th forest resource inventory (2000–2005) [39]. The main forest types in the GRB were defined based on the Jiangxi Forest Resources Atlas (1:1,000,000) developed by the state forestry administration of the People’s Republic of China in 2008. The main forest types were aggregated into six kinds, including the broad-leaf forest, pine forest, Chinese fir forest, bamboo (Phyllostachys edulis) forest, economic forest (e.g., Camellia oleifera and Castanea mollissima) and the shrubs and bushes (e.g., Cyclobalanopsis myrsinaefolia, Castanopsis eyrei and Maesa japonica) (Figure 1). The spatial distribution map of the six forest types in the GRB was determined by visual interpretation of the TM images in 2010 (http://eds.ceode.ac.cn, accessed on 12 September 2015). The interpretation accuracy was tested using 2056 data plots including the Chinese fir forest 679, pine forest 583, broad-leaf forest 358, bamboo forest 87, economic forest 227 and shrubs and bushes 122 from the 7th forest resource inventory (2005–2010). The overall interpretation accuracy was 88.35%. The Chinese fir forest interpretation accuracy was the highest at 92.57%, whereas the bamboo forest interpretation accuracy was the lowest at 72.94%.
The water yield module included in the InVEST model is based on an assumption of Budyko (1974), indicating that average water storage variables of basins for many years can be negligible, and water yield of a grid arrives at basin outlets via many routes. Therefore, the annual water yield can be obtained by deducting actual evapotranspiration from precipitation to the grid and including the amounts of surface runoff, soil water content, water holding capacity of litter and crown layer interception [38]. Maps of the average annual reference precipitation and average annual reference evapotranspiration are based on interpolation of meteorological data collected in the study area between 2000 and 2010 and made available by the China meteorological data sharing service system (http://cdc.nmic.cn/home.do, accessed on 20 April 2016). Data on the depth to the root restricting layer and the plant available water fraction were offered by the Data Center for Resources and Environmental Sciences, Chinese Academy of Sciences (RESDC) (http://www.resdc.cn, accessed on 12 May 2016). The plant evapotranspiration coefficients for each tree species were selected based on the reports of the FAO (http://www.fao.org/docrep/X0490E/x0490e0b.htm, accessed on 18 May 2016).
The soil retention service of the forest in the GRB was computed by the soil delivery retention module included in the InVEST model, and this module could output the annual amount of soil eroded in the catchment using the revised universal soil loss equation (RUSLE) based on vegetation and topographic features [38]. In running this module, the map of the soil erodibility index was determined based on the Williams (1997) equation [38] and the soil texture data offered by the RESDC. The map of the rainfall erosivity index was calculated using the Wischmeier (1965) method [38] based on monthly meteorological data from the China Meteorological Data Sharing Service System (http://cdc.nmic.cn/home.do, accessed on 26 June 2016). Data for the digital elevation model (DEM) of the GRB were obtained from the Geospatial Data Cloud (http://www.gscloud.cn/, accessed on 15 June 2016), and factors of cover-management and support practice in the different forest types were determined and processed according to the field investigation and methods of Li [40].
The timber module included in the InVEST model can only output maps representing the net values of forests with legally recognized harvests over some user-defined time interval, rather than maps representing current values of forest wood production. For this reason, we preferred to use the CASA model (The Carnegie-Ames-Stanford Approach biosphere model) and integrated it with ArcGIS10.2 software (provided by the Environmental Systems Research Institute, Redlands, CA, USA) as an alternative approach to quantify the forest wood volume service. The CASA model is a satellite-based carbon cycle model and runs monthly intervals to simulate seasonal patterns in net plant carbon fixation, biomass and nutrient allocation and a number of surface observations to explore the trends and spatial patterns of terrestrial vegetation net primary productivity (NPP). Maps of the NPP values were quantified using the CASA model based on the NDVI data from Vision on technology (http://free.vgt.vito.be, accessed on 28 March 2016) and utilizing monthly precipitation, temperature and solar radiation data from the China meteorological data sharing service system. In addition, the wood volumes of different forest types were computed based on the transformation equations presented in related studies conducted by Fang [41] and Zeng [42].
Furthermore, we used 790 plots investigation data from the 7th forest resource inventory, annual river level data of 46 hydrological stations and annual sand delivery data of 10 hydrological stations from the China Ministry of Water Resources to test the evaluation accuracy of the four ecosystem services based on the Pearson double-tail testing method using SPSS19.0 software (provided by International Business Machines Corporation, Armonk, NY, USA). Results showed that the simulated values of the carbon storage service were consistent with previous research results by Wang [39]. Moreover, the simulated and observed values of the water yield service and wood volume service were significantly correlated (R2 = 0.791, p = 0.01 and R2 = 0.617, p = 0.01). That of the soil retention service was less significantly correlated (R2 = 0.479, p = 0.01).

2.2.2. Ecosystem Service Interactions

Because the data for the four ecosystem service variables present different units and ranges in values, a simple statistical approach based on Cademus [5] was used to normalize them, after which they were classified into three levels to ensure they could be compared and were compatible for calculations (Figure 2). This method produced three provision-level classes for each of the four ecosystem services, which were coded 3, 2 and 1, respectively, representing high, medium and low provision levels. The breaking boundaries of each ecosystem service are presented in Table 1. Furthermore, in order to explore the interaction between ecosystem services and to identify service co-benefits and trade-offs, we used a map formula to combine the levels of the four ecosystem services on each pixel into an “ecosystem service bundle” and analyzed its spatial correspondence (Figure 2).

3. Results

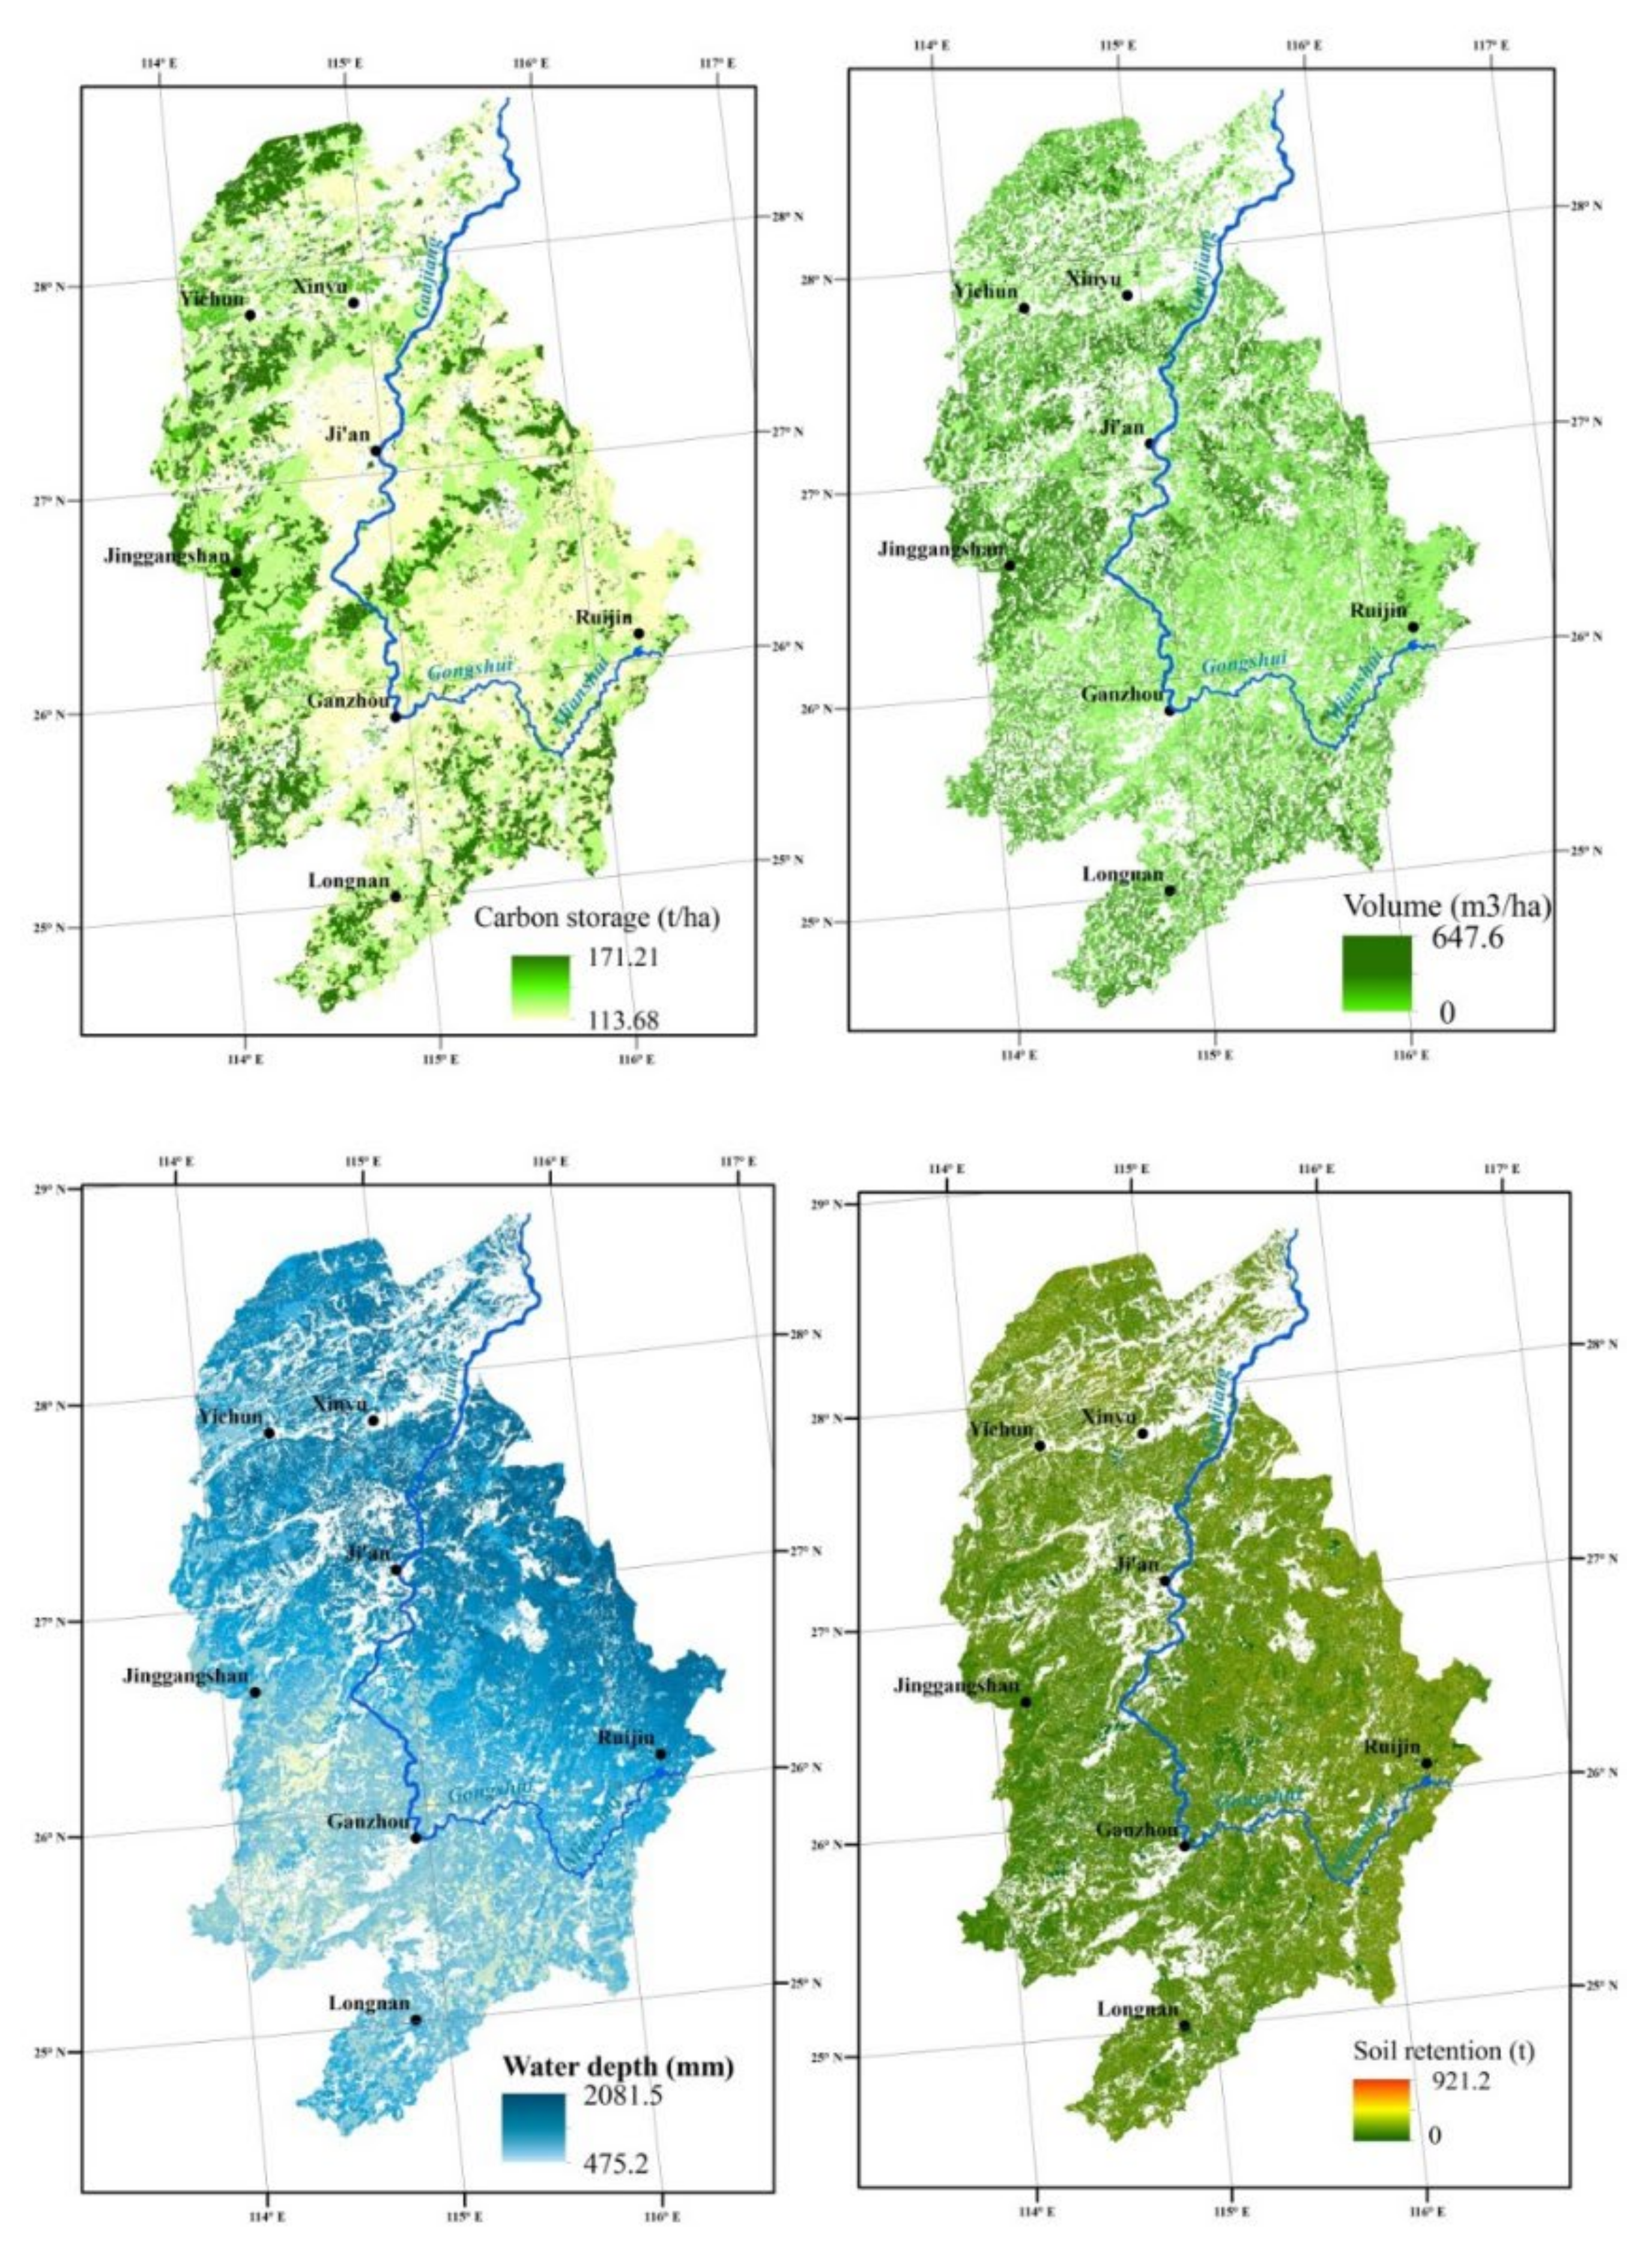
3.1. Spatial Heterogeneity of Services

Results of the ecosystem services evaluation showed that the total carbon storage was up to 0.79 Gt and that the mean carbon density was 135.48 t/ha. The total water production of the GRB was 100.05 billion m3, and the average water supply depth was 1248.88 mm. The wood volume offered by the forests in the GRB was 0.27 billion m3, and the average wood volume per hectare was 43.56 m3. The total soil holding capacity of forests in the GRB was 3.62 billion t, and the average soil holding capacity per hectare was 454.40 t.
The spatial pattern of the four ecosystem services showed heterogeneity (Figure 3). Due to high elevations and low human disturbance levels, forests distributed in the mountainous areas around the GRB provided the largest carbon storage and wood volume accumulation services, whereas plantations distributed in the downstream regions of the GRB provided lower carbon storage and wood volume accumulation services. Benefiting from lower elevation and a humid climate, plantations in the north and the southeast regions of the basin provided important water yield services, whereas forests distributed in the upstream regions of the basin supplied lower water services as a result of high altitude and more mountains. The spatial pattern of the forest soil retention service is closely linked to the topography. Forests in the downstream regions of the basin provided higher soil-holding capacity than those in the upstream regions.
The spatial heterogeneities between the four forest ecosystem services were different from those of the six main forest types, indicating that ecosystem service interactions were not only closely related with individual tree species but also closely linked with specific environmental conditions, so management strategies of the same forest types in different regions may differ. Thus, it is better to integrate service spatial heterogeneities and interactions into forest management decision making rather than simply to change forest types to obtain an expected management response.

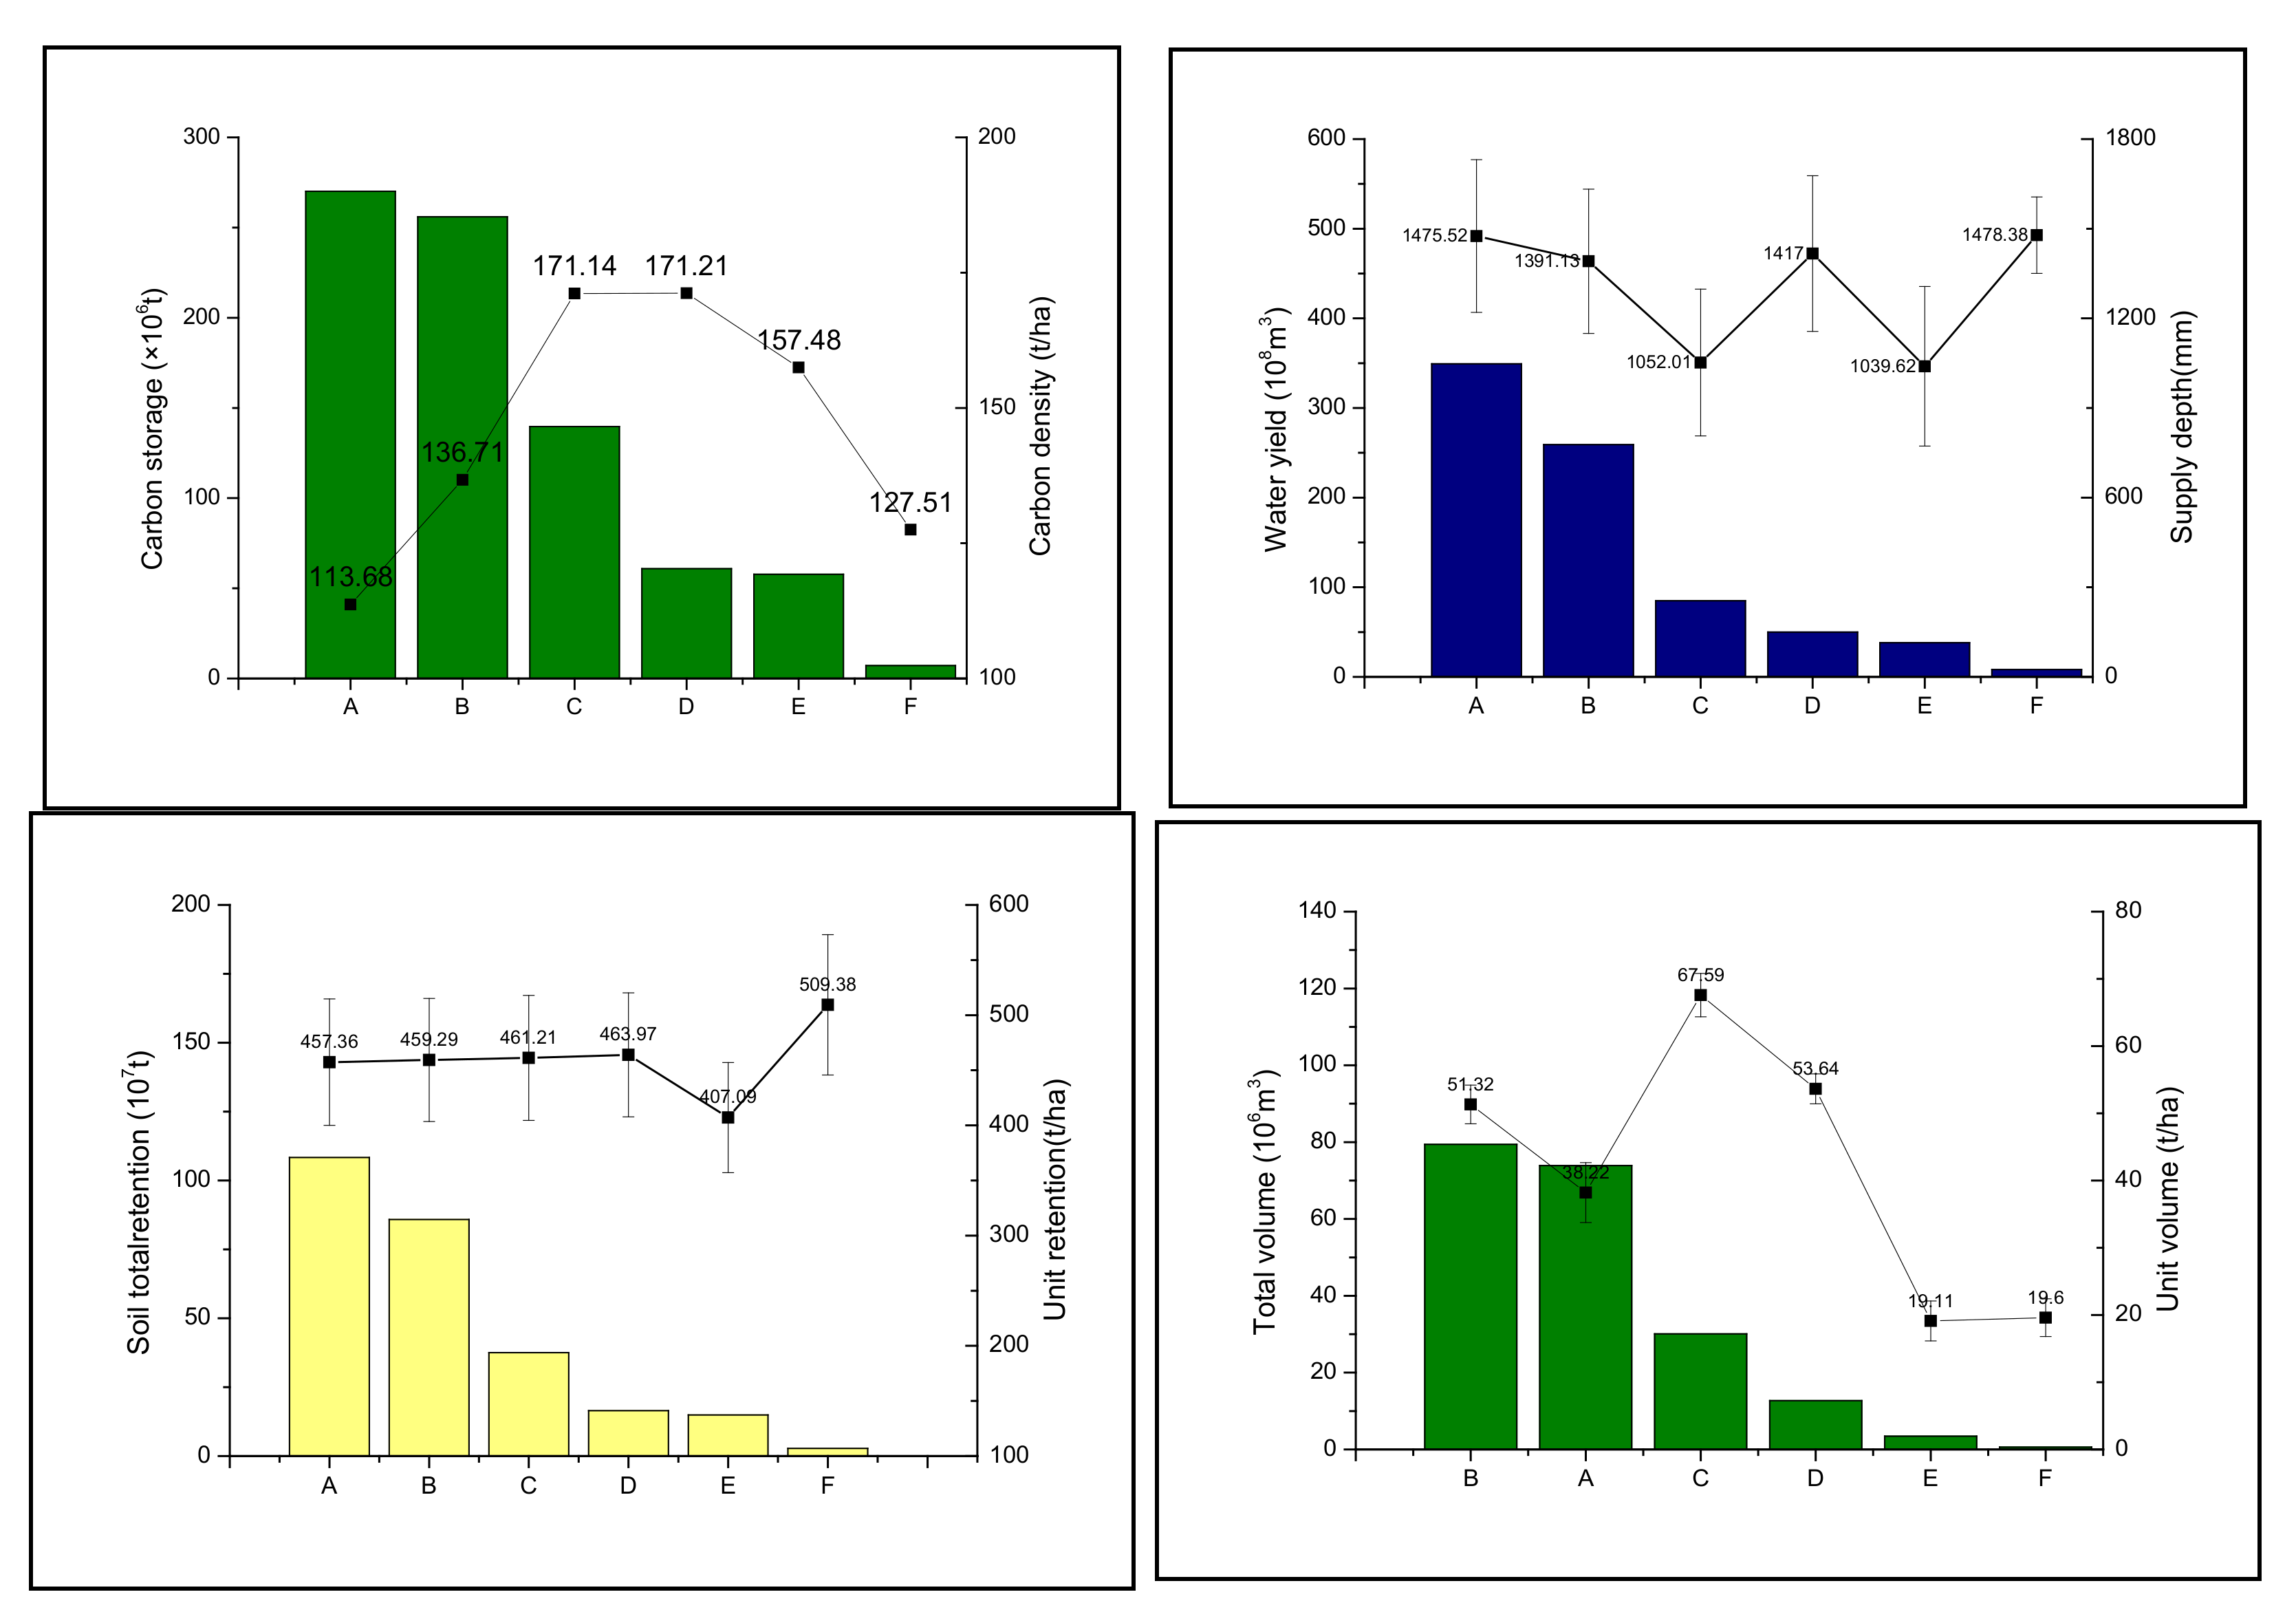
3.2. Service Production of Different Forest Types

The area of planted forests in the GRB was about 443,444 km2, including the pine forest and Chinese fir forest; therefore, they contributed the largest part of the four ecosystem services, over 70% of the total service production (Figure 4). Although natural forests occupied less than 12,233 km2, the broad-leaf and bamboo forests also contributed a lot and were very important to the four ecosystem services.
The service production capacity of different forest types per hectare was different (Figure 4). The broad-leaf forest provided the largest carbon storage and volume accumulation capacity (171.14 t/ha and 67.59 m3/ha), and the pine forest provided the smallest carbon storage and volume accumulation capacity (113.68 t/ha and 38.22 m3/ha). The bushes and shrubs, as well as the pine forest, provided the largest water supply capacity, with supply depth up to 1475.52 mm. The broad-leaf forest and economic forest provided the least water supply depth, about 1050 mm. The economic forest had the largest soil erosion modulus (49.29 t/ha), and the broad-leaf forest had the smallest (7.12 t/ha). Compared with the natural forests, plantations showed weak service capacity, especially for the wood volume service, although they could supply large water yields. Considering the most important role of the plantations in the GRB (to meet the demand for timber production), it is very urgent for managers to improve the qualities of plantations to enhance their stand productivity. As benefits from their diverse biological communities, the broad-leaf and bamboo forests provided large carbon storage service and wood volume service and also provided larger soil retention service than other forest types. Therefore, natural forests have obvious advantages in providing services that are helpful for environmental protection.

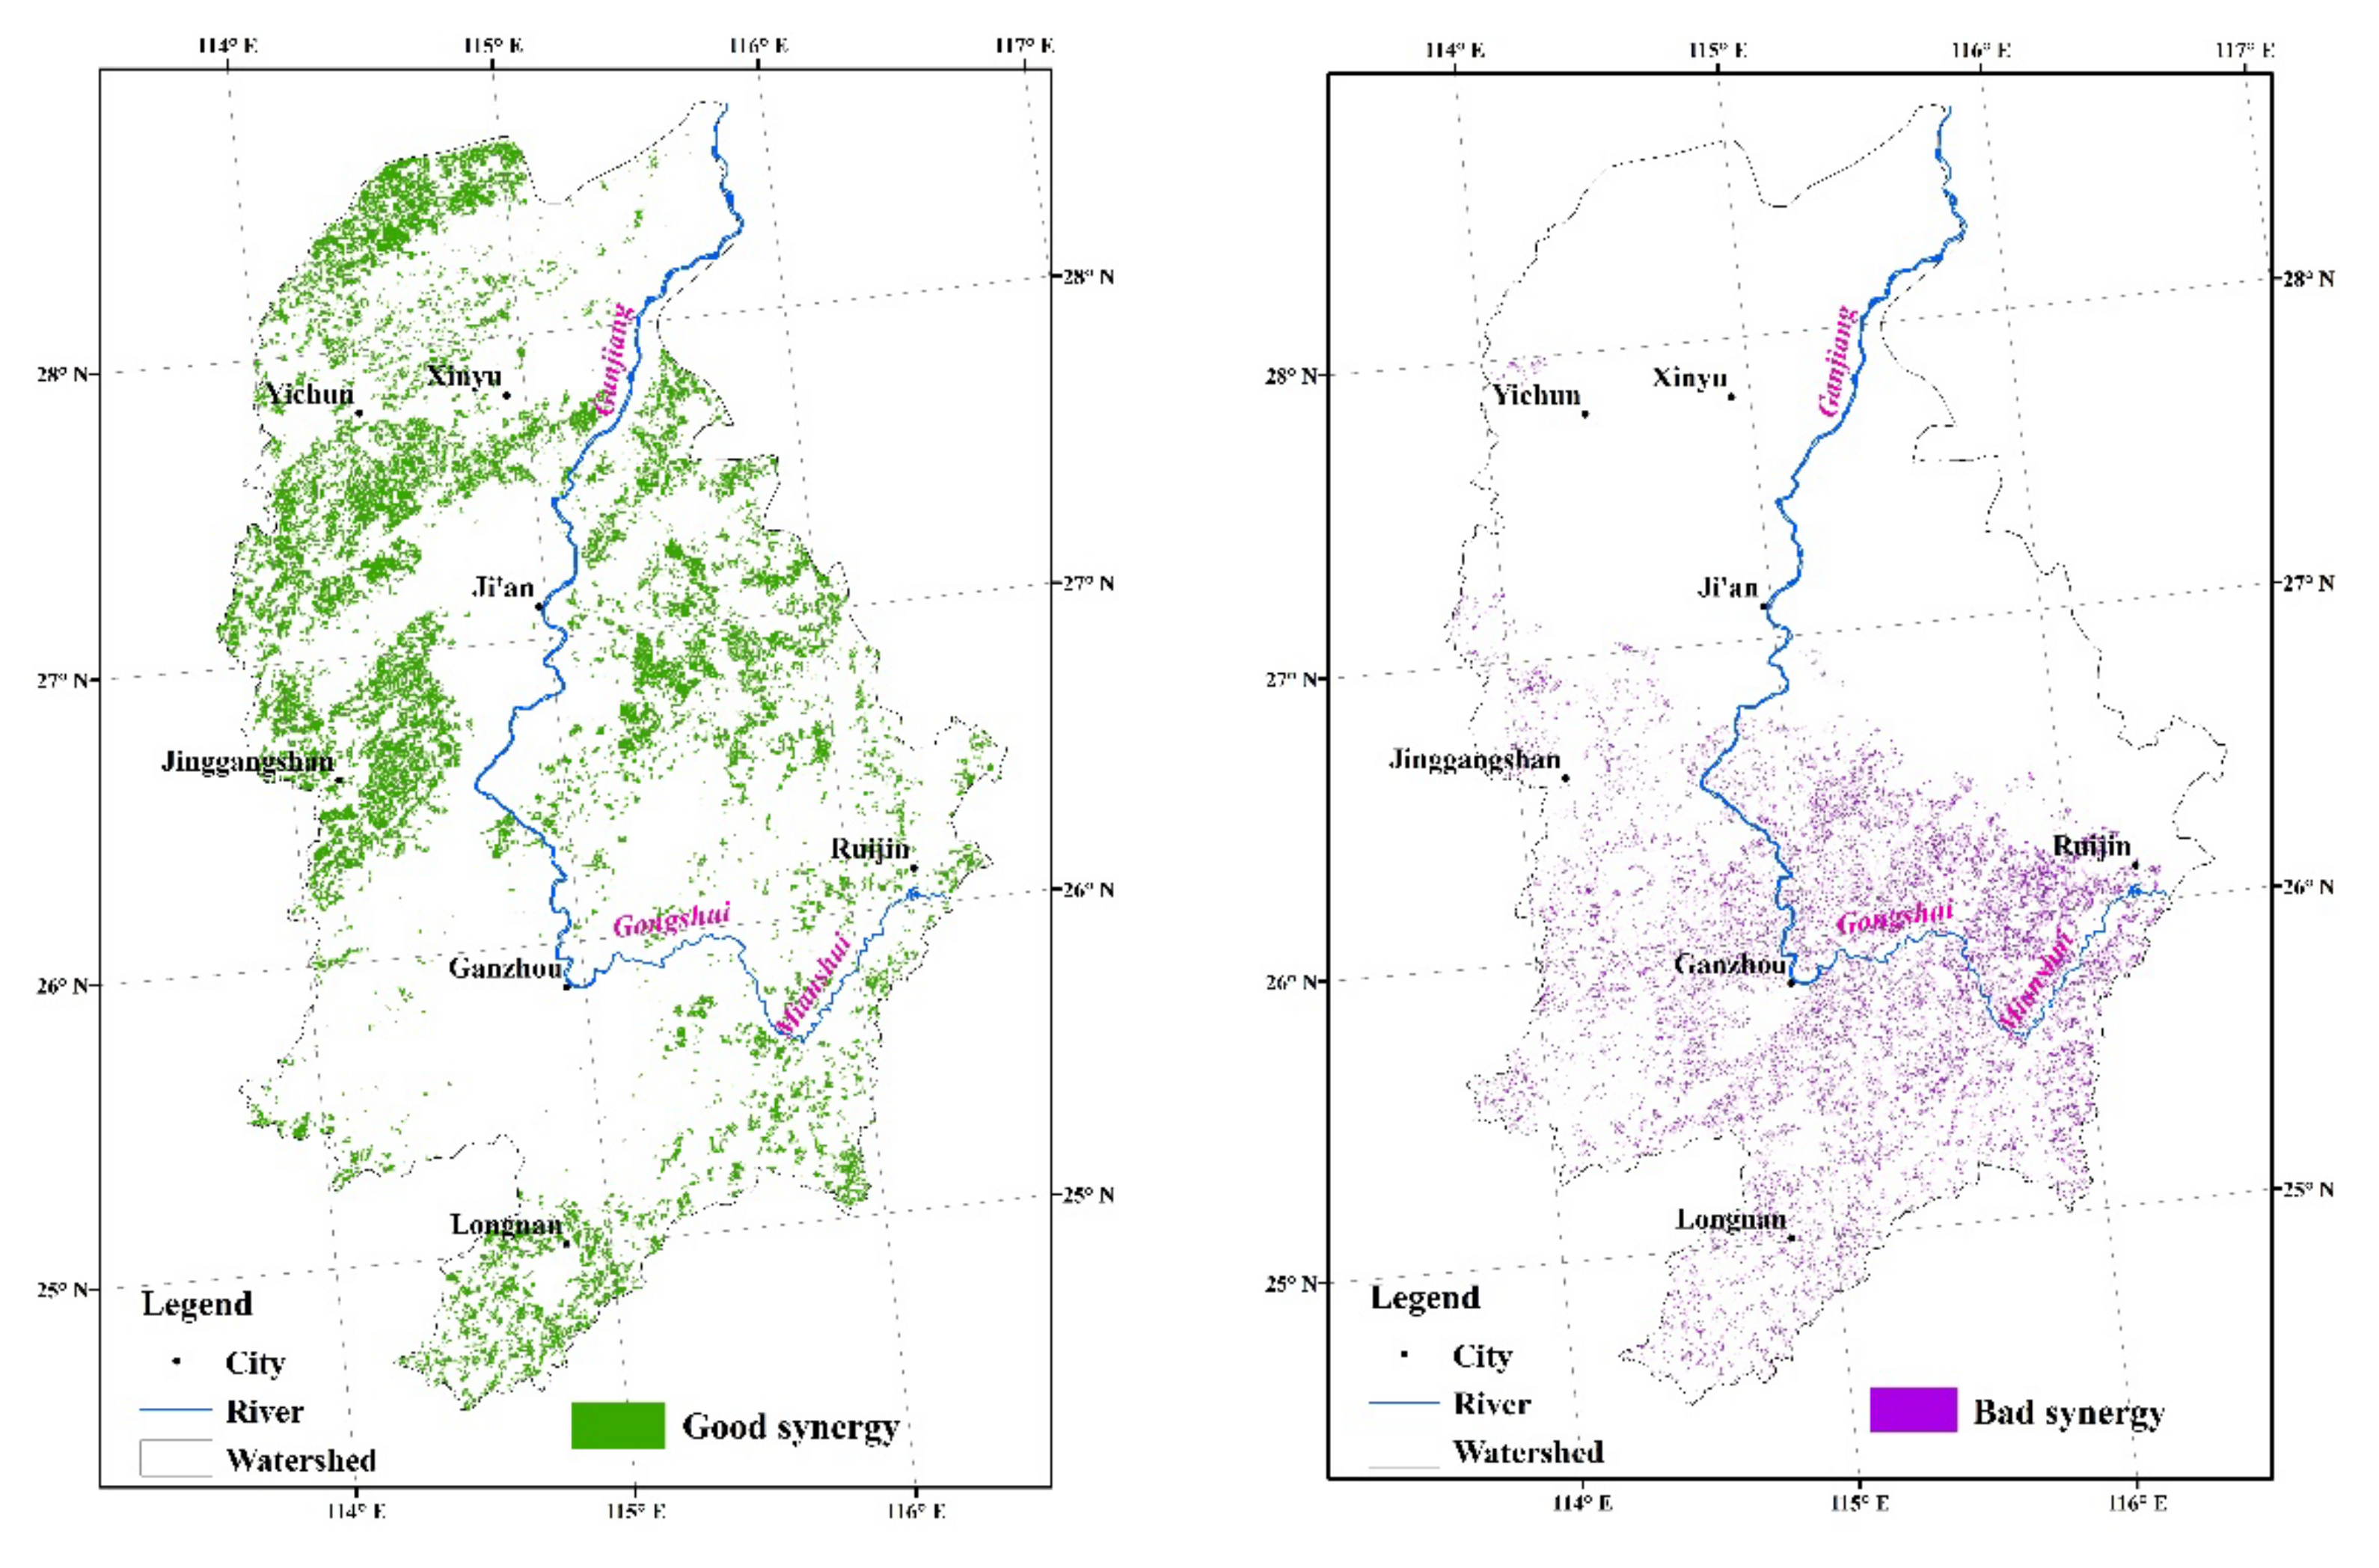
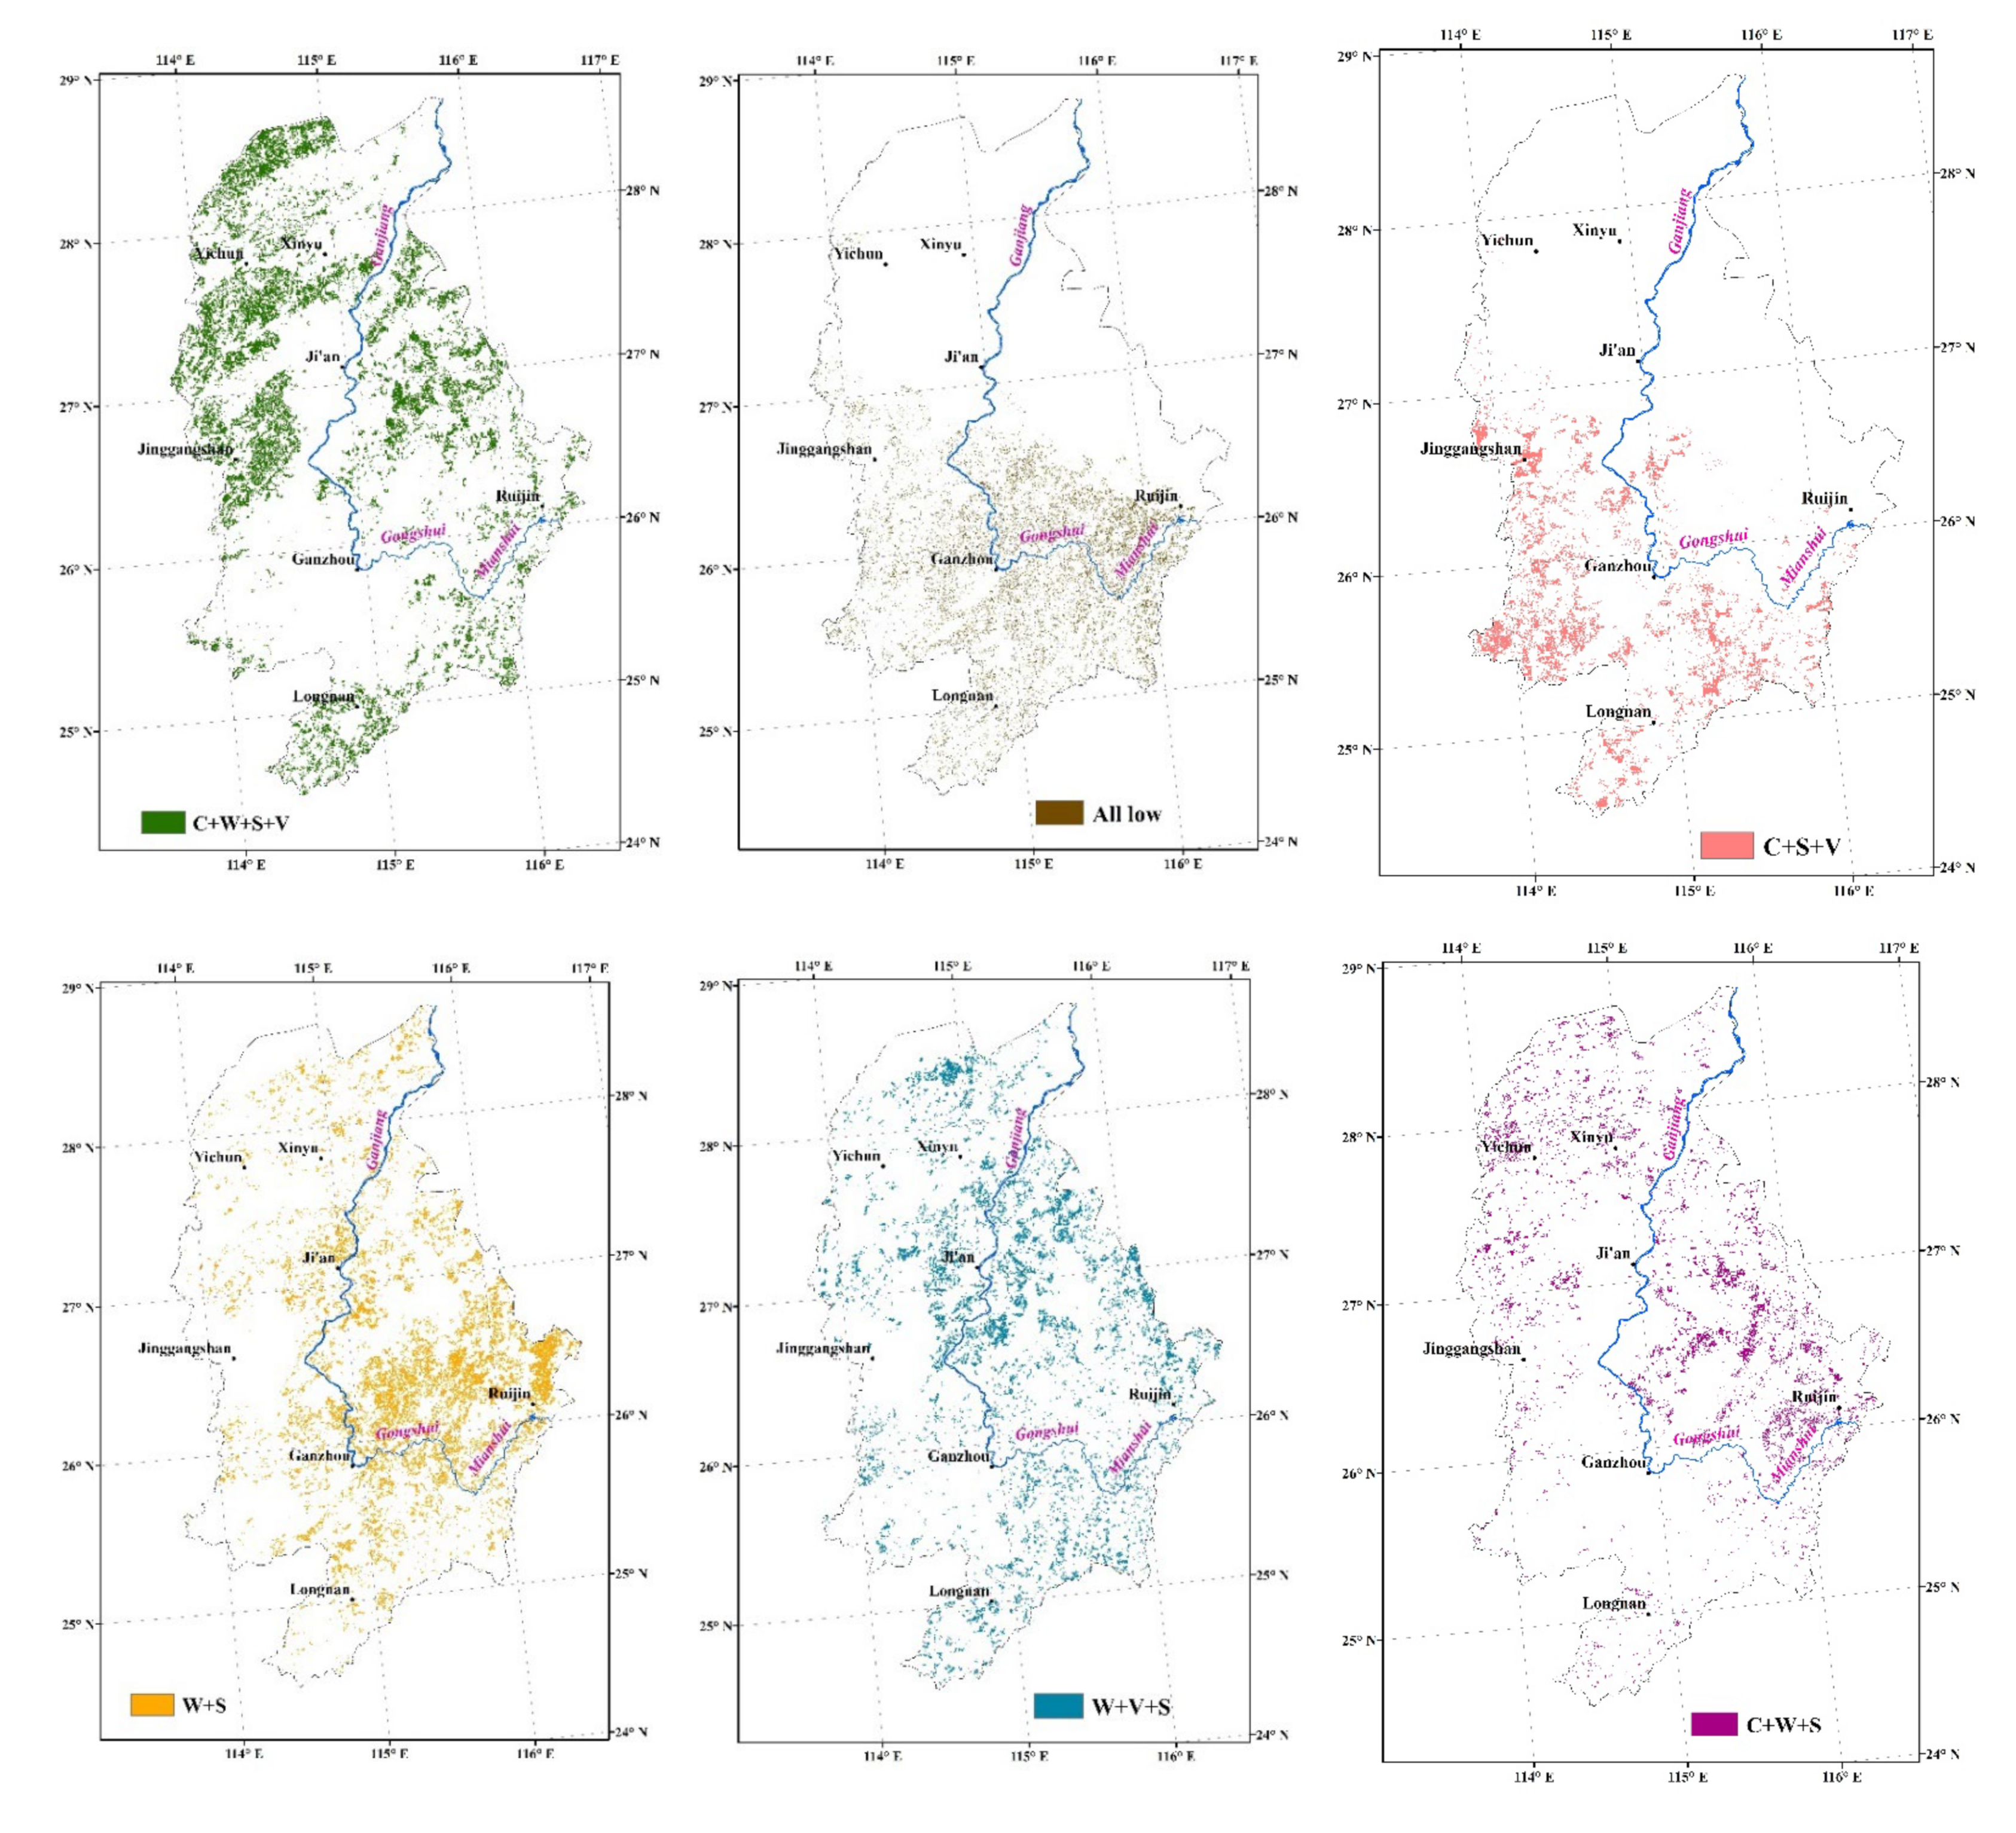
3.3. Services’ Spatial Congruence

In the high-value regions of carbon storage, the broad-leaf forest was the most important contributor (occupying 54.07%), and the bamboo forest and the economic forest also contributed substantially (each about 20%). The pine forest occupied all the low value regions of carbon storage. The Chinese fir, broad-leaf and pine forests were the main contributors of high value regions of volume accumulation service, with similar total service volume. The pine forest and the Chinese fir forest were the main components in the medium and low value regions. In contrast, the pine forest and the Chinese fir forest were the most important producers in the high and medium value regions of water yield services, with total service up to 80%. The broad-leaf forest was the largest contributor in low value regions of water yield service (occupying 42.12%), and the Chinese fir forest was also an important component (occupying 23.46%). In the high value regions of soil retention service, the pine, Chinese fir and broad-leaf forests were important contributors, and in the low value regions, the Chinese fir, pine and economic forests were the main components.
The proportion of the high-value overlap areas of the four ecosystem services was 0.88%, the median area was 4.17% and the low-value area was 0.49%. From analysis of the overlap of any three kinds of ecosystem services, spatial congruence of the high value regions of carbon storage, volume accumulation and soil retention was the greatest, with overlap of 13.06%. The proportion of the high-value overlap areas of carbon storage, volume accumulation and water yield was the smallest, which is 1.39%. For the medium regions, spatial congruence of carbon storage, volume accumulation and water yield was the largest (15.61%) and that of the water yield, soil retention and volume accumulation was the smallest (overlap of 6.79%). In relation to the low value regions, spatial congruence of carbon storage, volume accumulation and soil retention was the greatest (overlap 8.25%) and that of the water yield, soil retention and carbon storage was the least (0.79%). The analysis of the overlap of any two kinds of ecosystem services showed the following results. In the high value regions, the overlap between carbon storage and soil retention, or carbon storage and water yield, as well as water yield and soil retention was high (about 30%). The high-value overlap area between the volume accumulation and water yield was low (about 10%). In the medium value regions, the overlap between carbon storage and volume accumulation was the largest (about 67.52%) and that between carbon storage and water yield was the smallest (about 19.95%). Furthermore, in the low value regions, carbon storage and volume accumulation overlapped by 70.27%, which was the most. The low value regions overlapped between water yield and soil retention and the overlap between carbon storage and water yield was small (about 10%).

4. Discussion

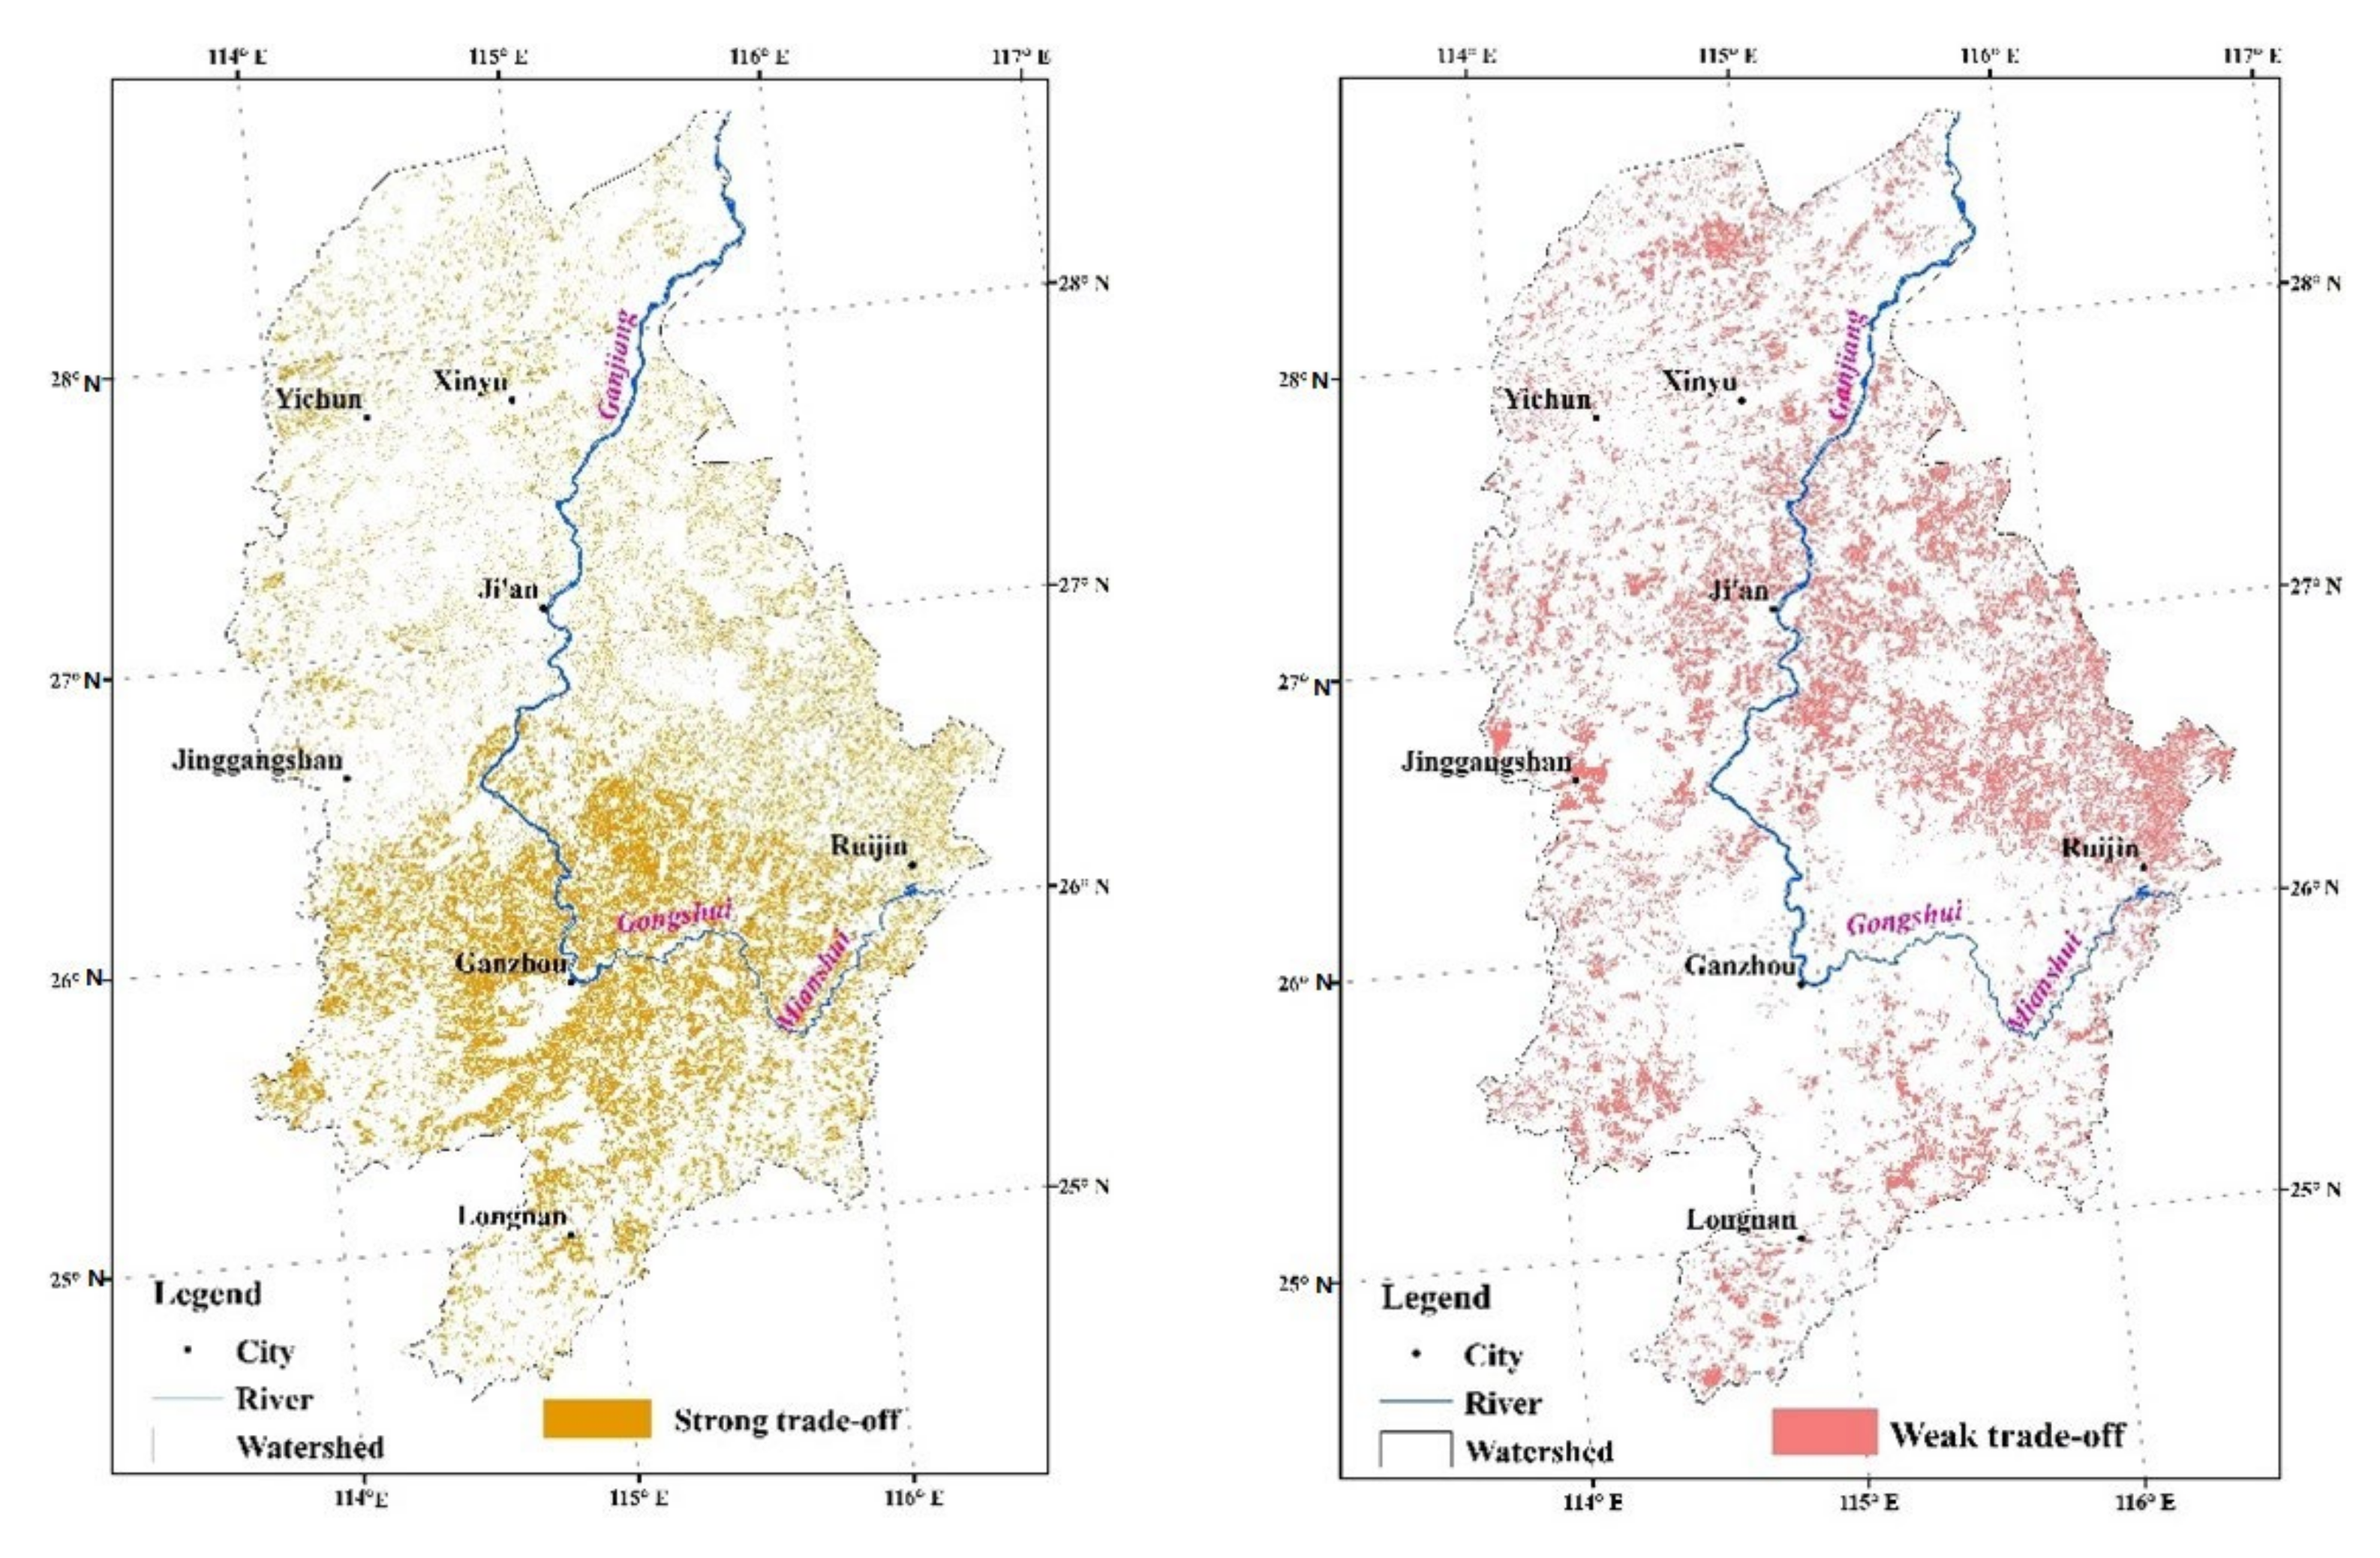
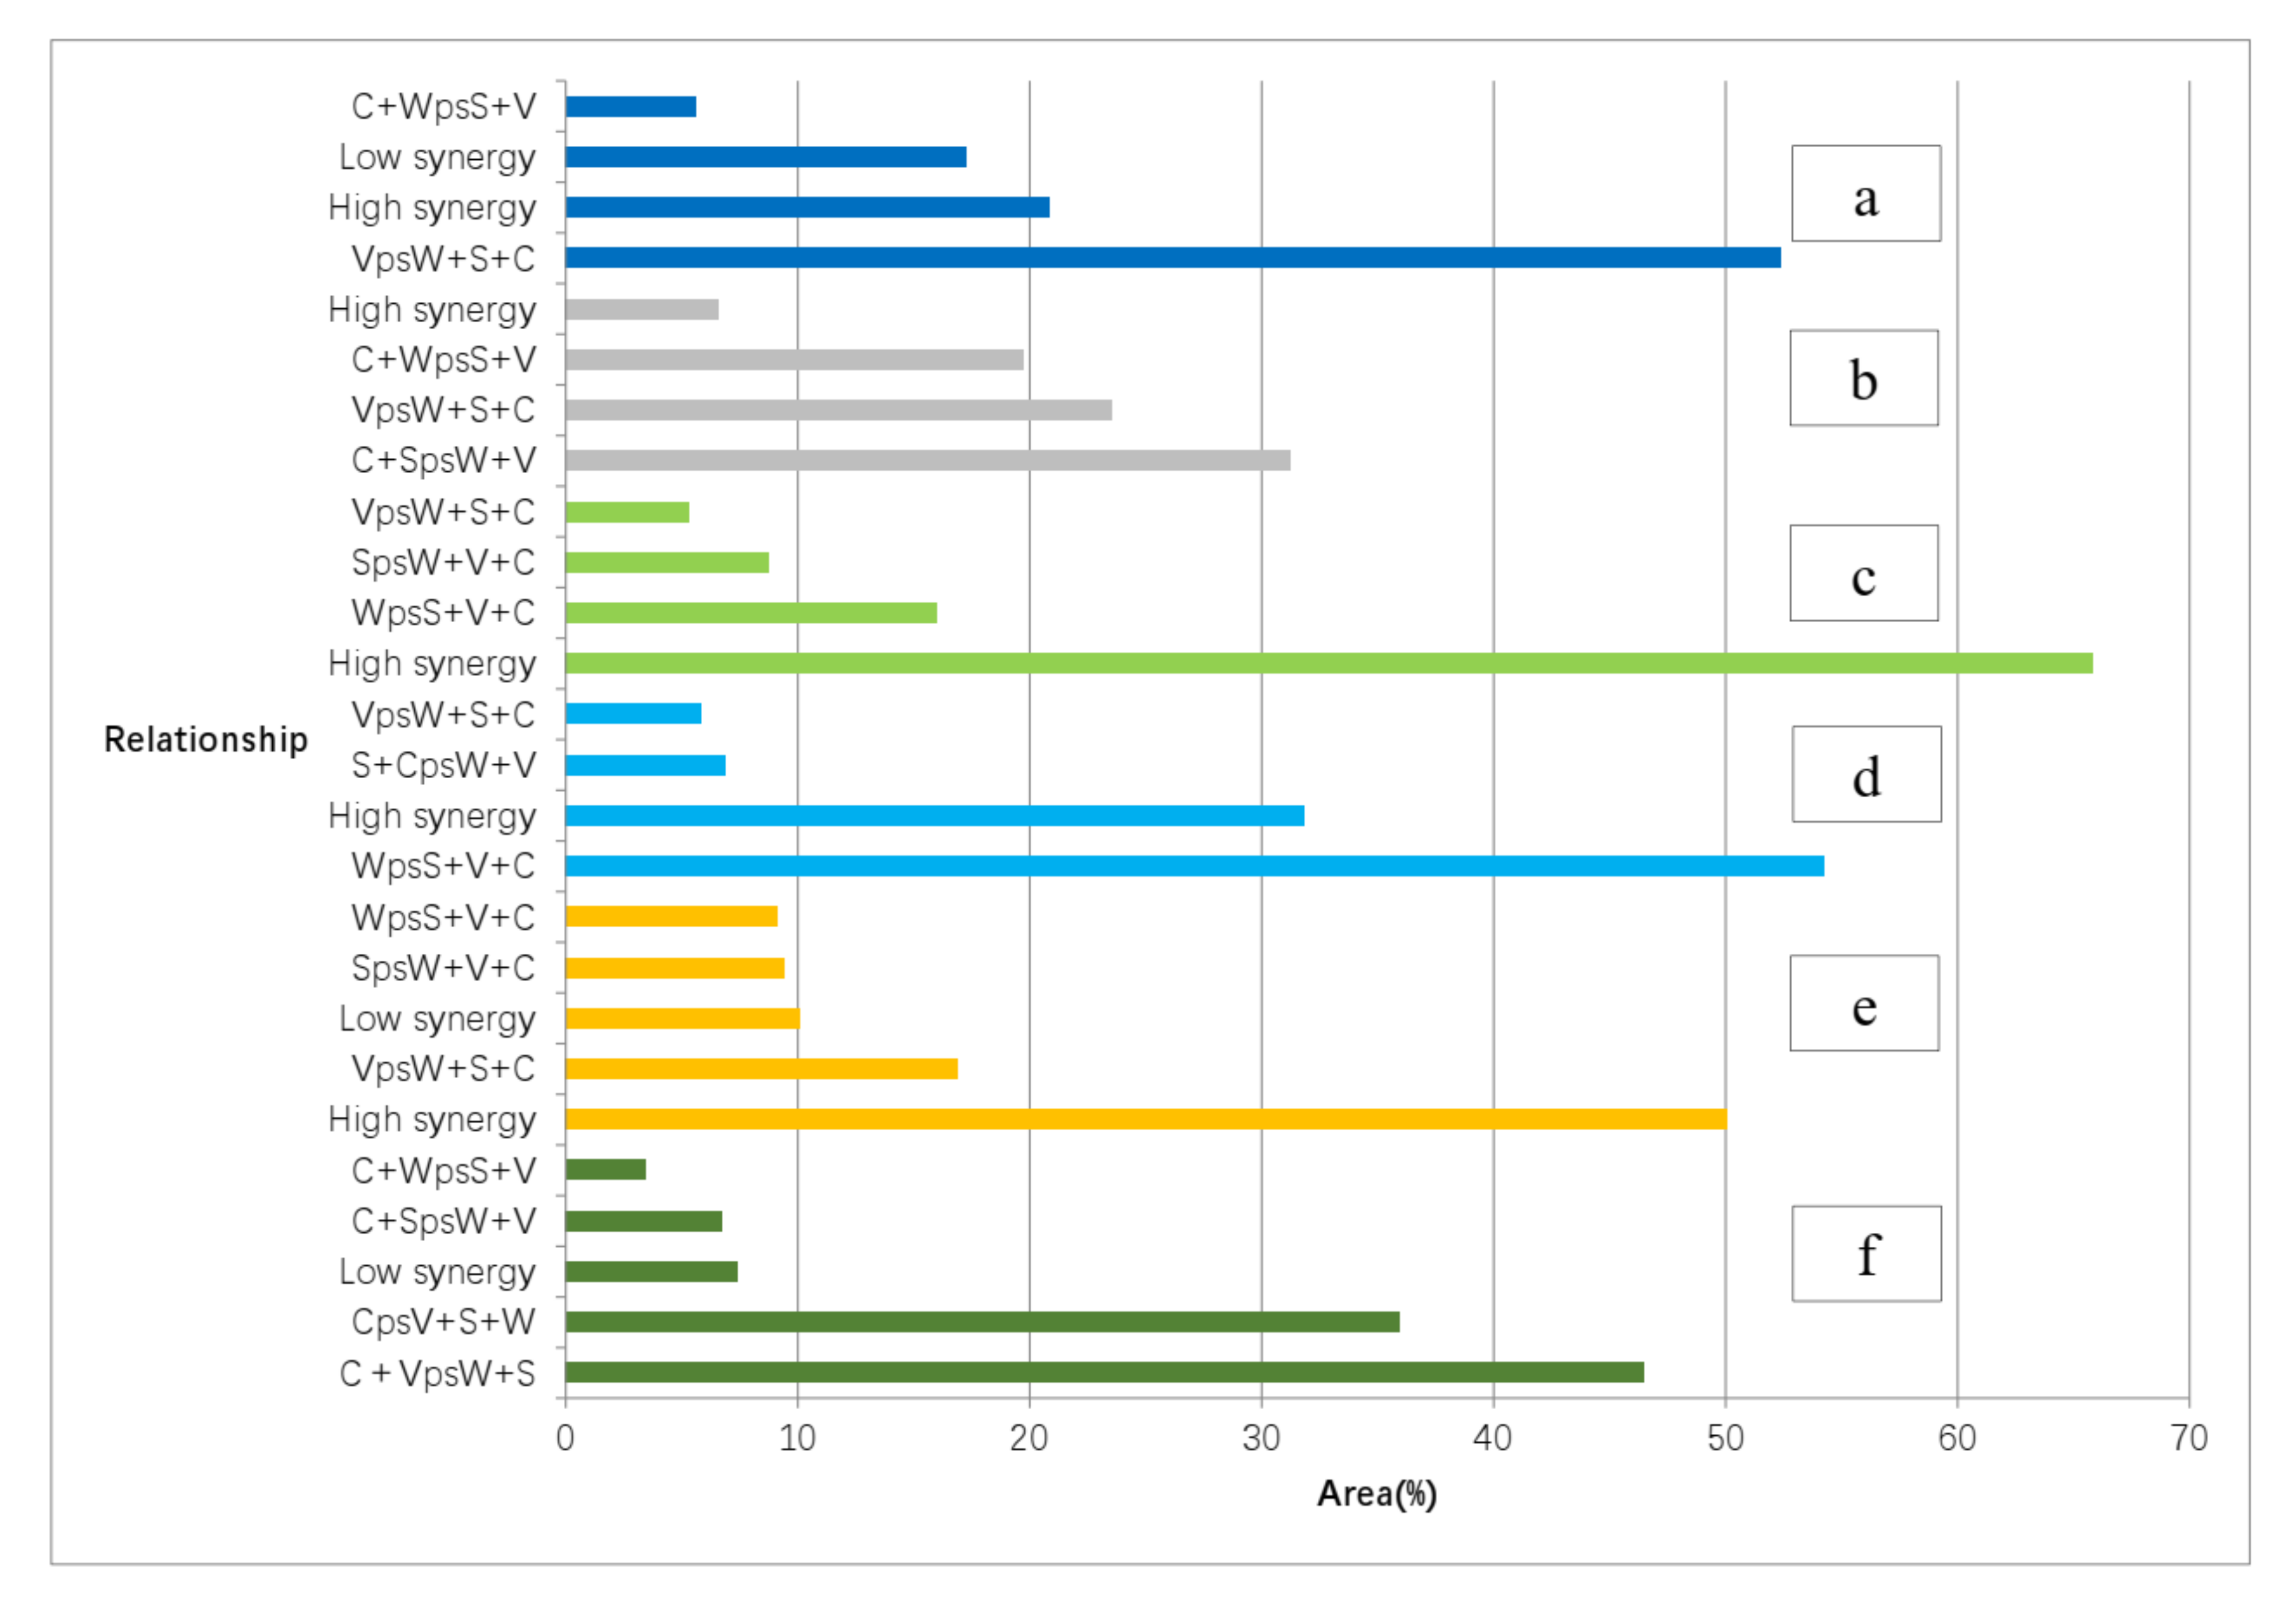
4.1. Synergies and Trade-Offs between Ecosystem Services

It is well known that forest volume accumulation provides the material foundation for the regional human society and that carbon storage can help mitigate global climate change. Meanwhile, forests are also important for regulating the dynamics of water production and contribute to maintaining soil stability during storms [43]. Thus, because forest ecosystem services are intrinsically linked through the interaction between the ecological components and ecological processes, these ecosystem services showed relationships, such as synergies and trade-offs. Identifying the co-benefits and trade-offs behind the ecosystem services will help to improve the quality and quantity of forest resources and guide forest management. Moreover, taking ecosystem service interactions into account for policy decision making could also optimize the conservation strategies needed to provide multiple ecosystem services, and it could provide the foundations needed to protect essential ecosystem services [28].
According to the ability to spatially combine the production of four ecosystem services, we defined the synergy and trade-off relationships among ecosystem services (Table 2) and mapped them (Figure 5). The area where all the production capacity of all four ecosystems was high or medium was 26.71%, so the four ecosystem services showed good synergy in these areas (typically distributed at the edges around the GRB). The area where production capacity of the four ecosystem services was all high was 0.32%, and the area where the production capacity of any three of the four ecosystem services was high was 4.52%. Moreover, the area where the four service production capacities were all low was 7.57%; therefore, the four ecosystem services showed poor synergy in these areas. These regions are located in the southern GRB.
The area where the four ecosystem services showed trade-offs was 65.71%, and the area where only one ecosystem service production capacity was high was 33.29%; therefore, there are strong trade-offs between the four ecosystem services in these regions (southern GRB). The area where at least two ecosystem services were low was 30.18%, thereby medium trade-offs occurred among the four ecosystem services. Moreover, the area where at least two ecosystem services were high and one ecosystem service was low was 32.42%, indicating that weak trade-offs exist among the four ecosystem services. These regions are located in the center and northeast of the GRB.

4.2. Synergies and Trade-Offs among Ecosystem Services in Different Forest Types

The ecosystem service production ability was different among forest types (Figure 4); therefore, synergies and trade-offs between ecosystem services in different forest types will differ as well. Understanding the ecosystem service interactions in different forest types has great potential for providing opportunities to figure out the mechanisms linking forest ecological systems and individual ecosystem services [22]. This would also benefit forest classification management and fine management.
The pine forest is the most widely distributed type in the GRB at present (about 40% by area) and this is predominantly Masson pine plantations. Because the carbon storage density of the pine forest is lower than of other forests, trade-offs between ecosystem services are widespread (Figure 6). More than 1/3 of the pine forest showed good synergies among volume accumulation, soil retention and water yield, but the carbon sequestration capacity was low. The proportion of pine forest that showed good synergies between soil retention and water yield, but bad synergies between volume accumulation and carbon storage, was 46.49%. Moreover, the part of pine forest that showed poor synergies among the four ecosystem services occupied 7.41%. Therefore, over half of the pine forests faced severe challenges in that the capacity for carbon storage and volume accumulation were low. Taking the importance of pine forests for timber production into account, pine forest management should be focused on to cope with these problems. In addition, most of the pine forest showed good soil retention capacity, but because most will be cut down within the next few years, it would be better to evaluate the environmental impacts of pine forest logging on the local water and soil conservation.
The Chinese fir forest is also widespread in the GRB, and plantations account for the majority. Over half of the Chinese fir forests had good synergies among the four ecosystem services. However, about 20% of the Chinese fir forests also show good synergies among carbon storage, soil retention and water yield but low capacity in volume accumulation. A small part of the Chinese fir forests showed good synergies among carbon storage, volume accumulation and water yield but with low soil retention service. Therefore, trade-offs exist in these local regions. In view of these regions, if the above-mentioned severe trade-offs were ignored, the forests would be cut down and soil loss would be aggravated, so these regions should be included in considerations to implement ecological compensation and local forest protection planning. Moreover, the proportion of the Chinese fir forest that showed bad synergies among the four ecosystem services was 14.48%: forest transformation and guidance on forest management should be carried out in these regions.
Although its distribution is narrow, the broad-leaf forest is the largest natural vegetation in the GRB and it occupies 13.95% of the total area. About 31.84% of the broad-leaf forest showed good synergies among the four ecosystem services, and more than half of the broad-leaf forest showed good synergies among carbon storage, volume accumulation and soil retention, but the water yield service was low. Moreover, there was a small part of the broad-leaf forest that showed good synergies among carbon storage, water yield and soil retention, but of which the volume accumulation service was low. Compared to other forests, good synergies between environmental services exist widely in the broad-leaf forest, so the overall benefit for ecosystem services of broad-leaf forests is larger than for other forests.
The bamboo forest is also important natural vegetation for forest products in the GRB, and its benefits in terms of ecosystem services are substantial. The areas of bamboo forest that showed good synergies among the four ecosystem services was 65.85%, and about 15.98% of the bamboo forest showed good synergies among carbon storage, volume accumulation and soil retention, but it showed low water yield service. About 7.53% of the bamboo forest showed good synergies among carbon storage, volume accumulation and water yield, but it had low soil retention.
A relatively small area is occupied by economic forest composed of camellia forest, dry forest and special forest. Trade-offs between ecosystem services were common in the economic forest. About 31.22% of the economic forests showed good synergies between carbon storage and soil retention but poor synergy between water yield and volume accumulation. The proportion of the economic forest that showed good synergies between carbon storage and water yield, but bad synergies between soil retention and volume accumulation, was 19.7%. Moreover, over 23% of the economic forest showed good synergies among carbon storage, soil retention and water yield but low volume accumulation service.
The area occupied by bushes and shrubs only is the smallest in the GRB. As a result of its low volume accumulation capacity, there were wide trade-offs between environmental services. More than half of the bush and shrub areas showed good synergies among carbon storage, water yield and soil retention but had low volume accumulation capacity. Moreover, the part of bushes and shrubs that showed poor synergies among the four ecosystem services was 17.29%. In addition, there was a small part of bushes and shrubs (about 5.58%) that showed good synergy between carbon storage and water yield but poor synergy between soil retention and volume accumulation.
Compared with the plantations, the natural forests commonly showed more synergies between ecosystem services and had higher soil retention service and better ecosystem service benefits overall. Therefore, the protection of existing natural forests and planting to expand them would help to solve local environmental problems and to improve the quality of ecosystem services.

4.3. Forest Management Oriented by Ecosystem Services

The global degradation of forest ecosystems and the decline in biodiversity have led to urgent appeals to integrate the needs of the ecosystem services into the design of forest management and conservation interventions [44,45]. During forest management, it is necessary to make clear the functional characteristics and spatial heterogeneity of different kinds of forests, to identify typical trade-offs and synergies between ecosystem services. This must be performed at regional scale and within each individual forest ecosystem in order to achieve a reasonable combination of the forest resources needed to produce various ecosystem services, such as timber production and accumulation of carbon [46].
At present, tree plantations are widely distributed in the GRB (up to 70%), and these produce the majority of the four ecosystem services provided. However, compared with the natural forests, plantations showed lower production capacity in carbon storage, volume accumulation and soil conservation. Therefore, it is necessary to deal with trade-offs between plantation-based ecosystem services and to take measures to improve the forest volume and soil retention services in response to environmental issues.
Thinking about the spatial heterogeneity of the production capacity of the four forest ecosystem services in the GRB (Figure 7), forest management objectives and strategies should be different for different regions. The pine and Chinese fir forests in the central and southern parts of the GRB showed low production capacity for the four ecosystem services, so the forest management there should be committed to forest tending and natural resources protection. Investment should be increased to improve environmental conditions there, such as soil nutrients or irrigation conditions. In terms of the pine and Chinese fir forests in the southwest part of the GRB, the water yield services are very low and result in strong trade-offs between other ecosystem services. Therefore, it is urgent to estimate the regional security of water resources under the climate-change background and build some reservoirs and irrigation facilities to alleviate water shortage problems. The broad-leaf and bamboo forests in the north, northwest, and southern edge of the GRB had good synergies between the four ecosystem services and played active roles in producing ecosystem services, goods and environmental safety throughout the whole region. Thus, forest management should pay attention to the supervision of forest resource protection and expansion. In view of the plantations in the northeast of the GRB, considering that the carbon storage and volume accumulation services there were lower than in other regions, the forest management should give priority to optimizing the composition of stand structure and to expanding the area of middle-aged and mature forests.
Owing to the need for economic development, the pine and Chinese fir plantations have continued to thrive in all parts of the GRB (even in protected zones) during the last 20 years. It is reasonable to assume they will probably continue to increase in the future. Given this trend, the natural forest areas, including the broad-leaf and bamboo forests, will decrease. This will result in a reduction in the total amount of carbon storage and forest volume and it will worsen soil conservation conditions. The amount of water yield may increase if the regional climate does not change. Furthermore, synergies between forest ecosystem services will be weakened and more extreme trade-offs between forest ecosystem services will be needed. For these reasons, it would be most effective to avoid environmental hazards by increasing soil and water conservation engineering measures at the same time that plantations are expanding. Meantime, the expansion of plantations might also be given a function in the regulation of water flow [28]. Plantations have a positive impact on soil acidification [47] but also induce soil erosion and nutrient loss [48]. These cause the deterioration of water quality due to increased sediment loads [49,50] and assure that drinking water safety becomes an important environmental problem in the future. Therefore, plantation management should also consider adding measures for water quality monitoring and soil nutrient retention.
Taking into account the importance of natural forests for biodiversity, it is necessary to consider the environmental consequences of plantation expansion in conjunction with natural forest reduction. Many adverse environmental impacts of plantations have been reported in the GRB and other regions, where they reduced local native species and had negative consequences for biodiversity [51]. The reduction or loss of major native species will change climatic conditions and hydrological processes over the long term. Therefore, forest management should think carefully about the importance of adjusting the proportions of natural forest and plantations to mitigate the conflicts between the economic benefits and ecological benefits of ecosystem services in the GRB.
In addition, temporal considerations are also important because pine plantations are harvested every 30 years and Chinese fir plantations are harvested every 20 years. This is a critical factor because the anticipated effects of these plantations on carbon storage, water regulation and soil retention are only valid with canopy closure [28]. Therefore, forest management should adopt improved rules governing plantation succession to minimize logging impacts on the local environment.

4.4. Limitations

Although the information presented here represents an improvement on previous large-scale work on forest ecosystem services and trade-offs, our study is nevertheless constrained by the limited availability of data.
One shortcoming was the accuracy of the spatial evaluation of ecosystem services. We used the available hydrological station data, field sample data and relevant literature data to test the accuracy of the four ecosystem services studied. The carbon storage was consistent with previous research by Wang [39], but because the data on carbon density was not the latest, the total amount of carbon storage herein will be smaller than the actual values. Moreover, due to a lack of carbon density data and forest age composition data, the spatial accuracy was very low. Based on many field survey data for model correction, the simulation accuracies of the water yield and wood volume services were higher than carbon storage. Because there was a smaller amount of soil loss survey data than that of the water yield and wood volume services, the simulation accuracy of soil retention service was low. On the whole, the simulation accuracy of the four ecosystem services over the whole basin was better than that at specific areas within the basin.
The second shortcoming concerns the InVEST model simulation mechanism of ecosystem services. The InVEST model is the best known of the generalizable, public-domain tools and can combine environmental factors (e.g., soil and climate information) as inputs into ecological production functions to generate spatially explicit predictions about the supply of ecosystem services [2]. However, the InVEST model is also widely controversial because of its low spatial accuracy and too-simple mechanism [52]. For example, concerning carbon storage, the model only requires inputting a fixed carbon density value for each forest type, but in fact forest carbon density is related to many factors, including forest age, dominant tree species and distribution area wait. Under this assumption, the only changes in carbon storage over space or time are due to changes from one forest type to another or from the harvest of wood products. However, the InVEST model still has advantages for quantifying and making spatially explicit the carbon storage of different land cover types, compared with classification surrogate methods [27]. Considering that forests will actually gain or lose carbon over time, we suggest dividing forest types into age classes or even directly summarizing the carbon sequestration from detailed field data [24,26,28]. In addition, the model relies on the USLE to evaluate soil erosion. This equation widely represents rill/inter-rill erosion processes and ignores other sources of sediments including gully erosion, streambank erosion and mass erosion. Moreover, the soil retention model was also observed to be very sensitive to some parameters that are not physically based, such as IC0 and k, which are calibration parameters that define the relationship between the index of connectivity and the sediment delivery ratio [52]. Errors in these parameters will therefore have a large effect on predictions.

5. Conclusions

Different types of forest ecosystem services have different spatial distribution patterns. The forest carbon storage and volume accumulation hotspots in the GRB were located in the northeast and western edge regions whereas the water yield hotspots were located in the northeast regions and the soil retention fragile regions were concentrated in the southeast regions. Forest management in the GRB should consider the spatial heterogeneity of different ecosystem services to achieve the sustainable use of forest resources.
Our study indicates that ecosystem services and their interactions are very different between natural forests and plantations. Although the current area of natural forests in the GRB (such as the broad-leaf and bamboo forests) is small, it shows good synergies between ecosystem services and plays an important role in soil retention, biodiversity and rare species’ conservation, which is consistent with many existing research results [22,25,45]. Although, some studies have found a trade-off between carbon sequestration and freshwater supply services by natural forest vegetations [2,28]. As a result, natural forest management also needs to consider trade-offs between ecosystem services. For these reasons, huge benefits would result from resolving environmental crises and improving the overall benefits of ecosystem services, by increasing the area devoted to natural forests in the GRB. Similar to existing research on plantation ecosystem services [5,46,53,54], trade-offs among ecosystem services in plantations in the GRB can be easily found for carbon storage and water yield, or volume accumulation and soil retention, and they result in soil erosion and water pollution problems. Therefore, plantation management should pay attention to upgrading the tending, logging and conservation engineering measures needed to increase the overall benefits of ecosystem services.

Author Contributions

Data curation, J.Z.; Formal analysis, X.W.; Methodology, E.D.; Software, Q.T. All authors have read and agreed to the published version of the manuscript.

Funding

This research was funded by the National Basic Research Program of China (973 Program) (2012CB416906 and 2015CB452702), the National Natural Science Foundation of China (41571098, 41530749 and 41371196) and the National Key Technology R&D Program (2013BAC03B04).

Institutional Review Board Statement

Not applicable.

Informed Consent Statement

Not applicable.

Data Availability Statement

Not applicable.

Conflicts of Interest

The authors declare no conflict of interest.

References

  1. Millenium Ecosystem Assessment Board. Ecosysytems and Human Well-Being: Current State and Trends; Island Press: Washington, DC, USA, 2005. [Google Scholar]
  2. Bai, Y.; Zhuang, C.W.; Ouyang, Z.Y.; Zheng, H.; Jiang, B. Spatial characteristics between biodiversity and ecosystem services in a human-dominated watershed. Ecol Complex. 2011, 8, 177–183. [Google Scholar] [CrossRef]
  3. Hanowski, J.M.; Niemi, G.J.; Christian, D.C. Influence of within-plantation heterogeneity and surrounding landscape composition on avian communities in hybrid poplar plantations. Conserv. Biol. 1997, 11, 936–944. [Google Scholar] [CrossRef]
  4. Liu, A.Q.; Fan, S.H.; Lin, K.M.; Ma, X.Q.; Sheng, W.T. Comparison on nutrient cycling in different generation plantations of Chinese fir. Plant Nutr. Fertitizer Sci. 2005, 11, 273–278. [Google Scholar]
  5. Cademus, R.; Escobedo, F.J.; McLaughlin, D.; Abd-Elrahman, A. Analyzing Trade-Offs, Synergies, and Drivers among Timber Production, Carbon Sequestration, and Water Yield in Pinus elliotii Forests in Southeastern USA. Forests 2014, 5, 1409–1431. [Google Scholar] [CrossRef] [Green Version]
  6. FAO. Global Forest Resources Assessment 2015: How Have the World’s Forests Changed? FAO: Rome, Italy, 2015. [Google Scholar]
  7. Gomez-Aparicio, L.; Zavala, M.A.; Bonet, F.J.; Zamora, R. Are pine plantations valid tools for restoring Mediterranean forests? An assessment along abiotic and biotic gradients. Ecol. Apply 2009, 19, 2124–2141. [Google Scholar] [CrossRef] [PubMed] [Green Version]
  8. Dyer, G.A.; Matthews, R.; Meyfroidt, P. Is There an Ideal REDD plus Program? An Analysis of Policy Trade-Offs at the Local Level. PLoS ONE 2012, 7, e52478. [Google Scholar] [CrossRef] [Green Version]
  9. Zhang, H.; Guan, D.; Song, M. Biomass and carbon storage of Eucalyptus and Acacia plantations in the Pearl River Delta, South China. For. Ecol. Manag. 2012, 277, 90–97. [Google Scholar] [CrossRef]
  10. Zhu, J.J.; Dai, E.F.; Zheng, D.; Wang, X.L. Characteristic of tradeoffs between timber production and carbon storage for plantation in southern China: A case study of Huitong National Research Station of Forest Ecosystem. J. Geogr. Sci. 2018, 28, 1085–1098. [Google Scholar] [CrossRef] [Green Version]
  11. Gong, J.; Liu, D.; Zhang, J.; Xie, Y.; Cao, E.; Li, H. Tradeoffs/synergies of multiple ecosystem services based on land use simulation in a mountain basin area, western China. Ecol. Indic. 2019, 99, 283–293. [Google Scholar] [CrossRef]
  12. Watson, K.B.; Galford, G.L.; Sonter, L.J.; Ricketts, T.H. Conserving ecosystem services and biodiversity: Measuring the tradeoffs involved in splitting conservation budgets. Ecosyst. Serv. 2020, 42, 101063. [Google Scholar] [CrossRef]
  13. Reyers, B.; Polasky, S.; Tallis, H.; Mooney, H.A.; Larigauderie, A. Finding common ground for biodiversity and ecosystem services. Bioscience 2012, 62, 503–507. [Google Scholar]
  14. Carreno, L.; Frank, F.C.; Viglizzo, E.F. Trade-offs between economic and ecosystem services in Argentina during 50 years of land-use change. Agric. Ecosyst. Environ. 2012, 154, 68–77. [Google Scholar] [CrossRef]
  15. Vihervaara, P.; Kamppinen, M.; Kumpula, T.; Walls, M. Biodiversity trade-offs and globalizing forestry. For. Policy Econ. 2013, 26, 147–148. [Google Scholar] [CrossRef]
  16. Bai, Y.; Zheng, H.; Ouyang, Z.H.; Zhuang, C.W.; Jiang, B. Modeling hydrological ecosystem services and trade-offs: A case study in Baiyangdian watershed, China. Environ. Earth Sci. 2013, 70, 709–718. [Google Scholar] [CrossRef]
  17. Turner, M.G.; Donato, D.C.; Romme, W.H. Consequences of spatial heterogeneity for ecosystem services in changing forest landscapes: Priorities for future research. Landsc. Ecol. 2013, 28, 1081–1097. [Google Scholar] [CrossRef]
  18. Lindemann-Matthies, P.; Keller, D.; Li, X.F.; Schmid, B. Attitudes toward forest diversity and forest ecosystem services-a cross-cultural comparison between China and Switzerland. J. Plant Ecol. UK 2014, 7, 1–9. [Google Scholar] [CrossRef] [Green Version]
  19. Mitchell, M.G.E.; Bennett, E.M.; Gonzalez, A. Forest fragments modulate the provision of multiple ecosystem services. J. Appl. Ecol. 2014, 51, 909–918. [Google Scholar] [CrossRef]
  20. Tadesse, G.; Zavaleta, E.; Shennan, C.; FitzSimmons, M. Prospects for forest-based ecosystem services in forest-coffee mosaics as forest loss continues in southwestern Ethiopia. Appl. Geogr. 2014, 50, 144–151. [Google Scholar] [CrossRef] [Green Version]
  21. Balthazar, V.; Vanacker, V.; Molina, A.; Lambin, E.F. Impacts of forest cover change on ecosystem services in high Andean mountains. Ecol. Indic. 2015, 48, 63–75. [Google Scholar] [CrossRef]
  22. Egoh, B.N.; Reyers, B.; Rouget, M.; Bode, M.; Richardson, D.M. Spatial congruence between biodiversity and ecosystem services in South Africa. Biol. Conserv. 2009, 142, 553–562. [Google Scholar] [CrossRef]
  23. Schmerbeck, J.; Fiener, P. Wildfires, Ecosystem Services, and Biodiversity in Tropical Dry Forest in India. Environ. Manag. 2015, 56, 355–372. [Google Scholar] [CrossRef]
  24. Chan, K.M.A.; Shaw, M.R.; Cameron, D.R.; Underwood, E.C.; Daily, G.C. Conservation planning for ecosystem services. PLoS Biol. 2006, 4, 2138–2152. [Google Scholar] [CrossRef] [PubMed] [Green Version]
  25. Nelson, E.; Mendoza, G.; Regetz, J.; Polasky, S.; Tallis, H.; Cameron, D.R.; Chan, K.M.A.; Daily, G.C.; Goldstein, J.; Kareiva, P.M. Modeling multiple ecosystem services, biodiversity conservation, commodity production, and trade-offs at landscape scales. Front. Ecol. Environ. 2009, 7, 4–11. [Google Scholar] [CrossRef]
  26. Turner, K.G.; Odgaard, M.V.; Bocher, P.K.; Dalgaard, T.; Svenning, J.C. Bundling ecosystem services in Denmark: Trade-offs and synergies in a cultural landscape. Landsc. Urban Plan. 2014, 125, 89–104. [Google Scholar] [CrossRef]
  27. Egoh, B.N.; Reyers, B.; Rouget, M.; Richardson, D.M.; Le Maitre, D.C.; Van Jaarsveld, A.S. Mapping ecosystem services for planning and management. Agr. Ecosyst. Environ. 2008, 127, 135–140. [Google Scholar] [CrossRef]
  28. Onaindia, M.; de Manuel, B.F.; Madariaga, I.; Rodriguez-Loinaz, G. Co-benefits and trade-offs between biodiversity, carbon storage and water flow regulation. For. Ecol. Manag. 2013, 289, 1–9. [Google Scholar] [CrossRef]
  29. Phelps, J.; Friess, D.A.; Webb, E.L. Win–win REDD+ approaches belie carbon–biodiversity trade-offs. Biol. Conserv. 2012, 154, 53–60. [Google Scholar] [CrossRef]
  30. Lin, Y. Forests in Jiangxi Province, China; Chinese Forestry Press: Beijing, China, 1986. [Google Scholar]
  31. Yang, F.X. Overview of forest resource and plant resource in Jiangxi province, China. Ganjing Econ. 1982, 54–55. [Google Scholar]
  32. Xie, G.W. Research on current situation, problems and Countermeasures of forest resources in Jiangxi, China. For. Resour. Manag. 1992, 4, 11–16. [Google Scholar]
  33. Leng, Q.B.; Du, T.Z.; Wang, L.Q. Researched on forest ecosystem construction in Jiangxi, China. Jiangxi For. Sci. Technol. 2007, 4, 6–10. [Google Scholar]
  34. Ding, D.S.; Qiu, N.F. Current stands and sustainable control on forest pestand disease in Jiangxi. Jiangxi For. Sci. Technol. 2001, 5, 28–32. [Google Scholar]
  35. Zhu, H.N.; Zhan, Z.; Yang, Y.N.; Hu, Y.M.; Gu, W.Q. Current situation, problems and countermeasures of forest management in Jiangxi Province. Jiangxi For. Sci. Technol. 2009, 1, 36–39. [Google Scholar]
  36. Zhao, R.D.; Fan, J.B.; He, Y.Q.; Song, C.L.; Tu, R.F.; Tan, B.C. Research on soil enzyme activities and limiting factors for restoration of degraded pinus massoniana plantation. Acta Pedol. Sin. 2011, 48, 1287–1292. [Google Scholar]
  37. Zhou, W.B.; Wan, J.B.; Zheng, B.F. Ecological Protection and Comprehensive Utilization of Resources in Five Watersheds and One Lake in Jiangxi Province; Science Press: Beijing, China, 2012. [Google Scholar]
  38. Natural Capital Project. InVEST 3.1.0 User’s Guide. 2014. Available online: http://ncp-dev.stanford.edu/~dataportal/invest releases/documentation/current_release/ (accessed on 7 March 2022).
  39. Wang, B.; Wei, W.J. Carbon Storage and Density of Forests in Jiangxi Province. Jiangxi Sci. 2007, 25, 681–687. [Google Scholar]
  40. Li, T.; Liu, K.; Hu, S.; Bao, Y.B. Soil erosion and ecological benefits evaluation of Qinling Mountains based on the InVEST model. Resour. Environ. Yangtze Basin 2014, 23, 1242–1250. [Google Scholar]
  41. Fang, J.Y.; Liu, G.H.; Xu, S.L. Biomass and net production of forest vegetation in China. Acta Ecol. Sin. 1996, 16, 497–508. [Google Scholar]
  42. Zeng, W.S. Analysis on biomass conversion factors of five tree species in China. For. Resour. Manag. 2012, 5, 85–88. [Google Scholar]
  43. Band, L.E.; Hwang, T.; Hales, T.C.; Vose, J.; Ford, C. Ecosystem processes at the watershed scale: Mapping and modeling eco-hydrological controls of landslides. Geomorphology 2012, 137, 159–167. [Google Scholar] [CrossRef]
  44. Carpenter, S.R.; Mooney, H.A.; Agard, J.; Capistrano, D.; DeFries, R.S.; Diaz, S.; Dietz, T.; Duraiappah, A.K.; Oteng-Yeboah, A.; Pereira, H.M. Science for managing ecosystem services: Beyond the Millennium Ecosystem Assessment. Proc. Natl. Acad. Sci. USA 2009, 106, 1305–1312. [Google Scholar] [CrossRef] [Green Version]
  45. Egoh, B.N.; Reyers, B.; Carwardine, J.; Bode, M.; O’Farrell, P.J.; Wilson, K.A.; Possingham, H.P.; Rouget, M.; de Lange, W.; Richardson, D.M. Safeguarding Biodiversity and Ecosystem Services in the Little Karoo, South Africa. Conserv. Biol. 2010, 24, 1021–1030. [Google Scholar] [CrossRef]
  46. Carnus, J.M.; Parrotta, J.; Brockerhoff, E.; Arbez, M.; Jactel, H.; Kremer, A.; Lamb, D.; O’Hara, K.; Walters, B. Planted forests and biodiversity. J. For. 2006, 2, 65–77. [Google Scholar]
  47. Jackson, R.B.; Jobbágy, E.G.; Avissar, R.; Roy, S.B.; Barrett, D.J.; Cook, C.W.; Farley, K.A.; le Maitre, D.C.; McCarl, B.A.; Murray, B.C. Trading Water for carbon with biological carbon sequestration. Science 2005, 310, 1944–1947. [Google Scholar] [PubMed] [Green Version]
  48. Merino, A.; Fernández-López, A.; Solla-Gullón, F.; Edeso, J.M. Soil changes and tree growth in intensively managed Pinus radiata in northern Spain. For. Ecol. Manag. 2004, 196, 393–404. [Google Scholar] [CrossRef]
  49. Lara, A.; Little, C.; Urrutia, R.; McPhee, J.; Alvarez-Garreton, C.; Oyarzun, C.; Soto, D.; Donoso, P.; Nahuelhual, L.; Pino, M. Assessment of ecosystem services as an opportunity for the conservation and management of native forest in Chile. For. Ecol. Manag. 2009, 258, 415–424. [Google Scholar]
  50. Garmendia, E.; Mariel, P.; Tamayo, I.; Aizpuru, I.; Zabaleta, A. Assessing the effect of alternative land uses in the provision of water resources: Evidence and policy implications from southern Europe. Land Use Policy 2011, 29, 761–771. [Google Scholar] [CrossRef]
  51. Chisholm, R.A. Trade-offs between ecosystem services: Water and carbon in a biodiversity hotspot. Ecol. Ecosyst. 2010, 69, 1973–1987. [Google Scholar]
  52. Sanchez-Canales, M.; Lopez-Benito, A.; Acuna, V.; Ziv, G.; Hamel, P.; Chaplin-Kramer, R.; Elorza, F.J. Sensitivity analysis of a sediment dynamics model applied in a Mediterranean river basin: Global change and management implications. Sci. Total Environ. 2015, 502, 602–610. [Google Scholar]
  53. Vangansbeke, P.; Blondeel, H.; Landuyt, D.P.; Frenne, D.; Gorissen, L.; Verheyen, K. Spatially combining wood production and recreation with biodiversity conservation. Biodivers. Conserv. 2017, 26, 3213–3239. [Google Scholar]
  54. Zhang, J.; Zhu, W.; Zhu, L.; Li, Y. Multi-scale analysis of trade-off/synergistic effects of forest ecosystem services in the Funiu Mountain Region, China. J. Geogr. Sci. 2022, 32, 981–999. [Google Scholar] [CrossRef]
Figure 1. Location of the Gan River Basin and its main forest types.
Sustainability 14 08271 g001
Figure 2. Diagram of the ecosystem service interaction analysis.
Sustainability 14 08271 g002
Figure 3. Spatial patterns of carbon storage, water yield, soil retention and wood volume service in the GRB.
Sustainability 14 08271 g003
Figure 4. Total and per hectare production of the four ecosystem services by the different forest types: A, Pine forest; B, Chinese fir forest; C, the broad-leaf forest; D, Bamboo forest; E, Economic forest; F, Bushes and shrubs: (top left) Carbon services, (top right) Water services, (lower left) Soil services and (lower right) Wood services.
Sustainability 14 08271 g004
Figure 5. Spatial patterns of trade-offs and synergies among the four ecosystem services in the GRB: (top left) Good synergy, (top right) Bad (poor) synergy, (bottom left) Strong trade-offs and (bottom right) Weak trade-offs.
Sustainability 14 08271 g005aSustainability 14 08271 g005b
Figure 6. Typical synergies and trade-offs between ecosystem services of different forest types: (a) Pine forest; (b) Chinese fir forest; (c) broad-leaf forest; (d) Bamboo forest; (e) Economic forest; (f) Bushes and shrubs. C is carbon storage, W is water yield, S is soil retention and V is volume accumulation.
Sustainability 14 08271 g006
Figure 7. Ecosystem services’ comprehensive capacity map in the GRB: C, Carbon storage; W, Water yield; S, Soil retention; V, Volume accumulation: (top left) C + W + S + V, (top middle) all low, (top right) C + S + V, (lower left) W + S, (lower middle) W + V + S and (lower right) C + W + S.
Sustainability 14 08271 g007
Table 1. Breaking values used to assign each ecosystem service provision level *.
Production Level Carbon Water Wood Volume Soil Retention
1 0~0.70~0.530~0.260~0.53
2 0.7~0.80.53~0.70.26~0.400.53~0.77
3 0.8~10.7~10.40~10.77~1
* Here, ‘1′ denotes low, ‘2′ denotes medium and ‘3′ denotes high using a 3-class classification scheme generated by the natural breaks algorithm using ARCGIS.
Table 2. Classification criteria for the synergies and trade-offs between ecosystem services.
Service RelationshipService Providing CapacityArea (%)
ClassSub-Class
Synergy Good synergy4 high0.32
3 high 1 medium4.52
2 high 2 medium12.12
1 high 3 medium8.17
4 medium1.58
Poor synergy4 low0.13
3 medium 1 low3.01
2 medium 2 low4.26
1 medium 3 low0.17
Trade-off Weak trade-off3 high 1 low5.32
2 high 1 medium 1 low16.24
2 high 2 low10.86
Strong trade-off1 high 2 medium 1 low13.97
1 high 1 medium 2 low15.87
1 high 3 low3.45
Publisher’s Note: MDPI stays neutral with regard to jurisdictional claims in published maps and institutional affiliations.

