
Energy, Environmental Impact and Indoor Environmental Quality of Add-Ons in Buildings

 , , ,
, , ,  , ,
, , 
Abstract
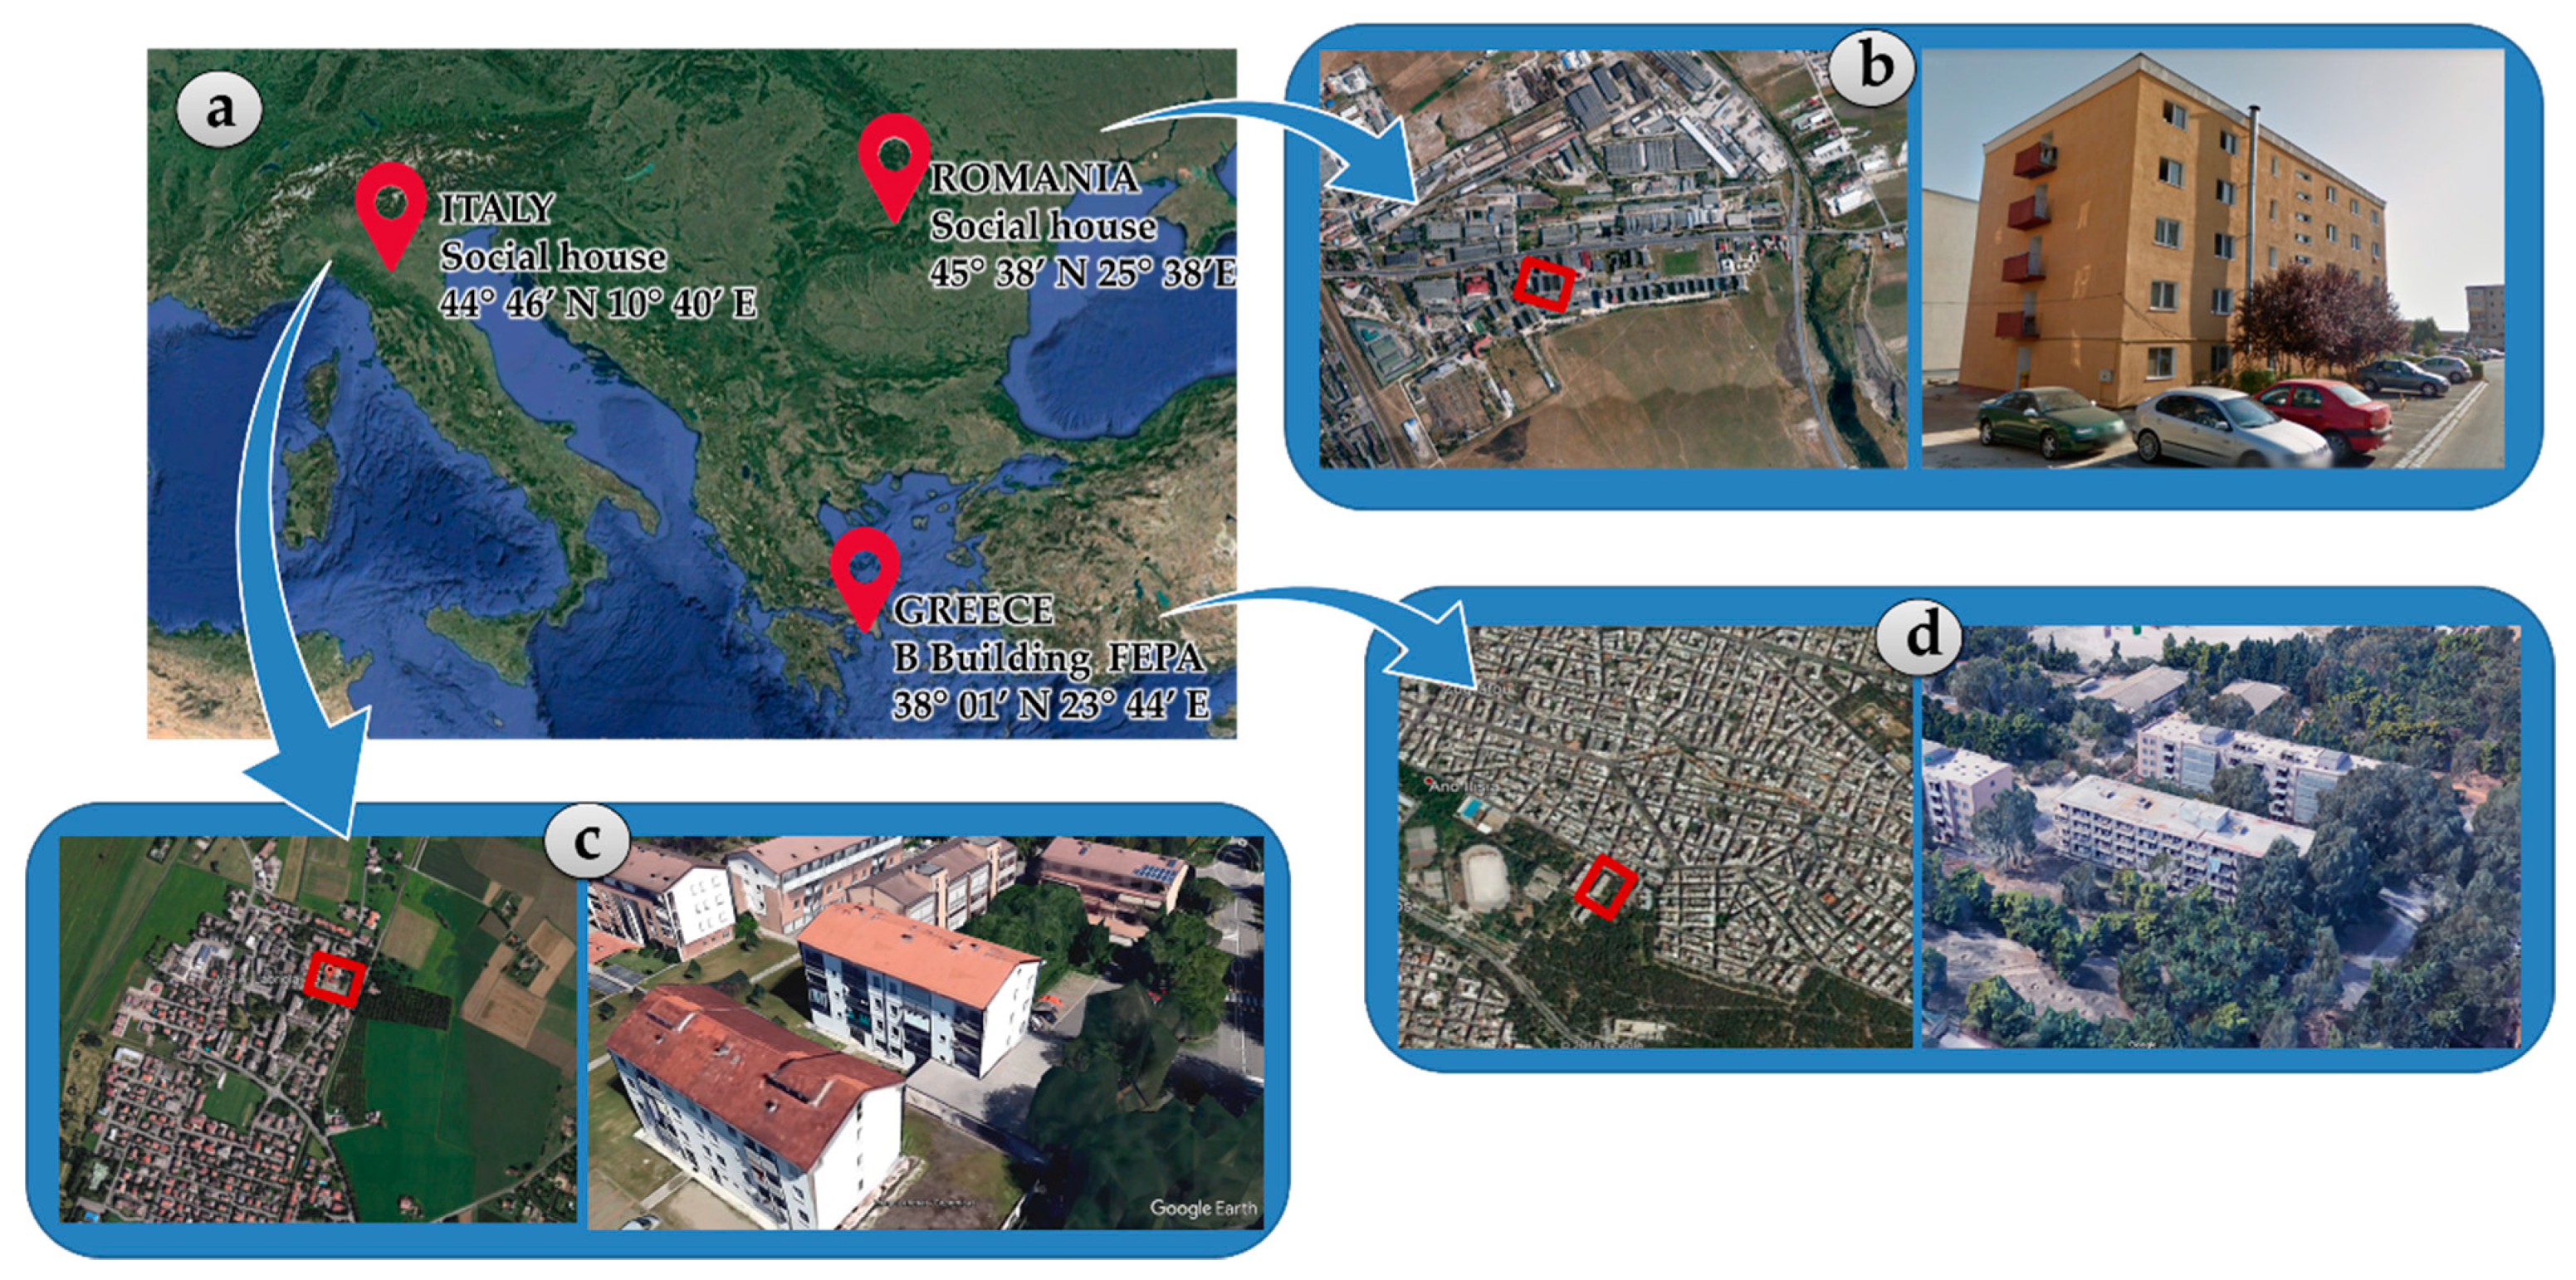
:1. Introduction
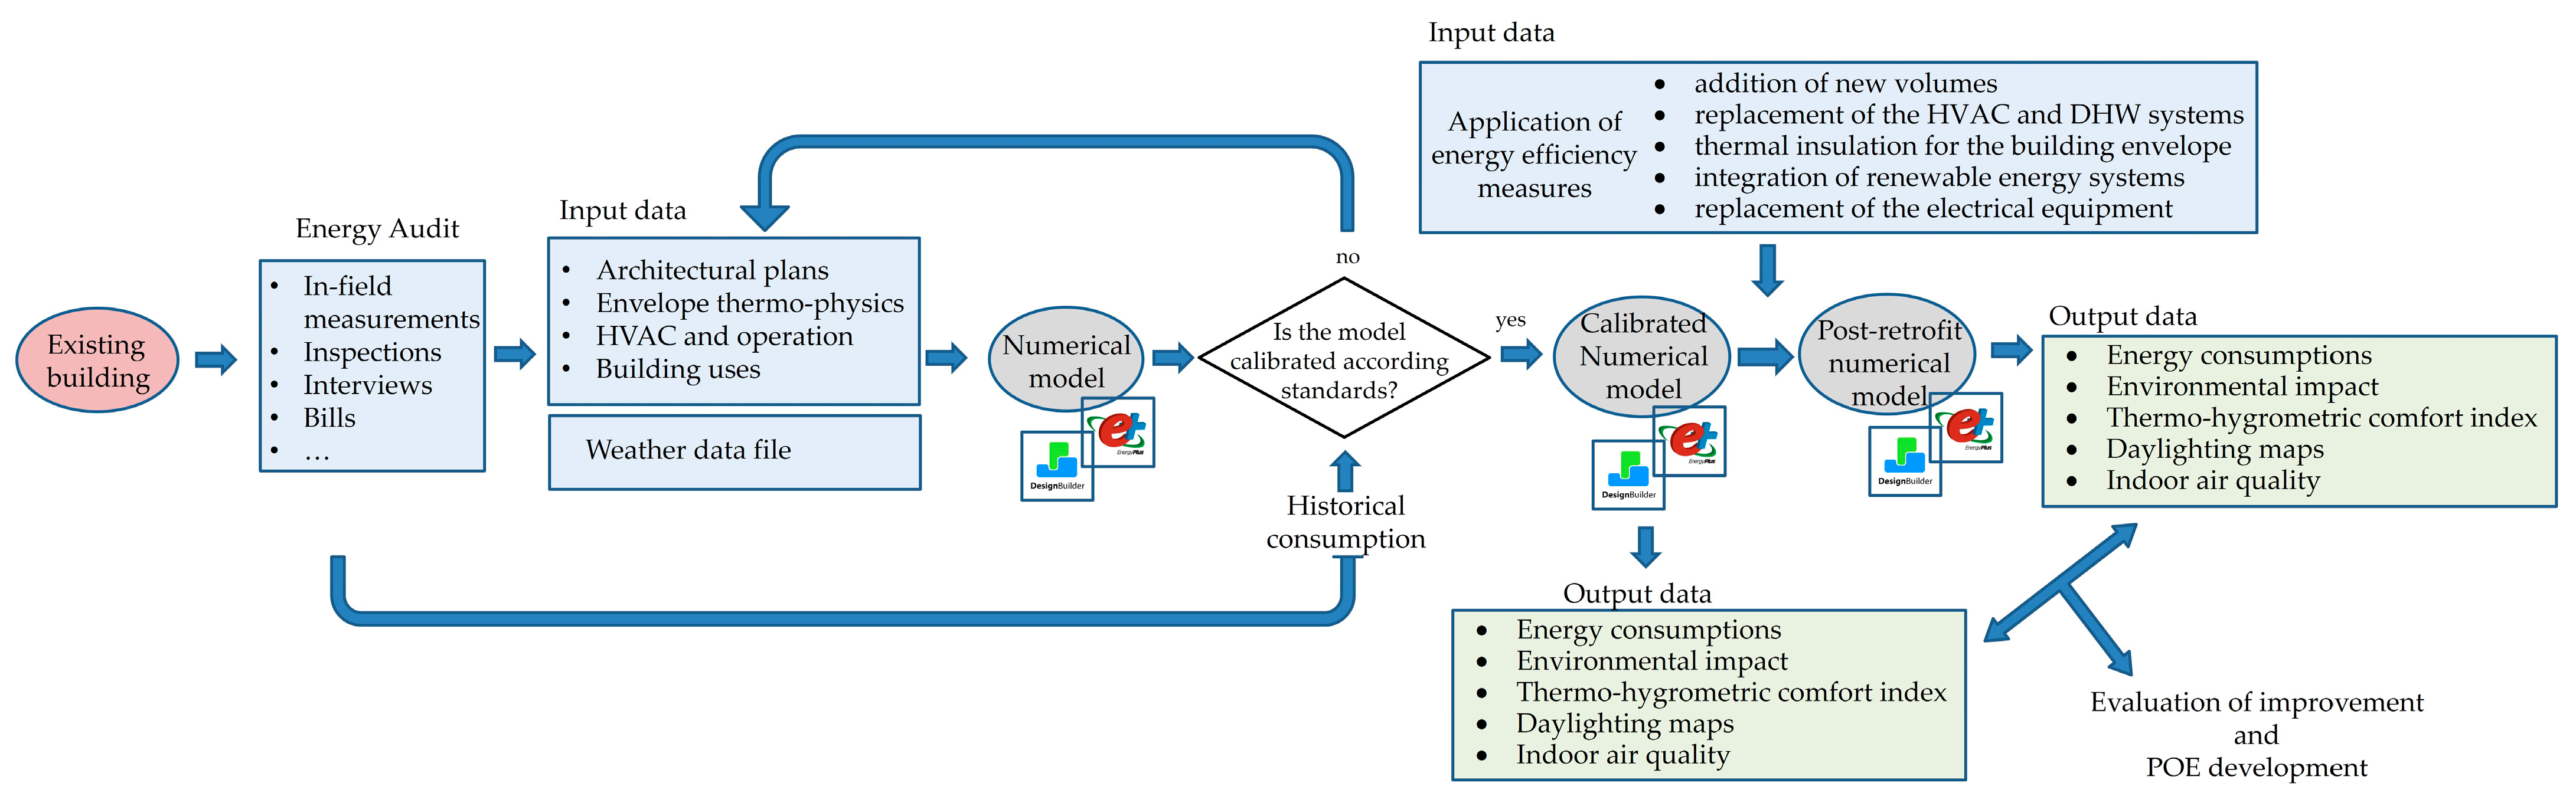
2. Methodological Approach
- For the pre-retrofit stage:
- a.
- Building energy audit and collection of whole information regarding architectural aspects; building envelope thermo-physics; HVAC-system and equipment characterization; building uses and thermal zones; historical energy consumption; users judgments, through in-field measurements, inspections, and stakeholders’ interviews.
- b.
- For the post-retrofit stage:
- a.
- Definition of HVAC-envelope system refurbishment according to the main issues identified in step 1.a and implementation in the numerical model defined in step 1.b.
- b.
- Analysis of energy and environmental impact.
- c.
- Improvement of IEQ in terms of thermo-hygrometric comfort, daylighting evaluation, and indoor air quality.
- d.
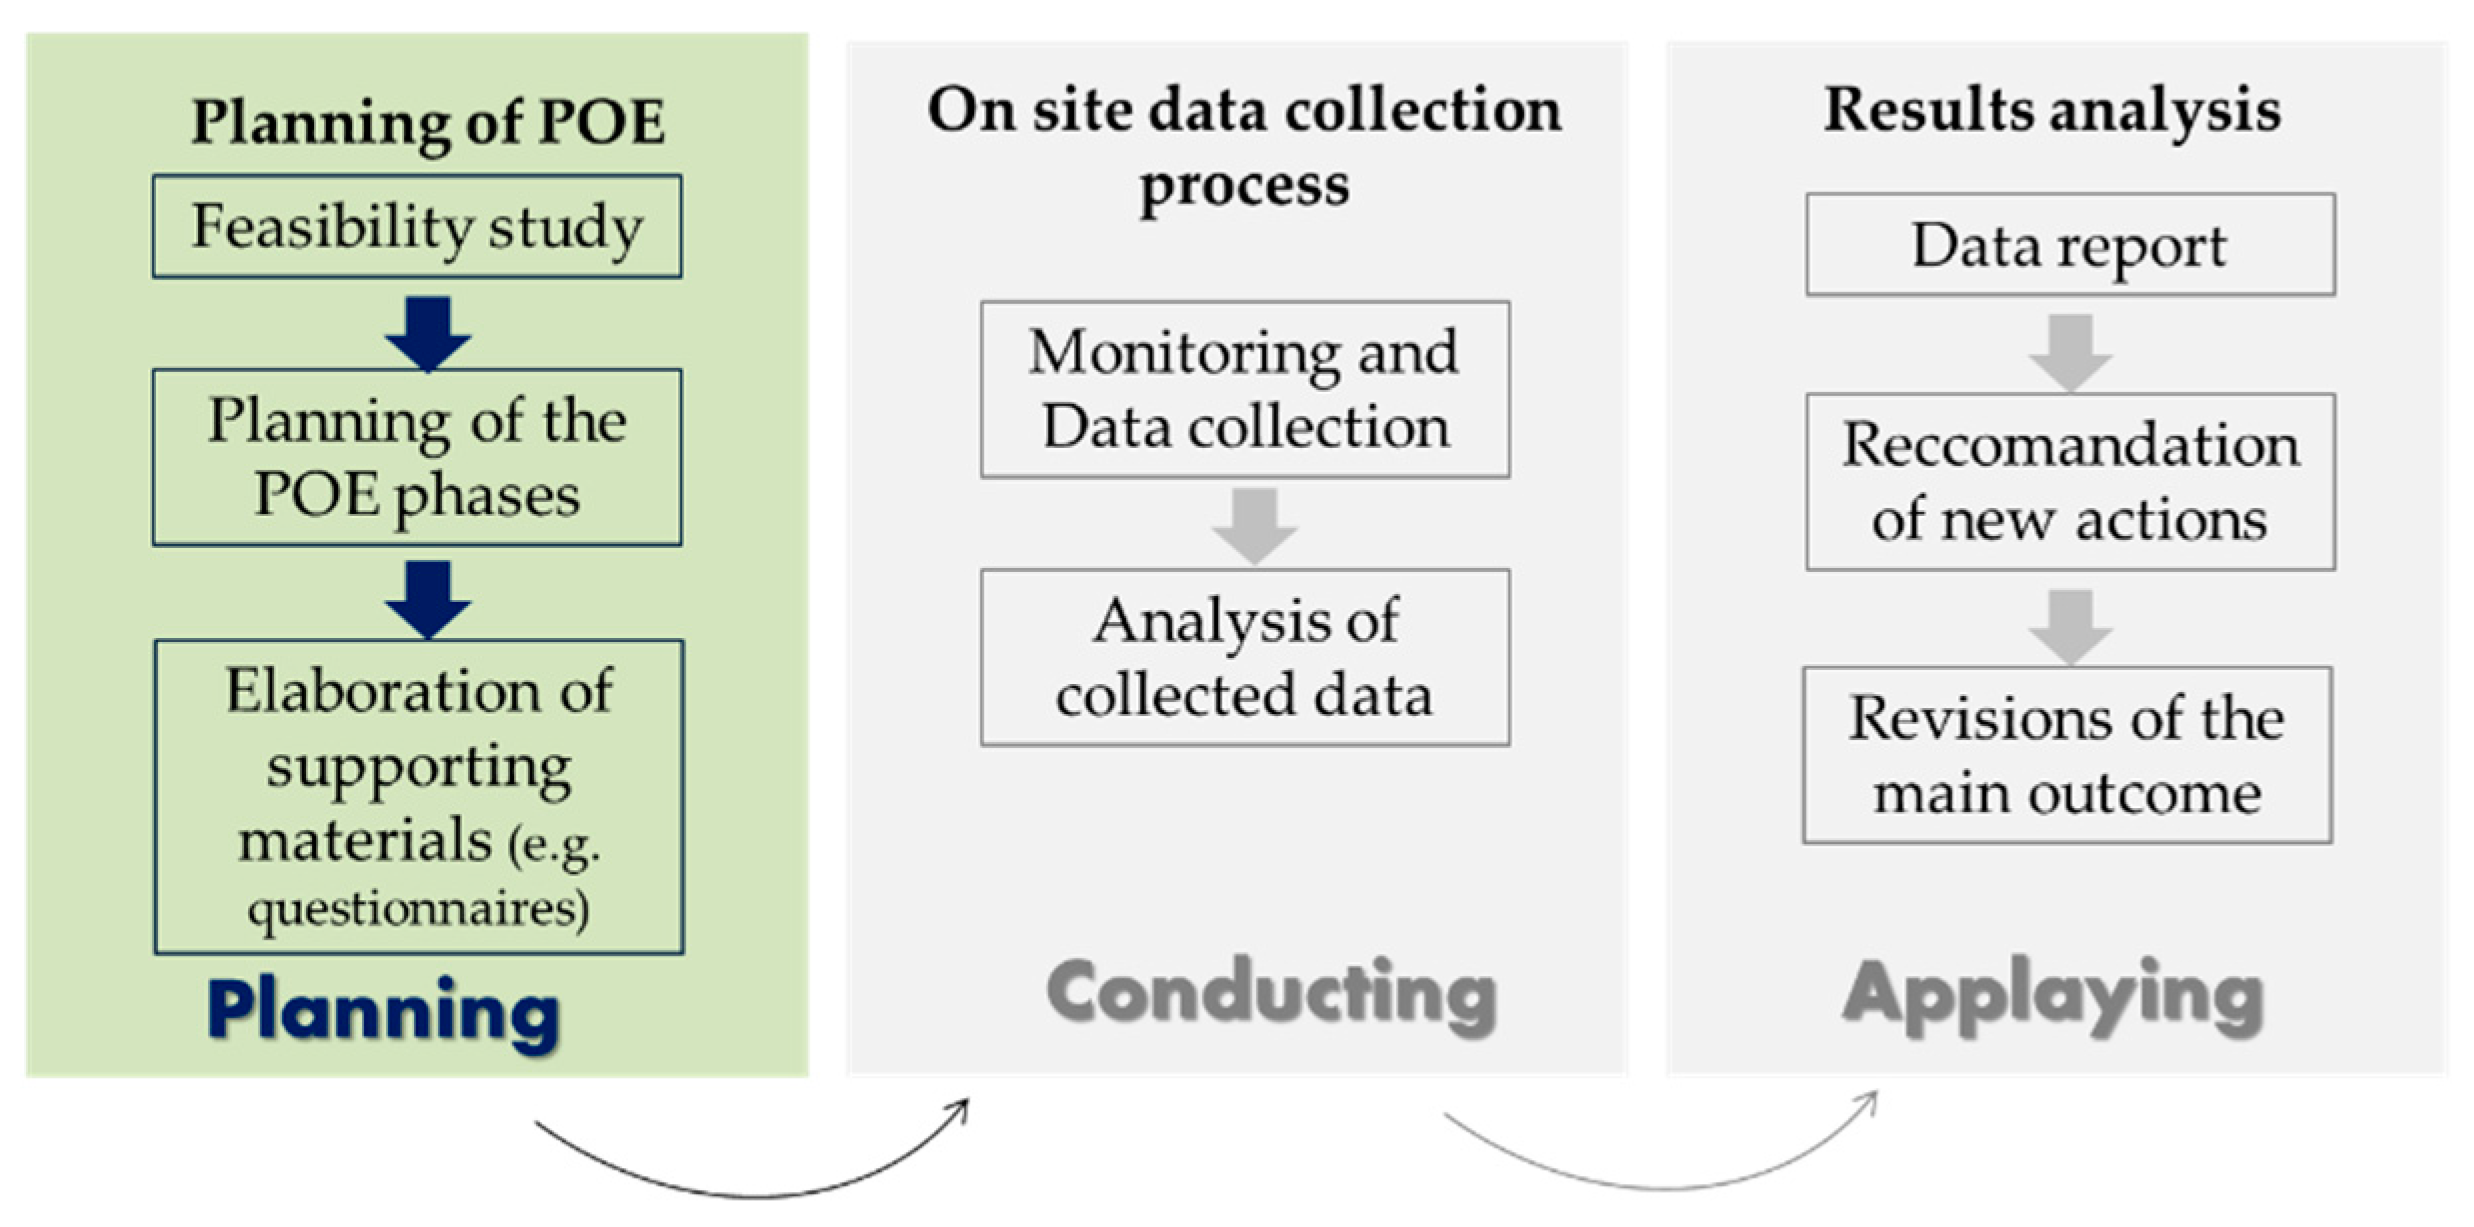
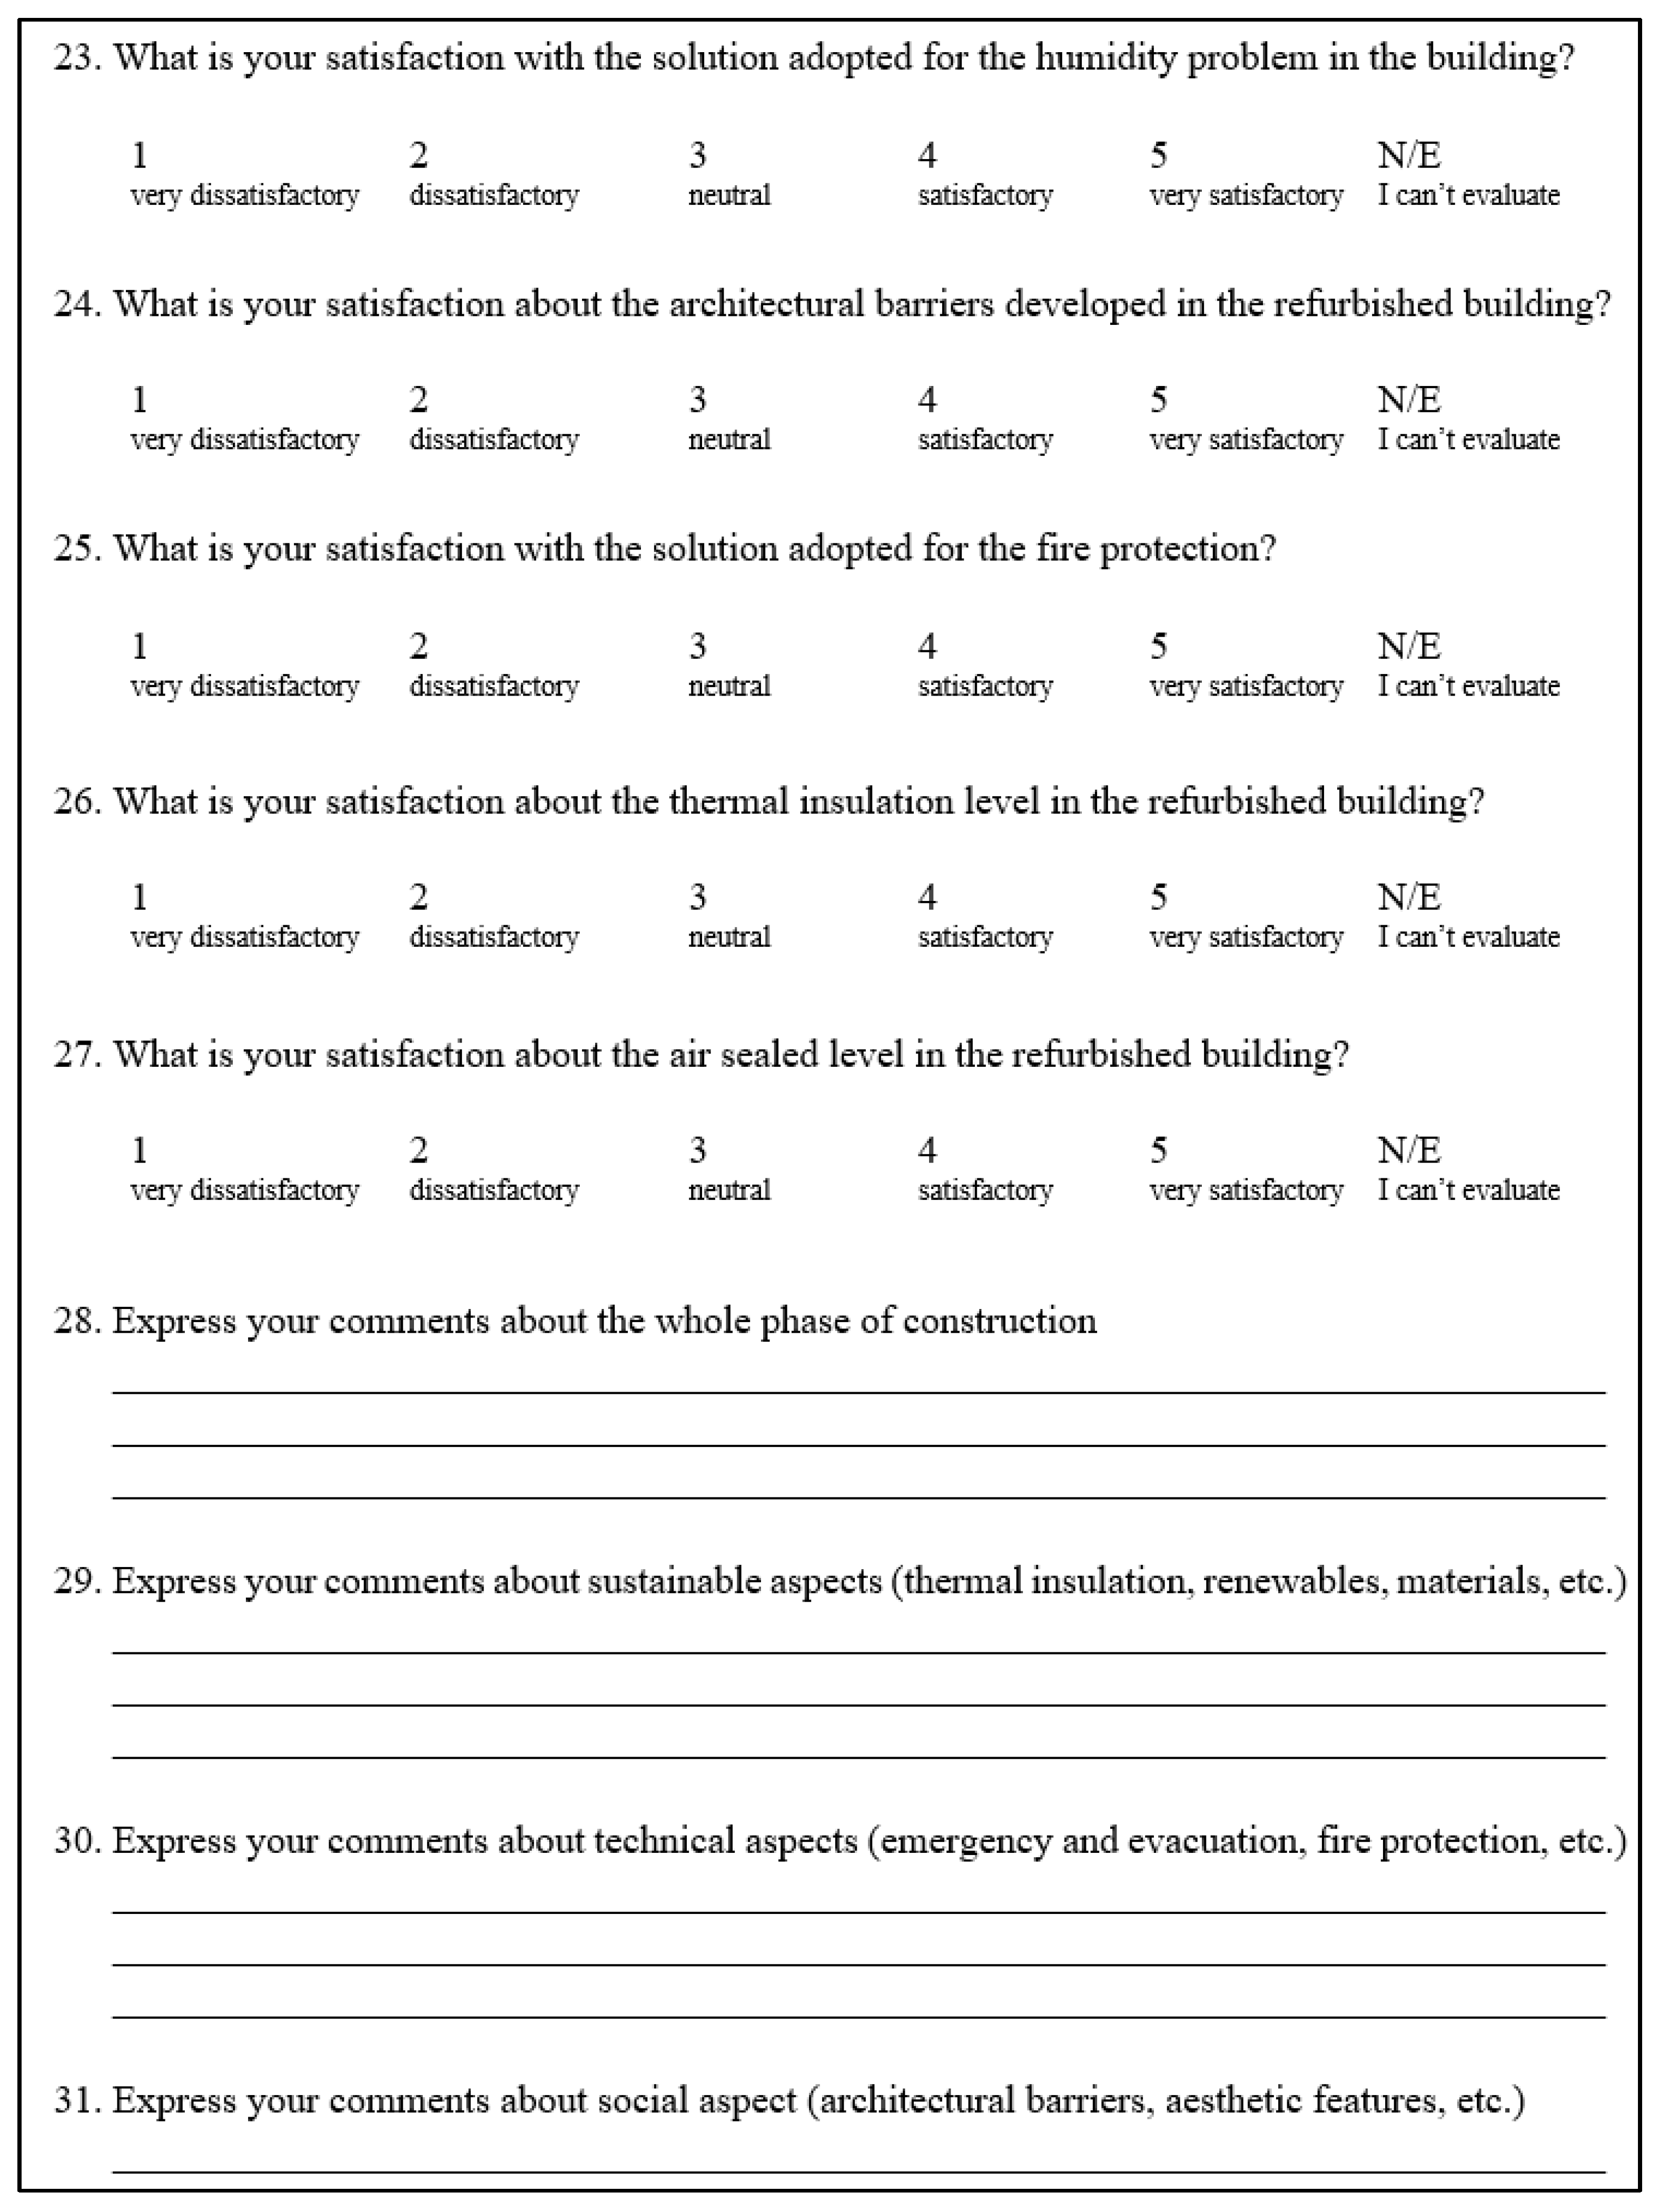
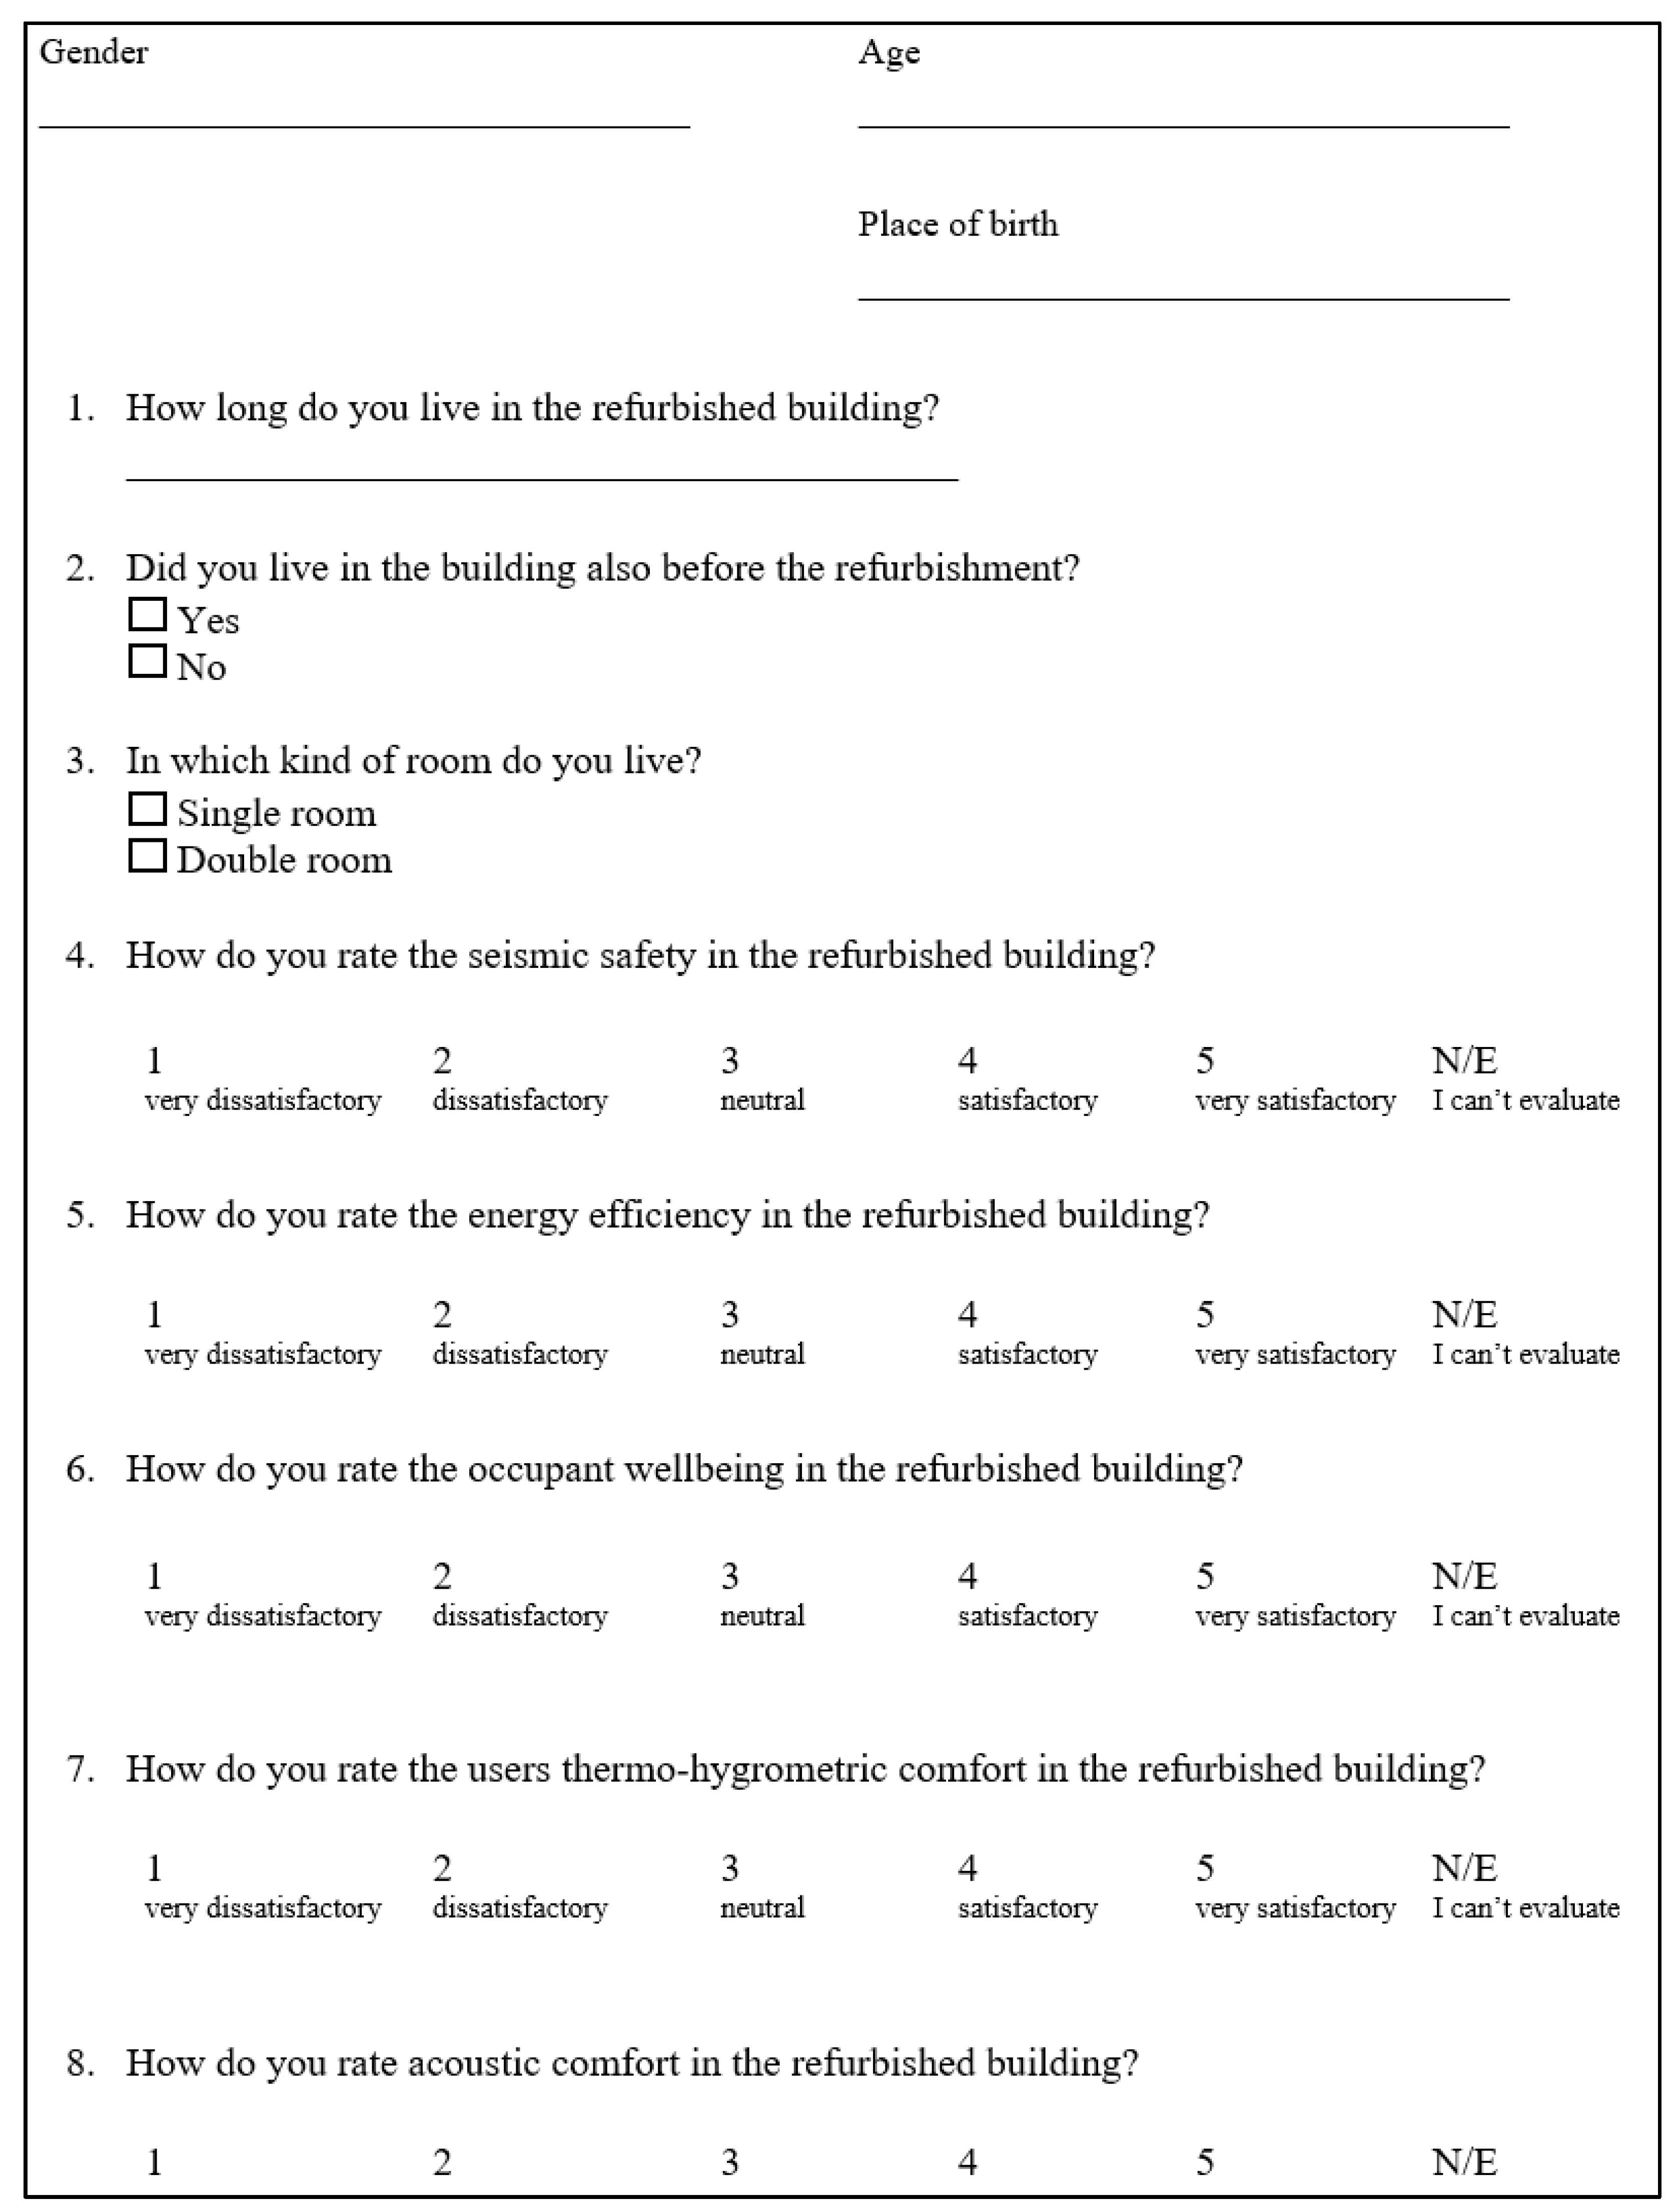
- Development of Post-Occupancy Evaluation (POE) with questionnaires to identify the level of satisfaction of both administrators and occupants.
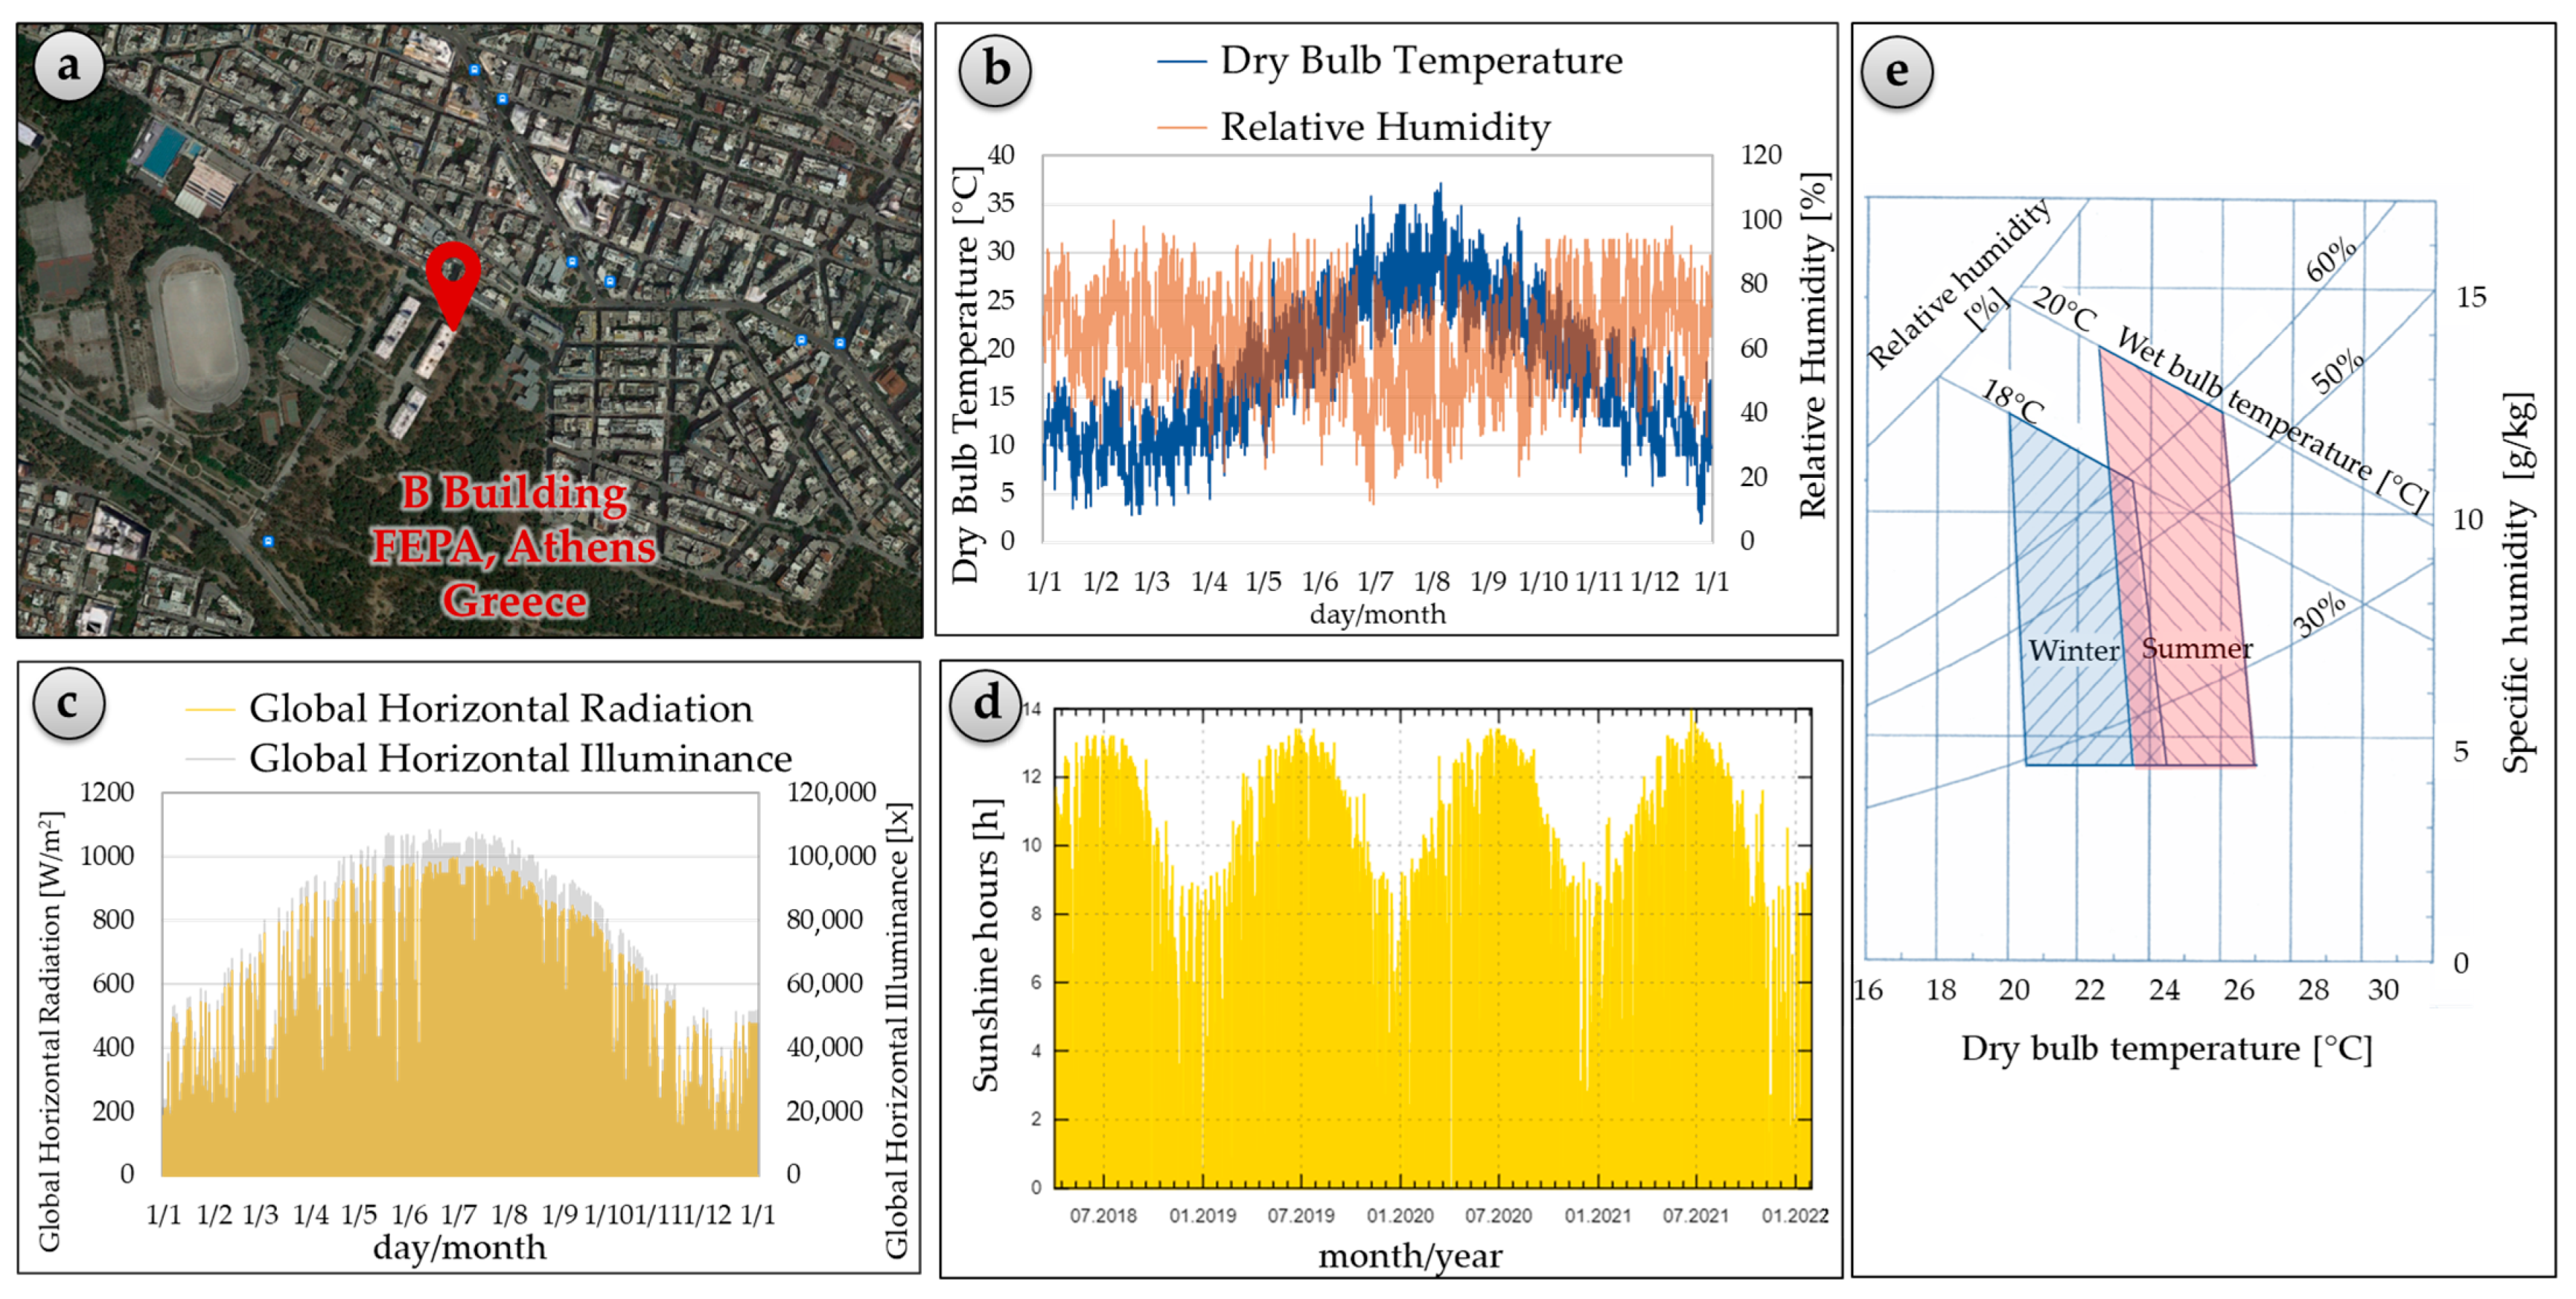
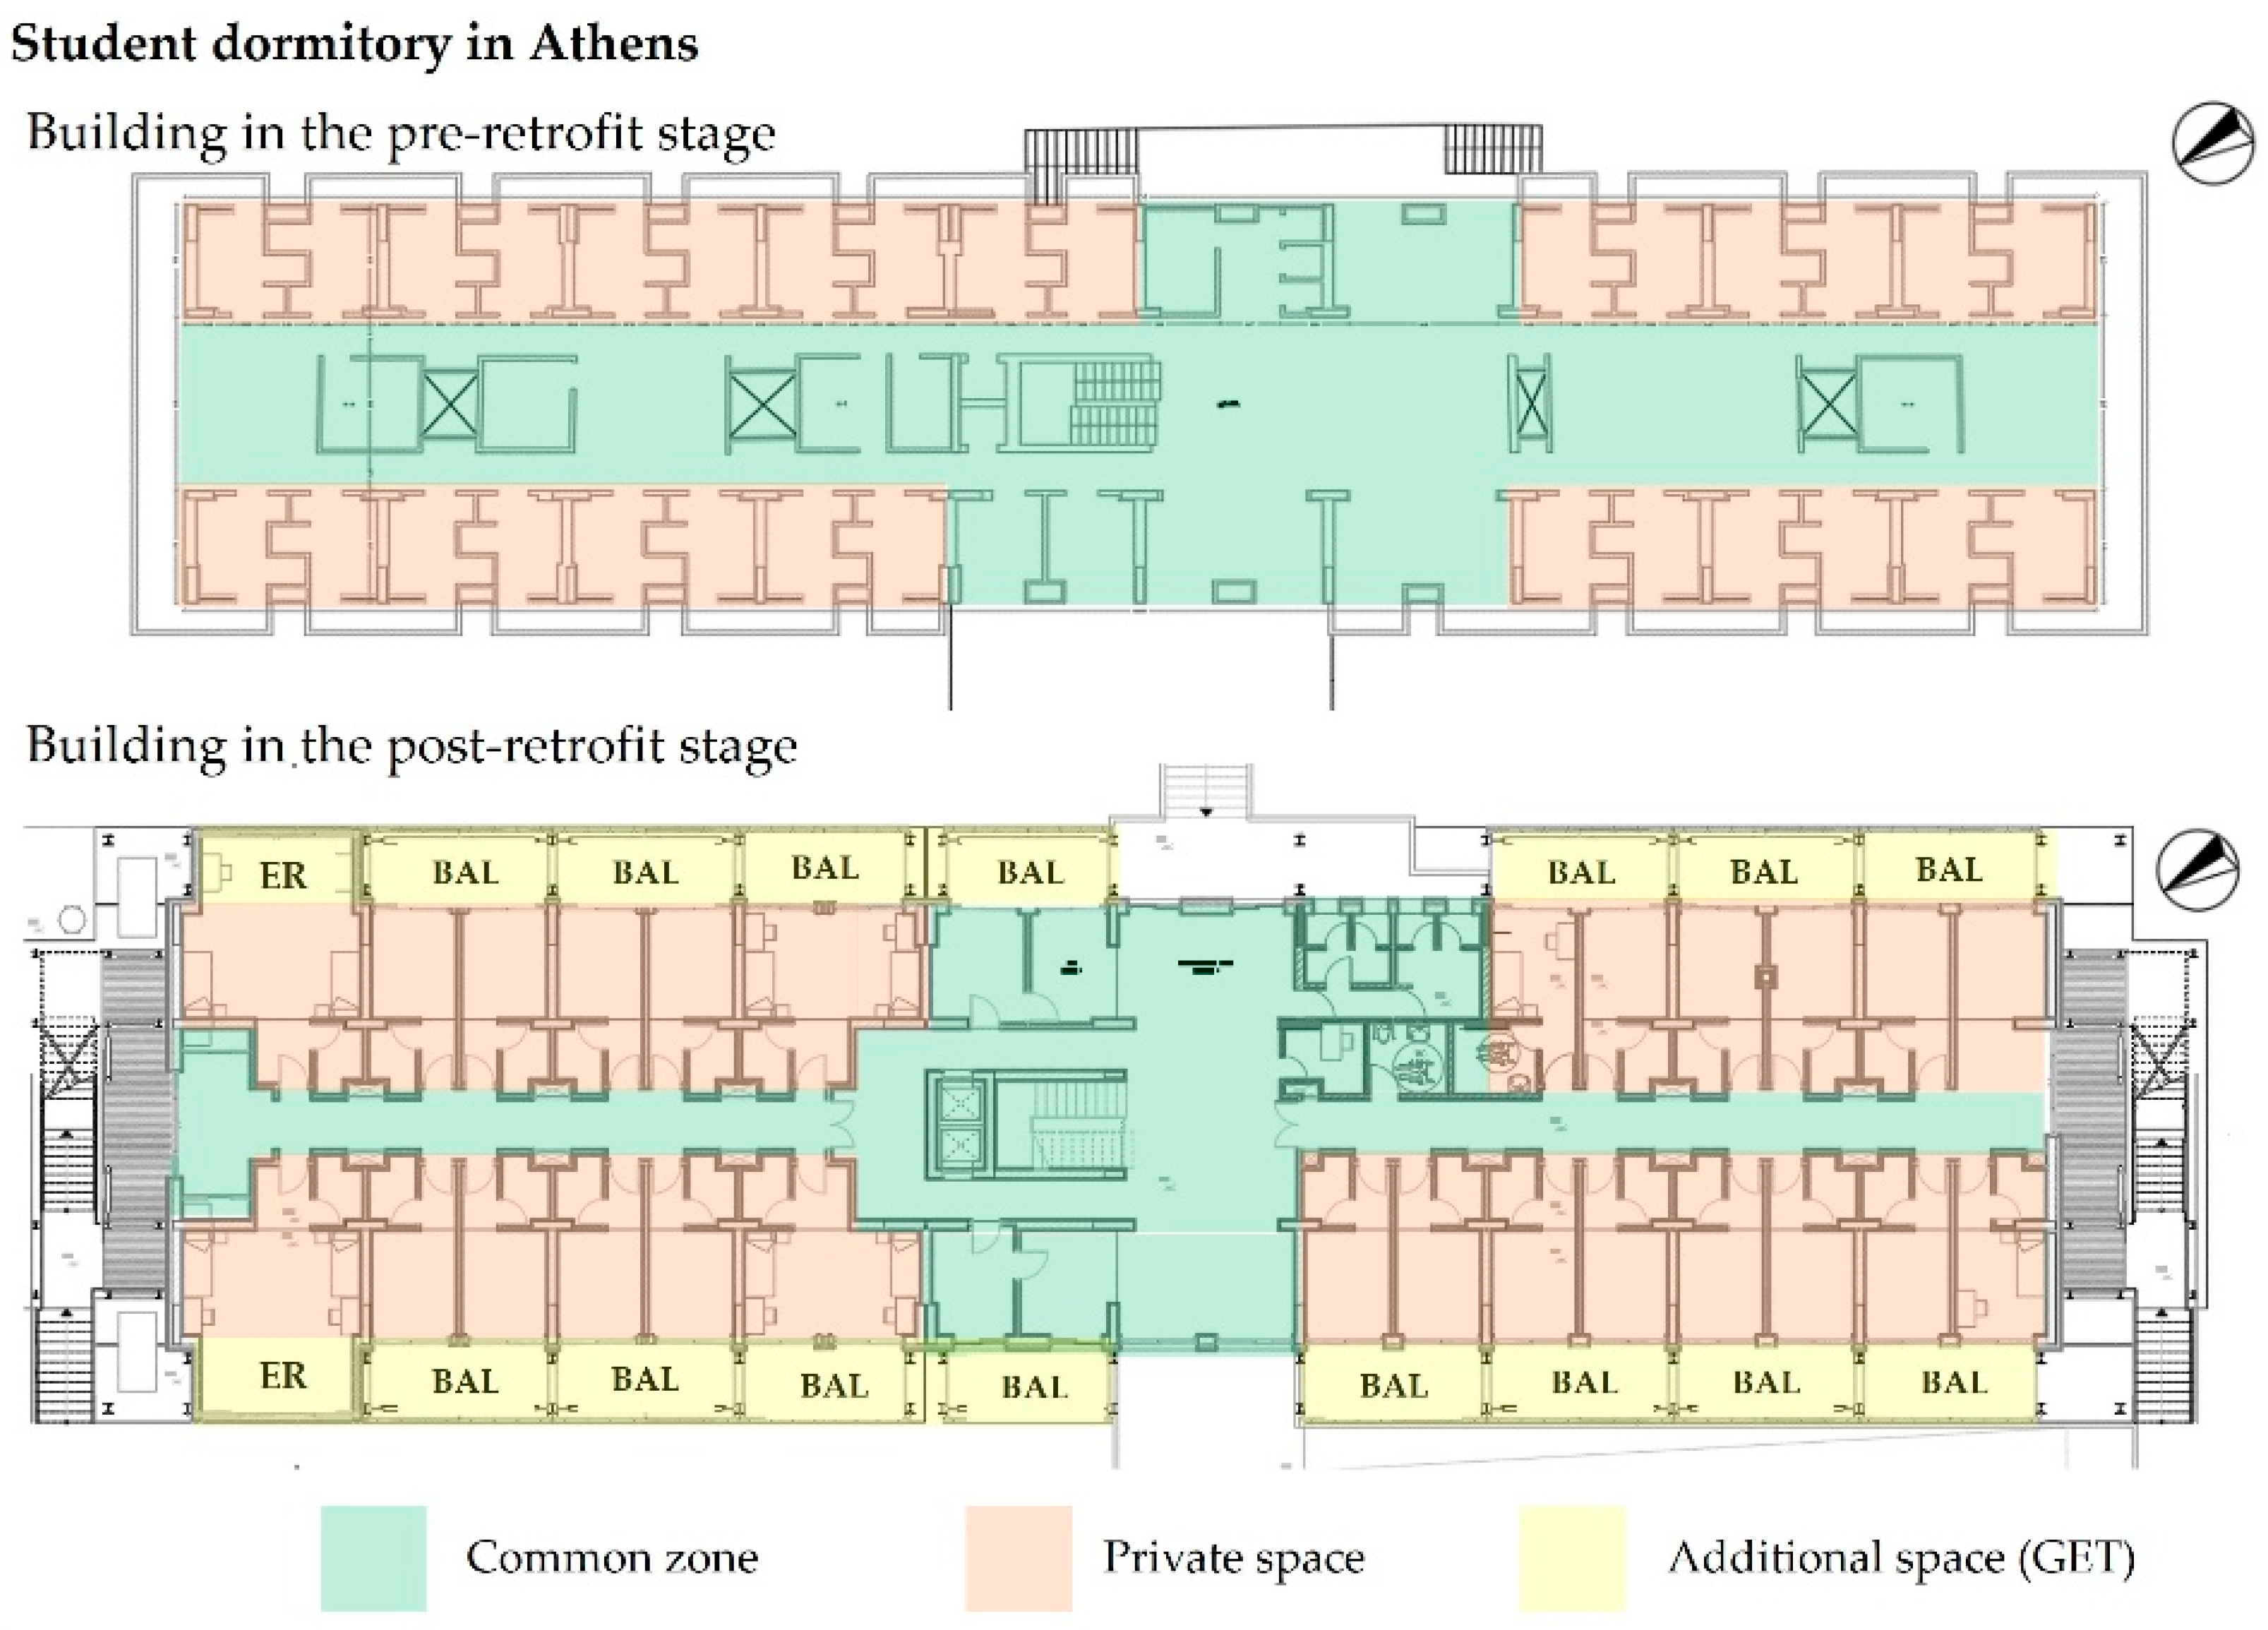
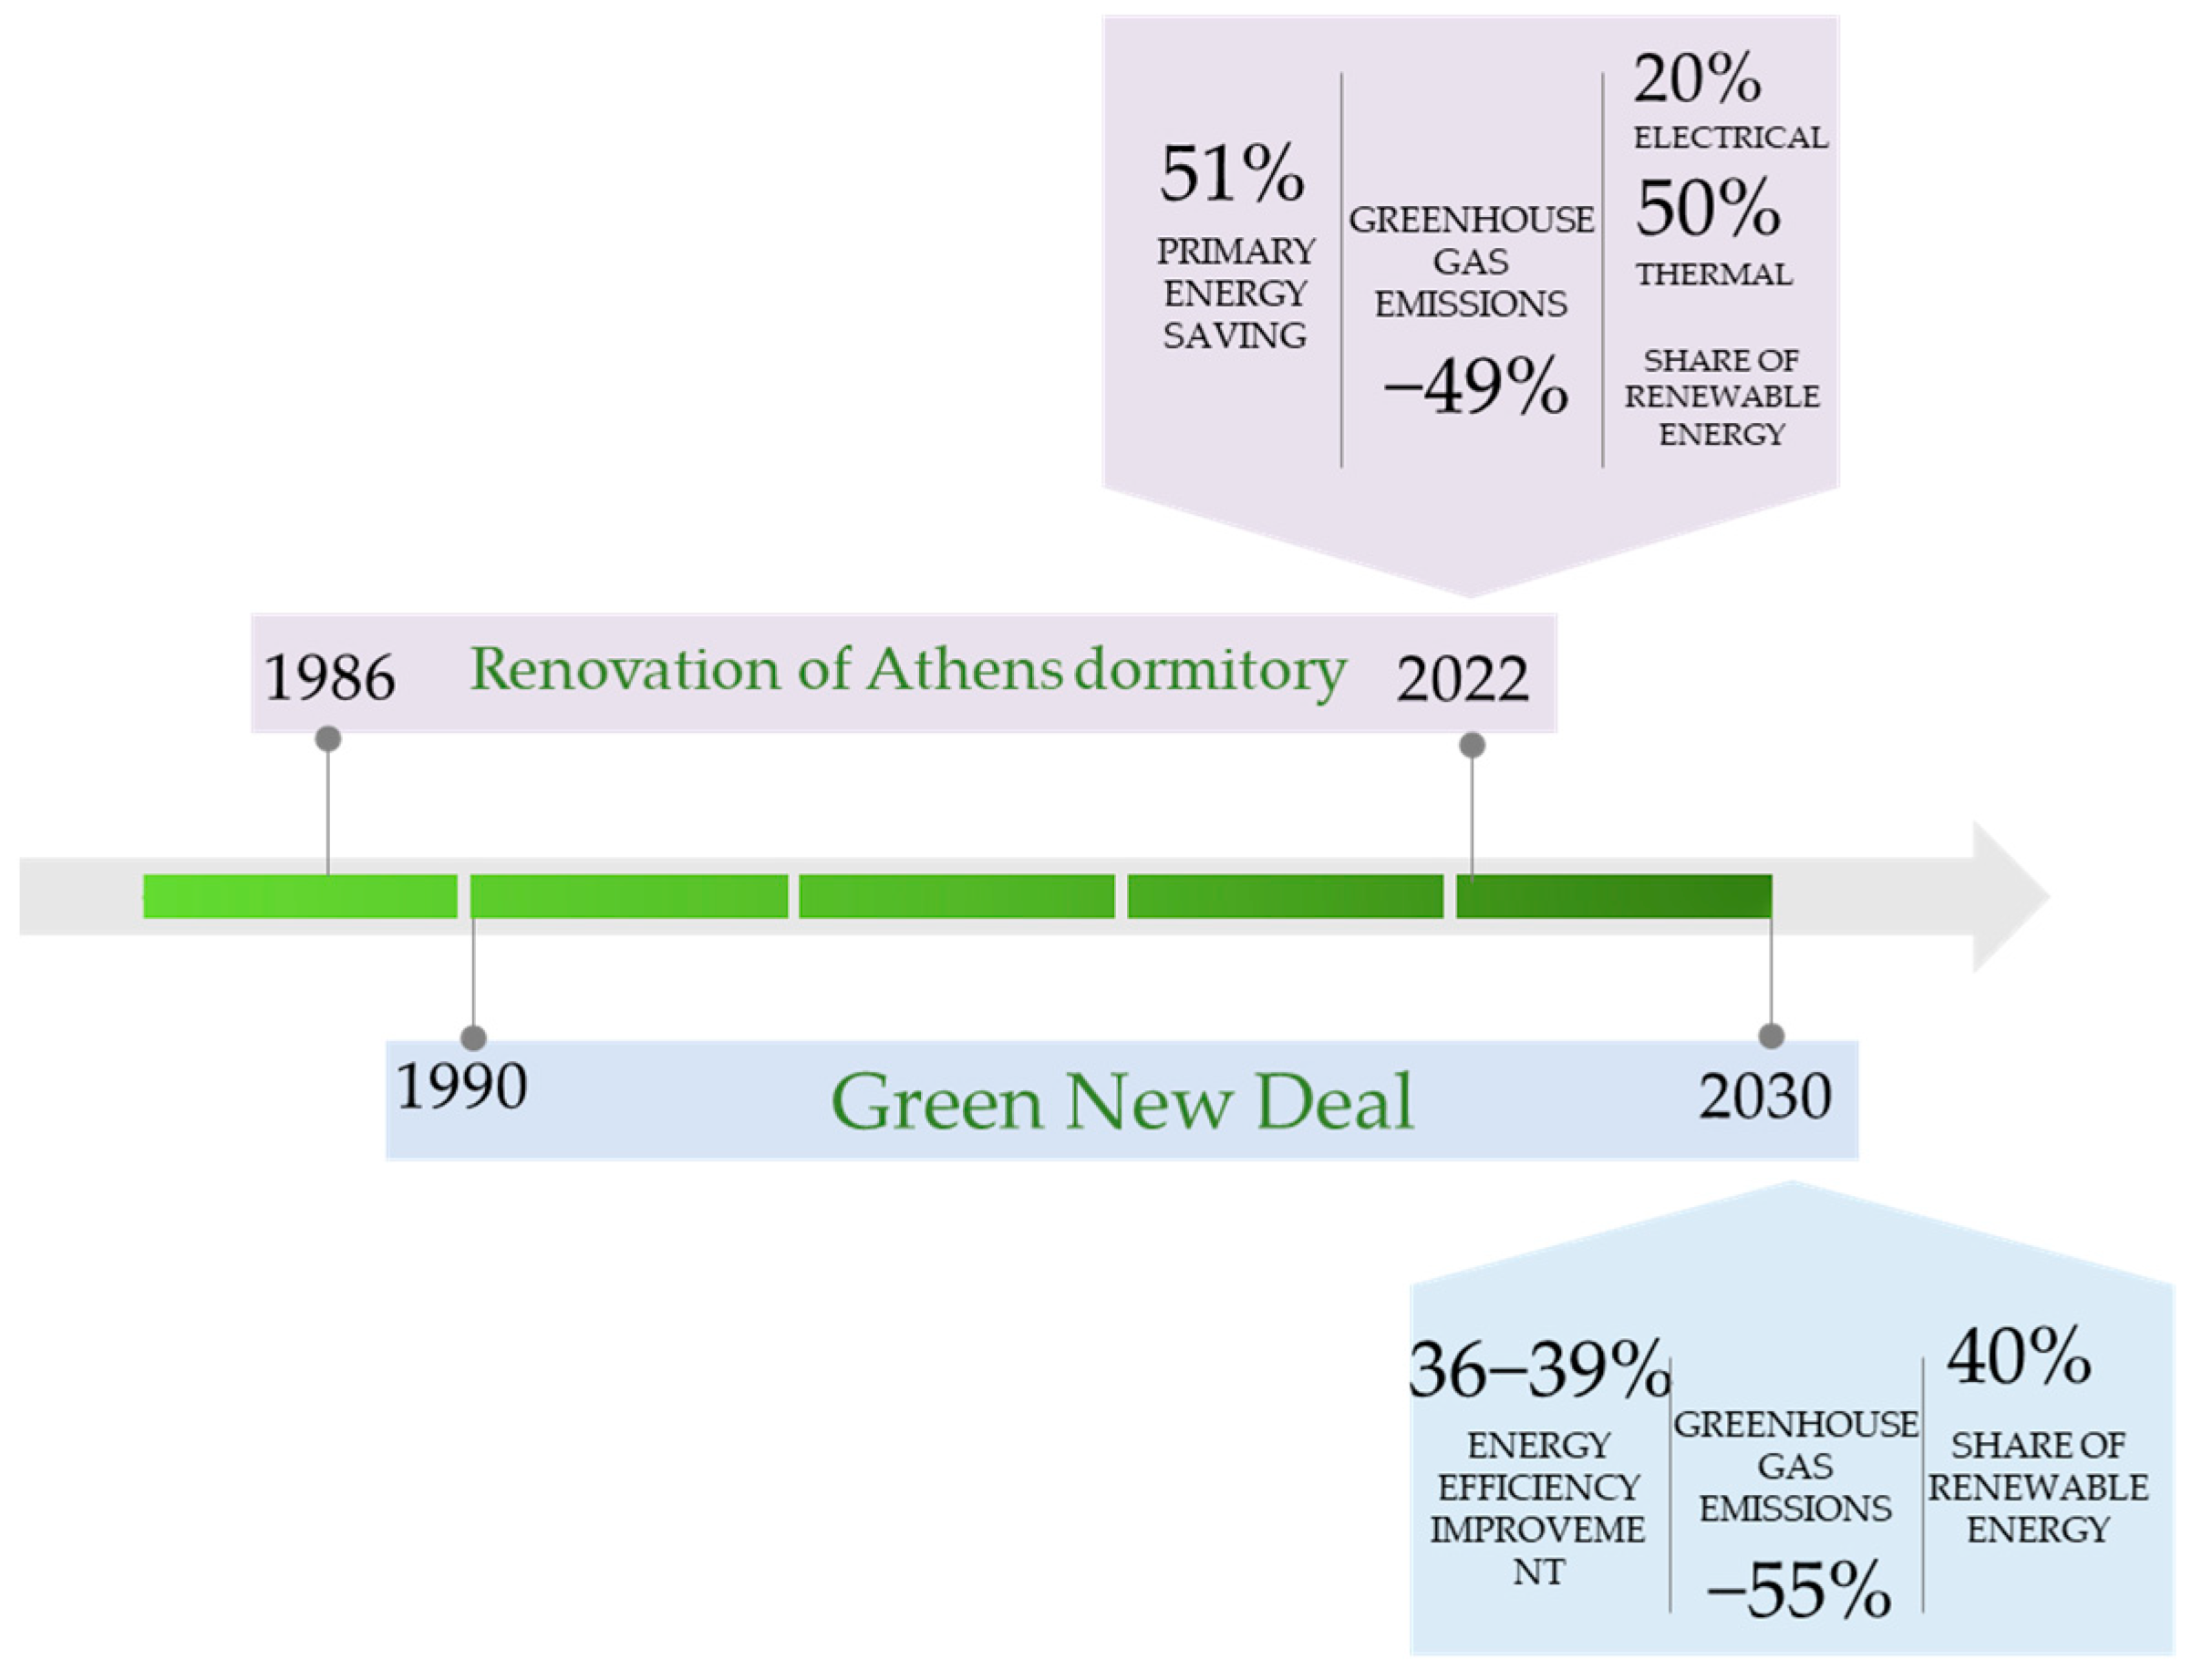
3. Case Study: The Building Renovation of Athens Dormitory
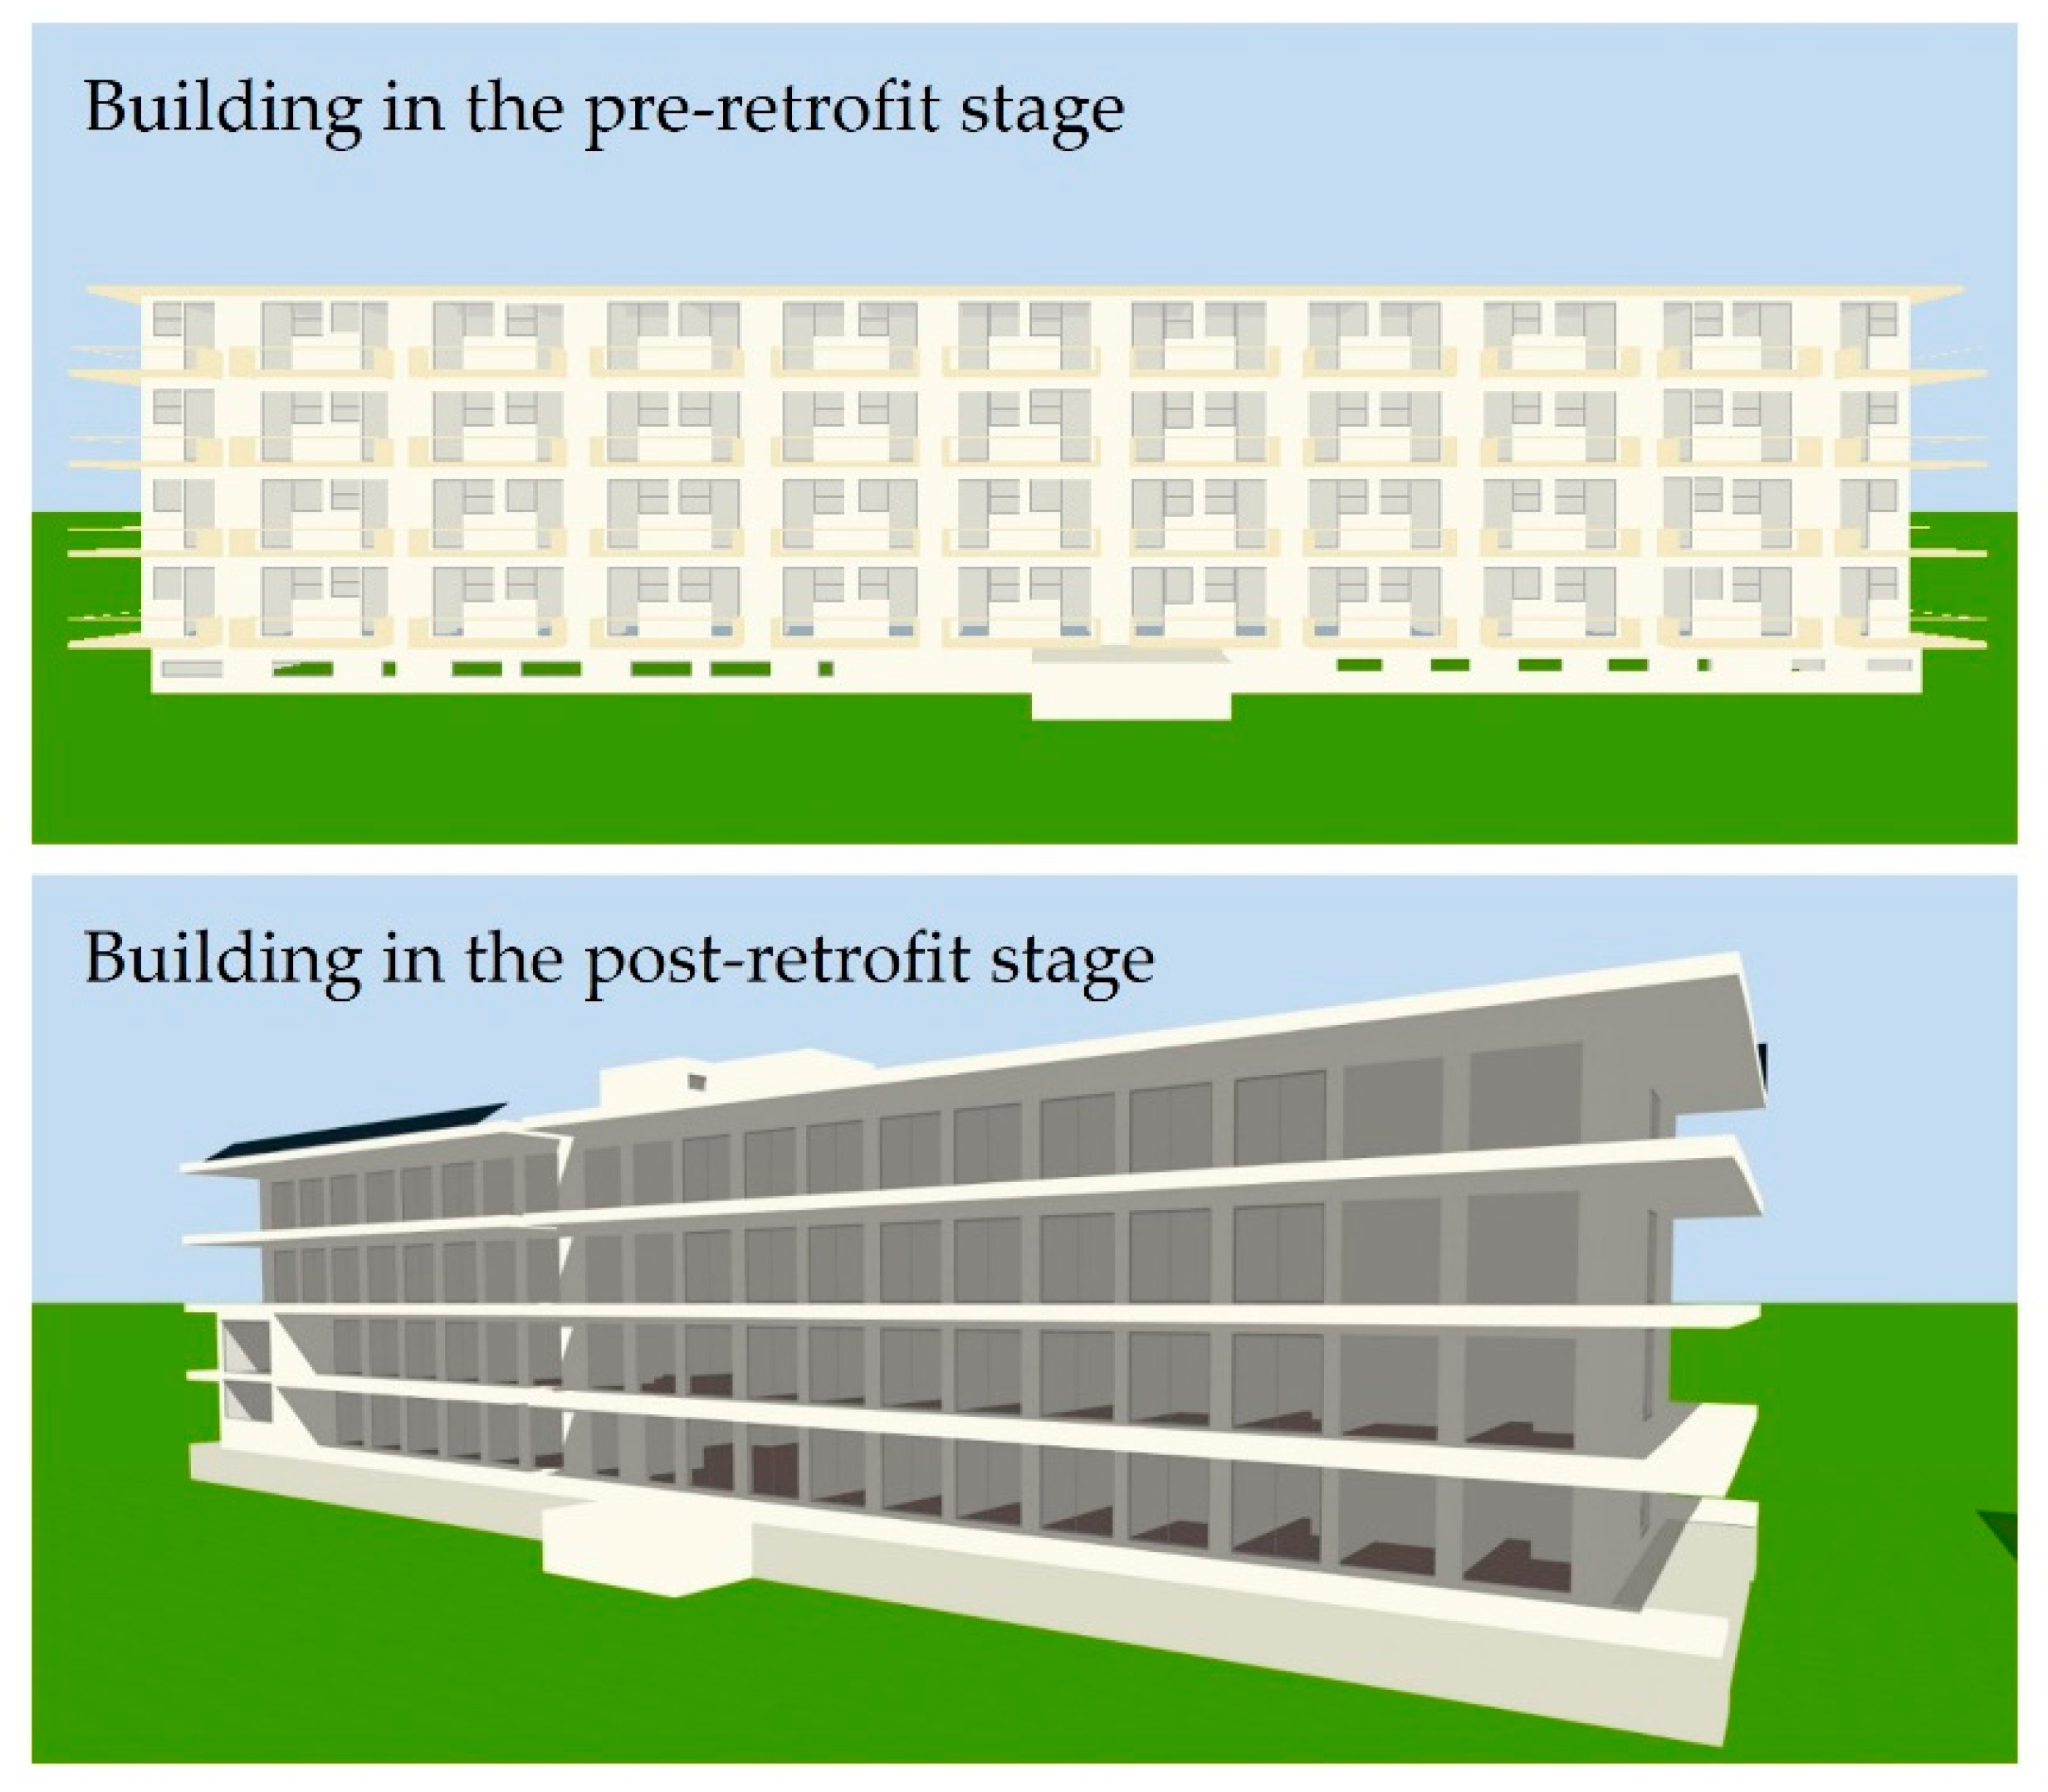
- the addition of new volumes;
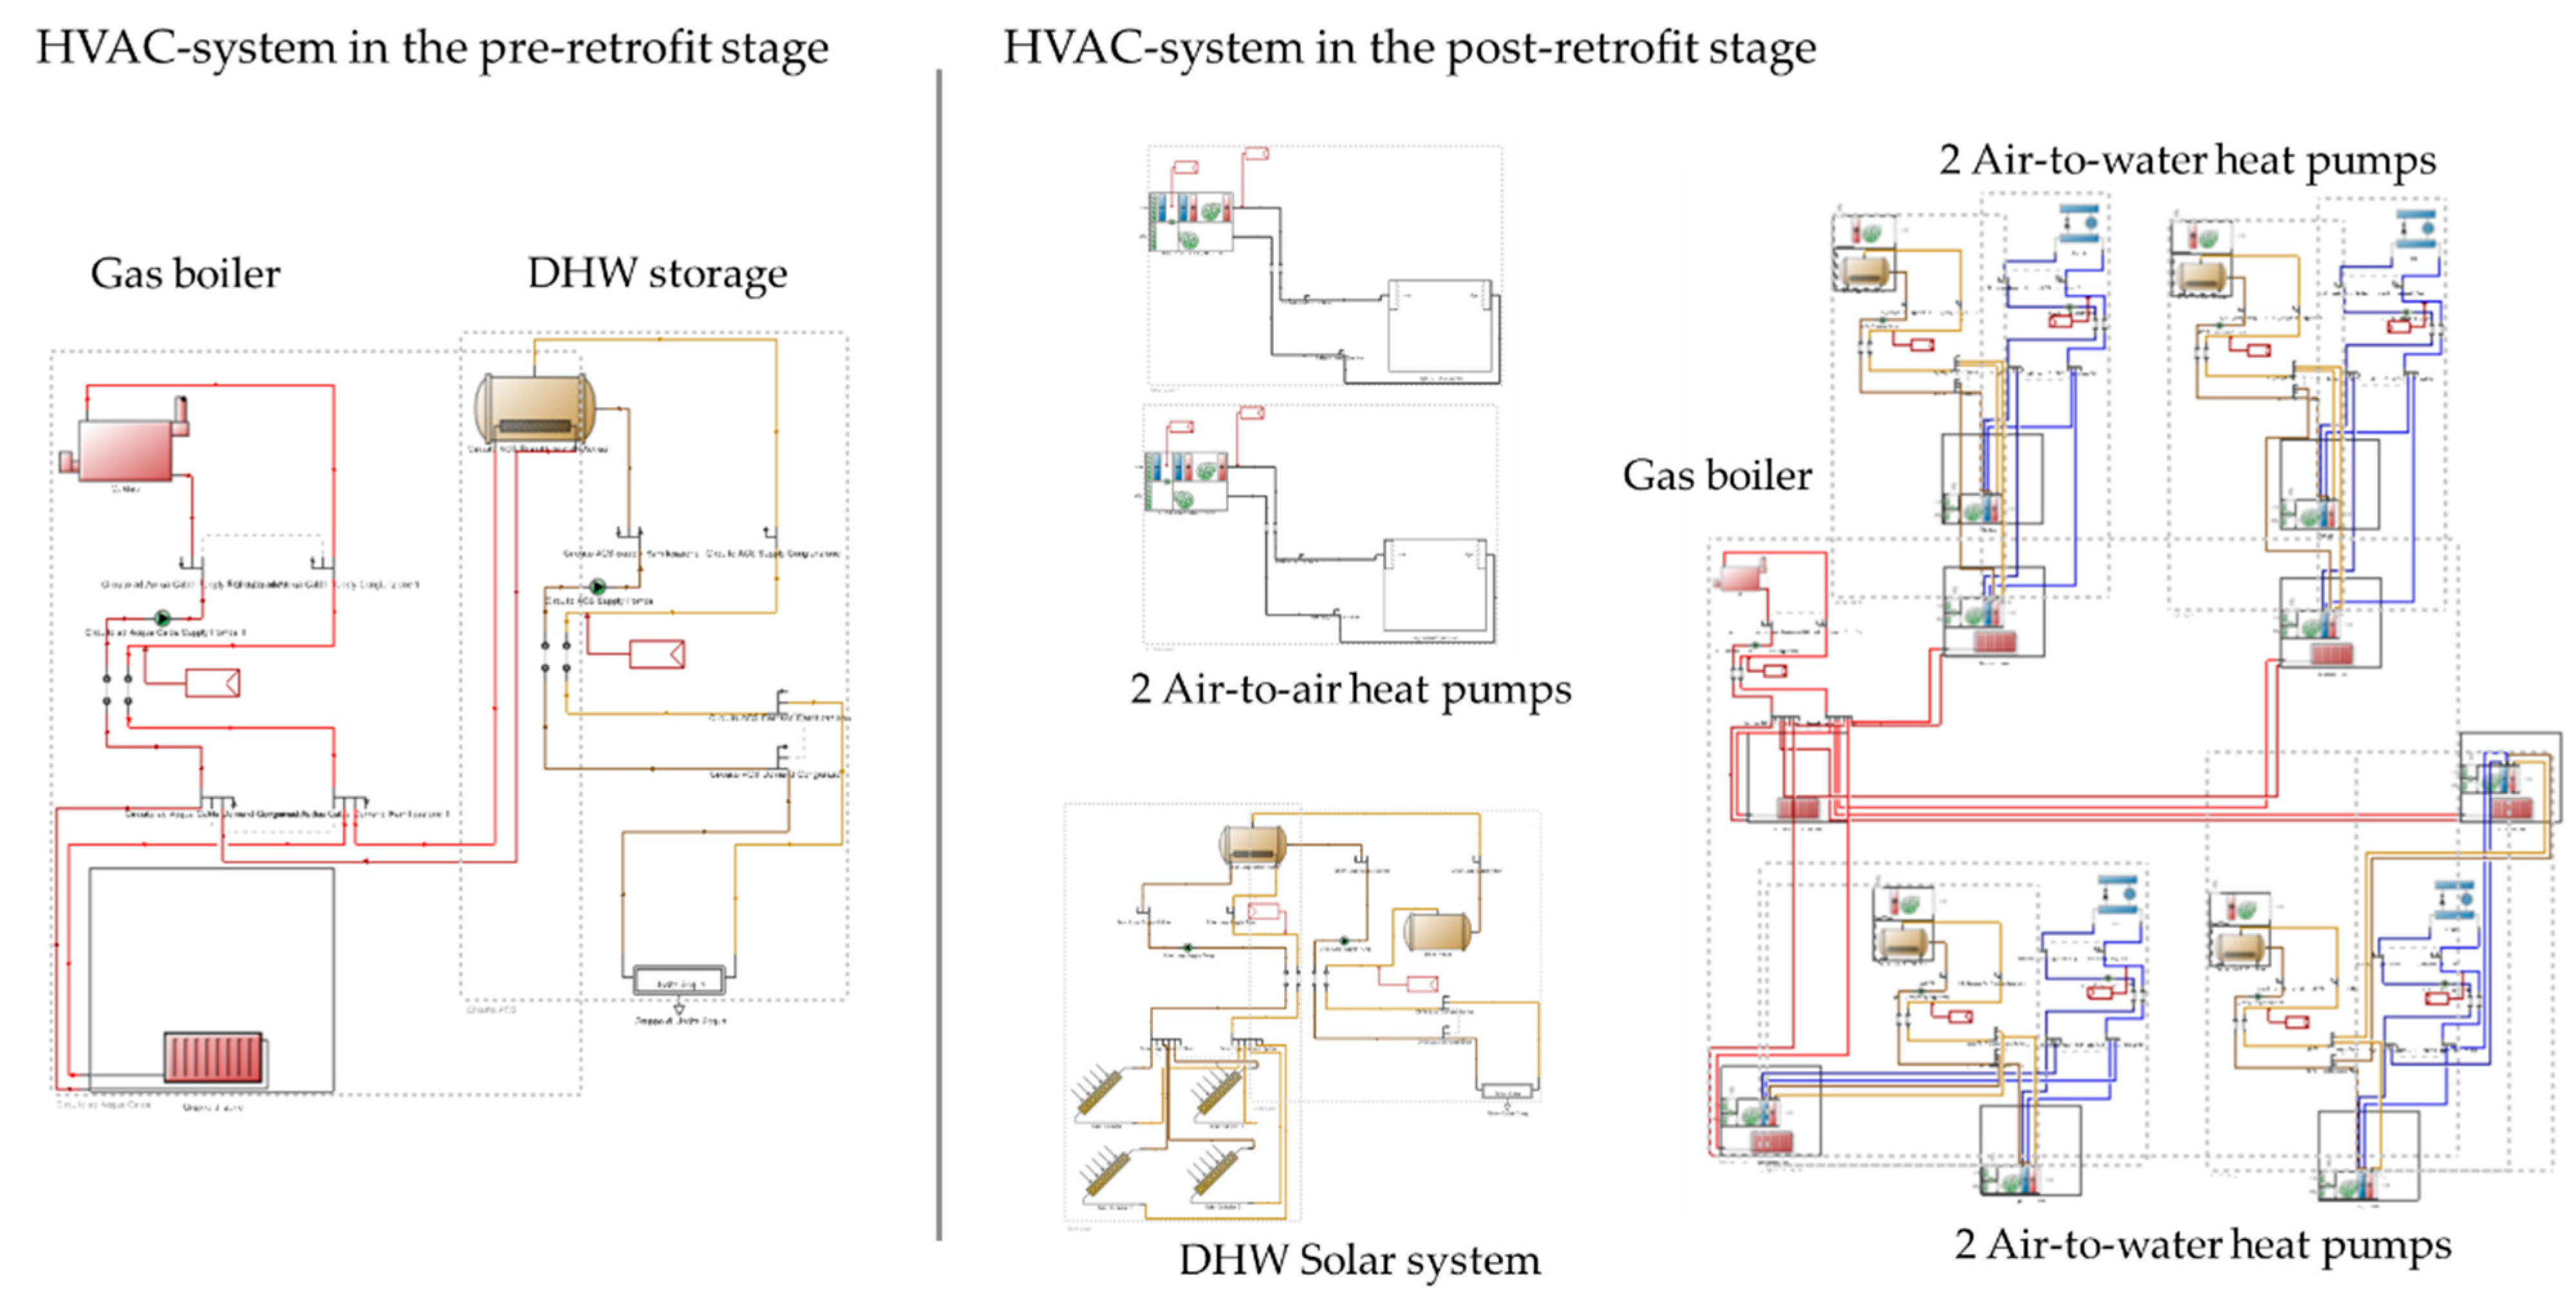
- the replacement of the heating, cooling, and Domestic Hot Water (DHW) systems;
- the addition of thermal insulation for the building envelope;
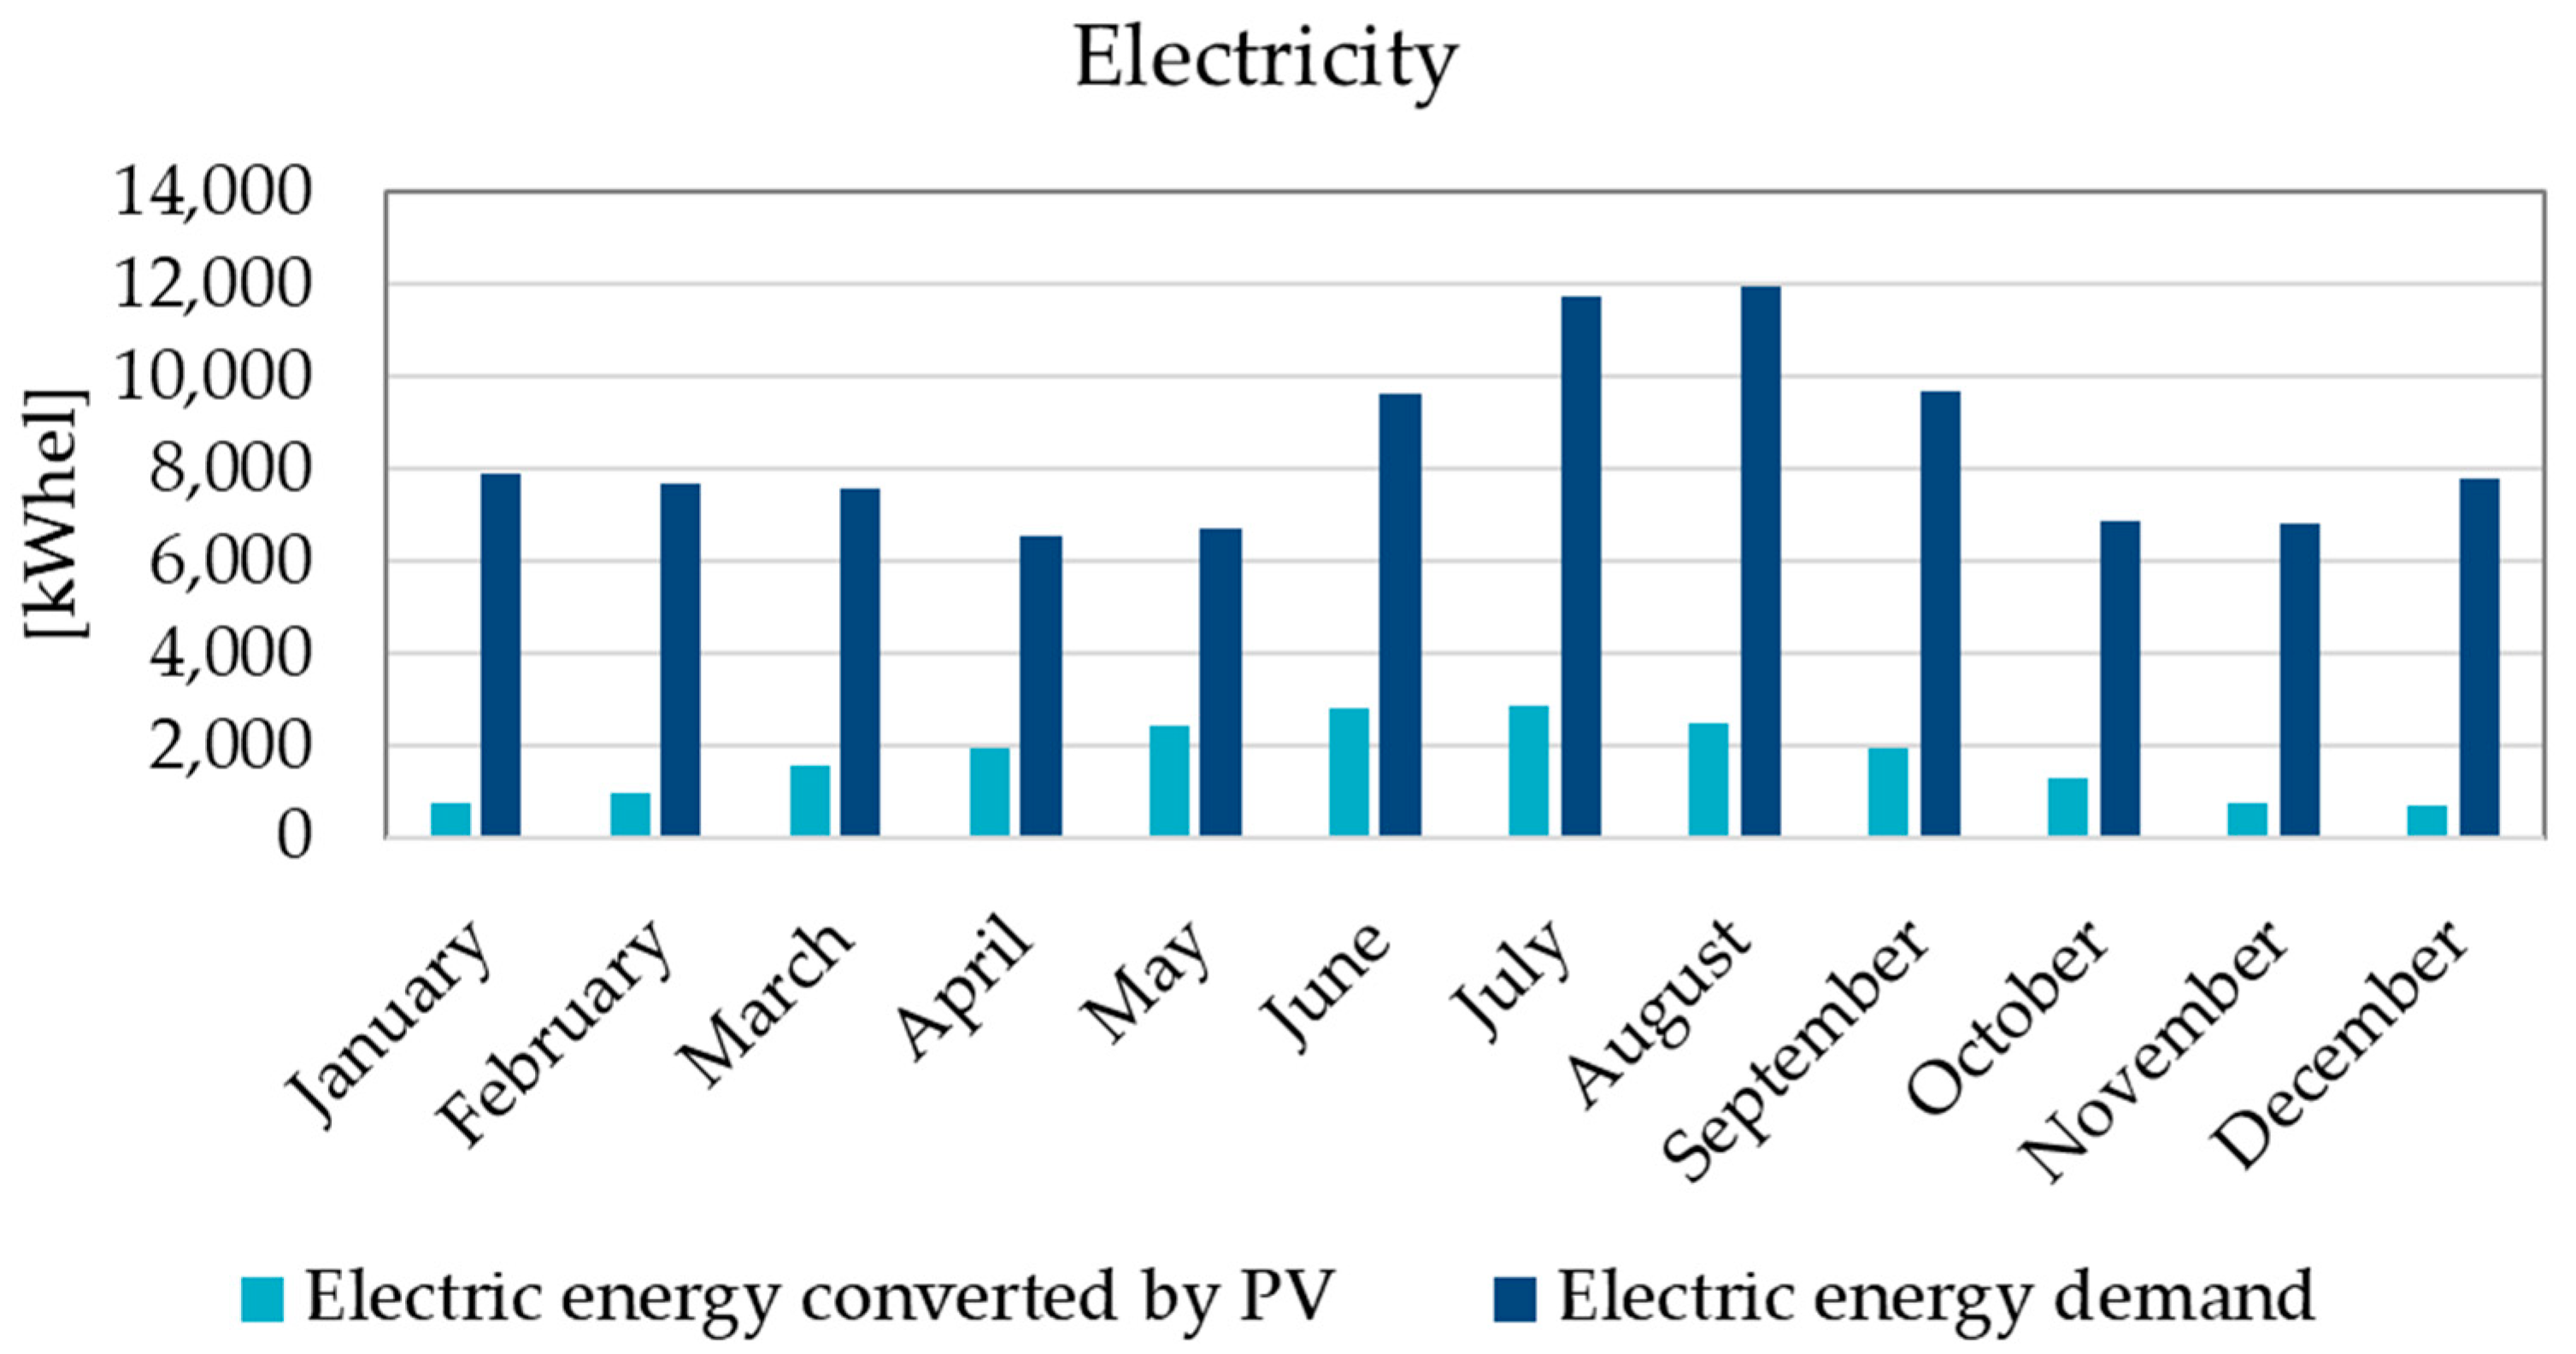
- the addition of two renewable energy systems;
- the replacement of the electrical equipment and lighting system.
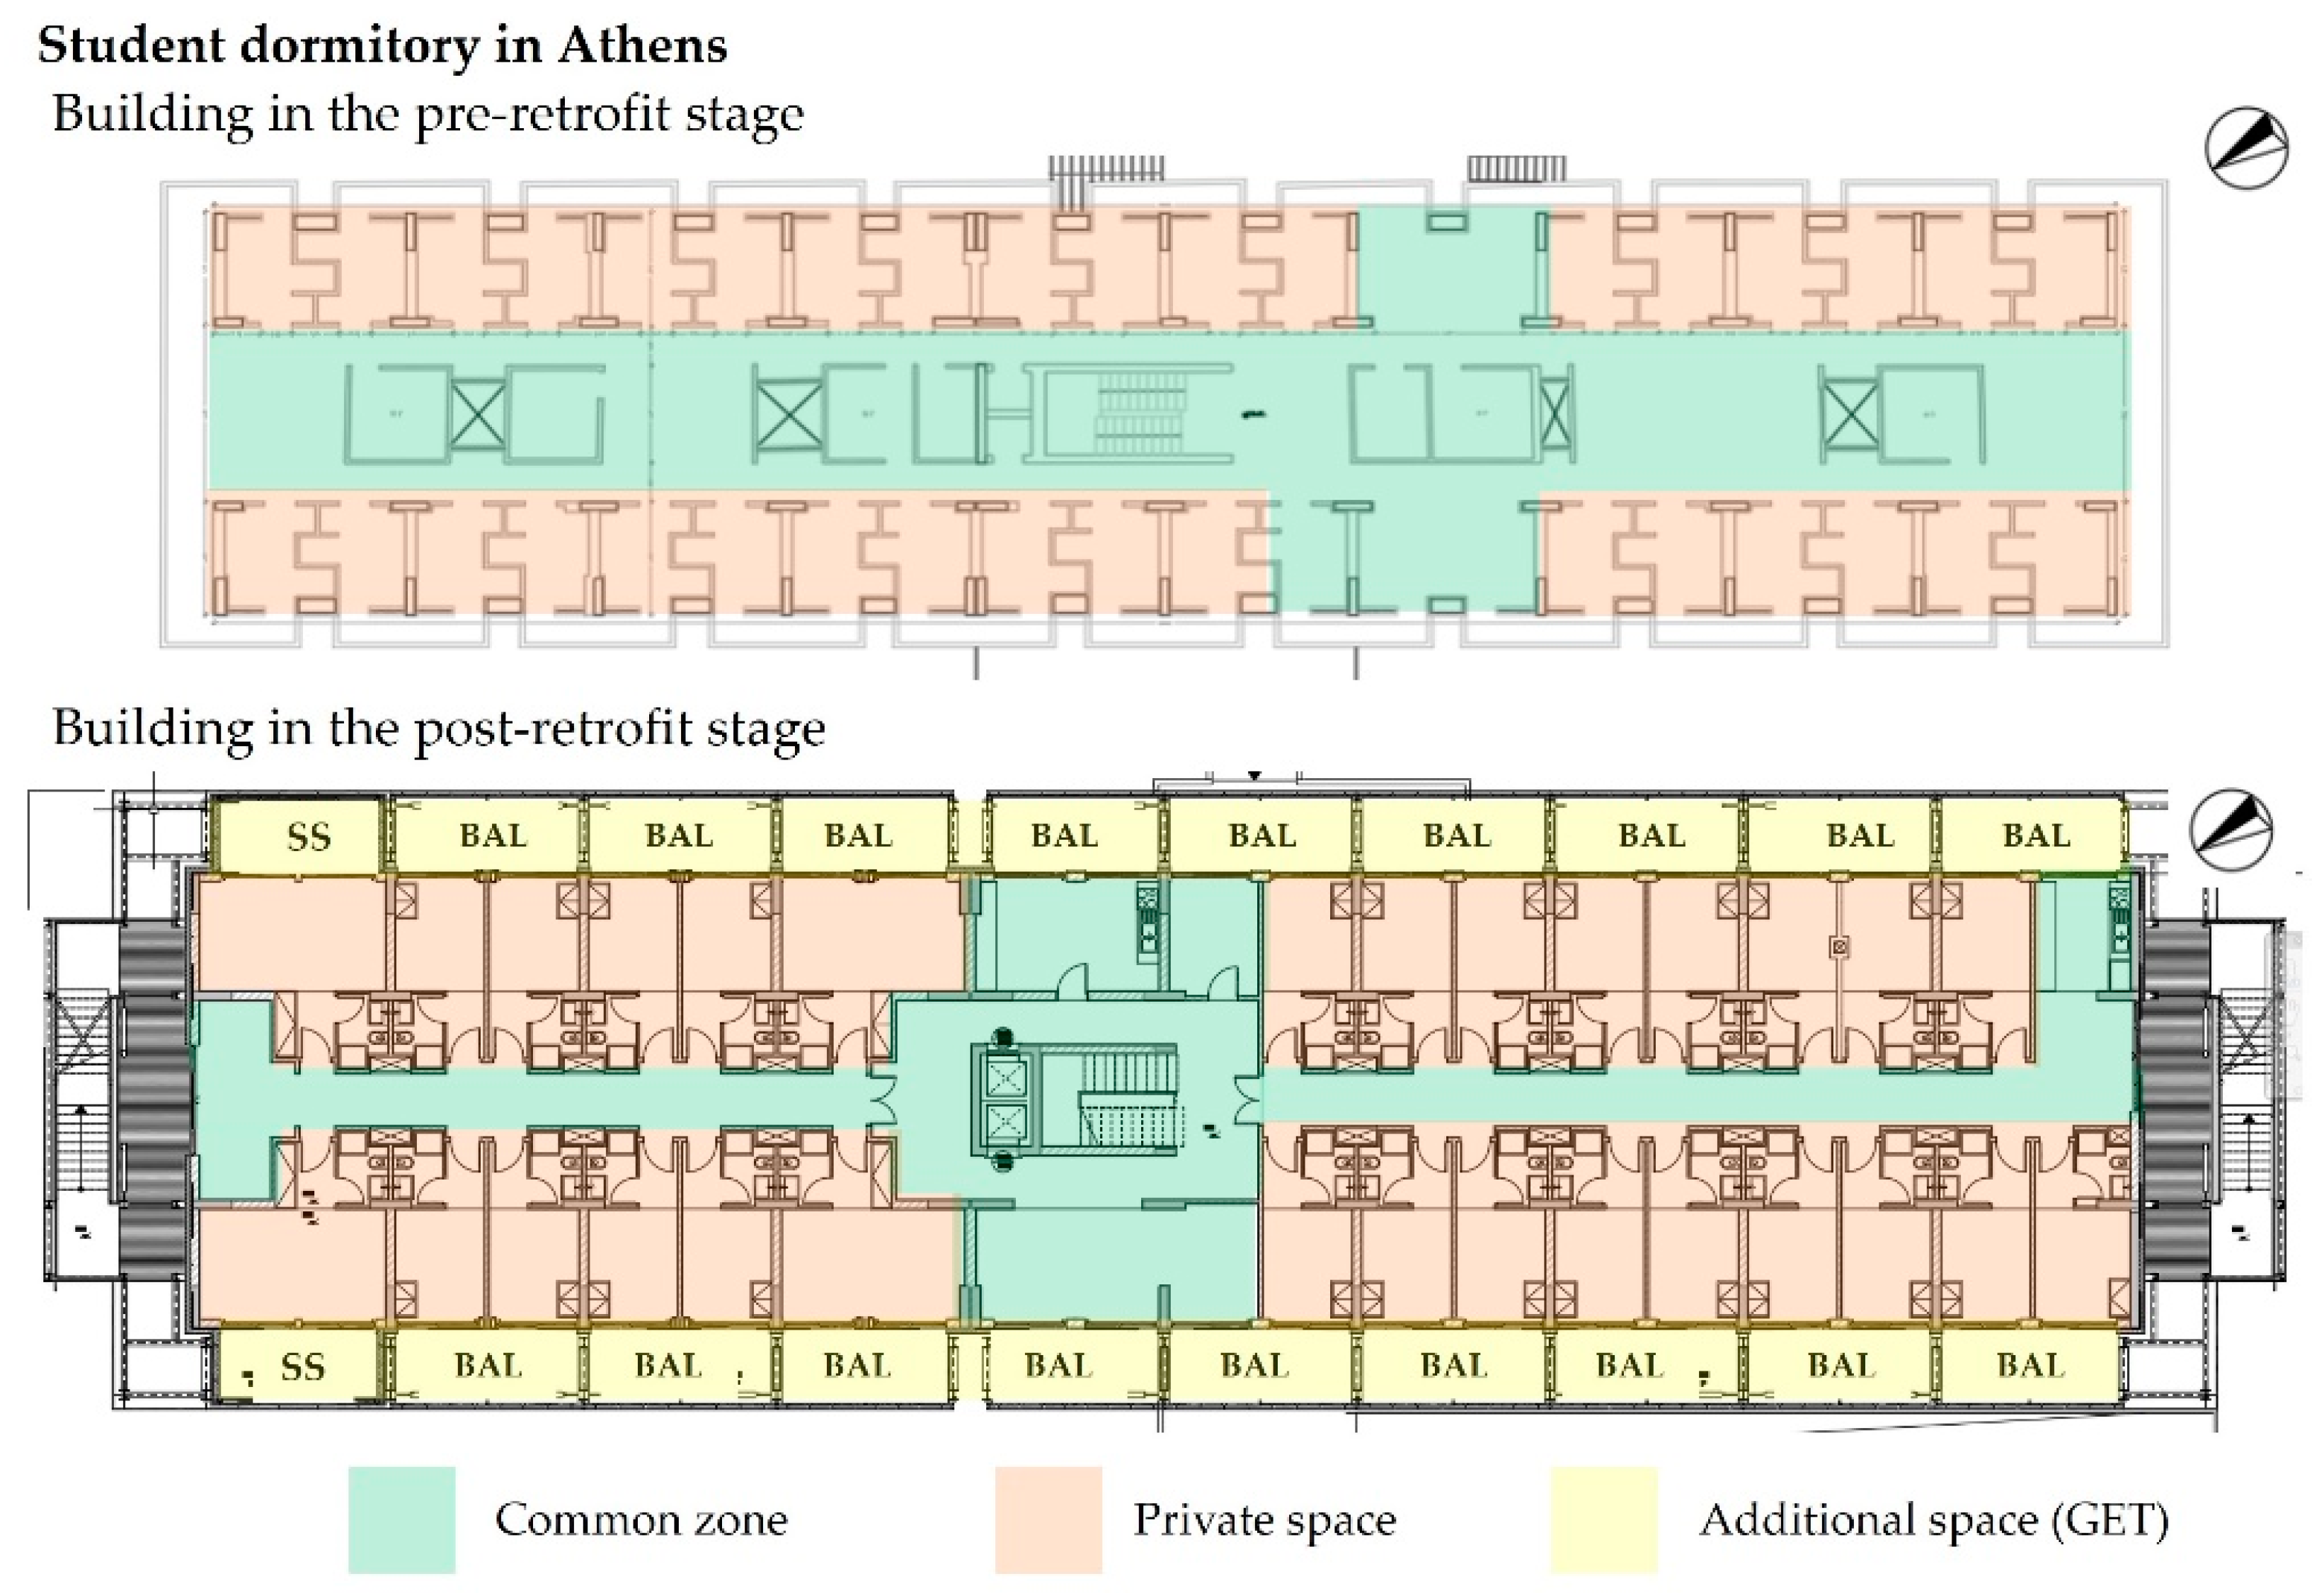
- Geometry and spaces reorganization.
- Compositions (i.e., materials, thicknesses, and layers) of the opaque and transparent building envelope elements.
- HVAC types and their operation.
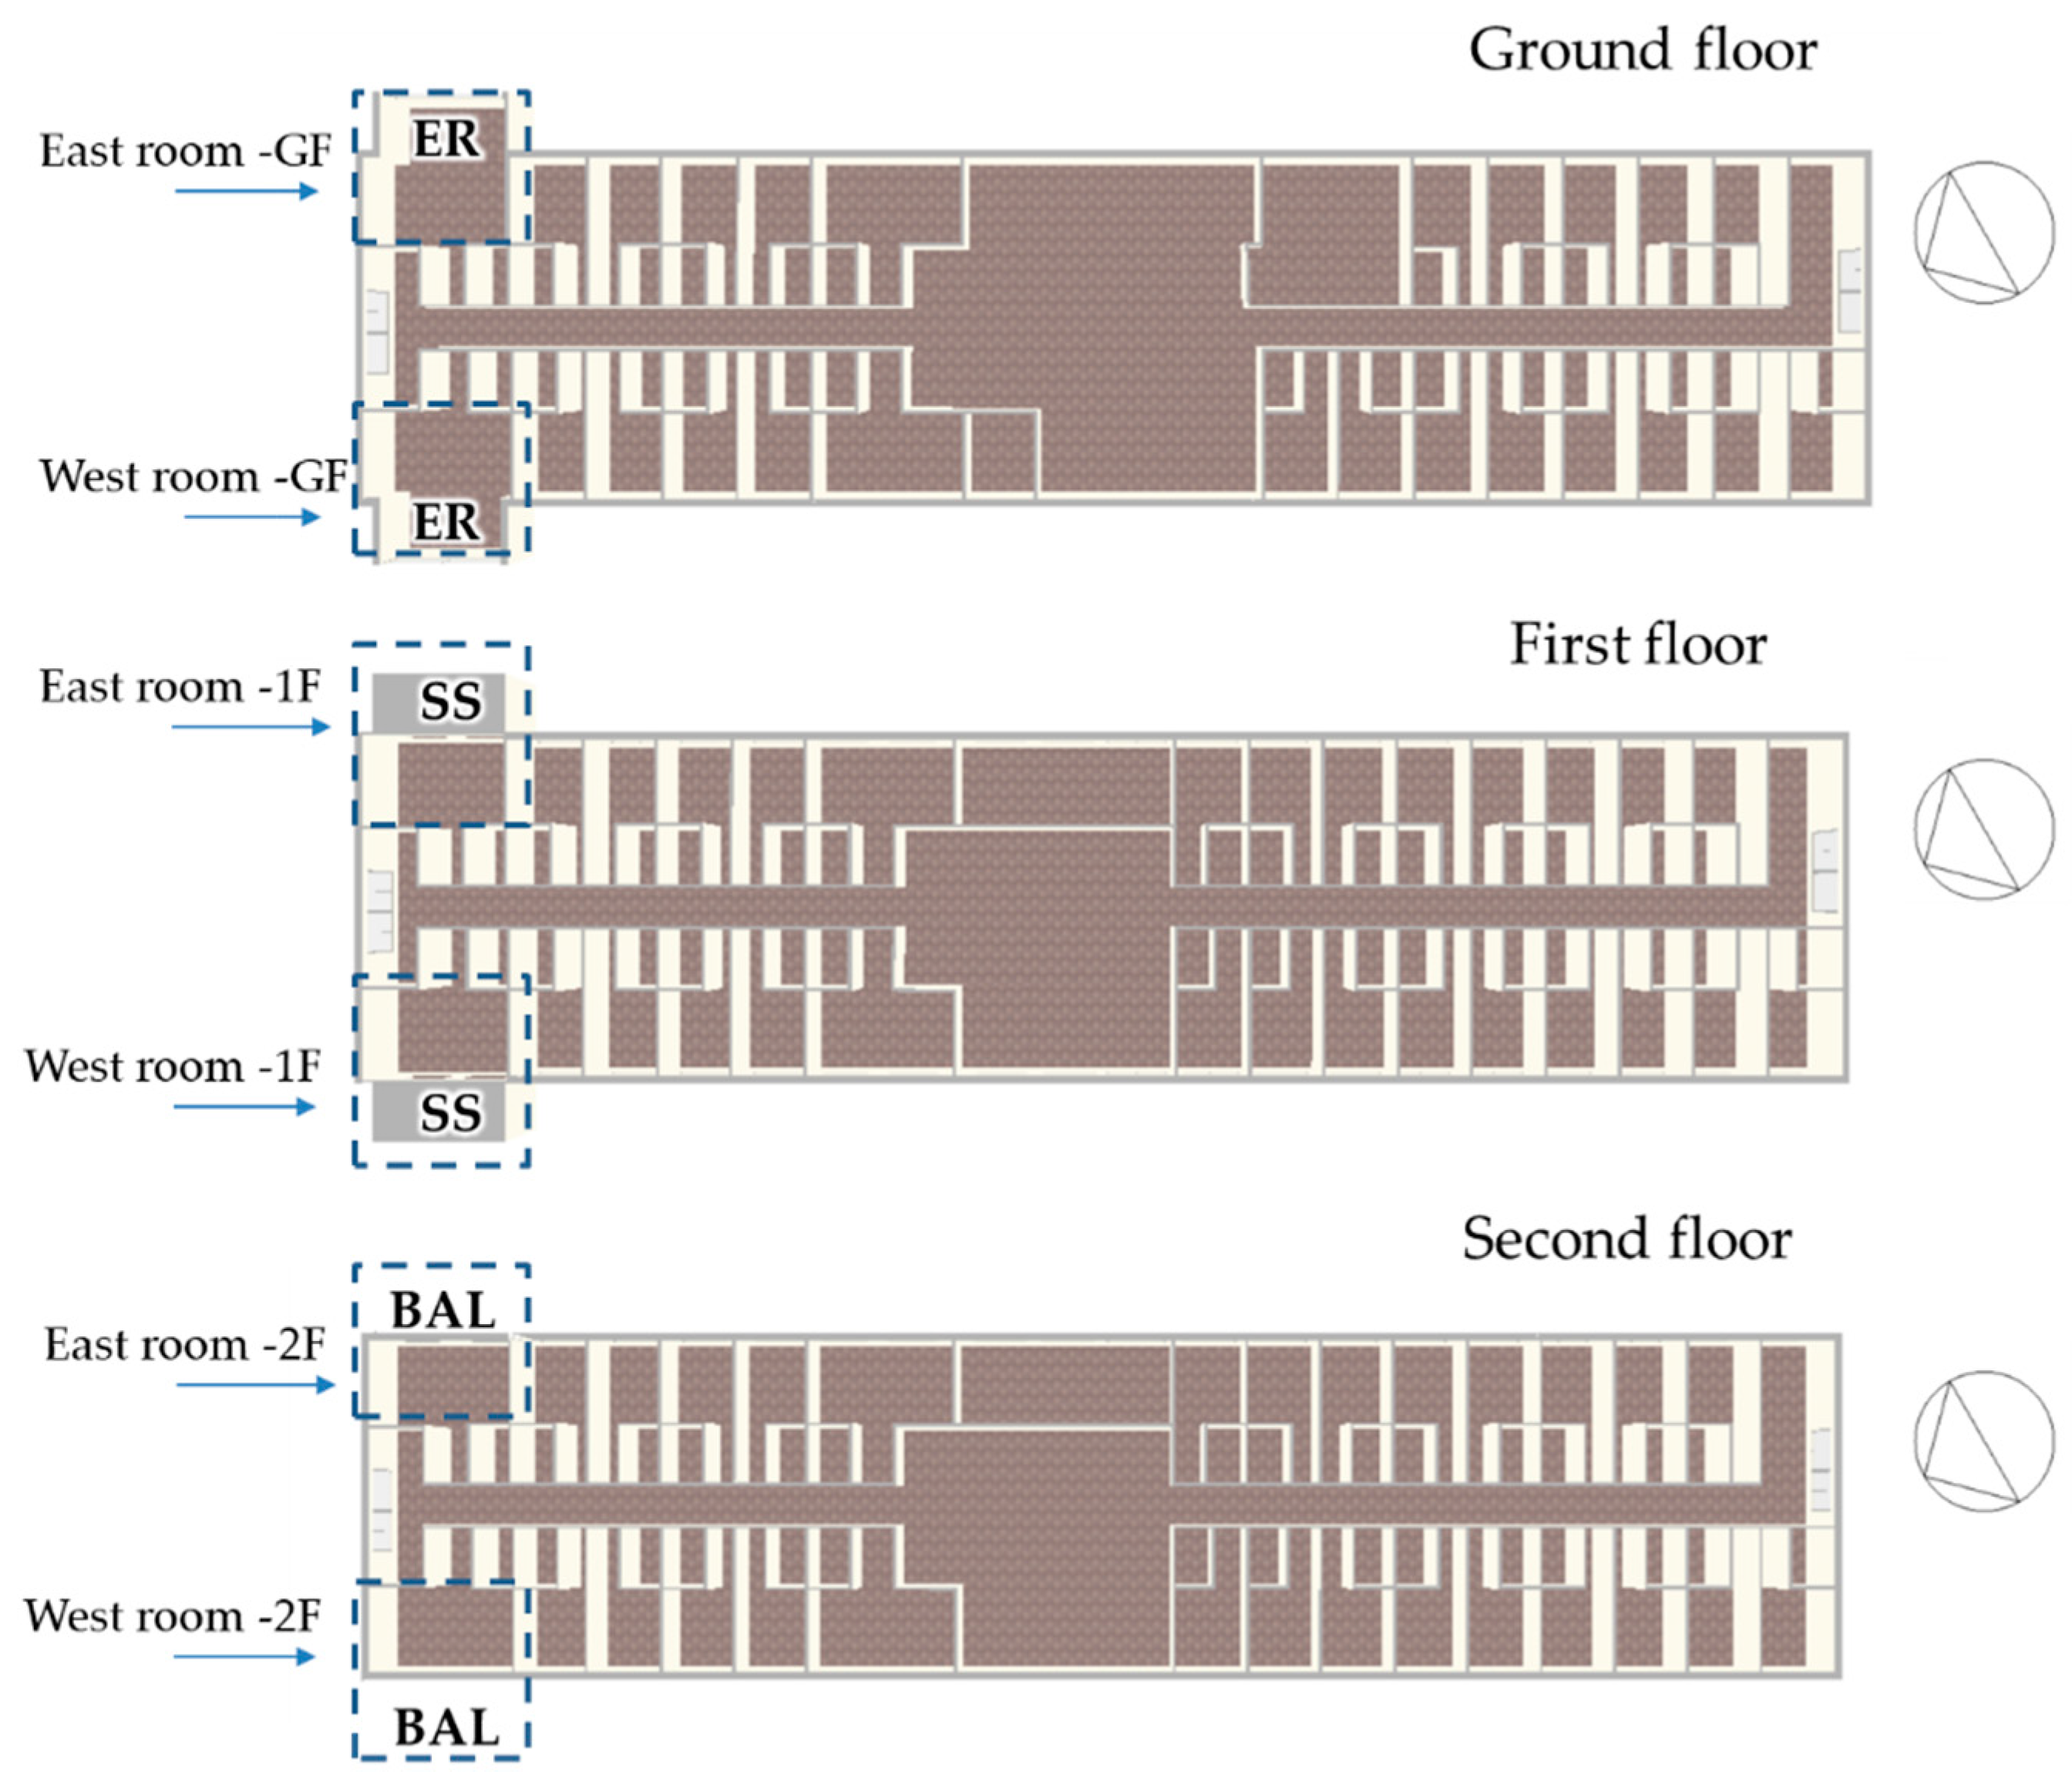
3.1. Modification of Space and Geometry
3.2. Thermo-Physical Properties of the New Building Envelope
- the external walls have a thermal transmittance (Uvalue) of 0.29 W/m2K (pre-retrofit Uvalue = 1.69 W/m2K) and consist, starting from the outside, of 1 cm of inner plaster, 10 cm of thermal insulation (thermal conductivity 0.034 W/mK), 18 cm of brick and 1 cm of exterior plaster.
- The underground walls are made of 6 cm of polystyrene thermal insulation, 23 cm of reinforced concrete and 2.5 cm of plaster, with a total thermal transmittance equal to 0.48 W/m2K (pre-retrofit Uvalue = 1.69 W/m2K).
- The ground floor (Uvalue = 0.29 W/m2K), starting from the inside, has the following layers: 2 cm of ceramic tiles, 6 cm of concrete, 10 cm of polystyrene thermal insulation, 20 cm of reinforced concrete (pre-retrofit Uvalue = 2.07 W/m2K).
- The flat roof has a thermal transmittance of 0.28 W/m2K (pre-retrofit Uvalue = 1.06 W/m2K).and is composed of 1 cm of ceramic tiles, and 15 cm of concrete, 10 cm of polystyrene thermal insulation, 15 cm of reinforced concrete and 2 cm of internal plaster.
3.3. HVAC System and Operation
- autonomous systems serve the two double rooms with ER placed on the ground floor and the two double rooms with SS on the first floor;
- a centralized system that serves the other rooms and the common areas.
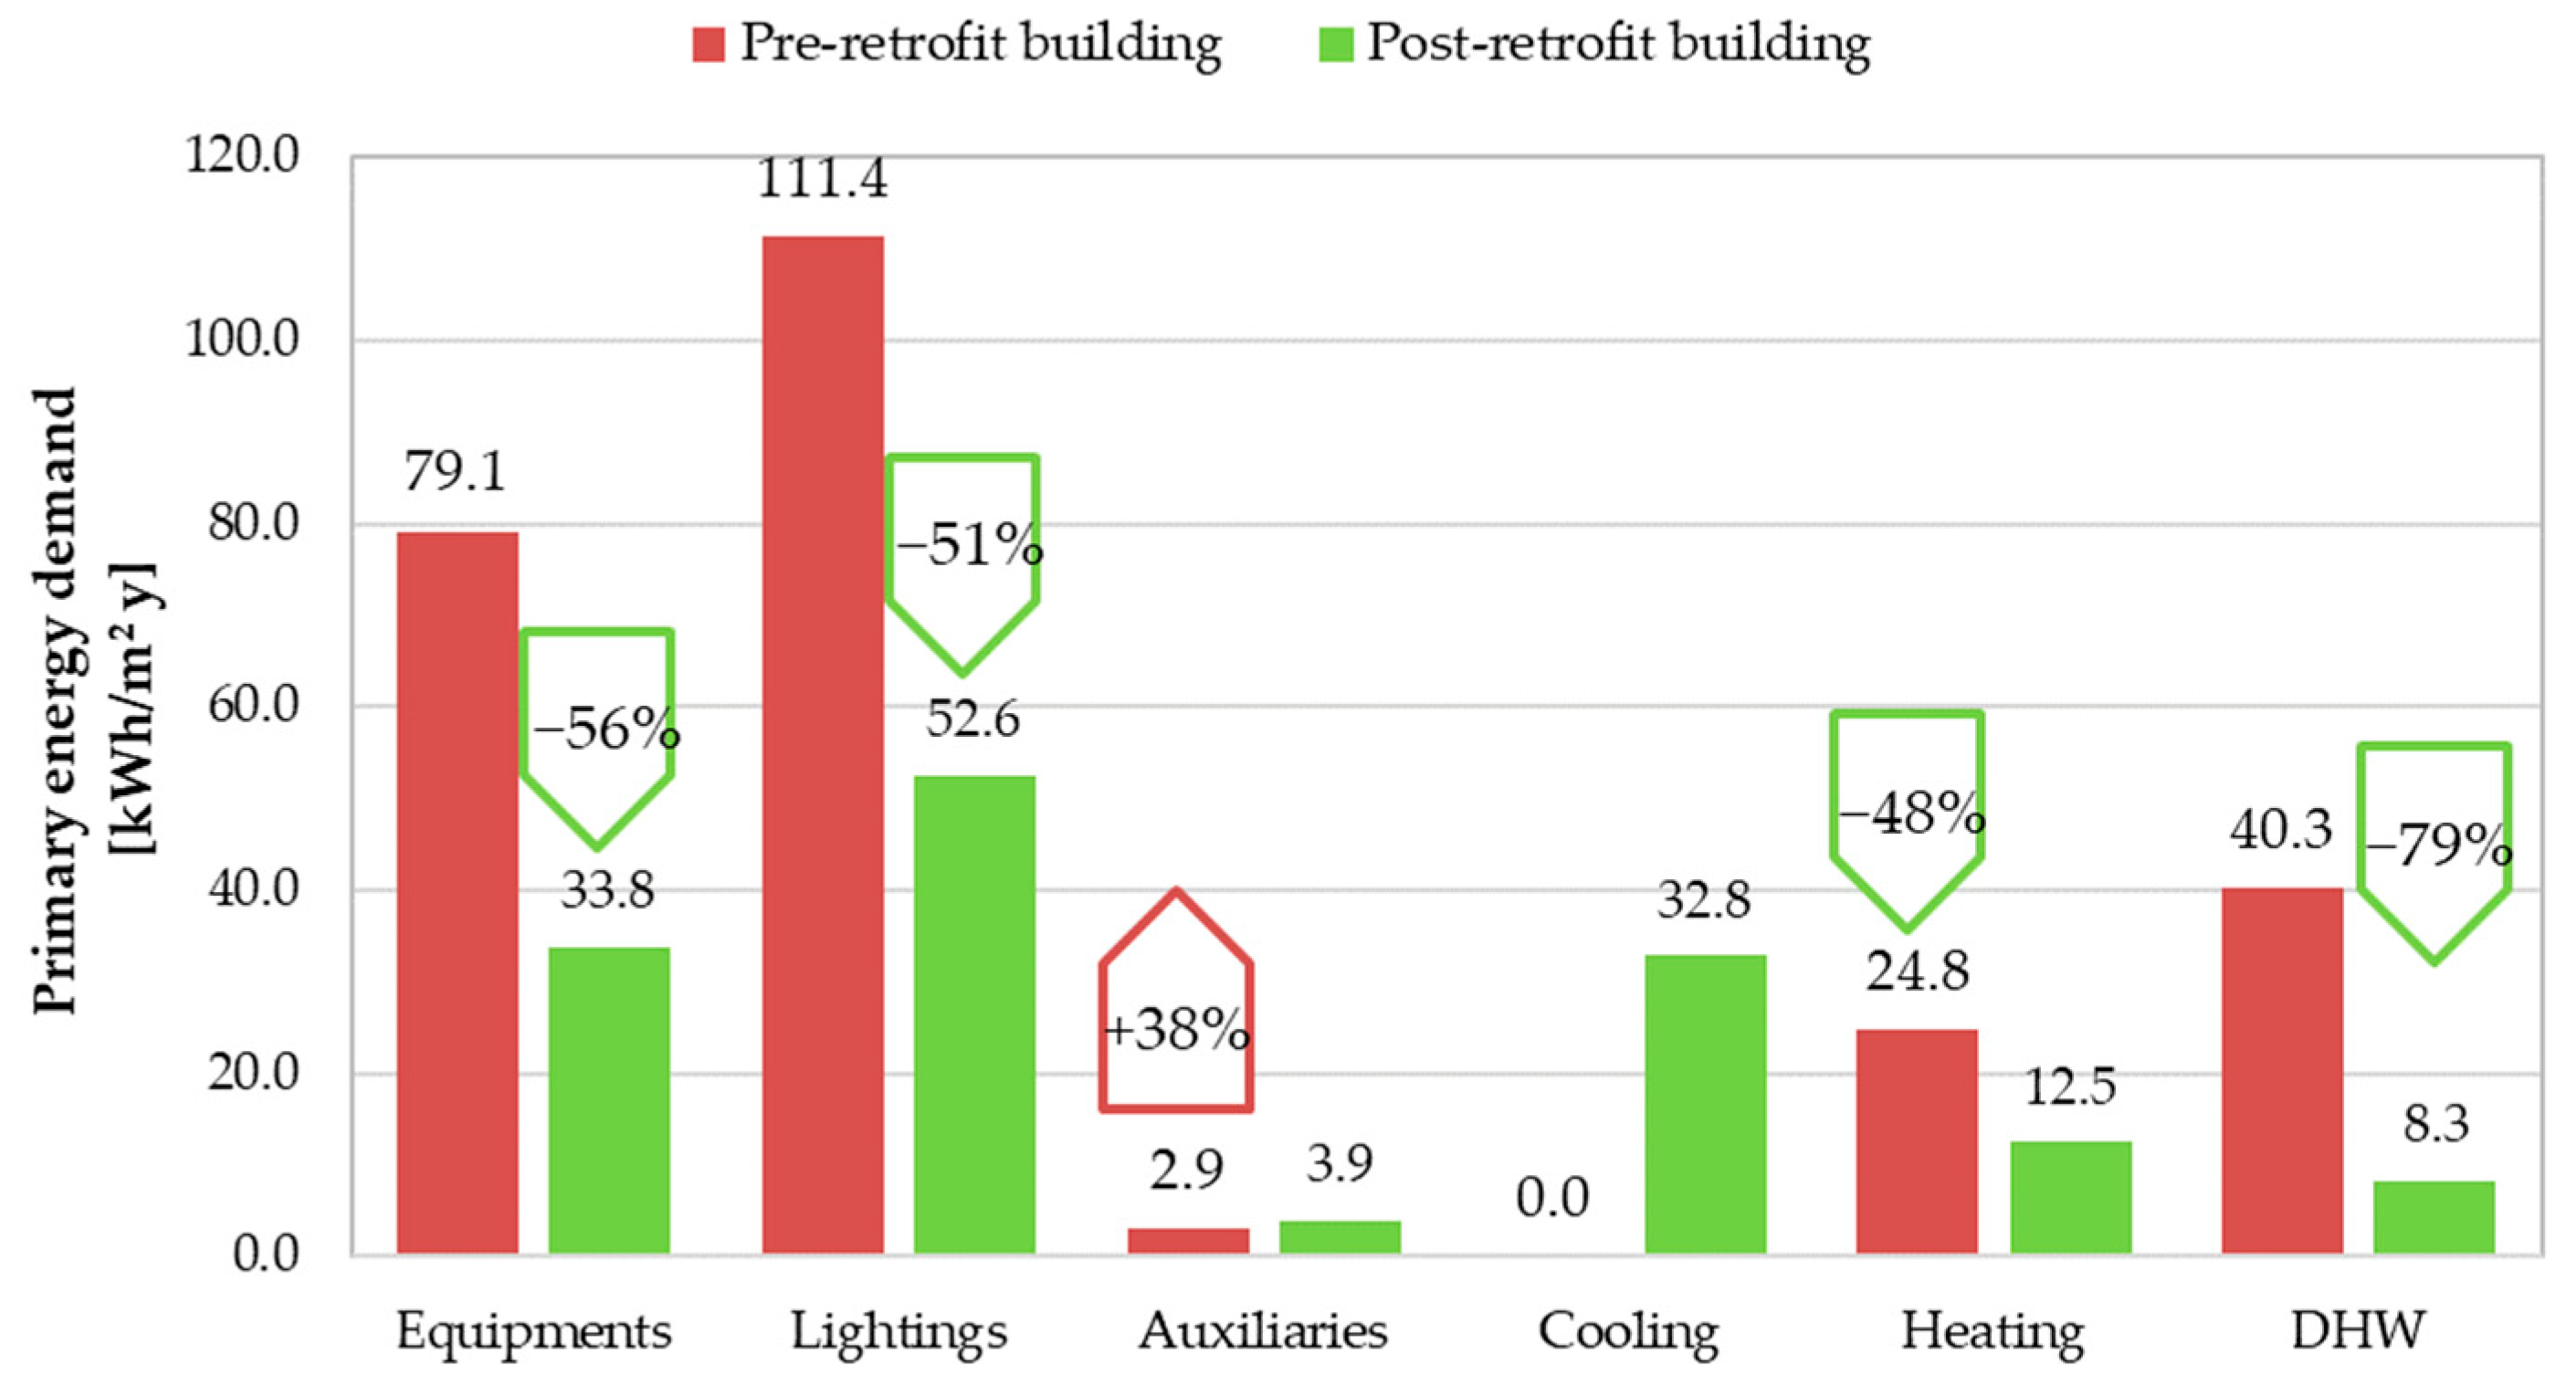
4. Results
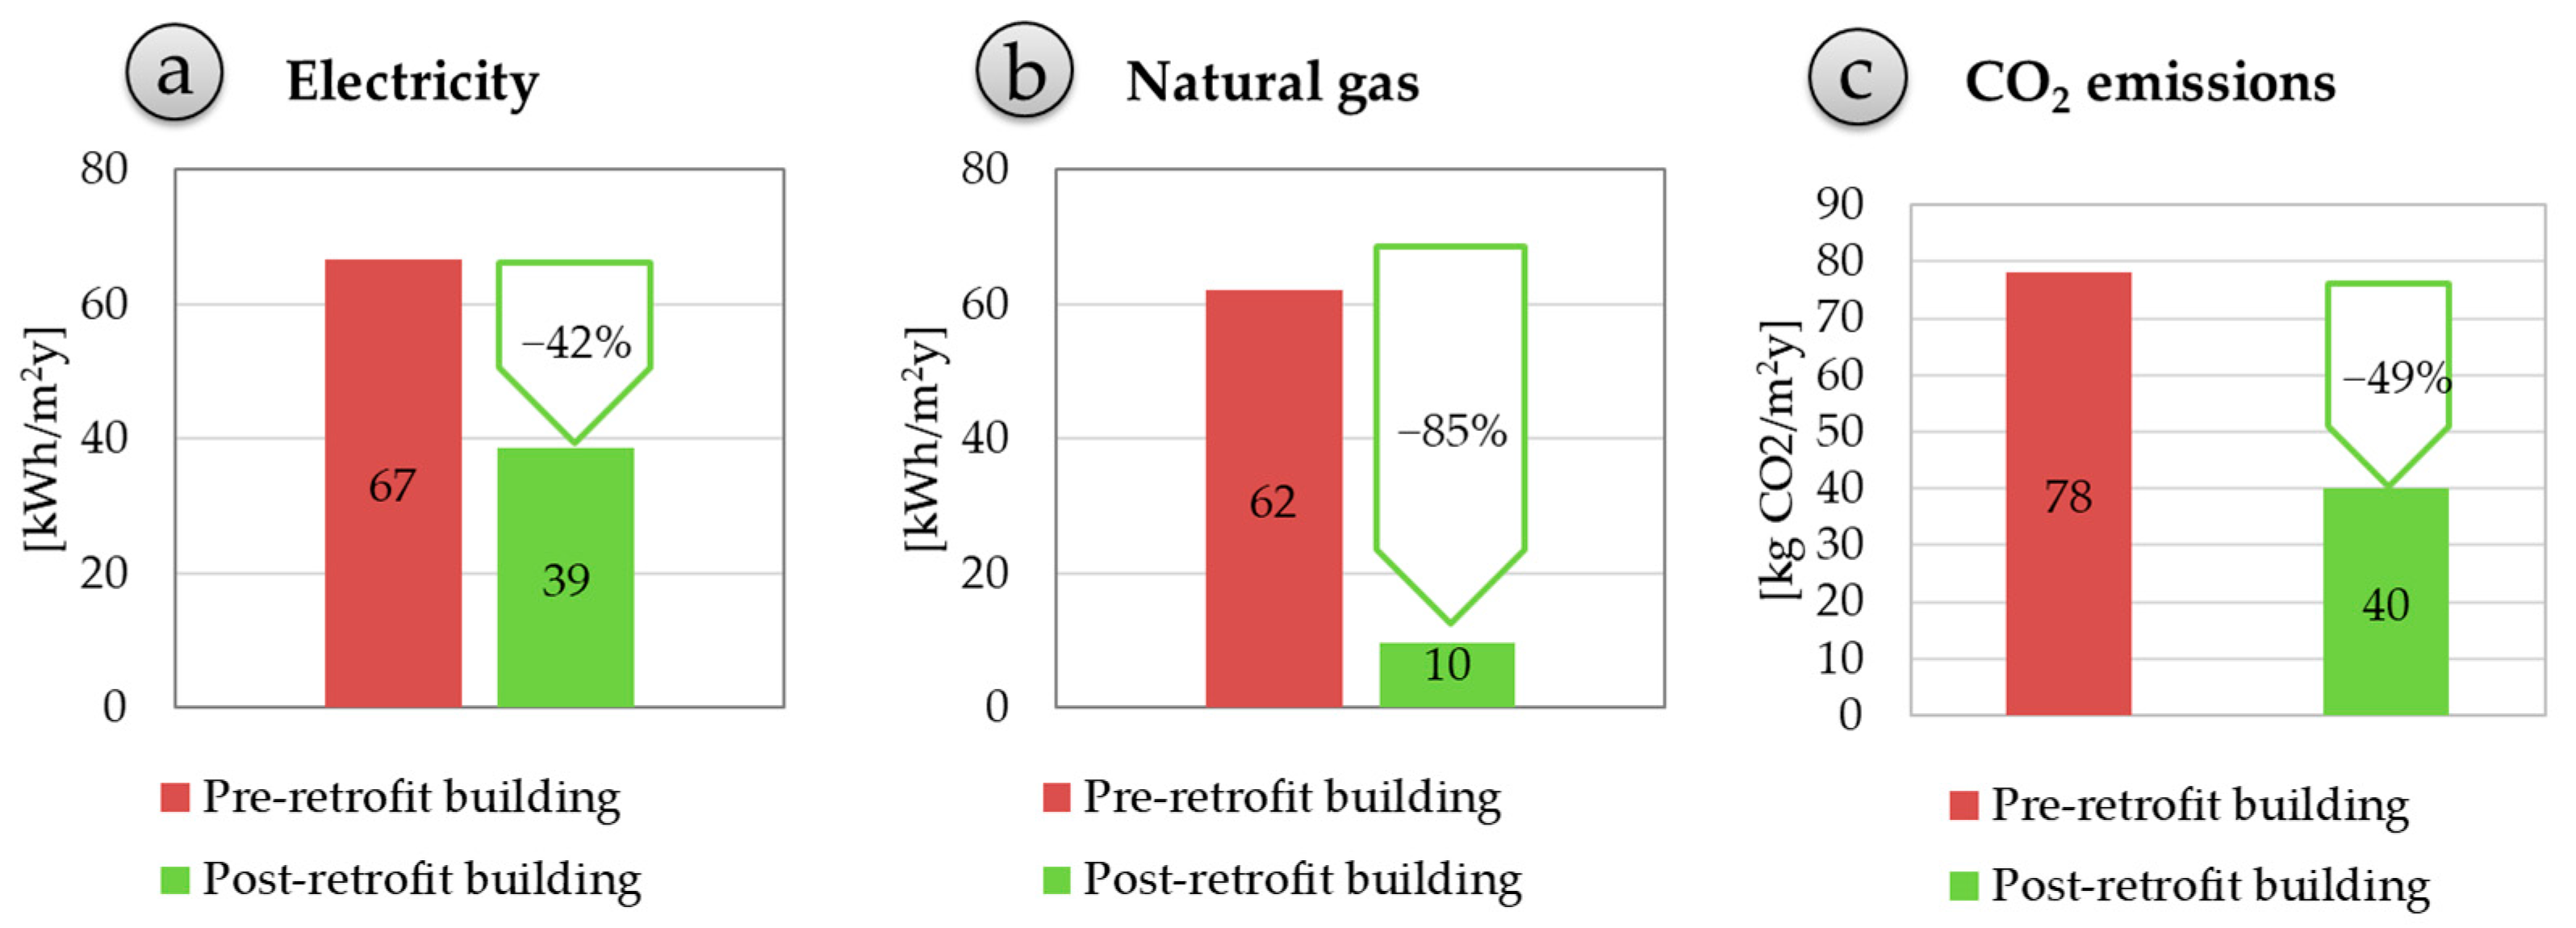
4.1. Energy and Environmental Analysis
- at least A class, for new buildings and,
- at least B+, for an existing building after partial/deep renovation.
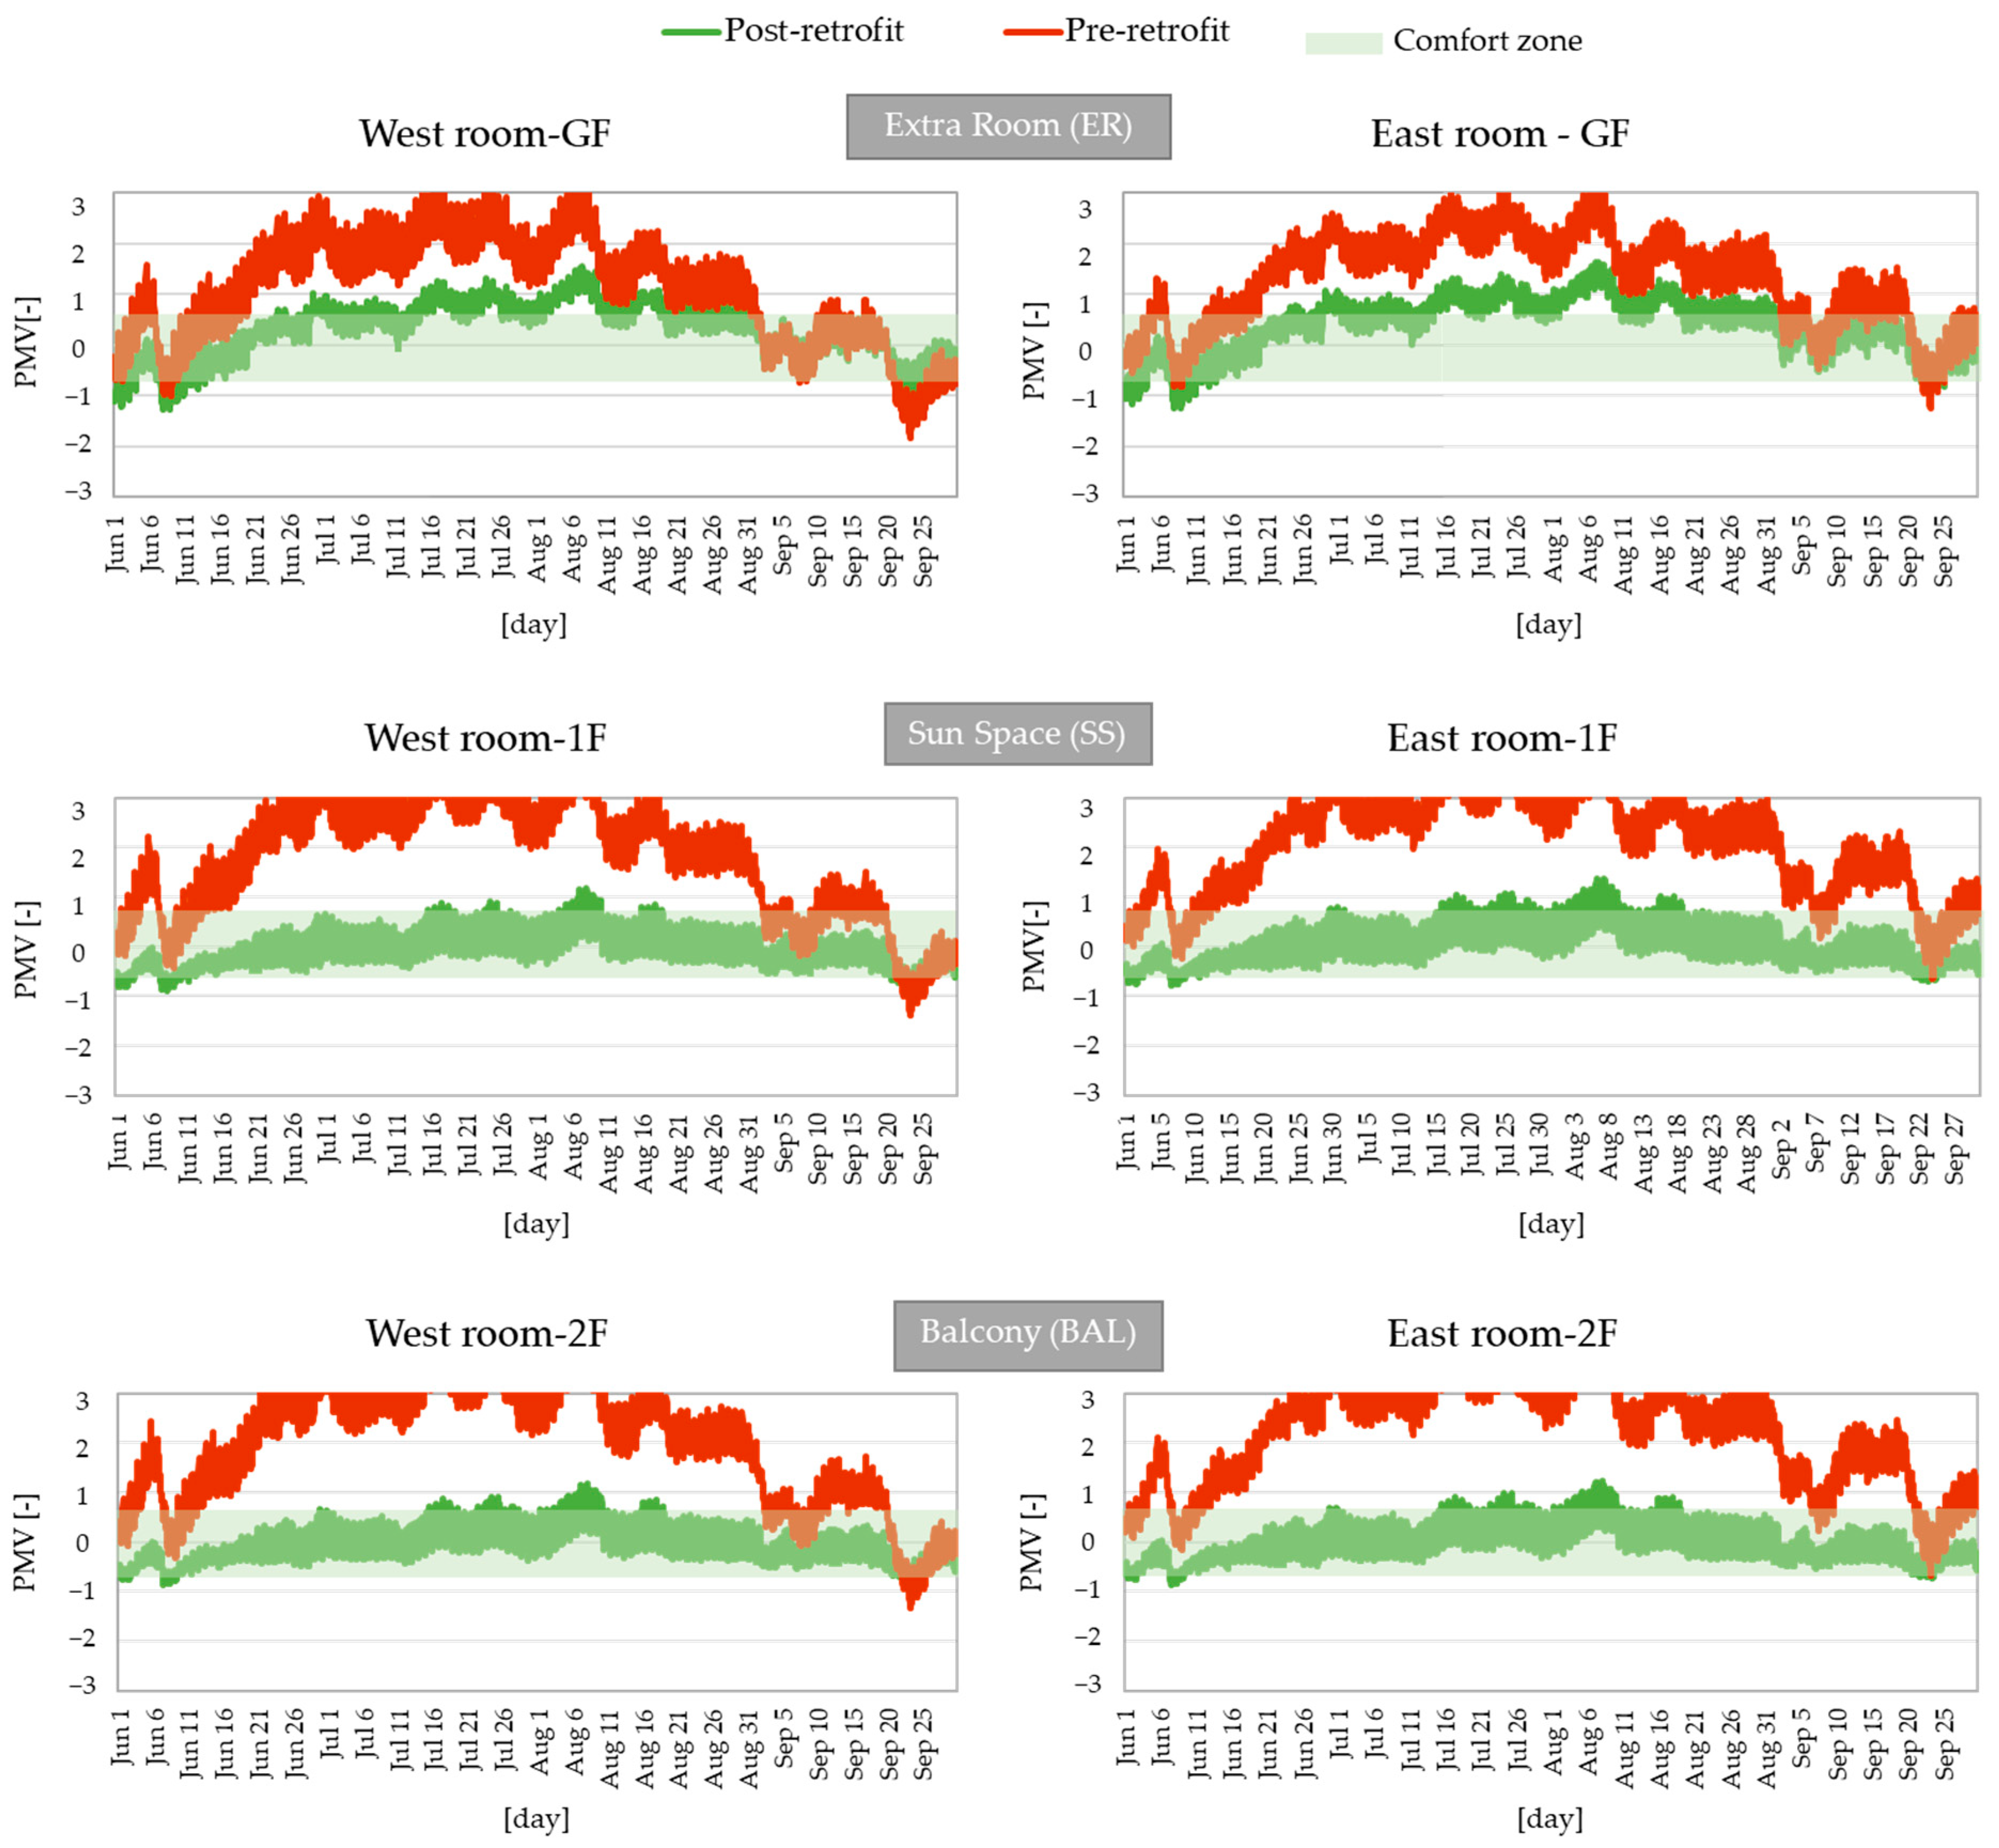
4.2. IEQ Evaluation
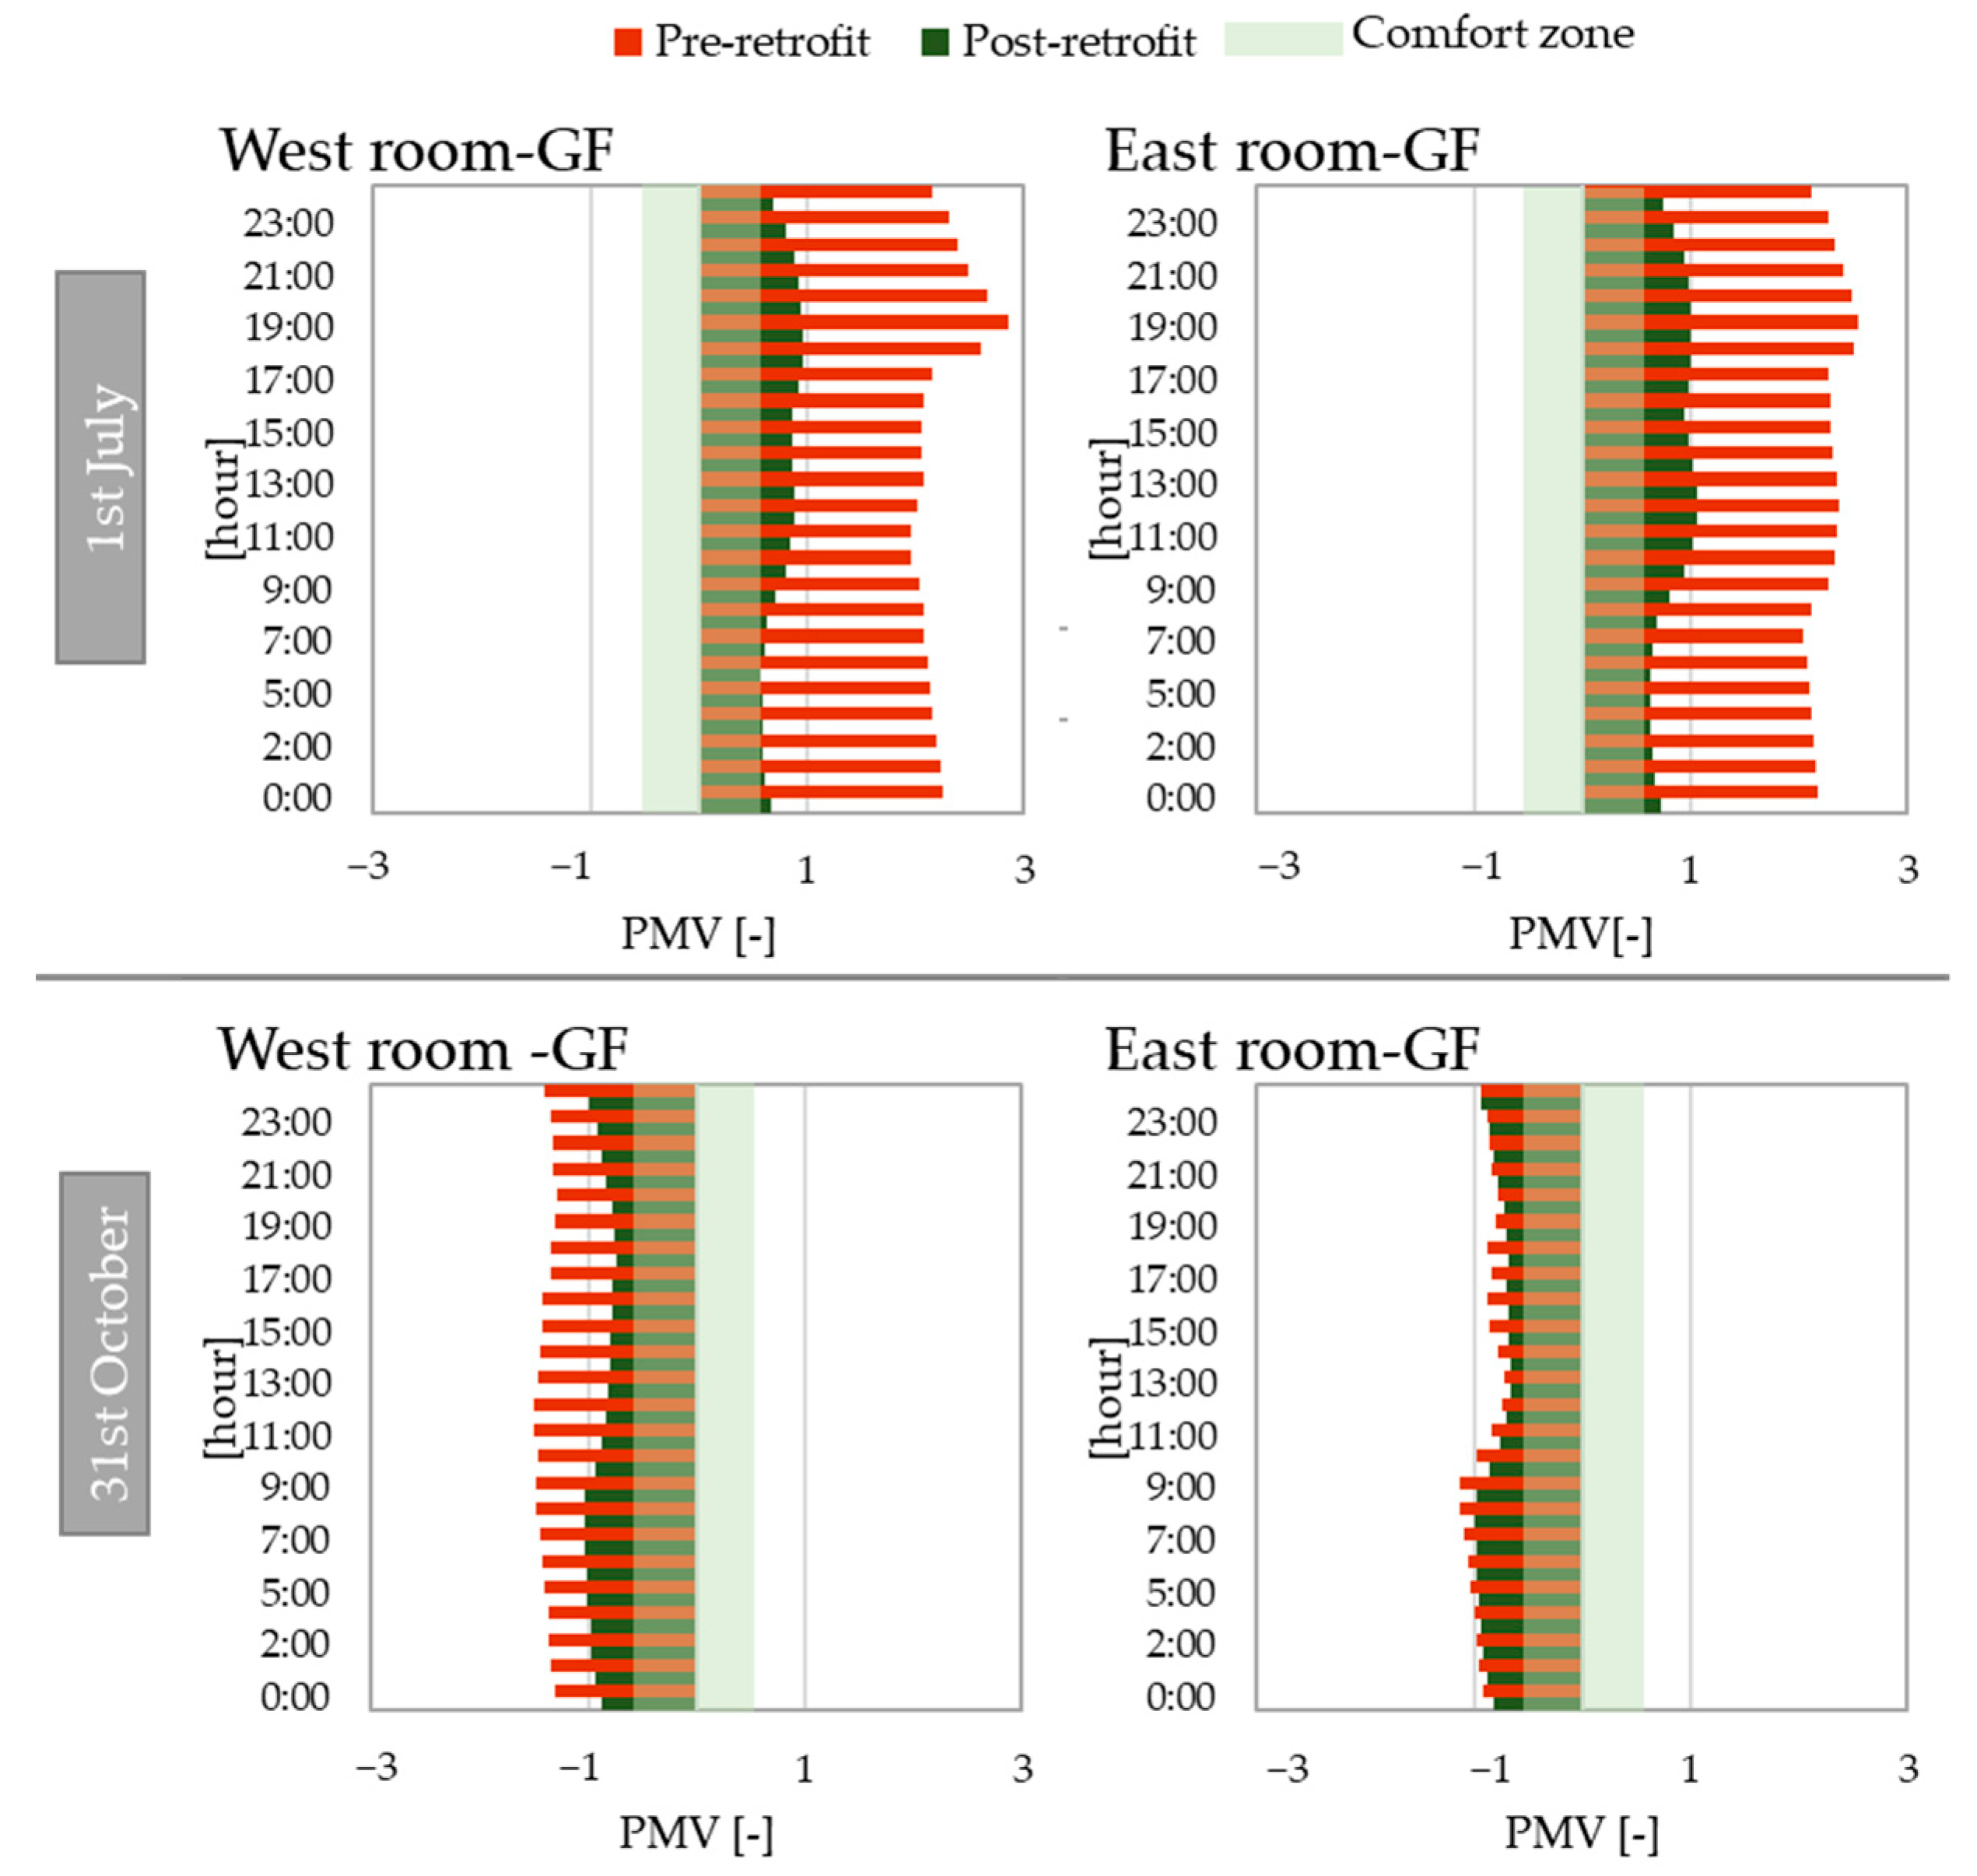
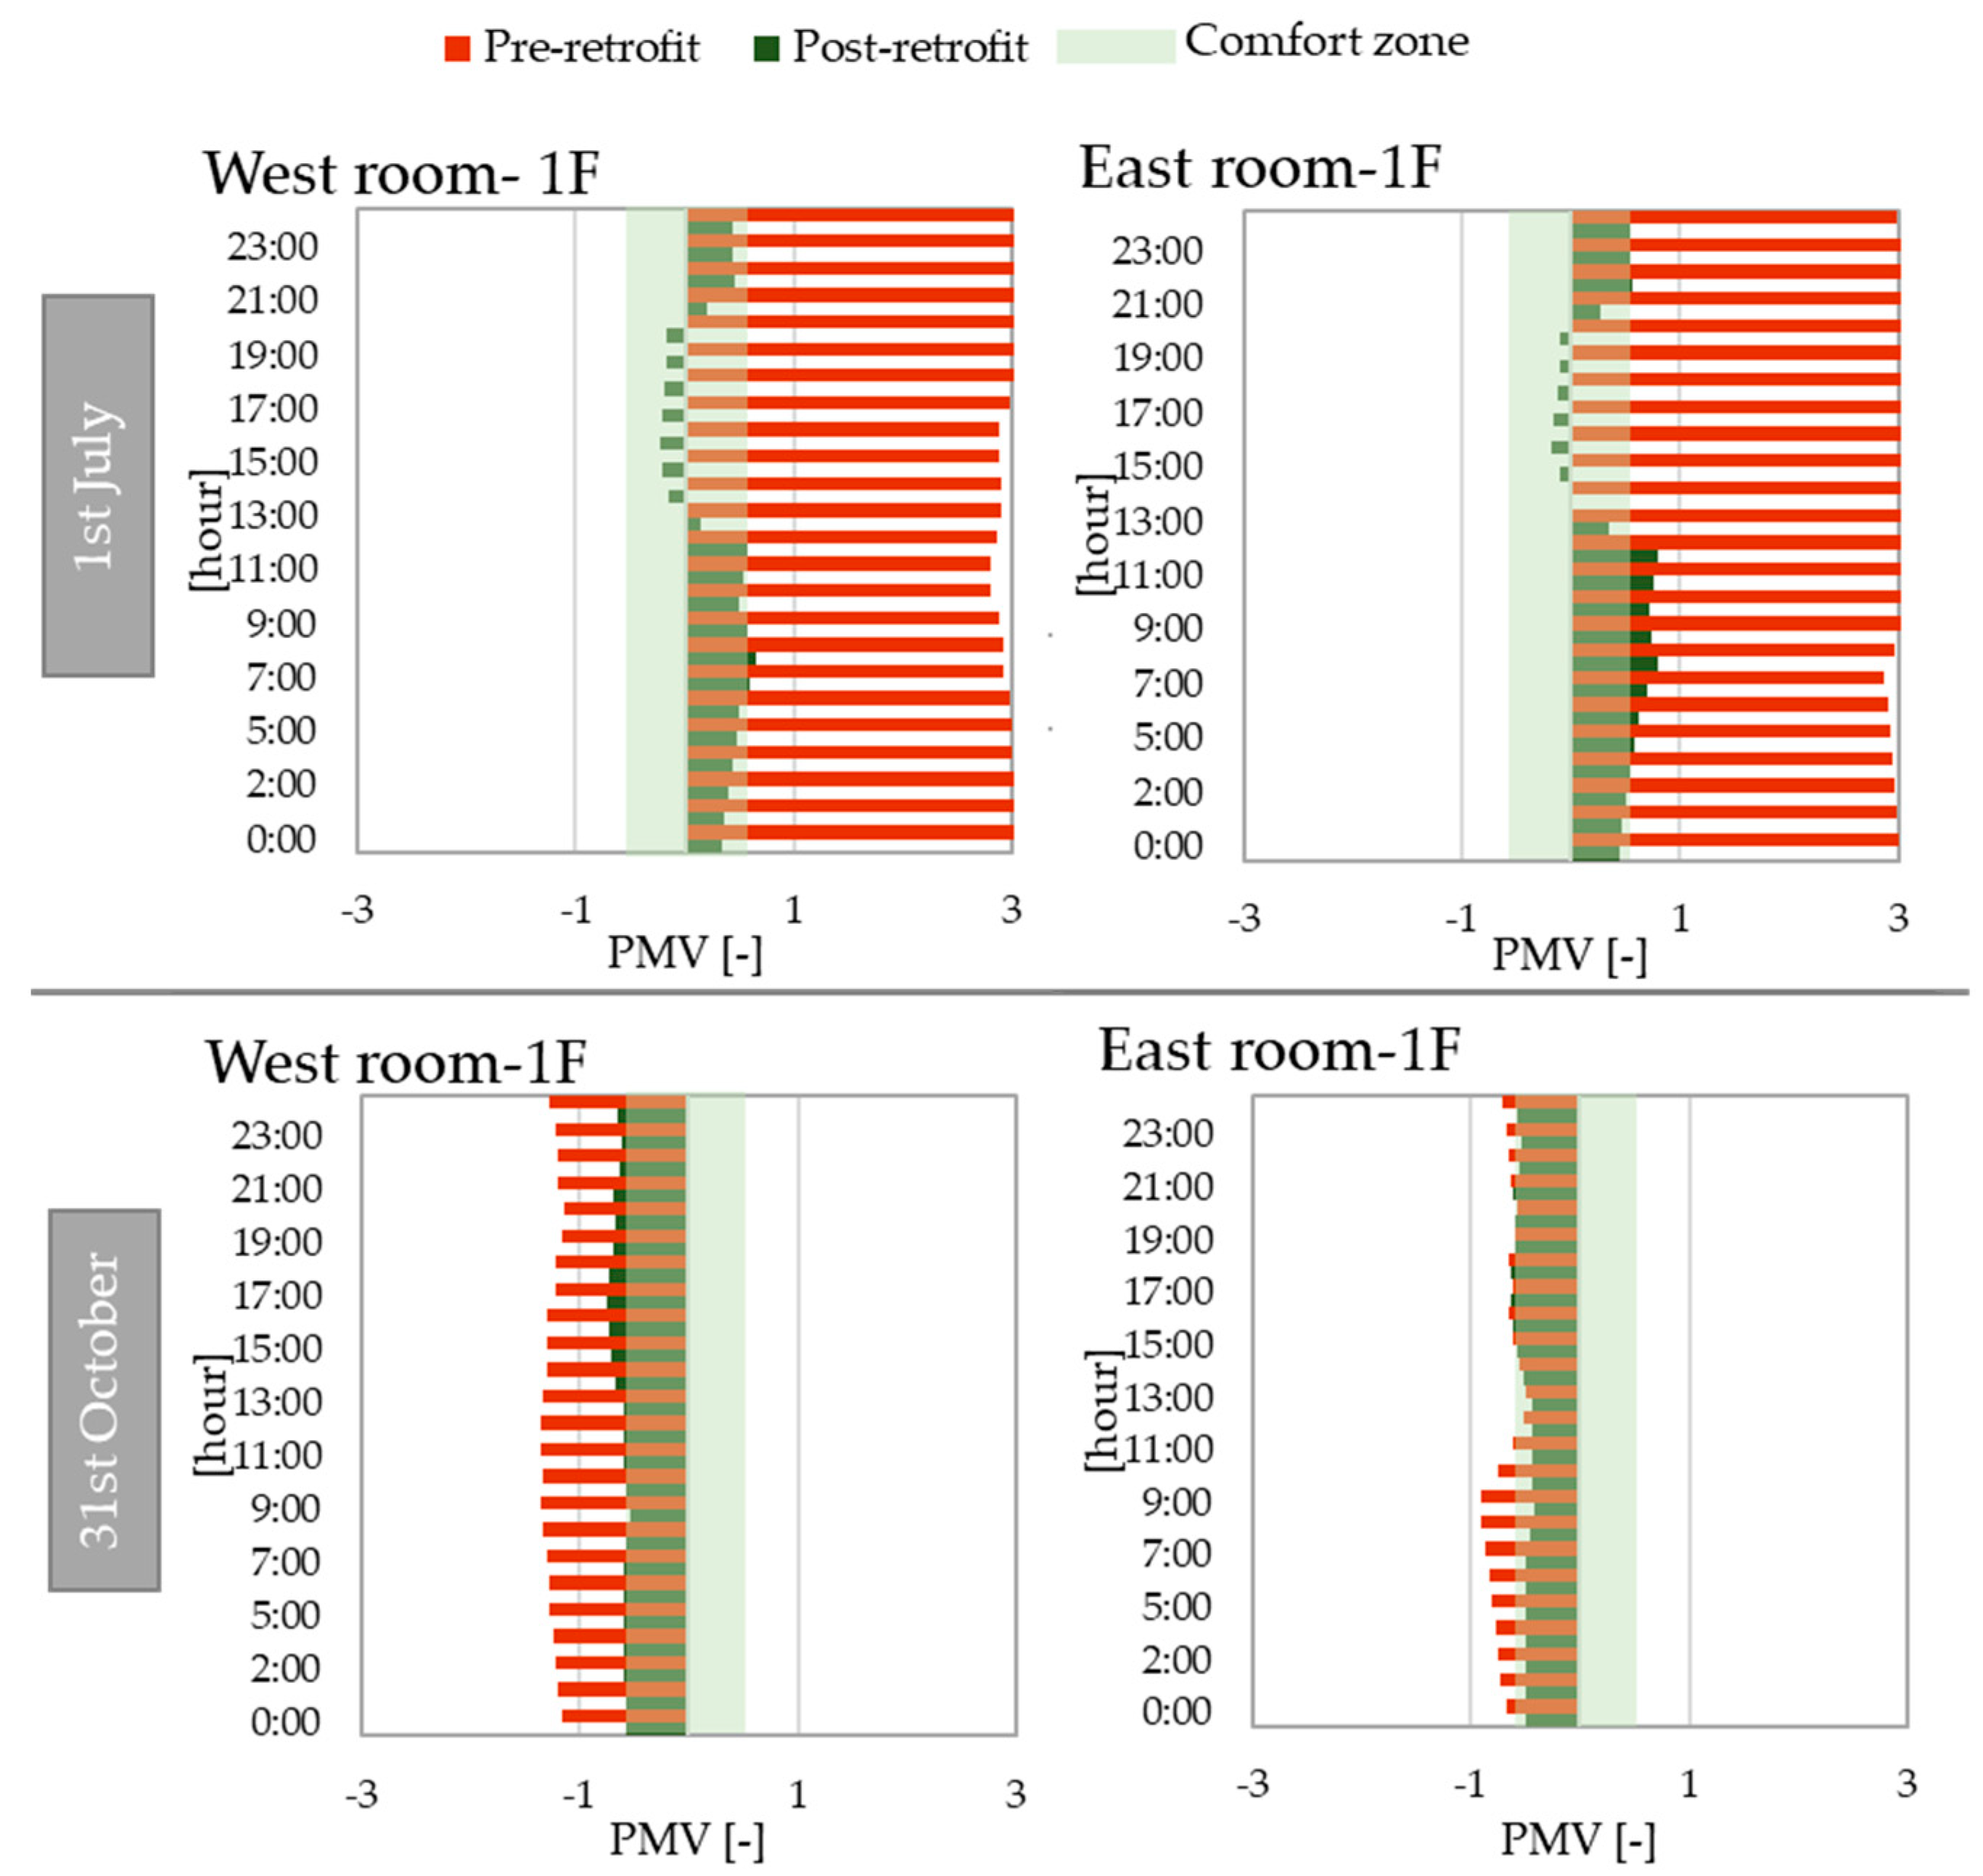
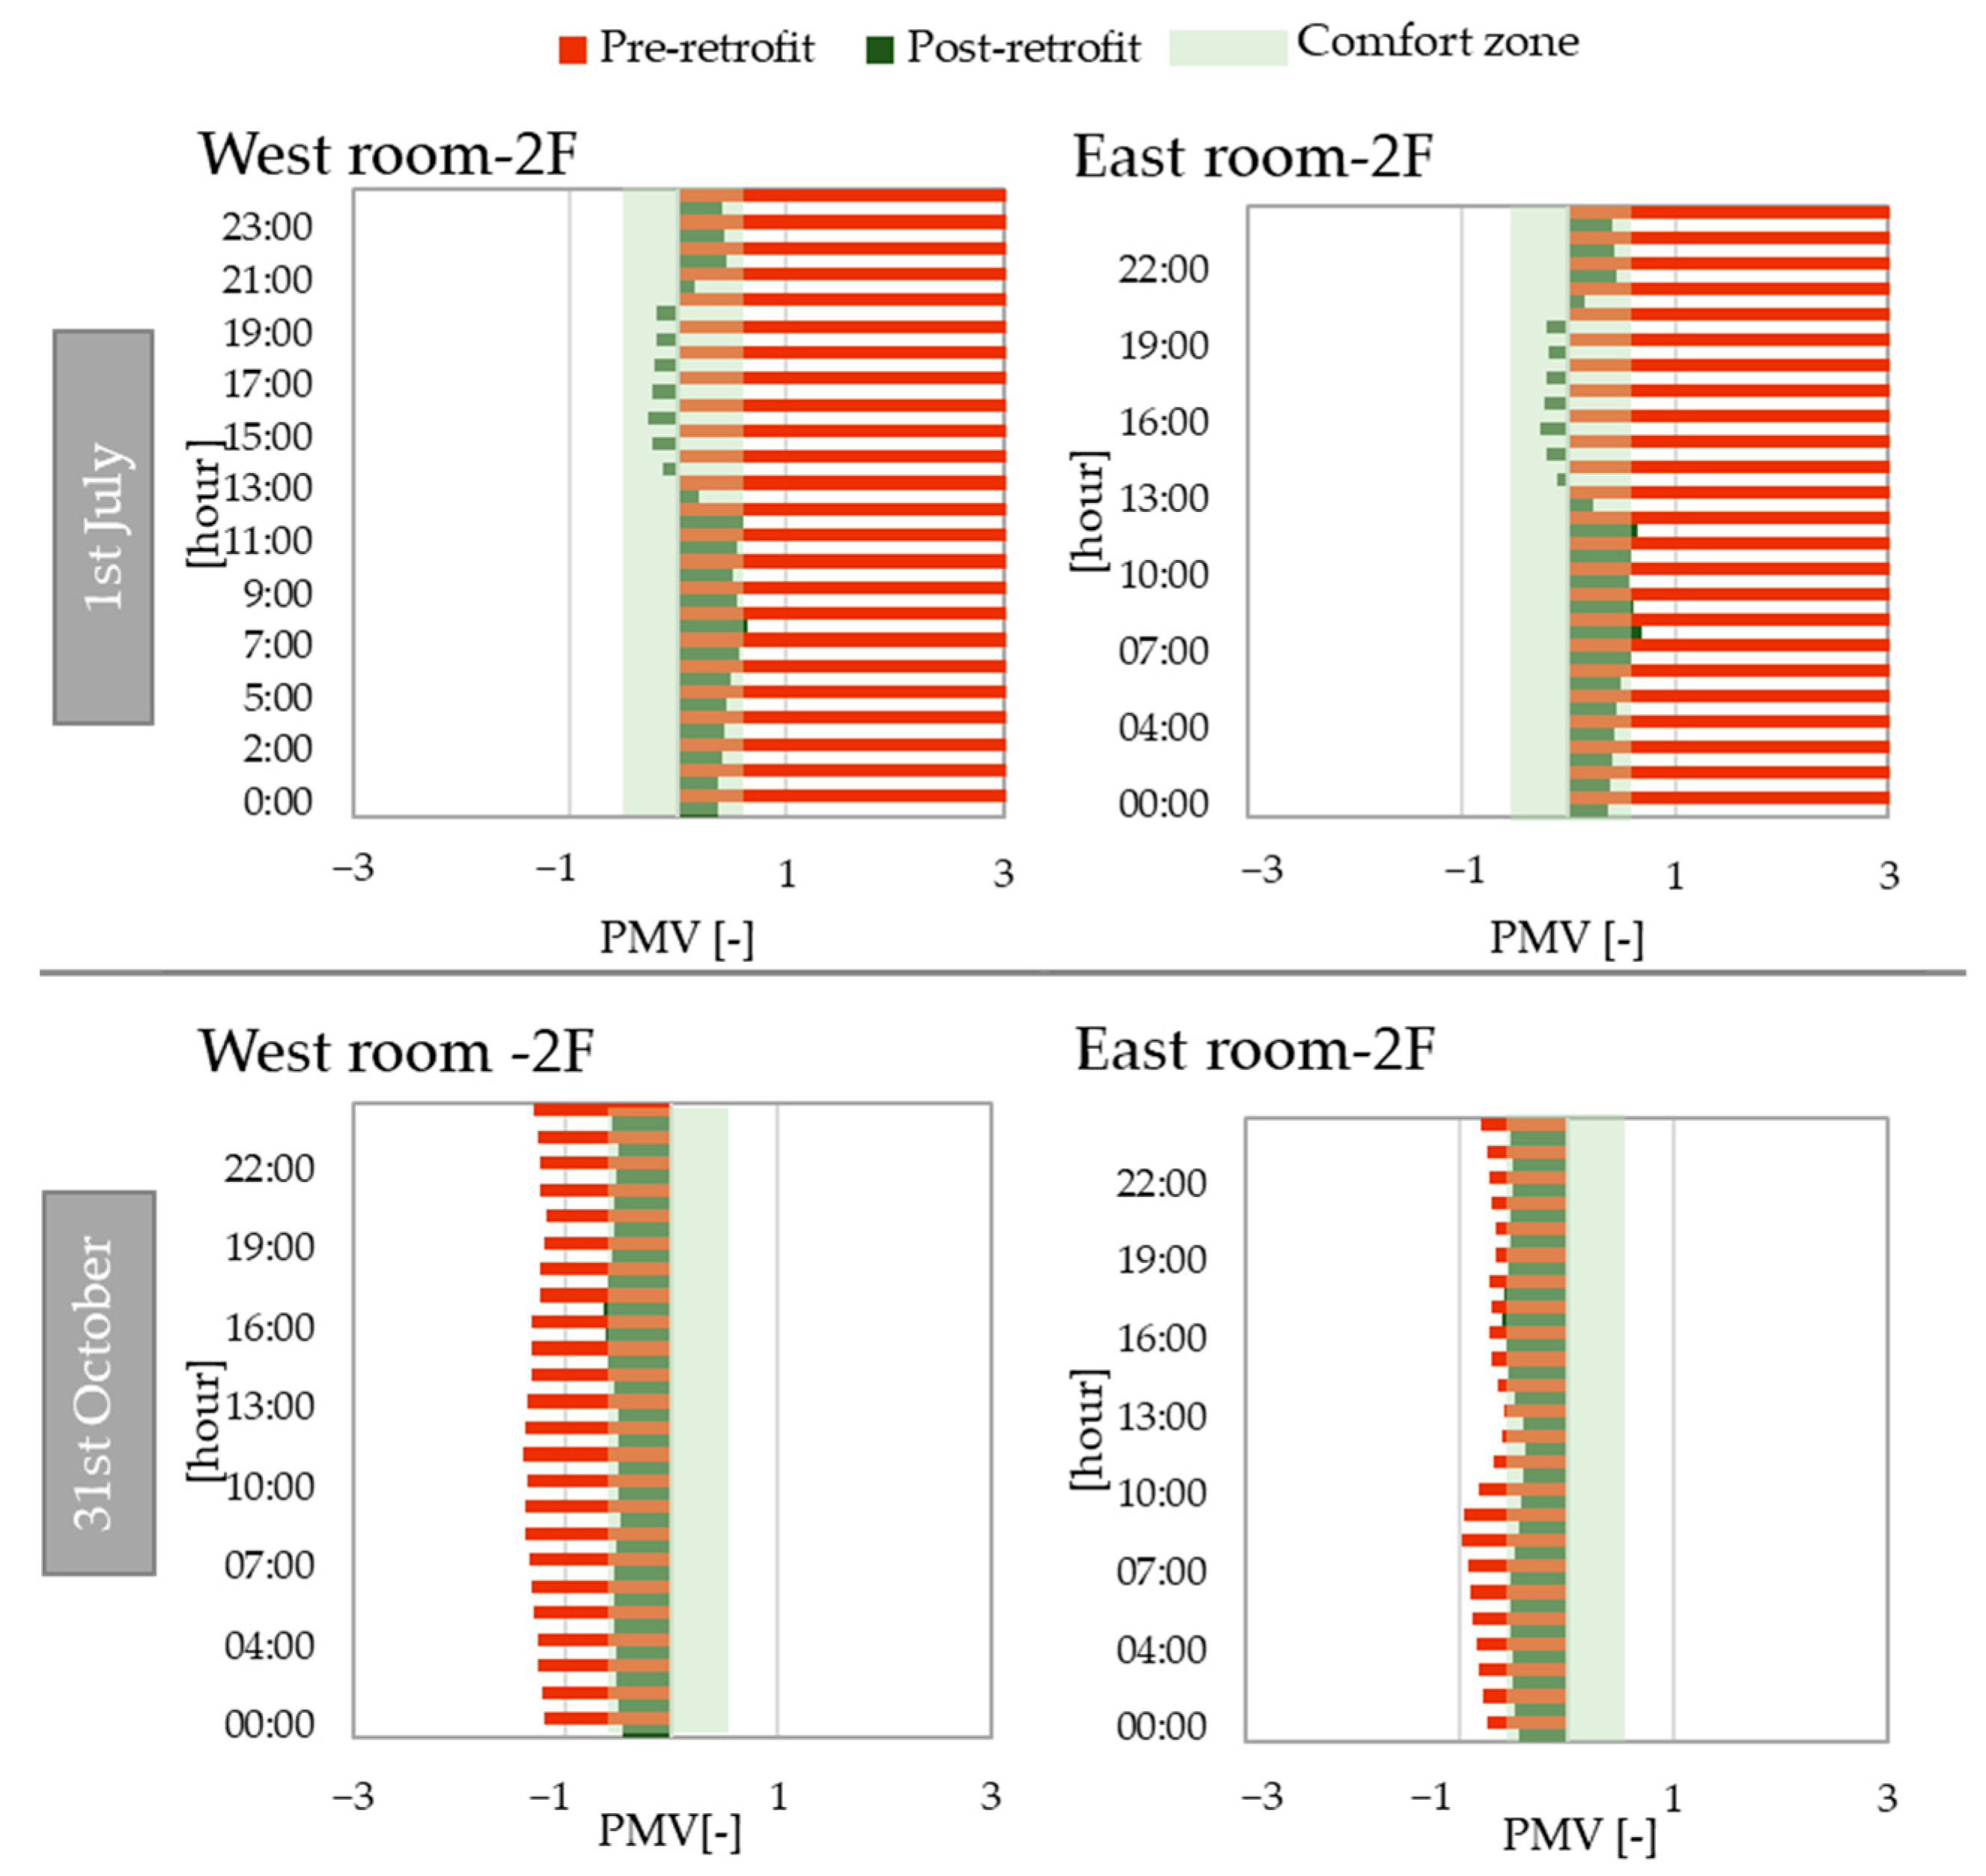
4.2.1. Thermo-Hygrometric Comfort
- 31 October: on which the heating systems are turned off, to examine the passive effect of the new building envelope on the indoor thermal comfort.
- 1 July: during which the cooling systems are operating (refurbished phase), to investigate how the addition of the cooling system can affect indoor comfort levels.
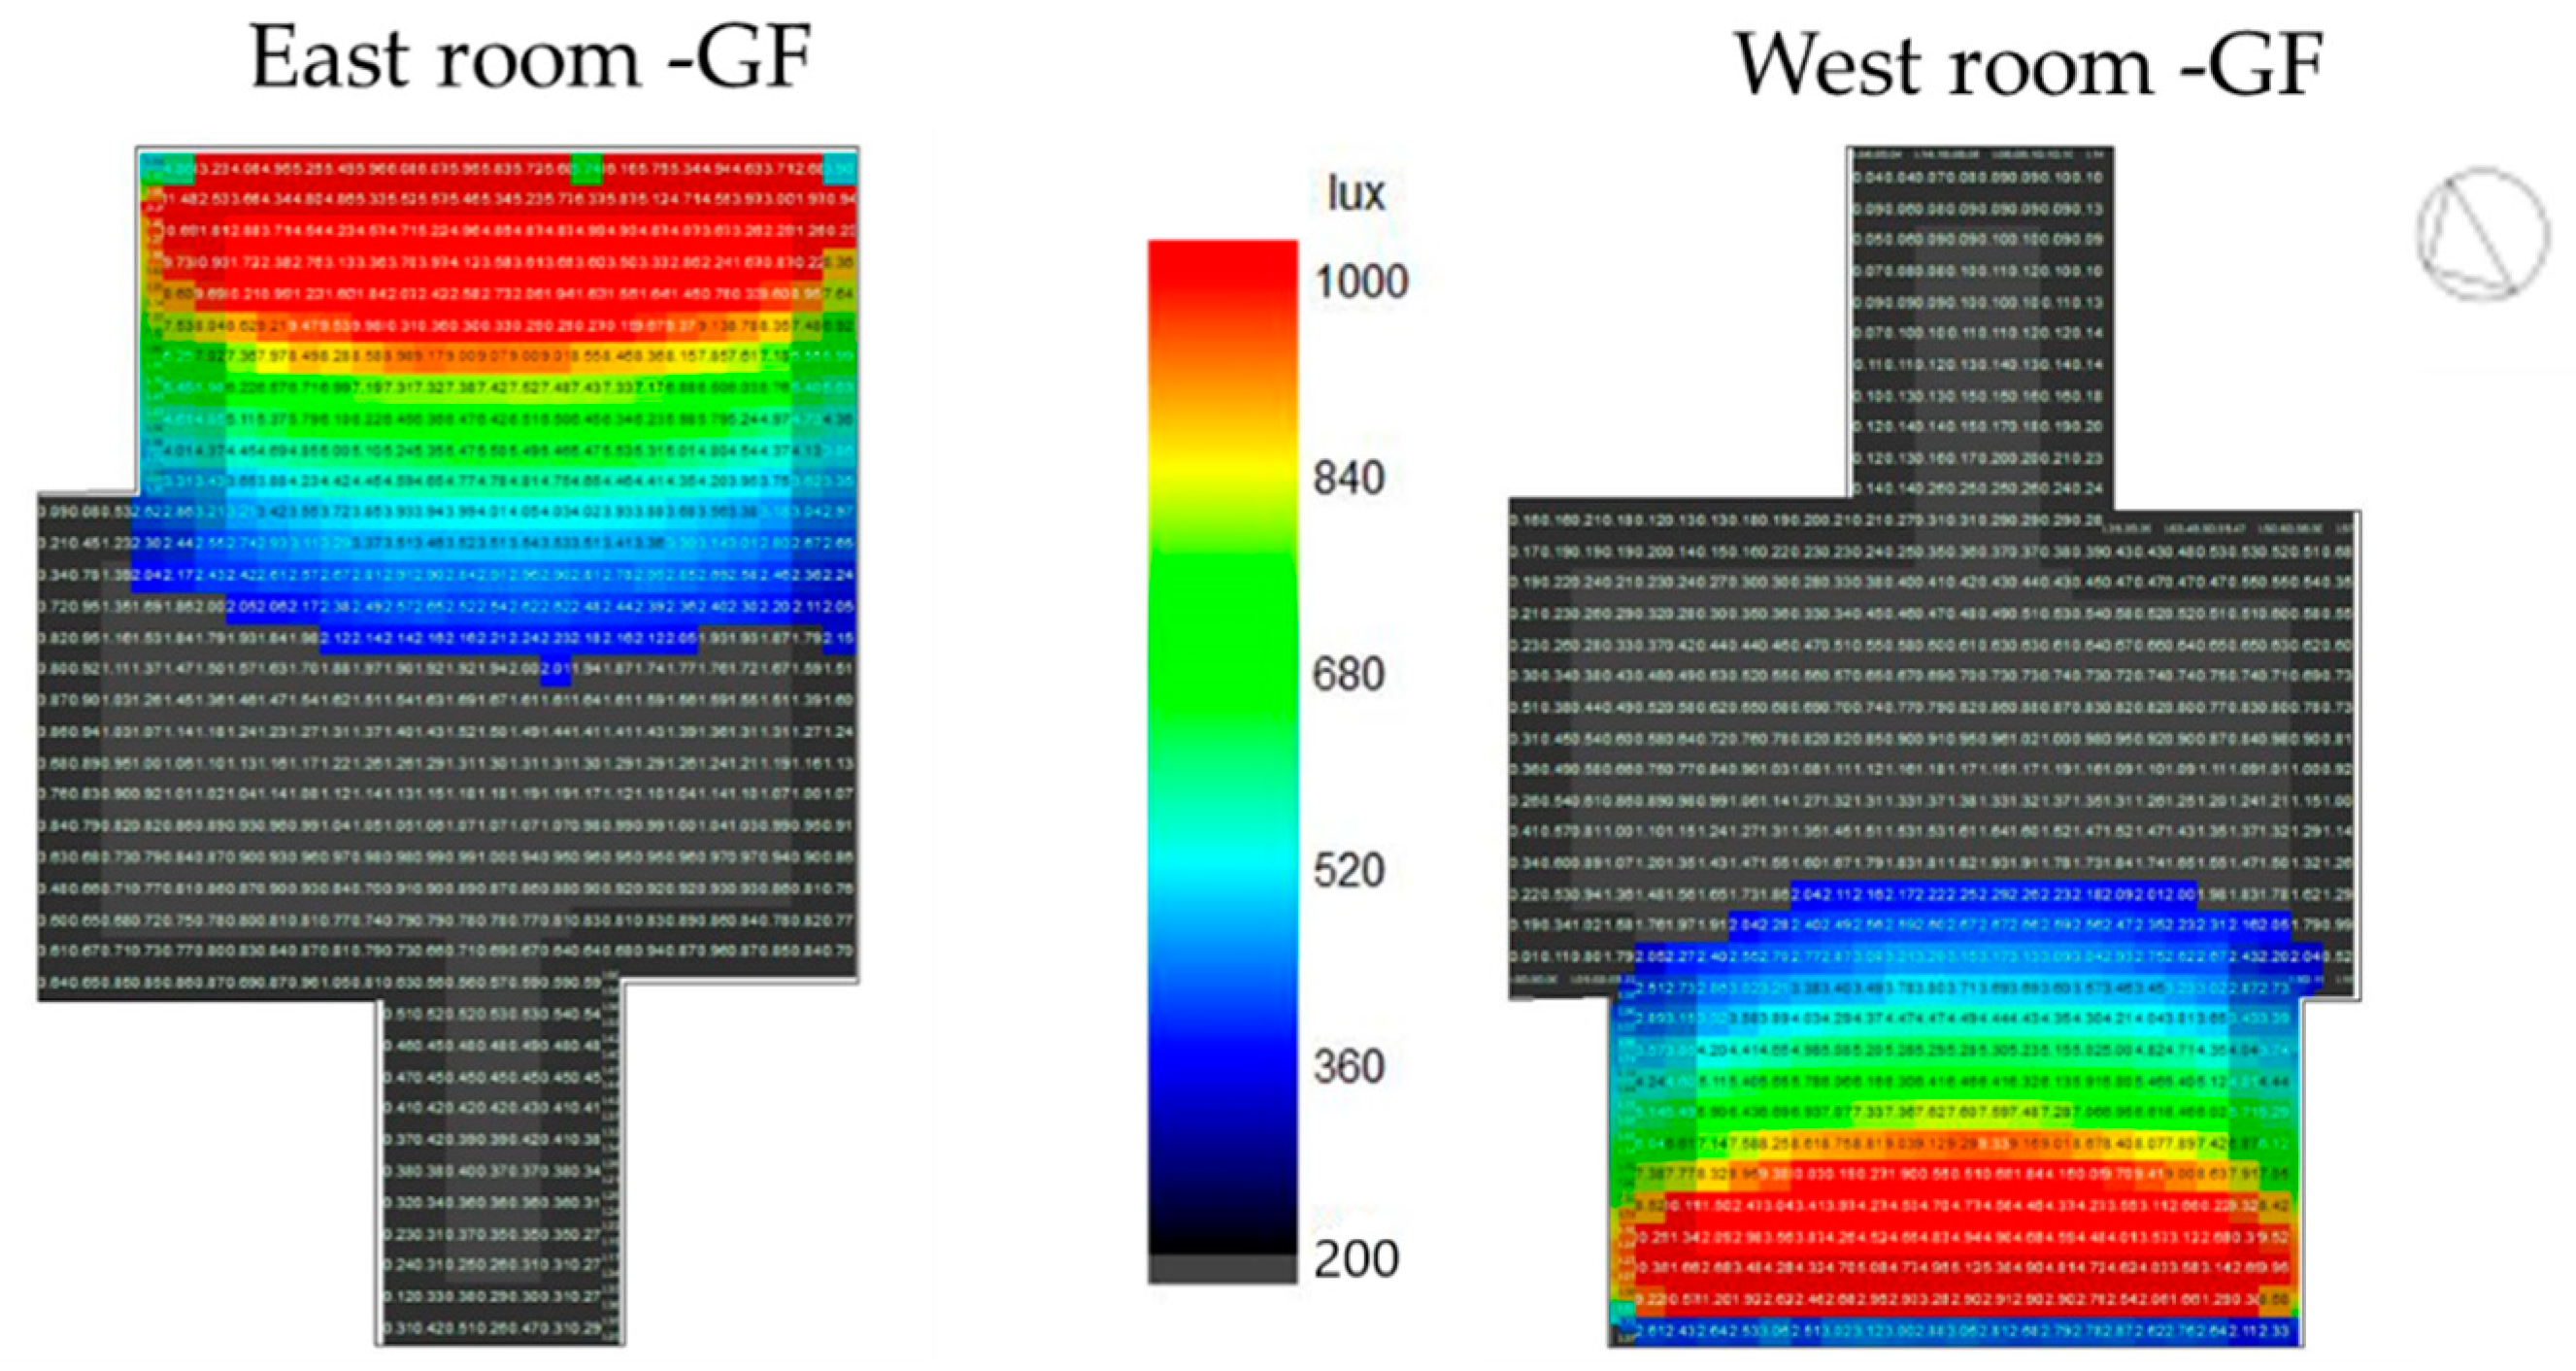
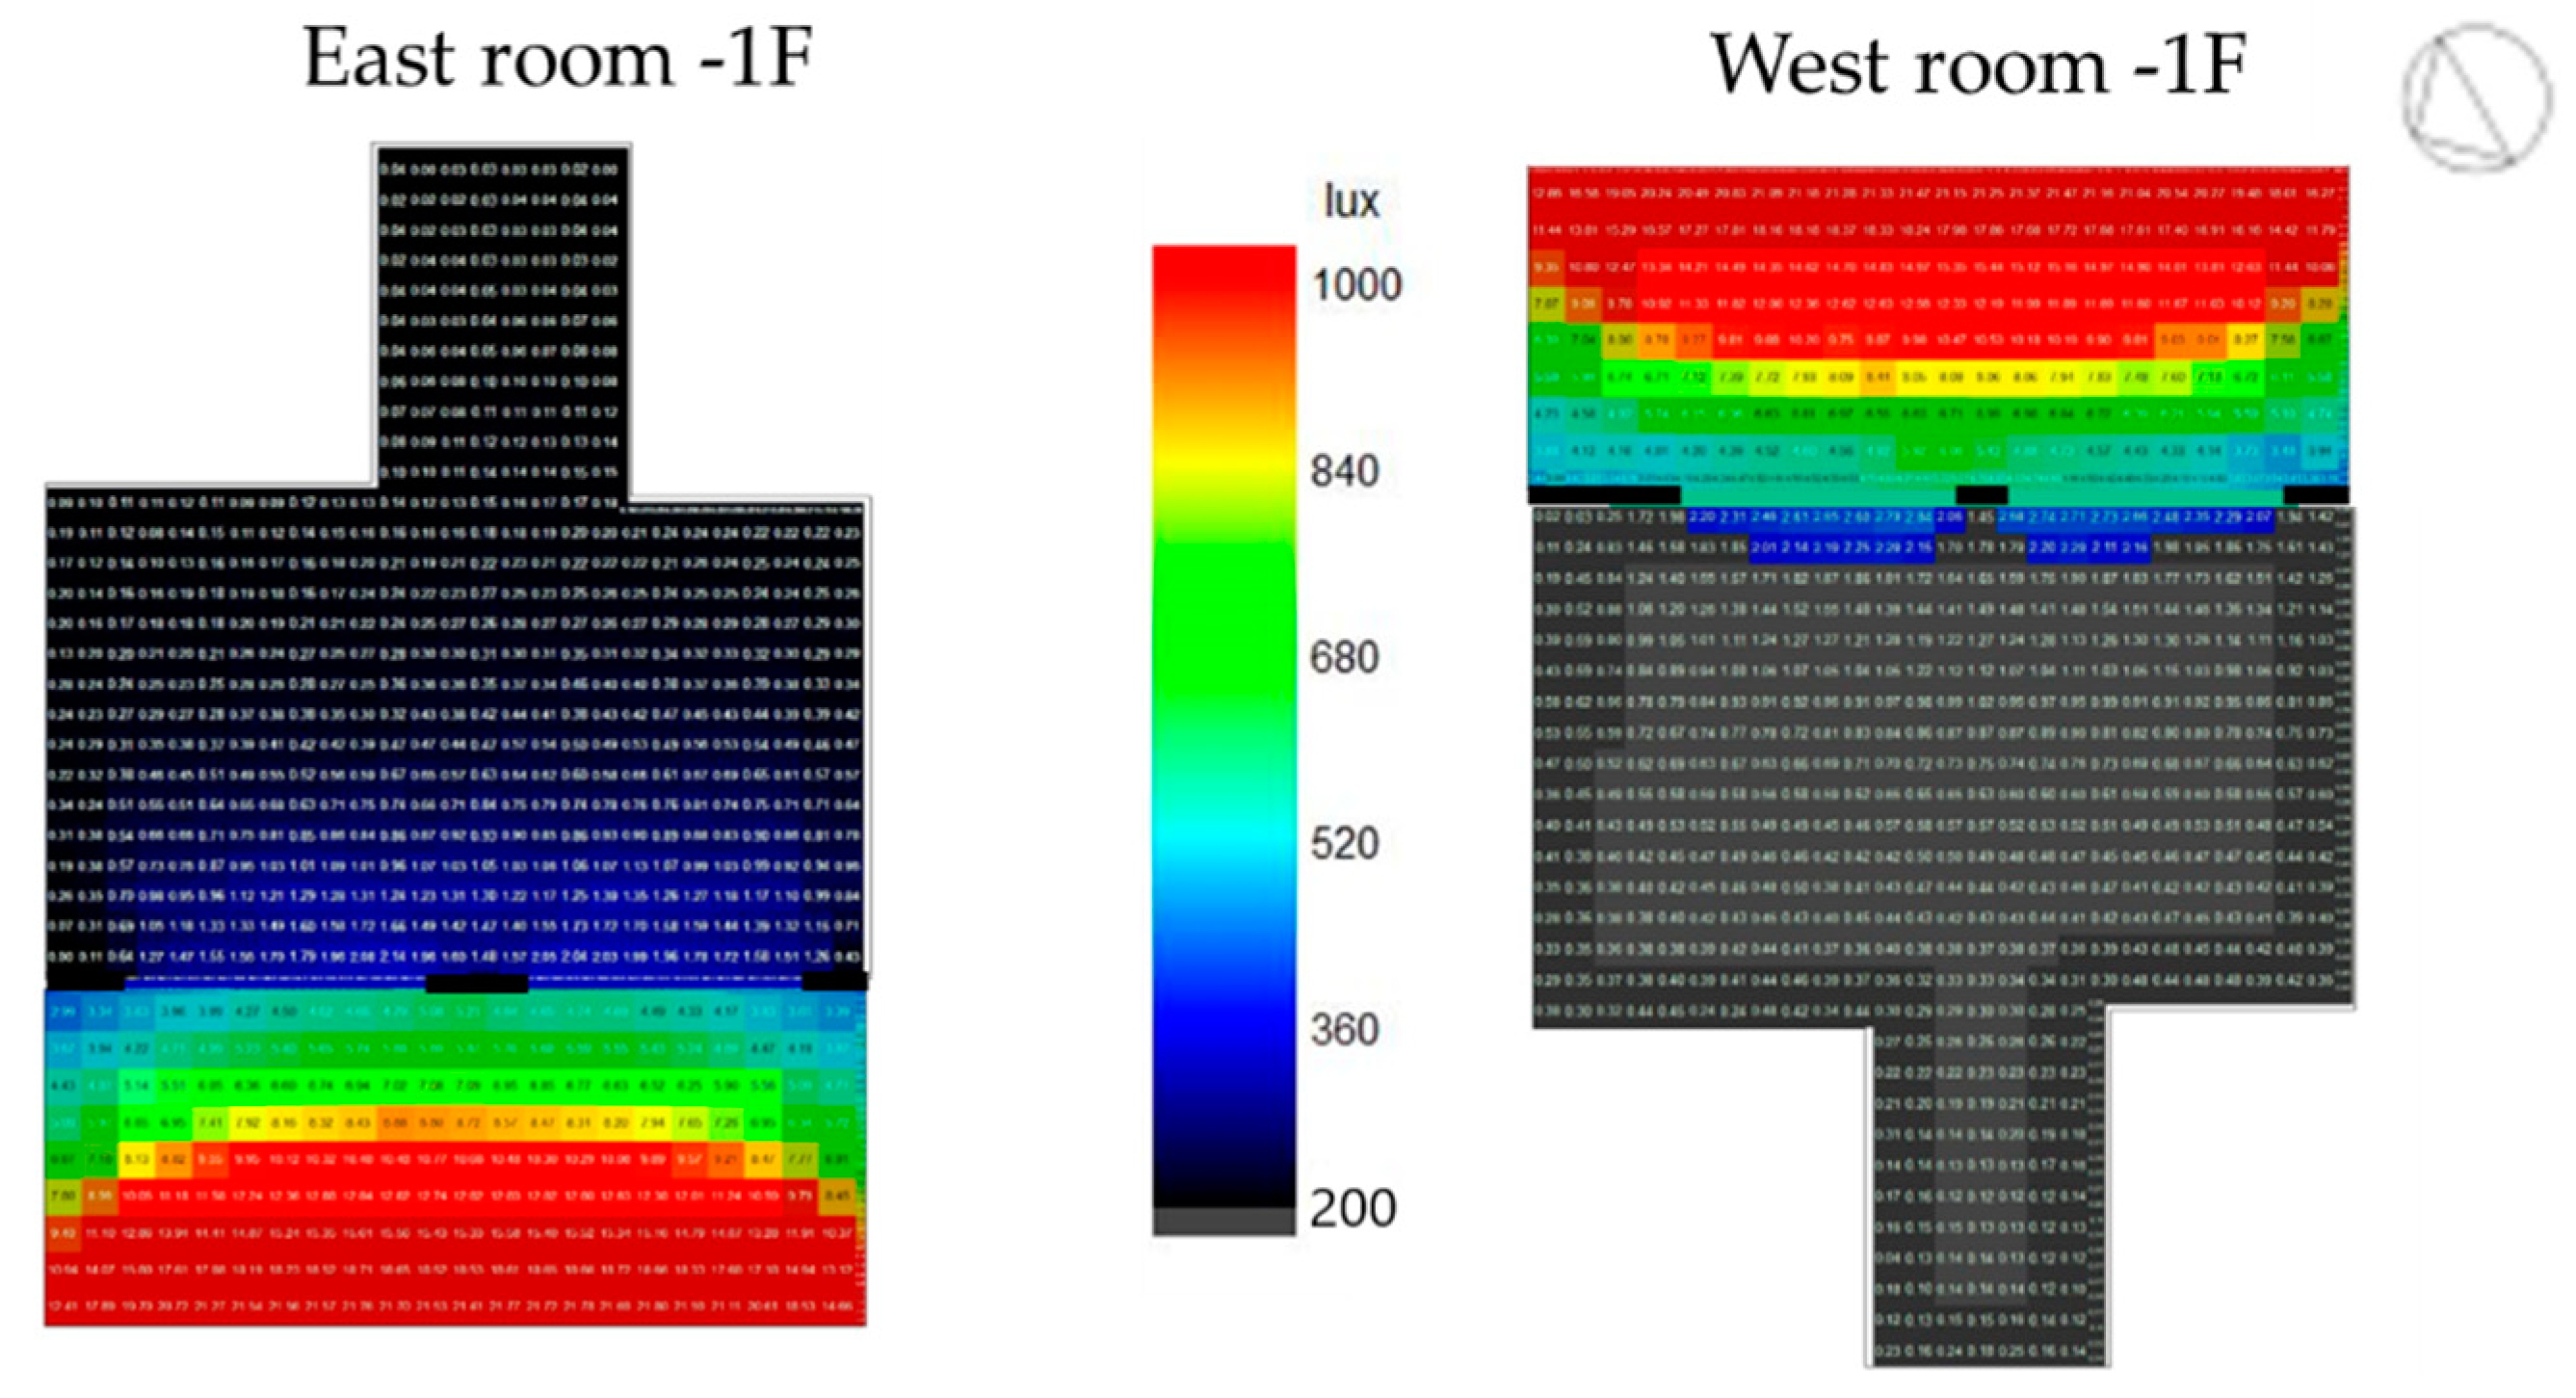
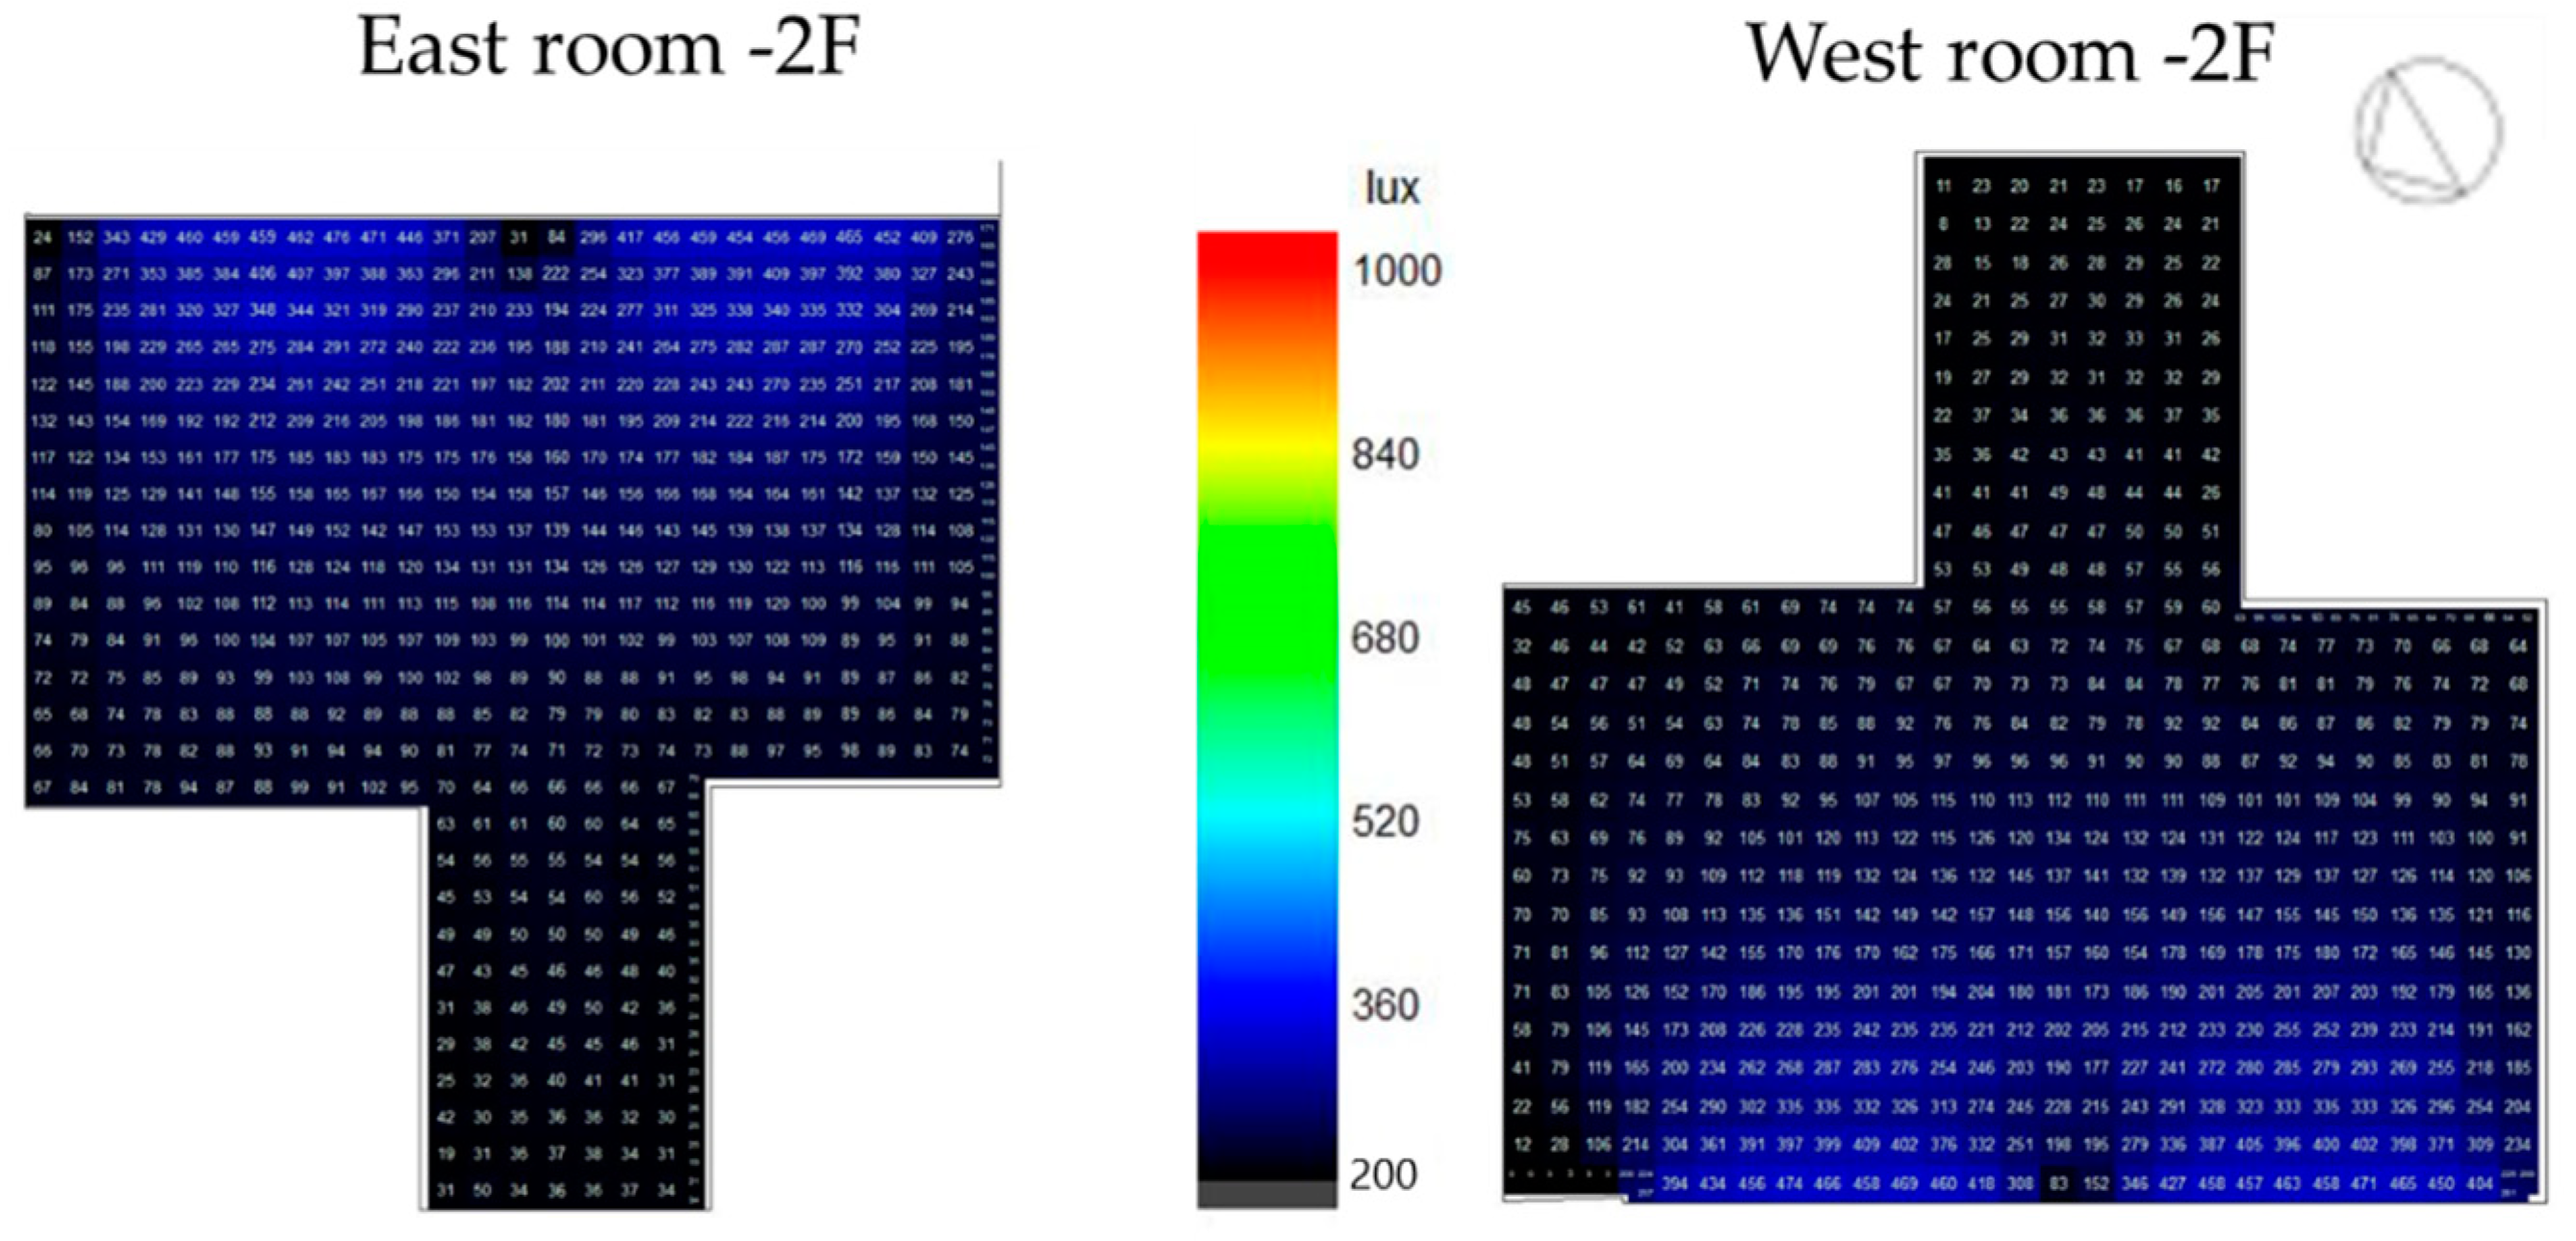
4.2.2. Daylighting Evaluation
4.2.3. Indoor Air Quality
4.3. Post-Occupancy Evaluation and Future Steps
- user comfort (thermal, visual, living space, managing of bioclimatic environment, ventilation, acoustic, etc.).
- sustainable aspects (thermal insulation, plants powered by renewable energy sources, materials, etc.);
- technical aspects (seismic safety, evacuation plan, fire safety, etc.)
- social aspect (benefits to the whole urban district, aesthetic aspect, etc.).
- evaluation of the post-occupancy surveys,
- comparisons with the degree of satisfaction/expectations before the deep renovation, following the structure reported as an example in Table 8, regarding four main fields of interests,
- development of guidelines on optimized building management based on user responses.
5. Discussions
6. Conclusions
Author Contributions
Funding
Conflicts of Interest
Nomenclature
| Acronyms | |
| BEPS | Building Energy Performance Simulation |
| COP | Coefficient of Performance [Whth/Whel] |
| DF | Daylight Factor |
| DHW | Domestic Hot Water |
| EER | Energy Efficiency Ratio [Whth/Whel] |
| EPBD | Energy Performance of Building Directive |
| FCU | Fan Coil Unit |
| GET | inteGrated Efficient Technologies |
| HP | Heat Pump |
| HVAC | Heating, Ventilation, and Air Conditioning, |
| IEQ | Indoor Environmental Quality |
| PMV | Predicted Mean Vote |
| POE | Post Occupancy Evaluation |
| PPD | Predicted Percentage of Dissatisfaction |
| Pro-GET-OnE | Proactive synergy of integrated Efficient Technologies on buildings’ Envelopes |
| RC | Reinforced Concrete |
| RES | Renewable Energy Sources |
| SCOP | Seasonal Coefficient of Performance [Whth/Whel] |
| SEER | Seasonal Energy Efficiency Ratio [Whth/Whel] |
| Symbols | |
| BAL | Balcony |
| ER | Extra-Room |
| g | Solar Factor |
| GF | Ground Floor |
| ppm | Part per million |
| PV | Photovoltaic |
| SS | Sun Space |
| Uf | Frame Thermal Transmittance |
| Ug | Glass Thermal Transmittance |
| Uvalue | Thermal Transmittance |
| 1F | first floor |
| 2F | second floor |
References
- Rajeev, P.; Tesfamariam, S. Seismic fragilities for reinforced concrete buildings with consideration of irregularities. Struct. Saf. 2012, 39, 1–13. [Google Scholar] [CrossRef]
- EU Buildings Data Mapper. Available online: https://ec.europa.eu/energy/eu-buildings-datamapper_en (accessed on 11 May 2022).
- Overview of Member States Information on NZEBs. Available online: https://ec.europa.eu/energy/sites/default/files/documents/Updated%20progress%20report%20NZEB.pdf (accessed on 11 May 2022).
- Directive (Eu) 2018/844 of the European Parliament and of the Council of 30 May. Available online: https://eur-lex.europa.eu/legal-content/IT/TXT/?uri=CELEX%3A32018L0844 (accessed on 11 May 2022).
- Directive 2002/91/EC of the European Parliament and of the Council of 16 December. Available online: https://eur-lex.europa.eu/legal-content/IT/TXT/?uri=celex%3A32002L0091 (accessed on 11 May 2022).
- Directive 2010/31/Eu of the European Parliament and of the Council of 19 May. Available online: https://eur-lex.europa.eu/legal-content/IT/ALL/?uri=celex:32010L0031 (accessed on 11 May 2022).
- Menna, C.; Del Vecchio, C.; Di Ludovico, M.; Mauro, G.M.; Ascione, F.; Prota, A. Conceptual design of integrated seismic and energy retrofit interventions. J. Build. Eng. 2021, 38, 102190. [Google Scholar] [CrossRef]
- Menna, C.; Felicioni, L.; Negro, P.; Lupíšek, A.; Romano, E.; Prota, A.; Hájek, P. Review of methods for the combined assessment of seismic resilience and energy efficiency towards sustainable retrofitting of existing European buildings. Sustain. Cities Soc. 2022, 77, 103556. [Google Scholar] [CrossRef]
- Lee, J.Y.; Wargocki, P.; Chan, Y.H.; Chen, L.; Tham, K.W. How does indoor environmental quality in green refurbished office buildings compare with the one in new certified buildings? Build. Environ. 2020, 171, 106677. [Google Scholar] [CrossRef]
- Salleh, N.M.; Kamaruzzaman, S.N.; Riley, M.; Zawawi, E.M.A.; Sulaiman, R. A quantitative evaluation of indoor environmental quality in refurbished kindergarten buildings: A Malaysian case study. Build. Environ. 2015, 94, 723–733. [Google Scholar] [CrossRef]
- Kamaruzzaman, S.N.; Lou, E.C.W.; Wong, P.F.; Wood, R.; Che-Ani, A.I. Developing weighting system for refurbishment building assessment scheme in Malaysia through analytic hierarchy process (AHP) approach. Energy Policy 2018, 112, 280–290. [Google Scholar] [CrossRef]
- Lee, E. Indoor environmental quality (IEQ) of LEED-certified home: Importance-performance analysis (IPA). Build. Environ. 2019, 149, 571–581. [Google Scholar] [CrossRef]
- Li, Q.; Zhang, L.; Zhang, L.; Wu, X. Optimizing energy efficiency and thermal comfort in building green retrofit. Energy 2021, 237, 121509. [Google Scholar] [CrossRef]
- Vakalis, D.; Patino, E.D.L.; Opher, T.; Touchie, M.; Burrows, K.; MacLean, H.; Siegel, J. Quantifying thermal comfort and carbon savings from energy-retrofits in social housing. Energy Build. 2021, 241, 110950. [Google Scholar] [CrossRef]
- Fisk, W.J.; Singer, B.C.; Chan, W.R. Association of residential energy efficiency retrofits with indoor environmental quality, comfort, and health: A review of empirical data. Build. Environ. 2020, 180, 107067. [Google Scholar] [CrossRef]
- Ozarisoy, B.; Altan, H. Bridging the energy performance gap of social housing stock in south-eastern Mediterranean Europe: Climate change and mitigation. Energy Build. 2022, 258, 111687. [Google Scholar] [CrossRef]
- Altan, H.; Ozarisoy, B. An Analysis of the Development of Modular Building Design Elements to Improve Thermal Performance of a Representative High Rise Residential Estate in the Coastline City of Famagusta, Cyprus. Sustainability 2022, 14, 4065. [Google Scholar] [CrossRef]
- Haverinen-Shaughnessy, U.; Pekkonen, M.; Leivo, V.; Prasauskas, T.; Turunen, M.; Kiviste, M.; Aaltonen, A.; Martuzevicius, D. Occupant satisfaction with indoor environmental quality and health after energy retrofits of multi-family buildings: Results from INSULAtE-project. Int. J. Hyg. Environ. Health 2018, 221, 921–928. [Google Scholar] [CrossRef] [PubMed]
- Carratt, A.; Kokogiannakis, G.; Daly, D. A critical review of methods for the performance evaluation of passive thermal retrofits in residential buildings. J. Clean. Prod. 2020, 263, 121408. [Google Scholar] [CrossRef]
- Ortiz, M.; Itard, L.; Bluyssen, P.M. Indoor environmental quality related risk factors with energy-efficient retrofitting of housing: A literature review. Energy Build. 2020, 221, 110102. [Google Scholar] [CrossRef]
- Diaz Lozano Patino, E.; Siegel, J.A. Indoor environmental quality in social housing: A literature review. Build. Environ. 2018, 131, 231–241. [Google Scholar] [CrossRef]
- Zuhaib, S.; Manton, R.; Griffin, C.; Hajdukiewicz, M.; Keane, M.M.; Goggins, J. An Indoor Environmental Quality (IEQ) assessment of a partially-retrofitted university building. Build. Environ. 2018, 139, 69–85. [Google Scholar] [CrossRef]
- Barmparesos, N.; Assimakopoulos, M.N.; Assimakopoulos, V.D.; Loumos, N.; Sotiriou, M.A.; Koukoumtzis, A. Indoor Air Quality and Thermal Conditions in a Primary School with a Green Roof System. Atmosphere 2018, 9, 75. [Google Scholar] [CrossRef] [Green Version]
- Huang, K.-T.; Huang, W.-P.; Lin, T.-P.; Hwang, R.-L. Implementation of green building specification credits for better thermal conditions in naturally ventilated school buildings. Build. Environ. 2015, 86, 141–150. [Google Scholar] [CrossRef]
- Proactive Synergy of Integrated Efficient Technologies on Buildings’ Envelopes (Pro-GET-OnE)—H. Available online: https://www.progetone.eu/project/ (accessed on 9 February 2022).
- Energy Plus Simulation Software, version 8.1.0; U.S. Department of Energy’s (DOE) Building Technologies Office (BTO): Washington, DC, USA, 2016.
- Design Builder, version 4; DesignBuilder Software Ltd.: Stroud, UK, 2016.
- U.S. Department of Energy Federal Energy Management Program. M&V Guidelines: Measurement and Verification for Per-formance-Based Contracts Version 4.0; U.S. Department of Energy Federal Energy Management Program: Washington, DC, USA, 2015.
- Assimakopoulos, M.-N.; De Masi, R.F.; Fotopoulou, A.; Papadaki, D.; Ruggiero, S.; Semprini, G.; Vanoli, G.P. Holistic approach for energy retrofit with volumetric add-ons toward nZEB target: Case study of a dormitory in Athens. Energy Build. 2020, 207, 109630. [Google Scholar] [CrossRef]
- KENAK. Greek Regulation on Energy Performance of Buildings, Ministerial Decision Δ6/Β/οικ.5825/30-03-2010 ΦΕΚ Β’ 407. Available online: http://www.ypeka.gr/LinkClick.aspx?fileticket=aiS4GyKxx04%3d&tabid=525&language=el-GR (accessed on 11 May 2022). (In Greek).
- International Organization for Standardization. ISO Ergonomics of the Thermal Environment—Analytical Determination and Interpretation of Thermal Comfort Using Calculation of the PMV and PPD Indices and Local Thermal Comfort Criteria; International Organization for Standardization: Geneva, Switzerland, 2006. [Google Scholar]
- U.S. Department of Energy. Engineering Reference, EnergyPlus™ Version 9.2.0 Documentation, September 27, 2019 Build: 921312fa1d; U.S. Department of Energy: Washington, DC, USA, 2019.
- ANSI/ASHRAE Standard 62.1-2019; Ventilation for Acceptable Indoor Air Quality. ASHRAE: Atlanta, GA, USA, 2019.
- Preiser, W.F.E.; Rabinowitz, H.Z.; White, E.T. Post-Occupancy Evaluation; Van Nostrand Reinhold: New York, NY, USA, 1988. [Google Scholar]
- Federal Facilities Council Technical Report No. 145, Learning from our Buildings A State-of-the-Practice Summary of Post-Occupancy Evaluation; National Academy Press: Washington, DC, USA, 2001.
- Vischer, J. Post-Occupancy Evaluation: A Multifaceted Tool for Building Improvement. Ph.D. Thesis, University of Montreal, Montreal, QC, Canada, 2001. [Google Scholar]
- Menassa, C.C.; Baer, B. A framework to assess the role of stakeholders in sustainable building retrofit decisions. Sustain. Cities Soc. 2014, 10, 207–221. [Google Scholar] [CrossRef]
- Bordass, B.; Leaman, A. Making feedback and post-occupancy evaluation routine 1: A portfolio of feedback techniques. Build. Res. Inf. 2005, 33, 347–352. [Google Scholar] [CrossRef] [Green Version]
- Huizenga, C.; Laeser, K.; Arens, E. A Web-Based Occupant Satisfaction Survey for Bench-Marking Building Quality, Indoor Environmental Quality (IEQ); UC Berkeley: Berkeley, CA, USA, 2002. [Google Scholar]
- Kottek, M.; Grieser, J.; Beck, C.; Rudolf, B.; Rubel, F. World map of the Köppen-Geiger climate classification updated. Meteorol. Z. 2006, 15, 259–263. [Google Scholar] [CrossRef]
- Available online: https://www.weatheronline.co.uk/ (accessed on 11 May 2022).
- Ashrae Standard 55; Thermal Environmental Conditions for Human Occupancy. ASHRAE: Atlanta, GA, USA, 2021.
- Landolfo, R.; Formisano, A.; Di Lorenzo, G.; Di Filippo, A. Classification of european building stock in technological and typo-logical classes. J. Build. Eng. 2022, 45, 103482. [Google Scholar] [CrossRef]
- TABULA WebTool. Available online: https://episcope.eu/building-typology/country/gr/ (accessed on 11 May 2022).
- De Masi, R.F.; Ruggiero, S.; Vanoli, G.P. Multi-layered wall with vacuum insulation panels: Results of 5-years in-field monitoring and numerical analysis of aging effect on building consumptions. Appl. Energy 2020, 278, 115605. [Google Scholar] [CrossRef]
- Farrou, I.; Kolokotroni, M.; Santamouris, M. Building envelope design for climate change mitigation: A case study of hotels in Greece. Int. J. Sustain. Energy 2016, 35, 944–967. [Google Scholar] [CrossRef]
- Greek National Plan “National Plan for Increasing the Number of Nearly Zero-Energy Buildings”. Available online: https://ec.europa.eu/energy/sites/ener/files/documents/greece_en_version_2017.pdf (accessed on 9 February 2022).
- Leccese, F.; Rocca, M.; Salvadori, G.; Belloni, E.; Buratti, C. Towards a holistic approach to indoor environmental quality assessment: Weighting schemes to combine effects of multiple environmental factors. Energy Build. 2021, 245, 111056. [Google Scholar] [CrossRef]
- Mustafa, F.A. Performance assessment of buildings via post-occupancy evaluation: A case study of the building of the architecture and software engineering departments in Salahaddin University-Erbil, Iraq. Front. Arch. Res. 2017, 6, 412–429. [Google Scholar] [CrossRef]
- Hassanain, M.A.; Sedky, A.; Adamu, Z.; Saif, A.-W. A framework for quality evaluation of university housing facilities. J. Build. Apprais. 2010, 5, 213–221. [Google Scholar] [CrossRef]
- Ascione, F.; De Masi, R.F.; de Rossi, F.; Ruggiero, S.; Vanoli, G.P. Optimization of building envelope design for nZEBs in Medi-terranean climate: Performance analysis of residential case study. Appl. Energy 2016, 183, 938–957. [Google Scholar] [CrossRef]
- Bellia, L.; Borrelli, M.; De Masi, R.F.; Ruggiero, S.; Vanoli, G.P. University building: Energy diagnosis and refurbishment design with cost-optimal approach. Discussion about the effect of numerical modelling assumptions. J. Build. Eng. 2018, 18, 1–18. [Google Scholar] [CrossRef]
- Eliopoulou, E.; Mantziou, E. Architectural Energy Retrofit (AER): An alternative building’s deep energy retrofit strategy. Energy Build. 2017, 150, 239–252. [Google Scholar] [CrossRef]
- Available online: http://www.druot.net/Book-Tour-Bois-le-Pr%C3%AAtre-FR.pdf (accessed on 11 May 2022).
- Available online: https://ec.europa.eu/info/strategy/priorities-2019-2024/european-green-deal/delivering-european-green-deal_en#key-steps (accessed on 11 May 2022).


| Pre-Retrofit Stage | Total | North | East | South | West |
|---|---|---|---|---|---|
| Wall Area [m2] | 1808.96 | 180.52 | 724.06 | 180.72 | 723.67 |
| Window Opening Area [m2] | 649.38 | 53.86 | 271.18 | 51.93 | 272.42 |
| Window-Wall Ratio [%] | 35.90 | 29.83 | 37.45 | 28.73 | 37.64 |
| Post-Retrofit Stage | |||||
| Wall Area [m2] | 2019.49 | 219.98 | 789.80 | 219.87 | 789.83 |
| Window Opening Area [m2] | 884.40 | 30.21 | 407.49 | 31.56 | 415.13 |
| Window-Wall Ratio [%] | 43.79 | 13.73 | 51.59 | 14.35 | 52.56 |
| Type | Thickness [m] | Thermal Conductivity [W/mK] | Density [kg/m3] | Specific Heat [J/kg K] | Thermal Transmittance [W/m2K] | ||
| Opaque envelope | External wall | Plaster | 0.025 | 0.35 | 950 | 840 | 1.69 |
| Brick | 0.200 | 0.72 | 1920 | 840 | |||
| Plaster | 0.025 | 0.35 | 950 | 840 | |||
| Roof | Asphalt | 0.006 | 0.70 | 2100 | 1000 | 1.06 | |
| Perlite-bitumen bonded | 0.030 | 0.06 | 240 | 840 | |||
| Concrete | 0.200 | 0.75 | 2300 | 657 | |||
| Plaster | 0.025 | 0.52 | 1200 | 840 | |||
| Ground floor | Marble | 0.020 | 2.90 | 2750 | 840 | 2.07 | |
| Concrete | 0.200 | 0.75 | 2300 | 657 | |||
| Type | Thickness [m] | Thermal Transmittance [W/m2K] | Solar Factor [-] | Light Transmission [-] | Gross Dimensions | ||
| Transparent envelope | Single clear glass | 0.004 | 5.9 | 0.85 | 0.89 | 1.30 m × 1.10 m or 1.00 m × 2.30 m in the rooms | |
| 5.70 m × 2.30 m balcony door in common zones | |||||||
| 2.16 m × 0.6 m in the basement | |||||||
| U-Value of | Pre-Retrofit Stage | Post-Retrofit Stage | Percentage Variation |
|---|---|---|---|
| External walls [W/m2K] | 1.69 | 0.29 | −83% |
| Ground floor [W/m2K] | 2.07 | 0.30 | −86% |
| Flat roof [W/m2K] | 1.06 | 0.28 | −74% |
| Underground walls [W/m2K] | 1.69 | 0.49 | −71% |
| Window frames [W/m2K] | 5.87 | 2.2 | −63% |
| Window glass [W/m2K] | 5.87 | 1.7 | −71% |
| Characteristics | Zone | ||
|---|---|---|---|
| Centralized system | Heating and cooling services | ||
| 4 air to water HP connected to in-room FCU | Heating capacity: 53.0 kW; COP: 3.20; Cooling capacity: 53.3 kW; EER: 2.95. | Rooms; common areas | |
| 2 water storage | Capacity: 500 L | ||
| Gas heating boiler connected to hot water radiators | low-temperature boiler (92/42/EEC) Nominal capacity: 285 kW | Common areas; bathrooms | |
| DHW service | |||
| Gas boiler connected to solar collectors | Efficiency of the gas boiler: 0.95 Number of solar collectors: 38 Area of a single solar collector: 1.8 m2 Azimut: south Tilt angle: 45° | Common areas; bathrooms | |
| Ventilation service | |||
| Controlled mechanical ventilation with heat recovery and air filtration | 5 fan speeds Air flow: 15 ÷ 41 m3/h Thermal efficiency: 82 ÷ 69% Absorbed power 4.6 ÷ 20.6 W | Rooms | |
| Controlled mechanical ventilation with heat recovery and air filtration | Air flow: 590 m3/h | Common areas | |
| Autonomous system | Heating and cooling services | ||
| 4 air to air HP | Heating capacity: 3.18 kW; SCOP: 3.83; Cooling capacity: 2.14 kW; SEER: 2.95. | 2 double rooms at ground floor and 2 double rooms at the first floor. | |
| Ventilation service | |||
| Controlled mechanical ventilation with heat recovery and air filtration | Total flow air provides to each room: 400 m3/h Recirculated flow air from each room: 100 m3/h Absorbed power 1.16 kW | ||
| Heating Period (Set-Point Temperature 20 °C) | |
| Bedrooms and common areas—air to water HP | From 7:00 a.m. to 9:00 a.m., from 5 p.m. to 10 p.m., from 1 November to 31 March |
| Bathrooms and common areas—gas heating boiler | From 7:00 a.m. to 11 a.m., and form 6:00 p.m. to 10:00 p.m., from 1 November to 31 March |
| Ground floor and first floor double rooms—air to air HP | From 7:00 a.m. to 9:00 a.m., from 5 p.m. to 10 p.m., from 1 November to 31 March |
| Cooling Period (Set-Point Temperature 26 °C) | |
| Bedrooms and common areas—air to water HP | From 12:00 p.m. to 8:00 p.m., from 1 June to 30 September |
| Ground floor and first floor double rooms—air to air HP | From 12:00 p.m. to 8:00 p.m., from 1 June to 30 September |
| Mechanical Ventilation Activation | |
| Bedrooms | From 7:00 a.m. to 9:00 a.m., from 5:00 p.m. to 10:00 p.m., from 1 November to 31 March From 12:00 p.m. to 8:00 p.m., from 1 April to 31 October |
| Pre-Retrofit | Post-Retrofit | ||
|---|---|---|---|
| West room—GF | 3.1 | 3.3 | ER |
| East room—GF | 3.0 | 4.0 | |
| West room—1F | 3.2 | 3.2 | SS |
| East room—1F | 3.0 | 3.5 | |
| West room—2F | 3.3 | 1.3 | BAL |
| East room—2F | 3.0 | 1.5 | |
| Pre-Retrofit | Post-Retrofit | ||
|---|---|---|---|
| West room—GF | 34% | 100% | ER |
| East room—GF | 34% | 100% | |
| West room—1F | 34% | 57% | SS |
| East room—1F | 34% | 58% | |
| West room—2F | 34% | 51% | BAL |
| East room—2F | 34% | 52% | |
| Satisfaction Rate (%) | |||
|---|---|---|---|
| Pre Retrofit | Post Retrofit | ||
| User comfort | Thermal | ||
| Acoustic | |||
| Visual | |||
| Indoor air quality | |||
| Sustainable aspects | Thermal insulation | ||
| HVAC plants | |||
| Renewable energy sources | |||
| Technical aspects | Seismic safety | ||
| Evacuation plan | |||
| Fire safety | |||
| Social aspect | Space addition | ||
| Urban district advantages | |||
| Aesthetic aspect | |||
| Architectural barriers | |||
Publisher’s Note: MDPI stays neutral with regard to jurisdictional claims in published maps and institutional affiliations. |
© 2022 by the authors. Licensee MDPI, Basel, Switzerland. This article is an open access article distributed under the terms and conditions of the Creative Commons Attribution (CC BY) license (https://creativecommons.org/licenses/by/4.0/).
Share and Cite
Mastellone, M.; Ruggiero, S.; Papadaki, D.; Barmparesos, N.; Fotopoulou, A.; Ferrante, A.; Assimakopoulos, M.N. Energy, Environmental Impact and Indoor Environmental Quality of Add-Ons in Buildings. Sustainability 2022, 14, 7605. https://doi.org/10.3390/su14137605
Mastellone M, Ruggiero S, Papadaki D, Barmparesos N, Fotopoulou A, Ferrante A, Assimakopoulos MN. Energy, Environmental Impact and Indoor Environmental Quality of Add-Ons in Buildings. Sustainability. 2022; 14(13):7605. https://doi.org/10.3390/su14137605
Chicago/Turabian StyleMastellone, Margherita, Silvia Ruggiero, Dimitra Papadaki, Nikolaos Barmparesos, Anastasia Fotopoulou, Annarita Ferrante, and Margarita Niki Assimakopoulos. 2022. "Energy, Environmental Impact and Indoor Environmental Quality of Add-Ons in Buildings" Sustainability 14, no. 13: 7605. https://doi.org/10.3390/su14137605