1. Introduction
Energy is consumed directly during building construction, use, and demolition while indirectly through producing and manufacturing of materials (embodied energy) used in building [
1]. The building industry accounts for 40% of the energy consumption and ~50% of the greenhouse gas emissions in Europe [
2,
3,
4,
5]. The exploitation of natural resources, particularly non-renewable resources, for construction purposes leads to millions of tons of construction and demolition waste (CDW) every year. Since most countries have no specific processing plan for these materials, they are sent to landfills instead of being reused and recycled in new construction [
6]. There is a high potential for reusing and recycling construction and demolition waste since most of its components have a high resource value. Furthermore, there is a reuse market for recycled aggregates derived from CDW in landscaping, road construction, cementitious mortars, and concrete [
7].
The concept of the circular economy is proposed to change current production and consumption patterns that put a significant burden on our planet and its environmental capacity. This requires not only closing loops by reusing ‘waste’ and resources but also slowing material loops by developing long-lasting reusable products [
8,
9]. While the concept of circular economy is the process of obtaining global momentum in politics, business, and academia, the knowledge and tools for bringing it into practice still largely need to be developed, especially for the building sector [
10,
11]. According to the IPCC [
12], buildings accounted for 32% of total global final energy use in 2010. Moreover, the building industry consumes 40% of the materials entering the global economy, while only an estimated 20–30% of these materials are recycled or reused at the end of a building’s life [
13,
14].
LCA is defined as a systematic analysis used to measure industrial processes and products and is accepted internationally as a tool to improve processes and services environmentally that can be applied to a wider field, including the building industry [
11,
15]. Within the last decade, research on LCA in the built environment increased considerably; nonetheless, quantitative information about the environmental impact of producing construction materials or the actual process of construction and demolition is limited [
16]. In a study, an LCA was performed in a building situated at Turin (Italy), and the demolition phase and its recycling potential were studied. The results demonstrated that building waste recycling is not only economically feasible and profitable but also sustainable from an energetic and environmental point of view [
17]
Other current research found that embodied energy accounts for a significant proportion of total life cycle energy [
18]. Nonetheless, Langston and Langston [
19] suggest that, while measuring operating energy is easy and less complicated, determining embodied energy is more complex and time-consuming. Furthermore, there is currently no generally accepted method available to compute embodied energy accurately and consistently, and as a result, wide variations in measurement figures are inevitable, owing to various factors [
20,
21]. Moreover, as stated by Walter Stahel [
22], the circular economy is a strategy that considers that everything generated is not dismissed in landfills, with an inevitable loss of value, but it is kept to serve new functions. A study conducted involving seven European nations reported that if the resources were used longer (circular economy), greenhouse-gas emissions could be reduced by more than 70%, also contributing to a workforce increase of 4% [
23].
Circularity and Energy Production in the Built Environment
In the EU, the amount of waste generated is approximately 2.5 billion tonnes, which accounts for approximately 5 tonnes per capita, each year. Some EU members such as the Netherlands, Germany, France, and Italy generate significant amounts of recyclable waste in the building sector, whereas other countries’ recycling share is lower. For the building sector to become more sustainable, it needs to comply with the ‘sustainable use of resources’ approach set by the European Building Products Regulations; stating that products’ environmental declarations should be used when assessing the sustainable use of resources and the environmental impact of building works [
24]. The specification of reusable building materials during the building design and construction phase is a major factor that determines the level of reusability of recoverable materials at the end-of-life of a building [
25,
26,
27]. The three main waste minimization strategies are collectively called the 3R’s: reduce, reuse, recycle [
28]. Construction waste causes significant damage since it accounts for about one-third of all refuse nationwide. Recycling construction materials can significantly reduce the environmental impact of the industry. The construction sector takes 50% of raw materials from nature and creates 50% of the total waste. Approximately 500–1000 kg/habitant are created annually in developed countries [
29]. CDW is mainly generated by the demolition of old buildings, remainders from new constructions, building repair and maintenance, manufacturing debris, and natural disasters [
30]. Energy generation via renewable energy systems (RES) in the built environment is a way towards cleaner and greener buildings. RES have major economic importance and further help mitigates carbon emissions to promote environmental quality [
31].
Besides having several advantages, there are some considerations and barriers that need to be resolved with RES. Barriers for the diffusion of RES as a reliable power supply are the main topic of many research work and efforts [
32]. Additionally, an overall assessment of their use in the built environment must consider their embodied energy from the construction phase of their primary materials. Although power generation using a photovoltaic (PV) system or wind energy system is free from greenhouse gas emissions and fossil fuel use, the energy and emissions involved in the manufacturing, transport, and disposal of its elements must be considered. The highest environmental impacts of solar technologies derive from the manufacturing processes of the solar cells due to the large amount of energy consumed and the use of toxic chemicals and scarce minerals [
33]. However, due to the advent of energy-efficient equipment and appliances, along with more advanced and effective insulation materials, the potential for curbing operating energy has increased, and as a result, the current emphasis has shifted to include embodied energy in building materials [
34,
35].
In a work conducted by Bonoli et al. in 2021, the sustainability in building and construction and the contribution of concrete recycling is investigated and reviewed. It summarizes that a more effective circular economy approach is mandatory, allowing waste to be reprocessed or remanufactured. This will extend the life cycle of the material, reducing the CDW. The review also states that recycling can be an efficient strategy for reducing the environmental impacts of the building industry [
36]. In another research work, the potential energy savings obtained from recycling 1 tonne of CDW in Naples was assessed with the use of LCA software. The results underline that recycling is preferred over landfilling and that the transition to a circular economy offers many opportunities for improving the energy and environmental performance of the construction sector. Recycling strategies using input from other sectors (agri-food by-products) can also be incorporated in the manufacturing of construction materials [
37].
Several studies recommend that research and development should focus on the existence of a more circular supply chain that will extend the life cycle of each product and its life, with circularity being the way to mitigate environmental degradation related to resources [
38,
39]. Although there are several studies that investigate the LCA of either construction materials or RES, to the best of our knowledge, there is no research available for circular renovation processes in the construction phase of a building, combined with the environmental assessment of the use of RES, considering both their embodied as well as their operating energy. For this purpose, in this research work, the authors investigated the environmental performance of different end-use scenarios of CDW under the aspects of circular renovation processes in the built environment, as well as the investigation of the most energy-efficient RES in terms of embodied and operating energy.
2. Materials and Methods
Like many cosmopolitan cities, the Attica region is inhabited by around 40% of the total Greek population. Most residents live in buildings constructed before 1990 with low energy performance factors such as high energy consumption levels, insufficient ventilation, uneven indoor temperatures, and insufficient thermal comfort levels. The case study of this paper was carefully selected to represent a typical apartment encountered in city centers. It is a residential apartment of 108.3 m2, located in the center of Athens. The apartment is located on the 1st (last) floor of a building built in 1971. The building shape ratio, also known as the surface area to volume ratio, is 0.68 m2/m3, and the window–wall ratio is 14.9%.
The purpose of this study is to assess the environmental impact of using conventional building materials (case study) versus recycled materials for the construction of hypothetical newly constructed buildings. Two end-life scenarios were assumed for the disposal method. In the first one, all the waste is sent to the sanitary landfill, while in the second one, most of the waste materials were recycled, and the rest of them were sent to the landfill. In the second part of this research work, a wind turbine system and a PV were assumed to be operating in the case study building. The goal was to compare the complete life cycles of a 2.65 kWp PV module (which will ideally give an output of 2.65 kW) and a typical size domestic wind turbine of 1.5 kW. Within these life cycles, their energy production was also considered to assess their overall environmental performance in the built environment. The decision of the size of the RES was based on available domestic systems and energy simulation results, based on expected energy savings of 70%. The environmental performance of all the scenarios was examined by means of the LCA methodology set in ISO 14040:2006 and ISO 14044:2006.
For the environmental performance assessment, the software program SimaPro was employed. Results were provided via a robust multi-issue life cycle impact assessment method, i.e., ReCiPe. Results were expressed both at (i) midpoint level and (ii) endpoint level. The midpoint level represents a problem-oriented approach where environmental impacts are examined earlier in the cause–effect chain and, as such, are translated into environmental themes. The endpoint level represents a damage-oriented approach where impacts are examined at the end of the cause–effect chain, after the midpoint is reached, thus translating environmental impacts into issues of concern. Due to some data gaps and assumptions along the cause–effect chain, the endpoint approach has a higher level of statistical uncertainty; nonetheless, it is easier to comprehend by policy and decision-makers as well as the public.
ReCiPe comprises 17 midpoint impact categories, i.e., climate change (for humans and ecosystem), ozone depletion, human toxicity, photochemical oxidant formation, particulate matter formation, ionizing radiation, terrestrial acidification, freshwater eutrophication, terrestrial freshwater and marine ecotoxicity, agricultural and urban land occupation, natural land transformation, metal depletion, and fossil fuel depletion. All categories are expressed in kilopoints (kPt) or points (Pt), which is the total environmental load expressed as a single score, based on their environmental impact. At the endpoint level, most of the abovementioned midpoint impact categories are further converted into three categories, i.e., damage to human health, damage to ecosystem diversity, and damage to resource availability [
5]. The Hierarchist perspective (H), which is ReCiPe‘s default model, using European normalization was applied to express results both at midpoint and endpoint level. According to the H perspective, the environmental impacts can be avoided with proper management, while what is included/excluded in the model is based on a mean scientific consensus, fitting best the goal and scope of this study.
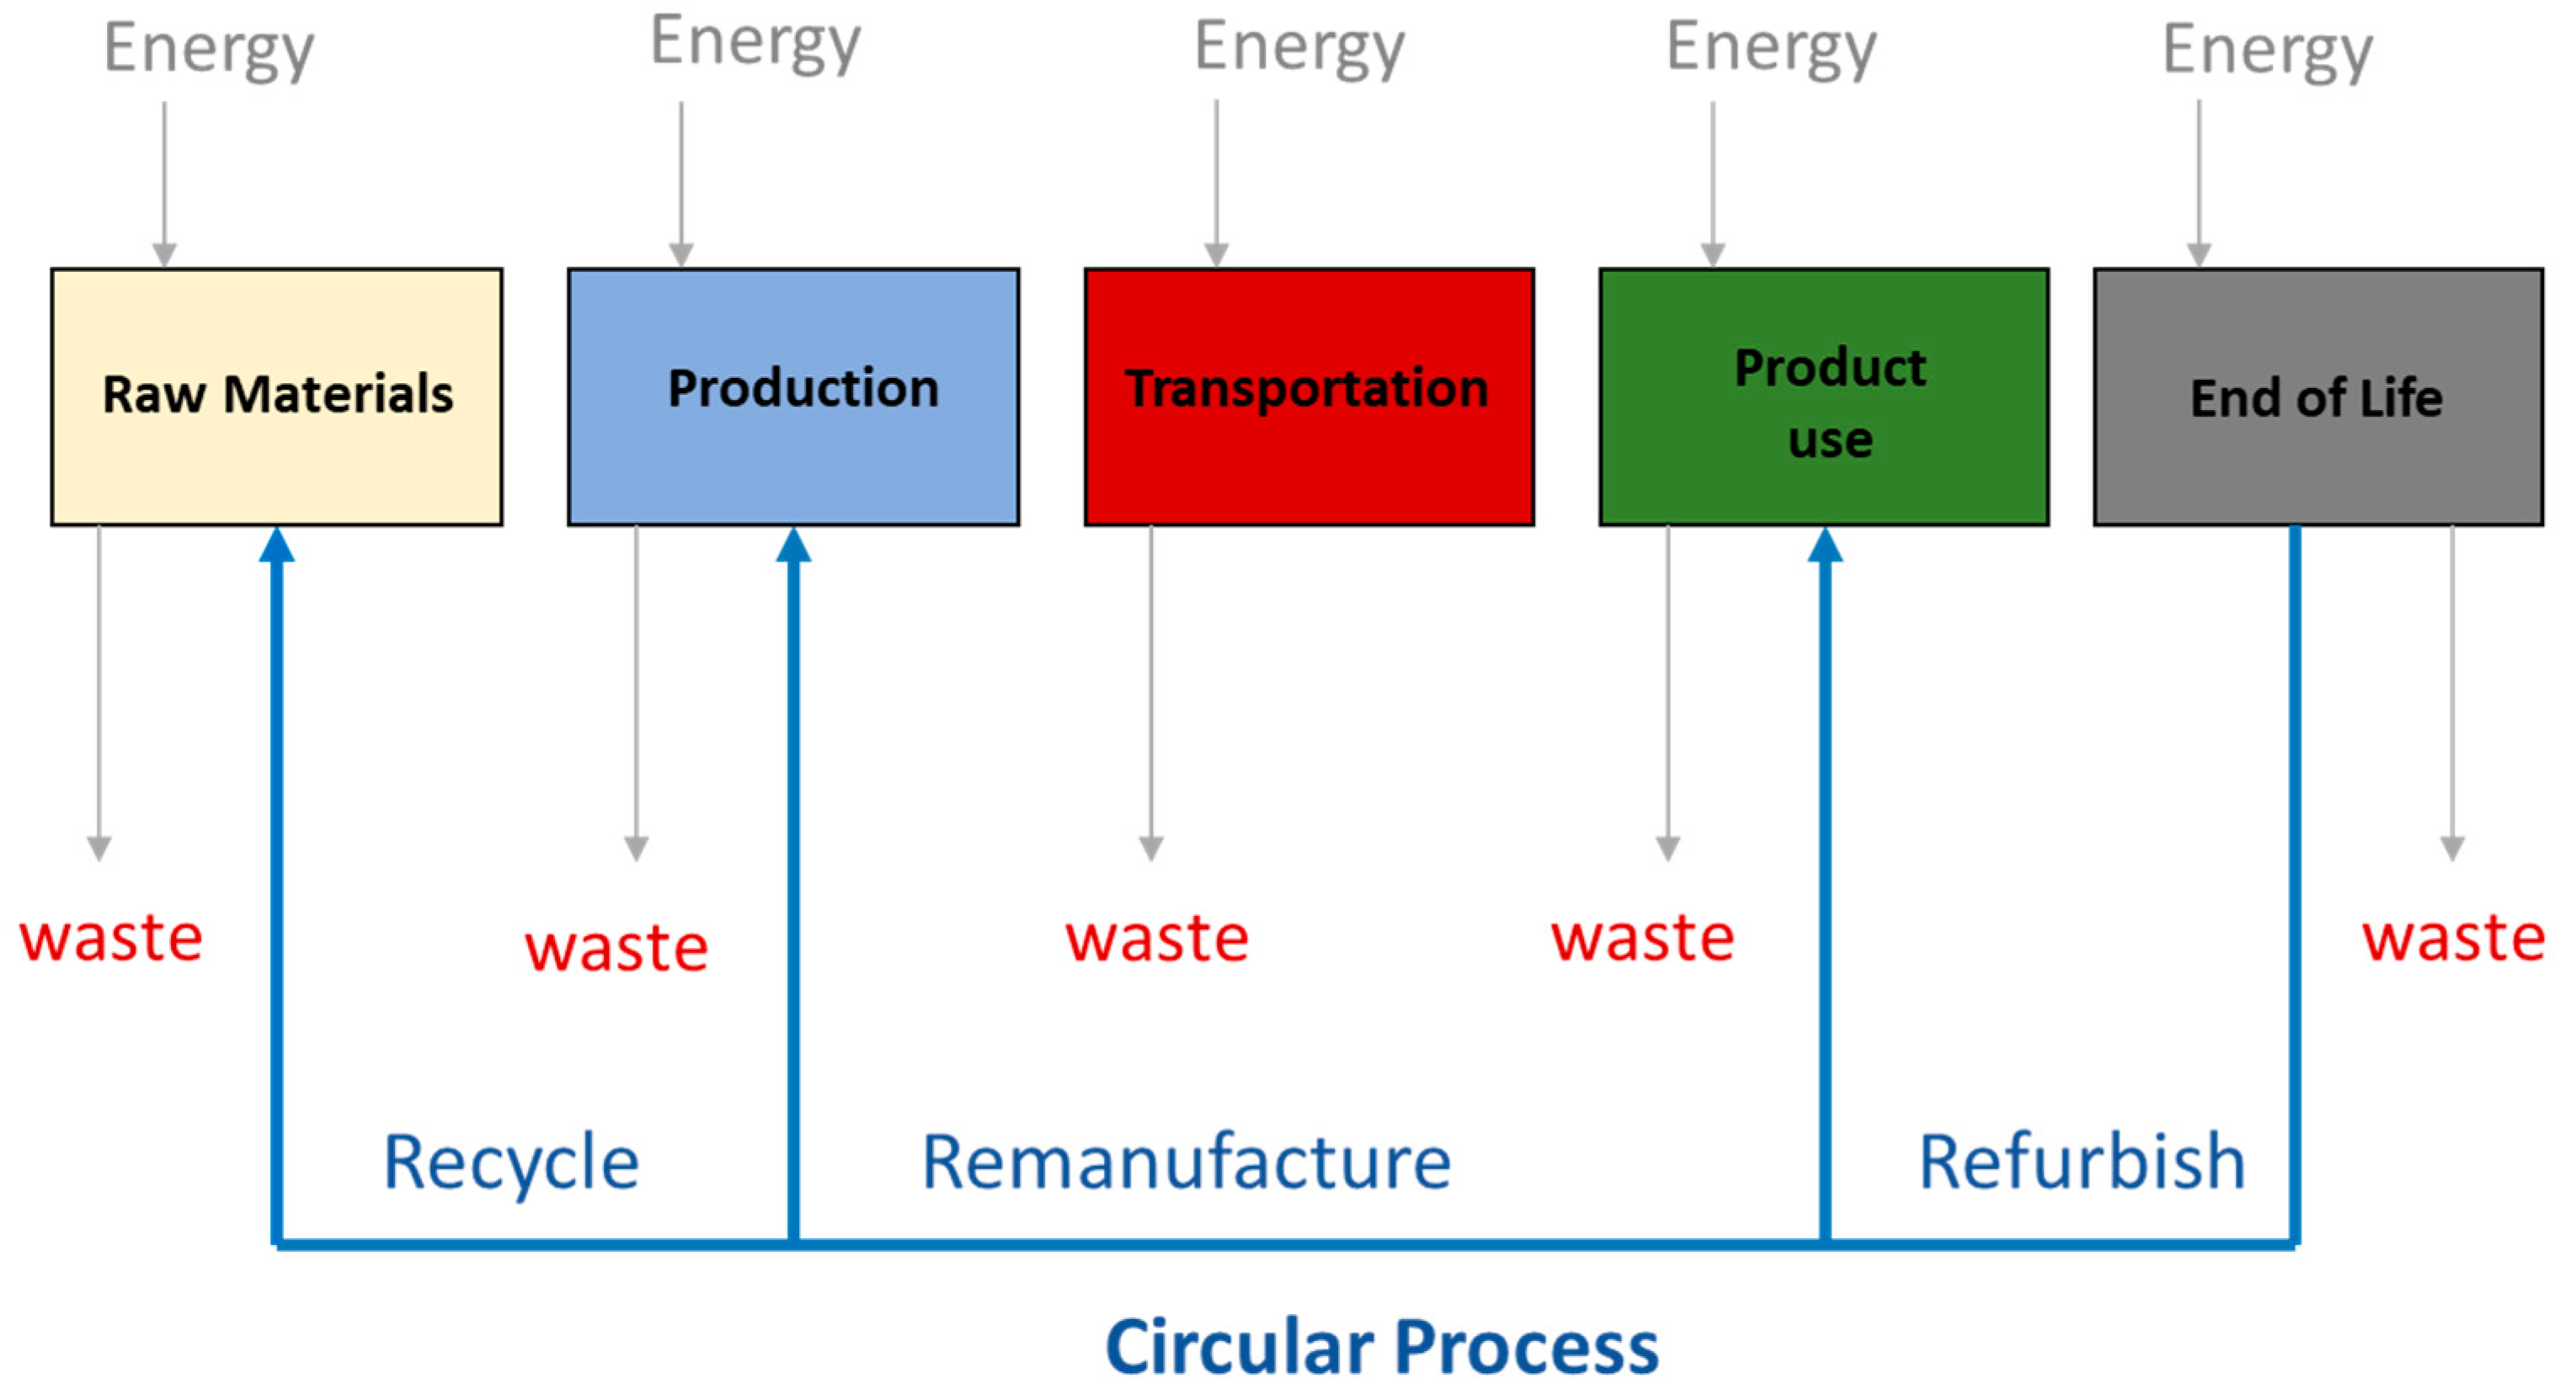
All main inputs for the construction and operation (for a timeframe of 25 years) of a house (conventional or circular) are included in the life cycle inventory (LCI) boundaries. Furthermore, the emissions generated from the disposal, typically as inert waste, of the non-recyclable materials after the end of their lifespan, as well as the avoided emissions from the recycling of the materials, together with the energy used in every stage, are included in the analysis. Recycling is also inside the system boundaries since it is a very effective way to reduce the embodied energy of a building. Cradle to grave is the most popular system boundary adopted in buildings and renewable systems LCA. Thus, these are the system boundaries and steps followed in the research and are presented in
Scheme 1: (1) raw materials’ extraction, (2) production, (3) transportation, (4) product use (and operation only for PV and wind turbine systems), and (5) end of life, either landfill disposal or recycling.
3. Results
3.1. Life Cycle Inventory
The LCI analysis phase is related to the calculations and collection of data [
34]. In
Table 1, all LCIs of the conducted research are provided. Regarding the RES, the dataset used represents the construction of a typical sized domestic wind turbine with a capacity of 1.5 kW. The wind turbine includes moving parts such as nacelle, rotor, rotor blades, and transition pieces, as well as fixed parts such as the tower and the foundation. The materials of each part and the specifications of the wind turbine are based on the model available from the company SkyWolf Wind Turbines Corporation located in Geneseo, NY, in combination with data available in SimaPro software. The LCI model is based on collected data from the Wind Energy Technocentre in Quebec that estimated the bill of materials in the different parts of the turbine. The parts of the wind turbine are the following: (i) Rotor: rotor blades, rotor hub, extender; (ii) Nacelle: the nacelle consists of the nacelle cover, which includes the generator, gear, main shaft, yaw system, flanges, etc.; (iii) Electronics; and (iv) The tower. The included activities of the model start from the transformation of pastureland to an industrial site and the reception and treatment of building materials and turbine parts, and end with the decommissioning of the wind turbine and the treatment of the resulting materials at the end of the lifetime. The dataset also includes: (i) all materials for the construction of the wind turbine and their treatment, but not the energy required for their assembling; (ii) land transformation and use; and (iii) energy needed for the erection and dismantling of the wind turbine. On the other hand, the dataset does not include: (i) the connection to the grid; (ii) the operation and maintenance of the fully finished wind power plant; (iii) auxiliary materials such as packaging materials or vacuum fleece; (iv) any losses of materials (waste) during the processing of the different wind turbine parts; and (v) neither the energy use for assembly of the different wind turbine parts nor their transportation from manufacture to the construction site. Additional to energy requirements for material processing, a factor of 0.5 kWh/kg material is included. This should also cover the energy required for mounting and the removal of the turbine. The total wind turbine weight is about 1150 kg.
The dataset used in the research regarding the PV installation, with a capacity of 2.68 kWp and a lifetime of 30 years, is based in the SimaPro software database. Adjustments are made for the provided model from SimaPro to meet the specifications of the PVs needed in this study. The installation consists of the following infrastructure parts: (i) panel: single-Si (sc-Si); (ii) mounted slanted-roof mounting structure; (iii) inverse rectifier; and (iv) electric installation. The lifetime of the inverter is assumed to be 15 years, after which replacement is expected to take place. The inverter has a capacity of 2.5 kW, modules with crystalline silicon cells, with a cell efficiency value equal to 17.26% and a panel efficiency of 15.3%. For the PV panels, 2% replacement of damaged modules during the lifetime plus further production loss during handling of 1% is assumed. Lastly, all inputs for the LCI of the case study are either from existing LCI databases or in their absence, are built based on data obtained from construction engineers involved with the onsite investigation; a 25-year lifespan is assumed as the end of life of the materials. The amount of the materials used for the house is listed in
Table 1, where the percentage of the assumed recyclability is also presented.
3.2. LCA in Circular Building Materials
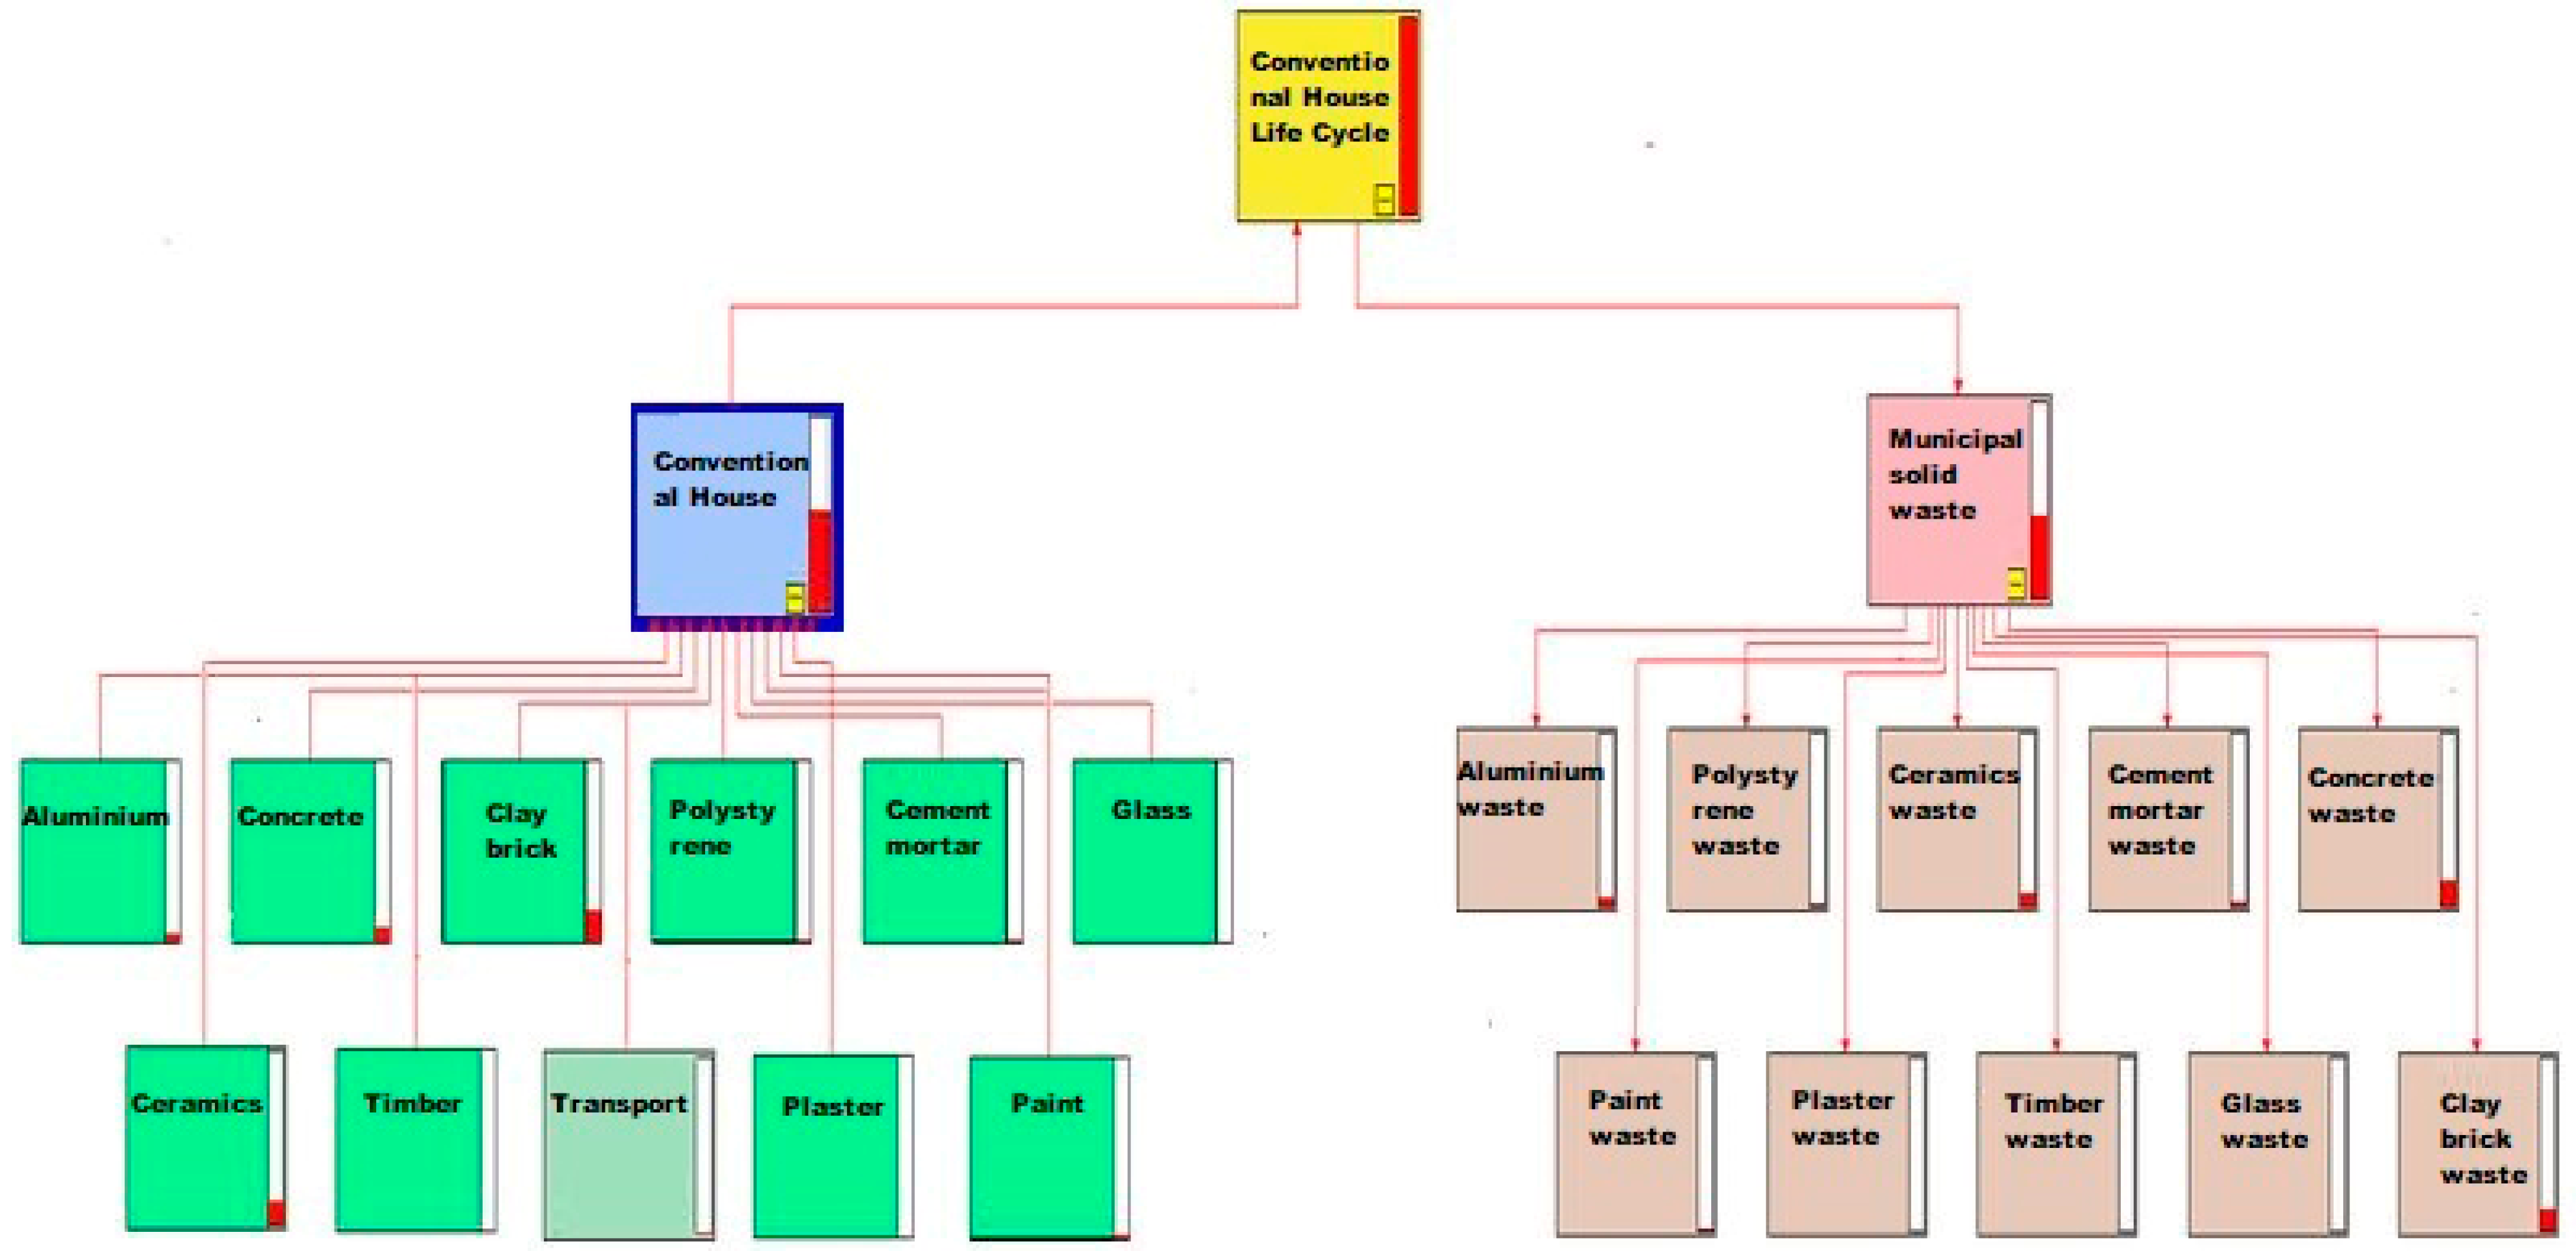
In this step, the environmental impacts of the materials used for the construction and demolition of the case study house are estimated. A ‘cradle to grave’ approach was used, including the extraction, transformation, transport, assembly, disassembly, and end of life of the materials. Two scenarios were used for the construction phase. A conventional, which refers to a building built according to the common practice of a specific country and a circular, where a part of the materials used for the construction of the house is recycled. Moreover, two scenarios were also used for the end-of-life scenario. In the landfill scenario, all the materials are transported to the landfill. In the recycling scenario, a high percentage (see
Table 1) of materials are recycled while the rest are sent to the landfill. Overall, four scenarios were studied, the conventional landfill: conventional materials that end up in landfill; the conventional recycle: conventional materials that a part of the materials are recycled; the circular landfill: circular (already recycled) materials that end up in landfill; and the circular recycle: circular (already recycled) materials that a part of the materials are recycled.
The process tree of the model is presented in
Scheme 2, where the materials’ production and waste stage (including raw materials’ impact, energy used, and transportation) concerning the conventional materials used in constructions are presented.
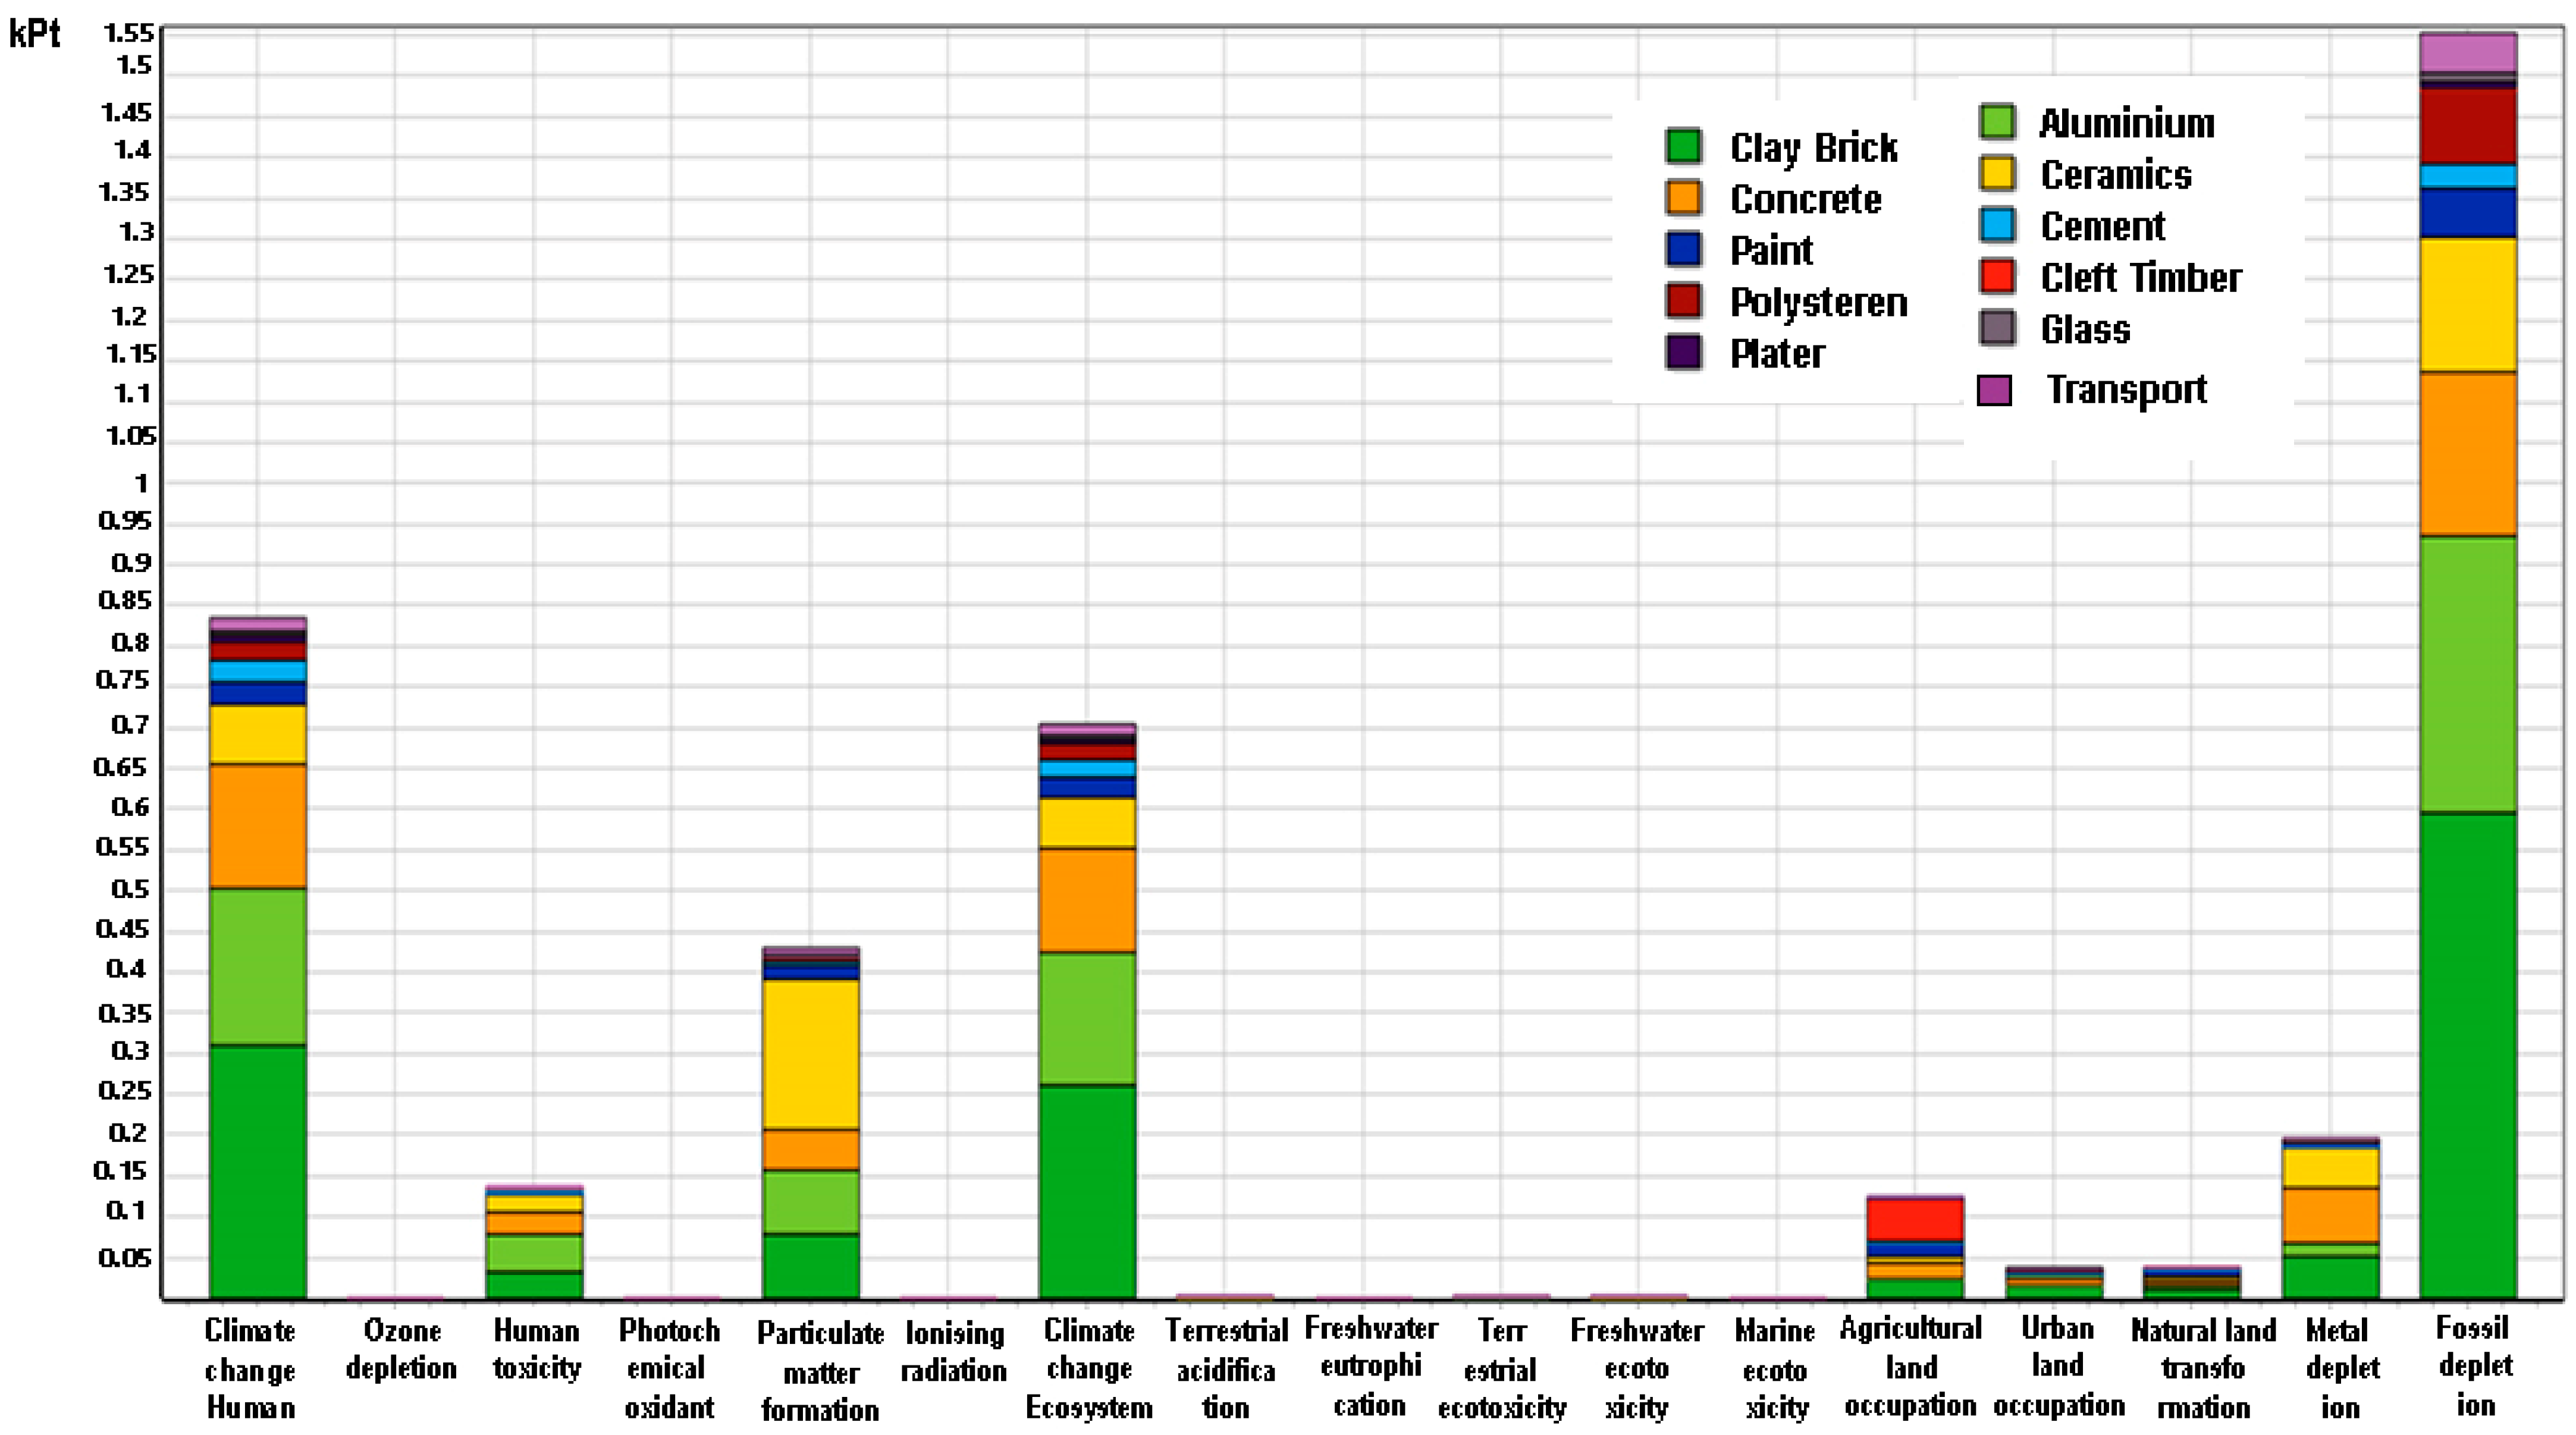
The environmental performance per impact category at the midpoint level is presented in
Figure 1. The impact categories with the highest contribution are fossil depletion, climate change (both human health and ecosystem), and particulate matter formation. The extraction and transformation of conventional building materials is a process that requires huge amounts of energy. Materials such as clay brick, aluminium, concrete, and ceramics are found to be the ones with the highest impact due to their mass or energy intensity. Moreover, materials such as paint, plaster, and polystyrene, even though they have by far the smallest mass, their production is energy-intensive and involves highly poisonous and environmentally toxic chemicals. Thus, they have a significant share in the impact on the environment due to their high contribution to climate change, particular matter formation, and fossil depletion. The most common fuels used in these procedures are crude oil and natural gas, resulting in a high impact on fossil depletion.
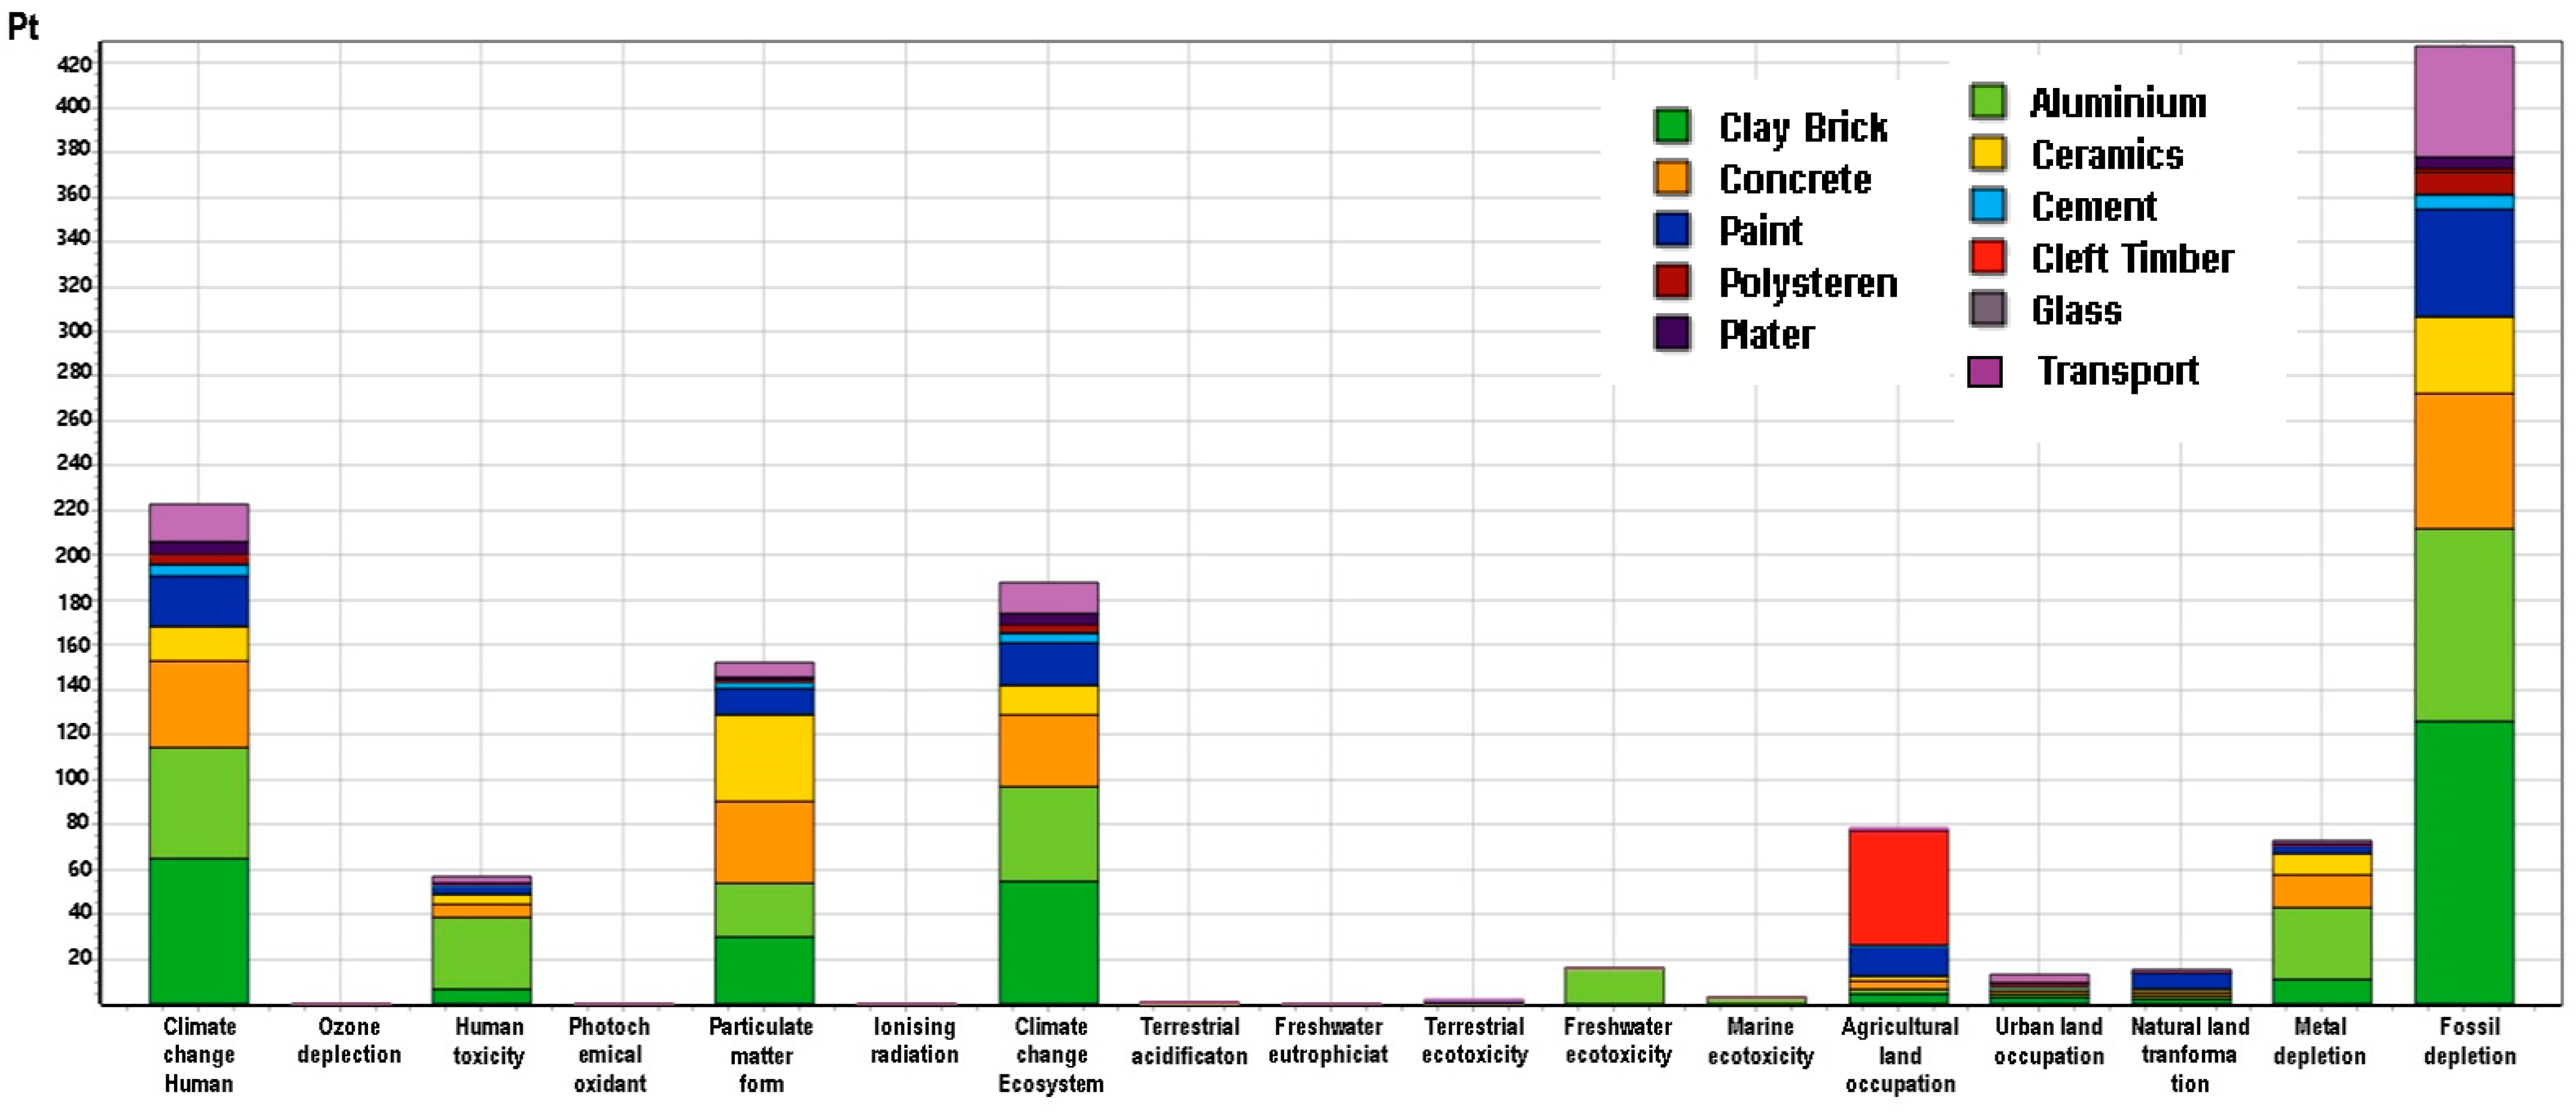
Having addressed the extent of the damage to the environment from the usage of conventional materials, it is essential for a circular house construction scenario to be investigated. As mentioned above, a percentage of the materials is assumed to be recycled while the rest is produced by conventional methods. Therefore, for the assessment of circular materials (already recycled and reused) that can be used in the future in construction, the environmental performance per impact category is presented in
Figure 2.
Using circular, recycled materials instead of conventional building materials results in a significant reduction in all impact categories and especially in the categories in which clay brick, aluminium, concrete, and ceramics have the highest contribution, as they are the materials with the highest energy intensity. The highest impact categories in this step remain fossil depletion, climate change (both human health and ecosystem), and particulate matter formation. This can be explained since initially, the materials used in the construction of the circular house were not 100% recycled. This means a part of the materials were produced with conventional production methods, which are energy-intensive. Secondly, the recycling procedure is not emission-free, demanding energy for its processes. In this next step, the environmental impacts of the four scenarios described above (conventional landfill, conventional recycle, circular landfill, circular recycle) are presented.
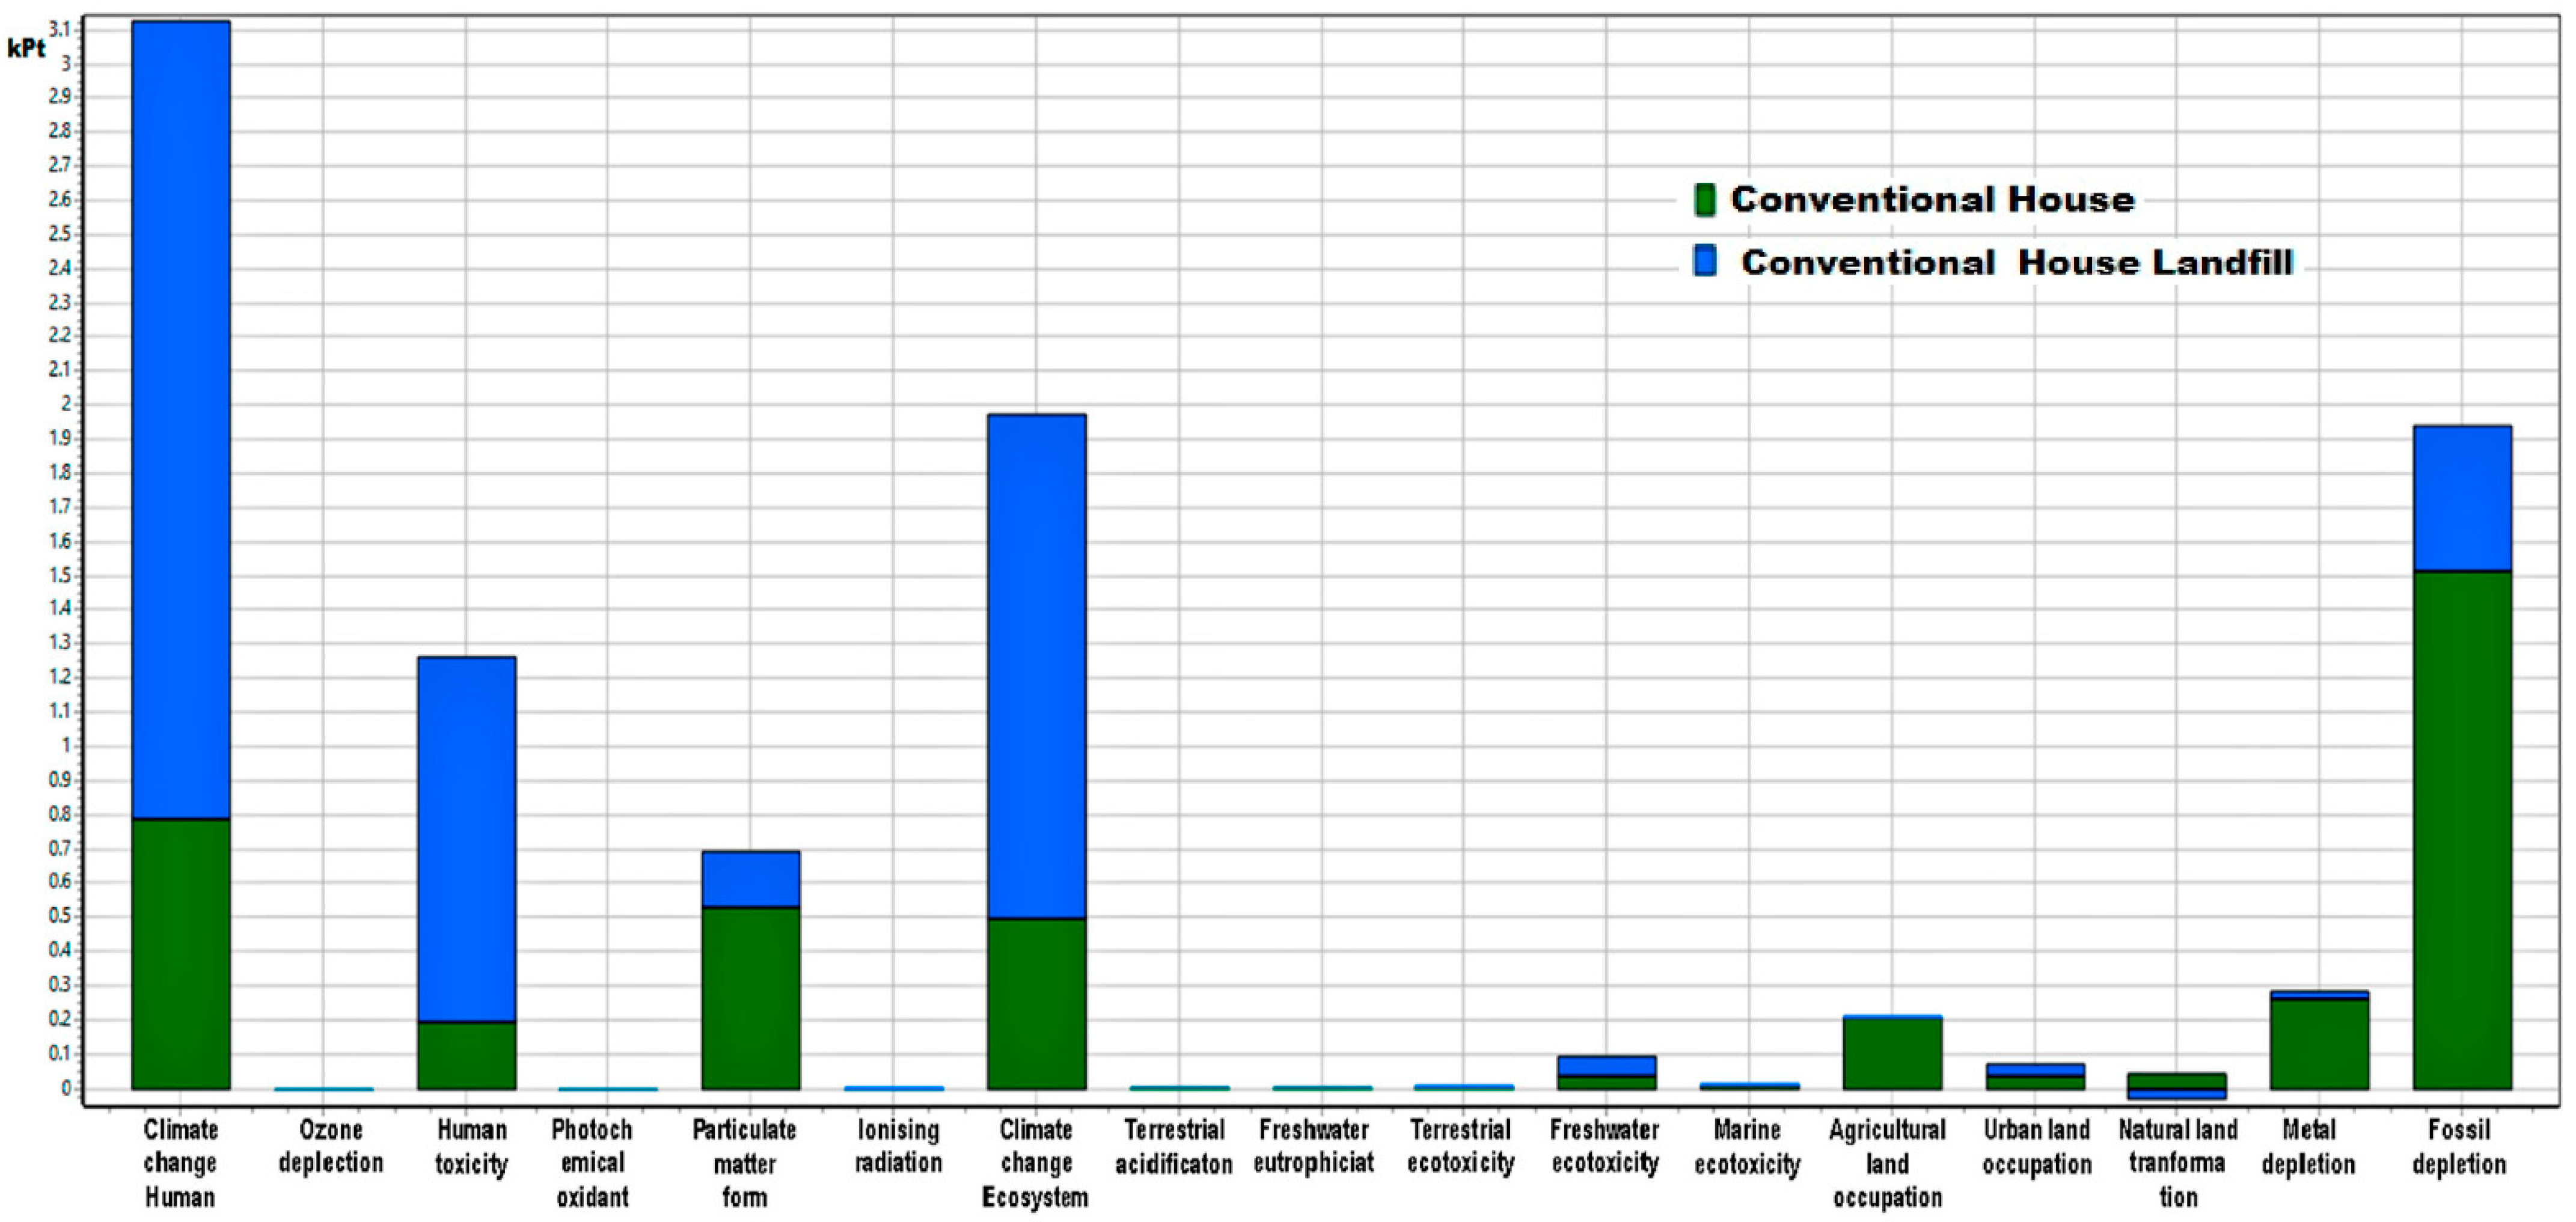
3.2.1. Conventional Building Materials—Landfill Scenario
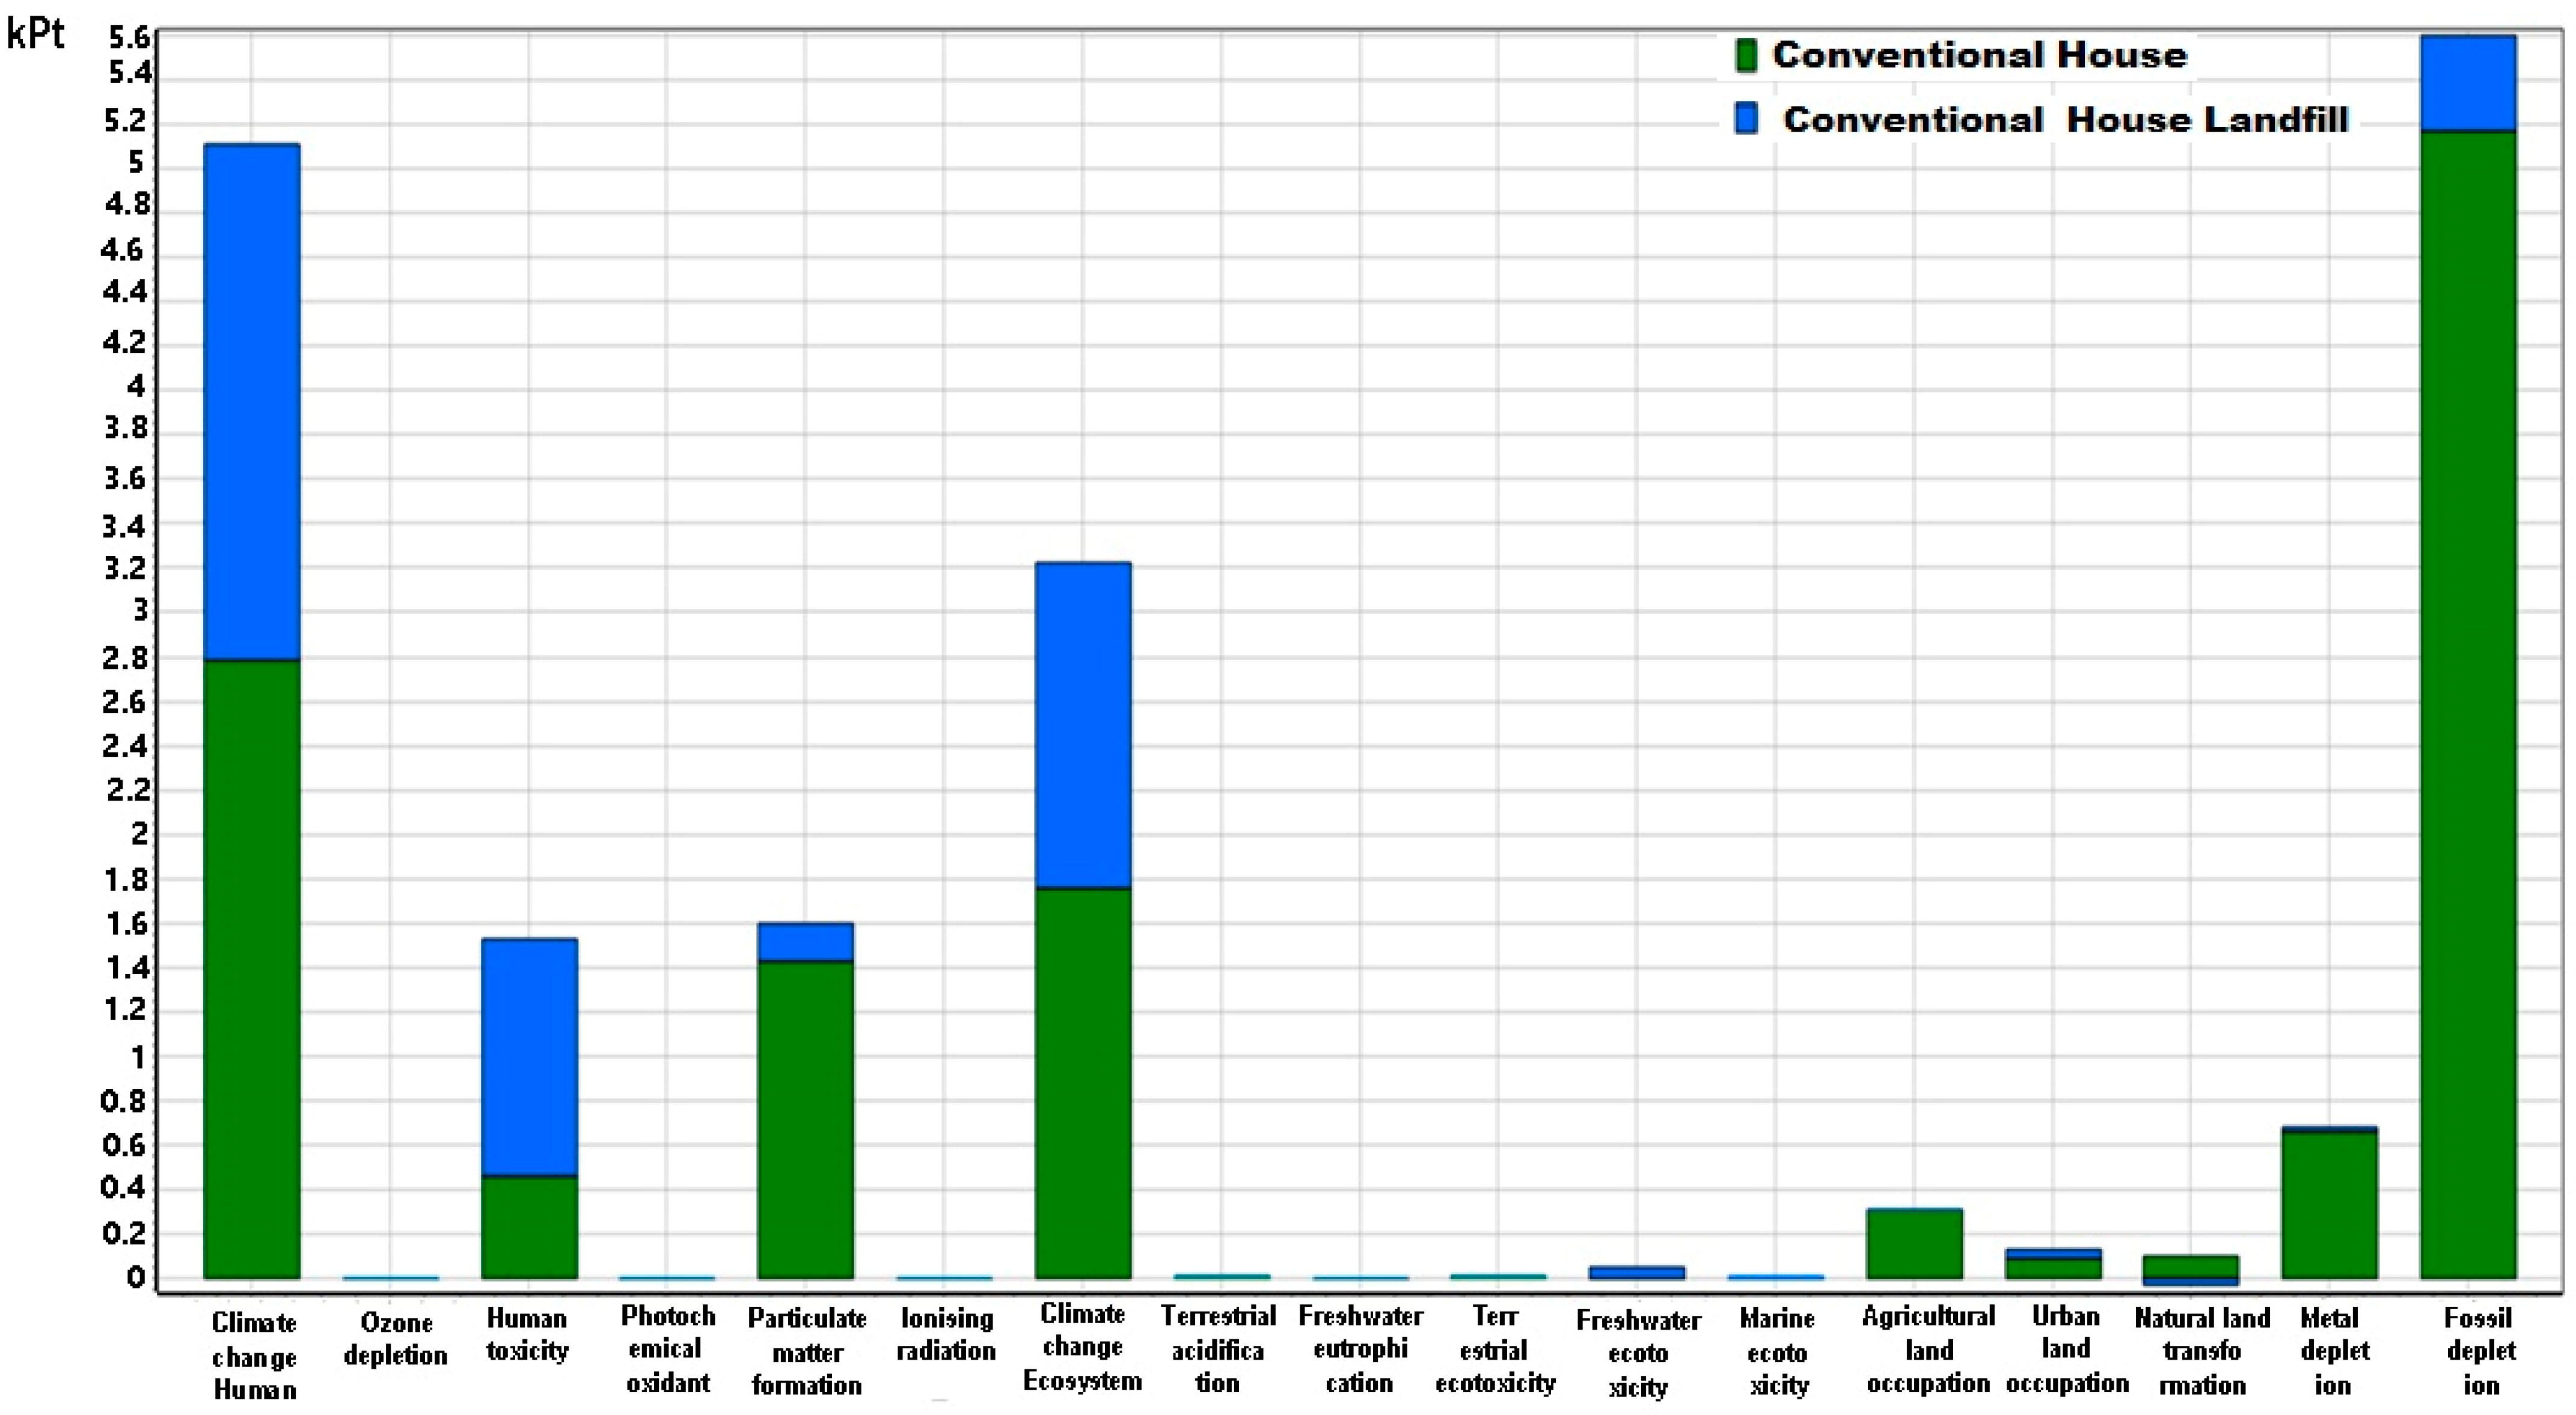
In
Figure 3, the performance of materials produced with conventional methods and after demolition, all waste is sent to the landfill are being presented (conventional landfill). The environmental impacts of the construction phase are depicted with green color and are compared with the environmental impacts of the end-of-life scenario, depicted with blue color, for the endpoint categories.
The impacts of house construction (green color) are significantly higher than the landfill phase. This is expected since conventional materials require a large amount of energy for their production [
34]. In particular, energy derives based on each country’s energy mix. For the current case study, the energy mix is based on fossil fuels. Fossil fuels, as mentioned above, when used as an energy source apart from fossil depletion, contribute greatly to the impact categories of climate change and particulate matter formation. Metal depletion is expected to be on a low level since metal materials were not used to a great extent. This figure provides information on the fact that the highest environmental contributor that causes the biggest damage is the energy used to fabricate the materials of the system. Moreover, high climate change and human toxicity account for the end-of-life scenario due to the degrading of waste that releases toxic chemicals and pollutants into the atmosphere or leaches into groundwater and rivers.
3.2.2. Conventional Building Materials—Recycle Scenario
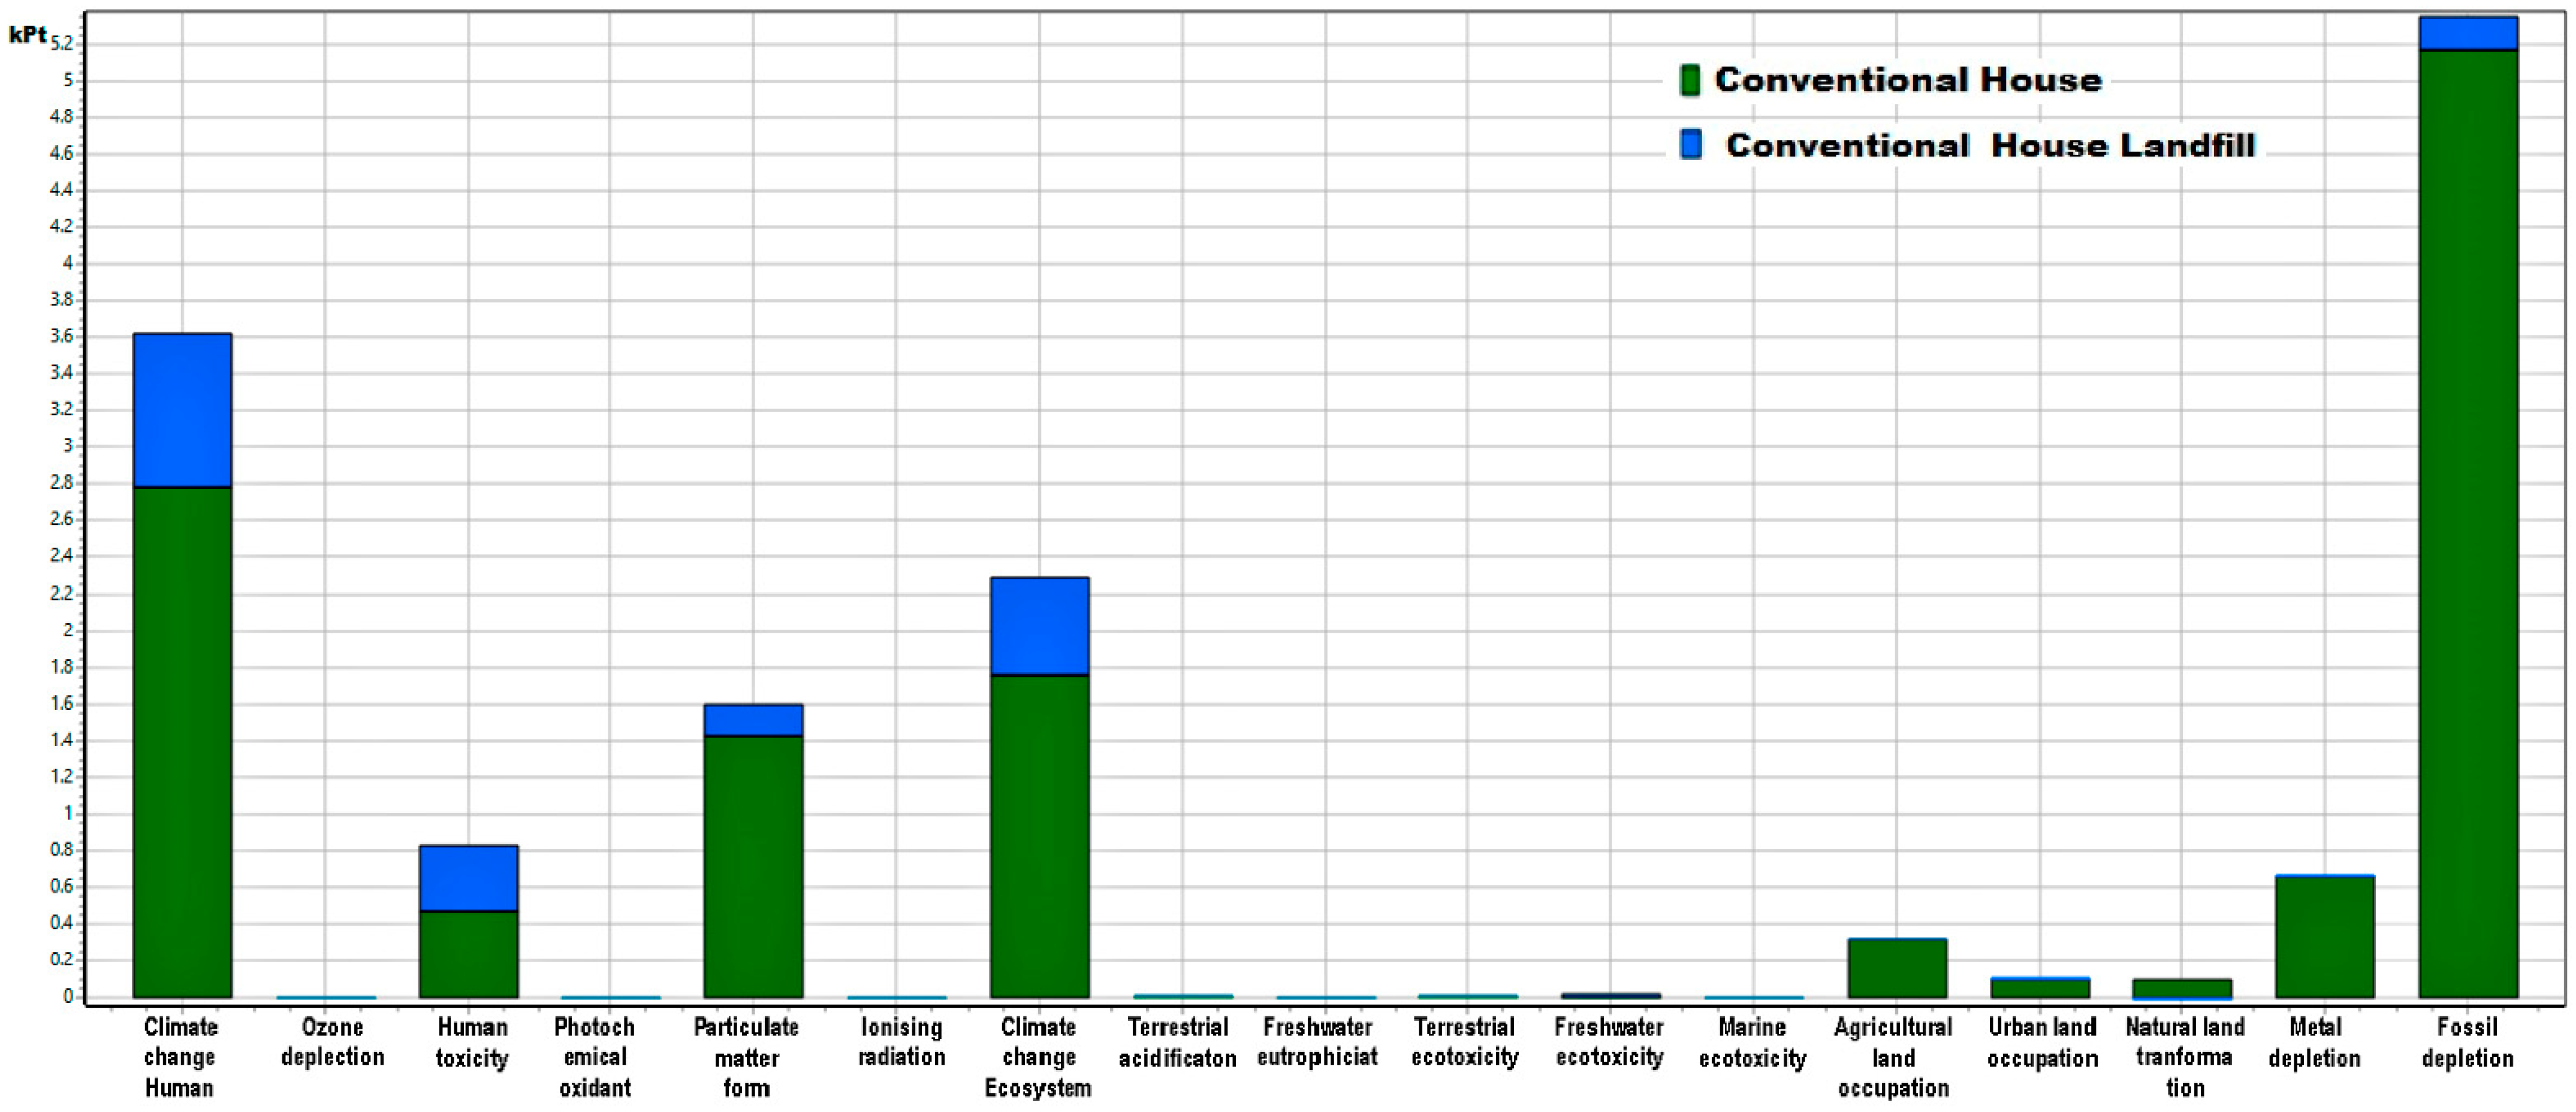
For this scenario, conventional materials will still be used for the production phase. After the demolition, it is assumed that a large percentage of the waste materials are sent to recycling processes, while the rest are sent to landfills. In
Figure 4, the environmental impact of the construction phase (depicted with green color) is compared with the environmental impacts of the end-of-life scenario (depicted with blue color) for the endpoint categories.
It is observed that the environmental impacts of the construction phase (green color) are significantly higher than the impacts in the disposal phase (blue color). Moreover, a decrease in the impacts of the disposal phase when compared to
Figure 3 is also obvious. This is reasonable since fewer wastes are sent to the landfill. Furthermore, lower impacts are observed in the categories of climate change, particulate matter formation, and human toxicity during the disposal phase due to the decrease of the overall waste disposed to landfills, which would release fewer toxic chemicals and pollutants into the atmosphere and leaches into groundwater and rivers.
3.2.3. Circular Building Materials—Landfill Scenario
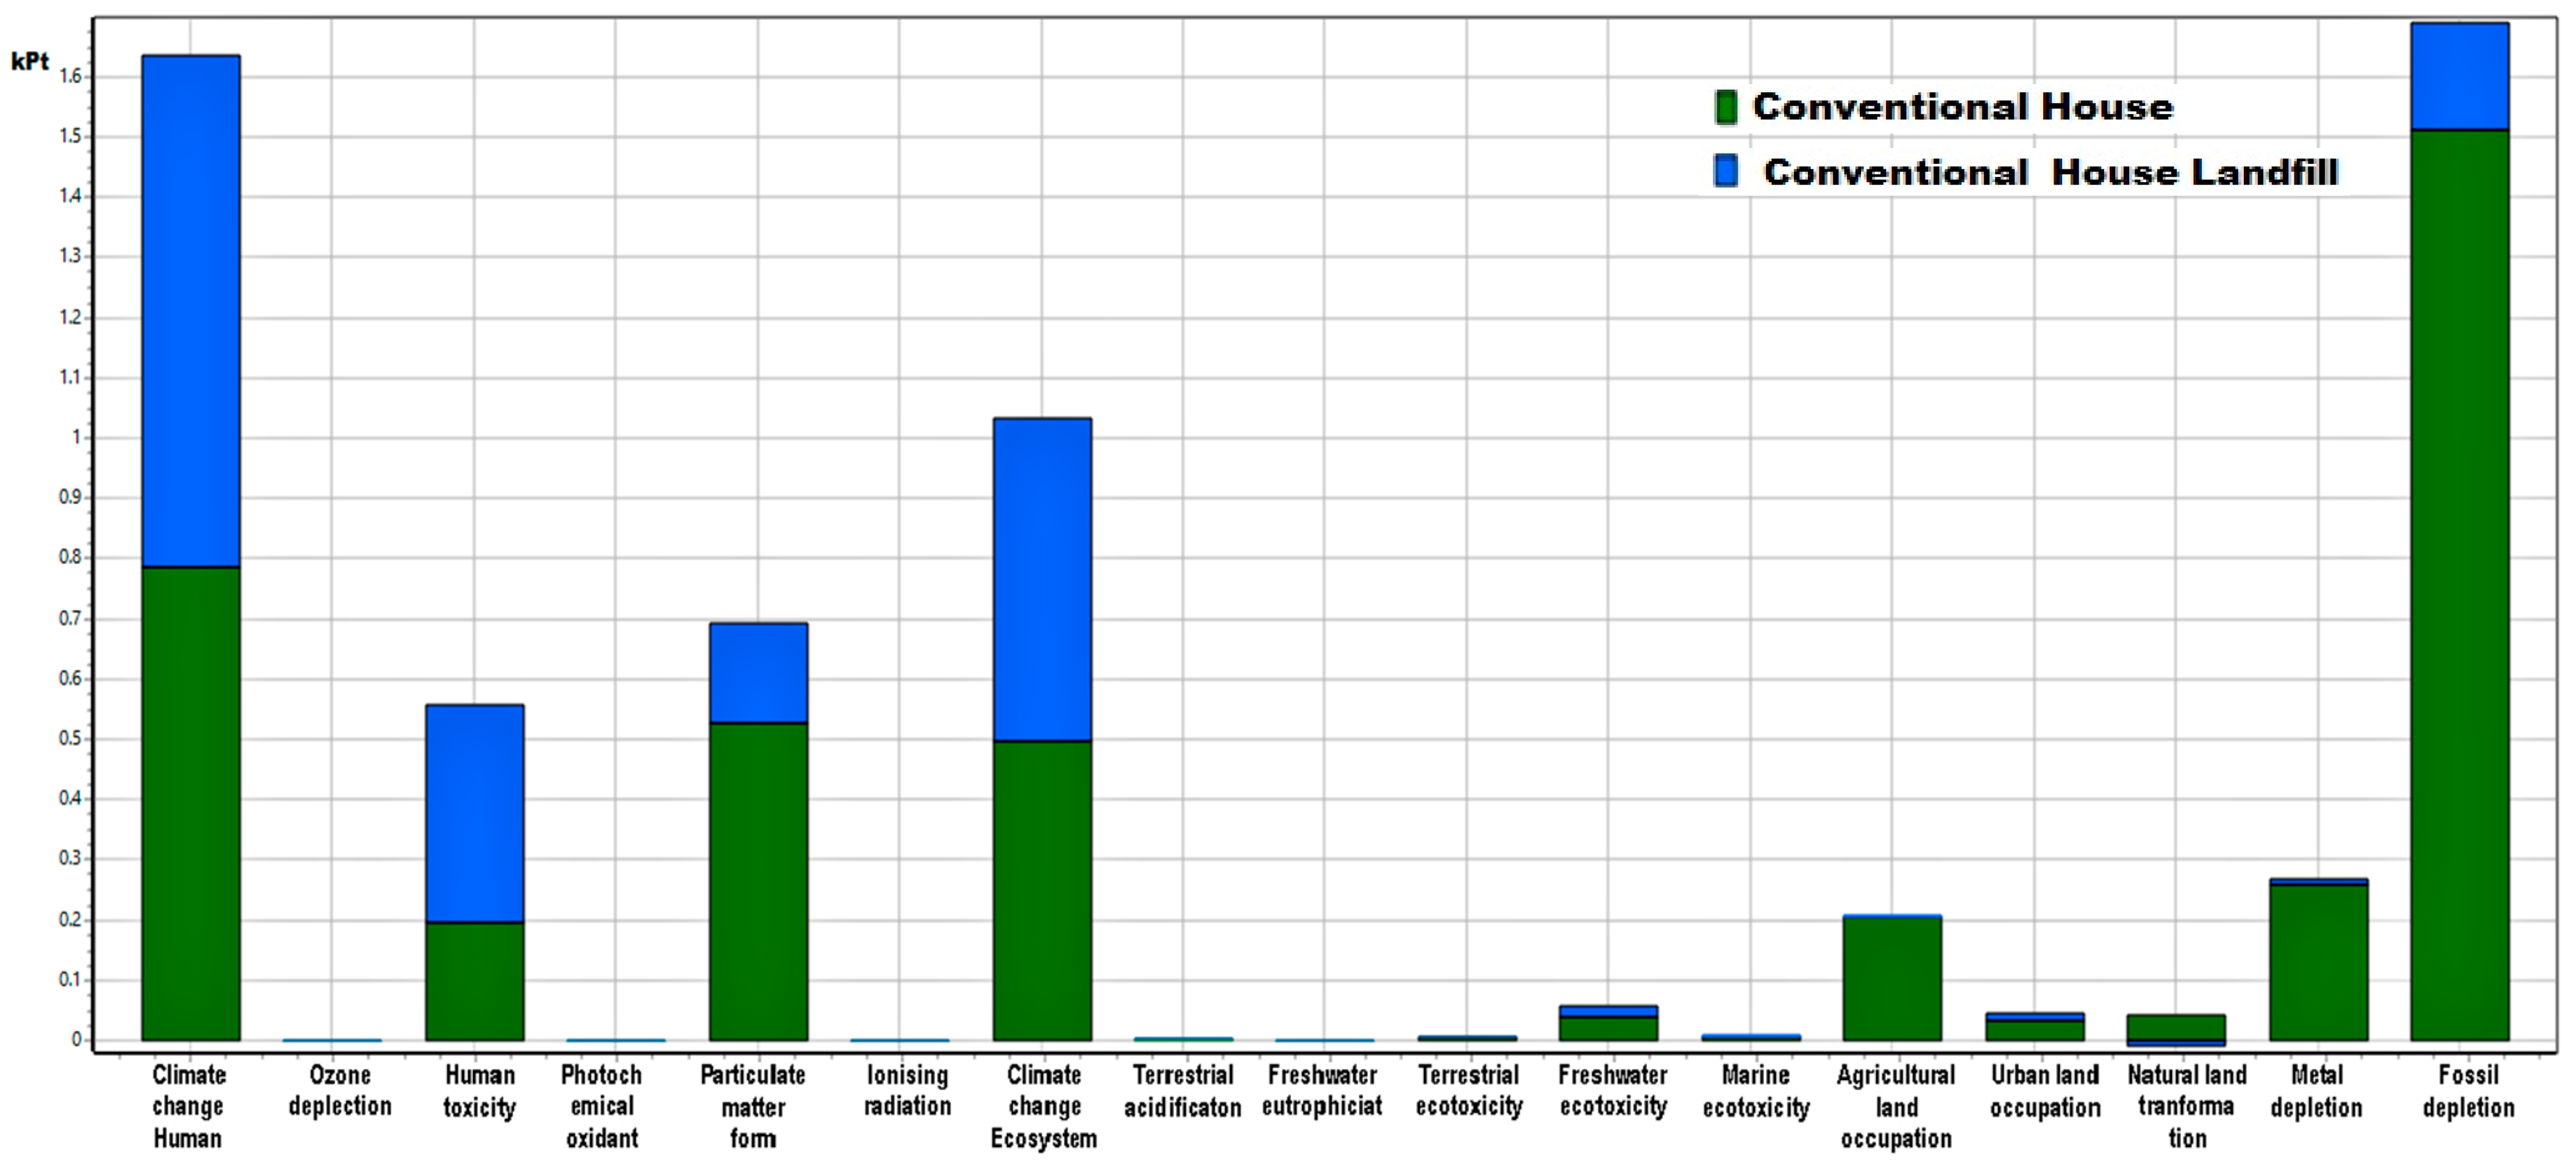
Recycled materials were reused for the hypothetical construction of the house in this scenario, while the end-of-life scenario is disposal to landfill. In
Figure 5, the environmental impacts of the construction phase (green color) are compared with the environmental impacts of the disposal phase (blue color) for the endpoint categories.
A major reduction in the fossil depletion impact for the construction phase of the house is noted. This can be explained since recycled materials only need 30% of the energy for their transformation and production in comparison to conventional materials [
35]. Less use of fossil fuels also results in less impact on climate change, human toxicity, and particulate matter formation. Metal depletion is expected to be at a low level since metal materials were not used to a great extent. Thus, the landfill disposal phase appears to have higher negative impacts than the construction phase of the building in this scenario. Since all the materials end up in landfills, high climate change and human toxicity are facilitated due to the waste material that releases toxic chemicals and pollutants into the atmosphere or leaches into groundwater and rivers.
3.2.4. Circular Building Materials—Recycle Scenario
Finally, it was assumed that the materials used for the construction phase of the building were recycled and reused as described in the previous scenario. However, in this scenario, the disposal phase consists of materials that will end up for further recycling and reuse. In
Figure 6, the environmental impacts of the construction phase (green color) are compared with the environmental impacts of the end-of-life scenario (blue color) for the endpoint categories.
Figure 6 show clearly that this scenario represents the lowest environmental impacts per category since it combines both the construction as well as the disposal phase with the smallest environmental impacts. Relatively increased environmental damage on the categories of fossil fuel, climate change, human toxicity, and particulate matter formation is still being observed. However, the total impact score is reduced greatly compared to the conventional landfill scenario.
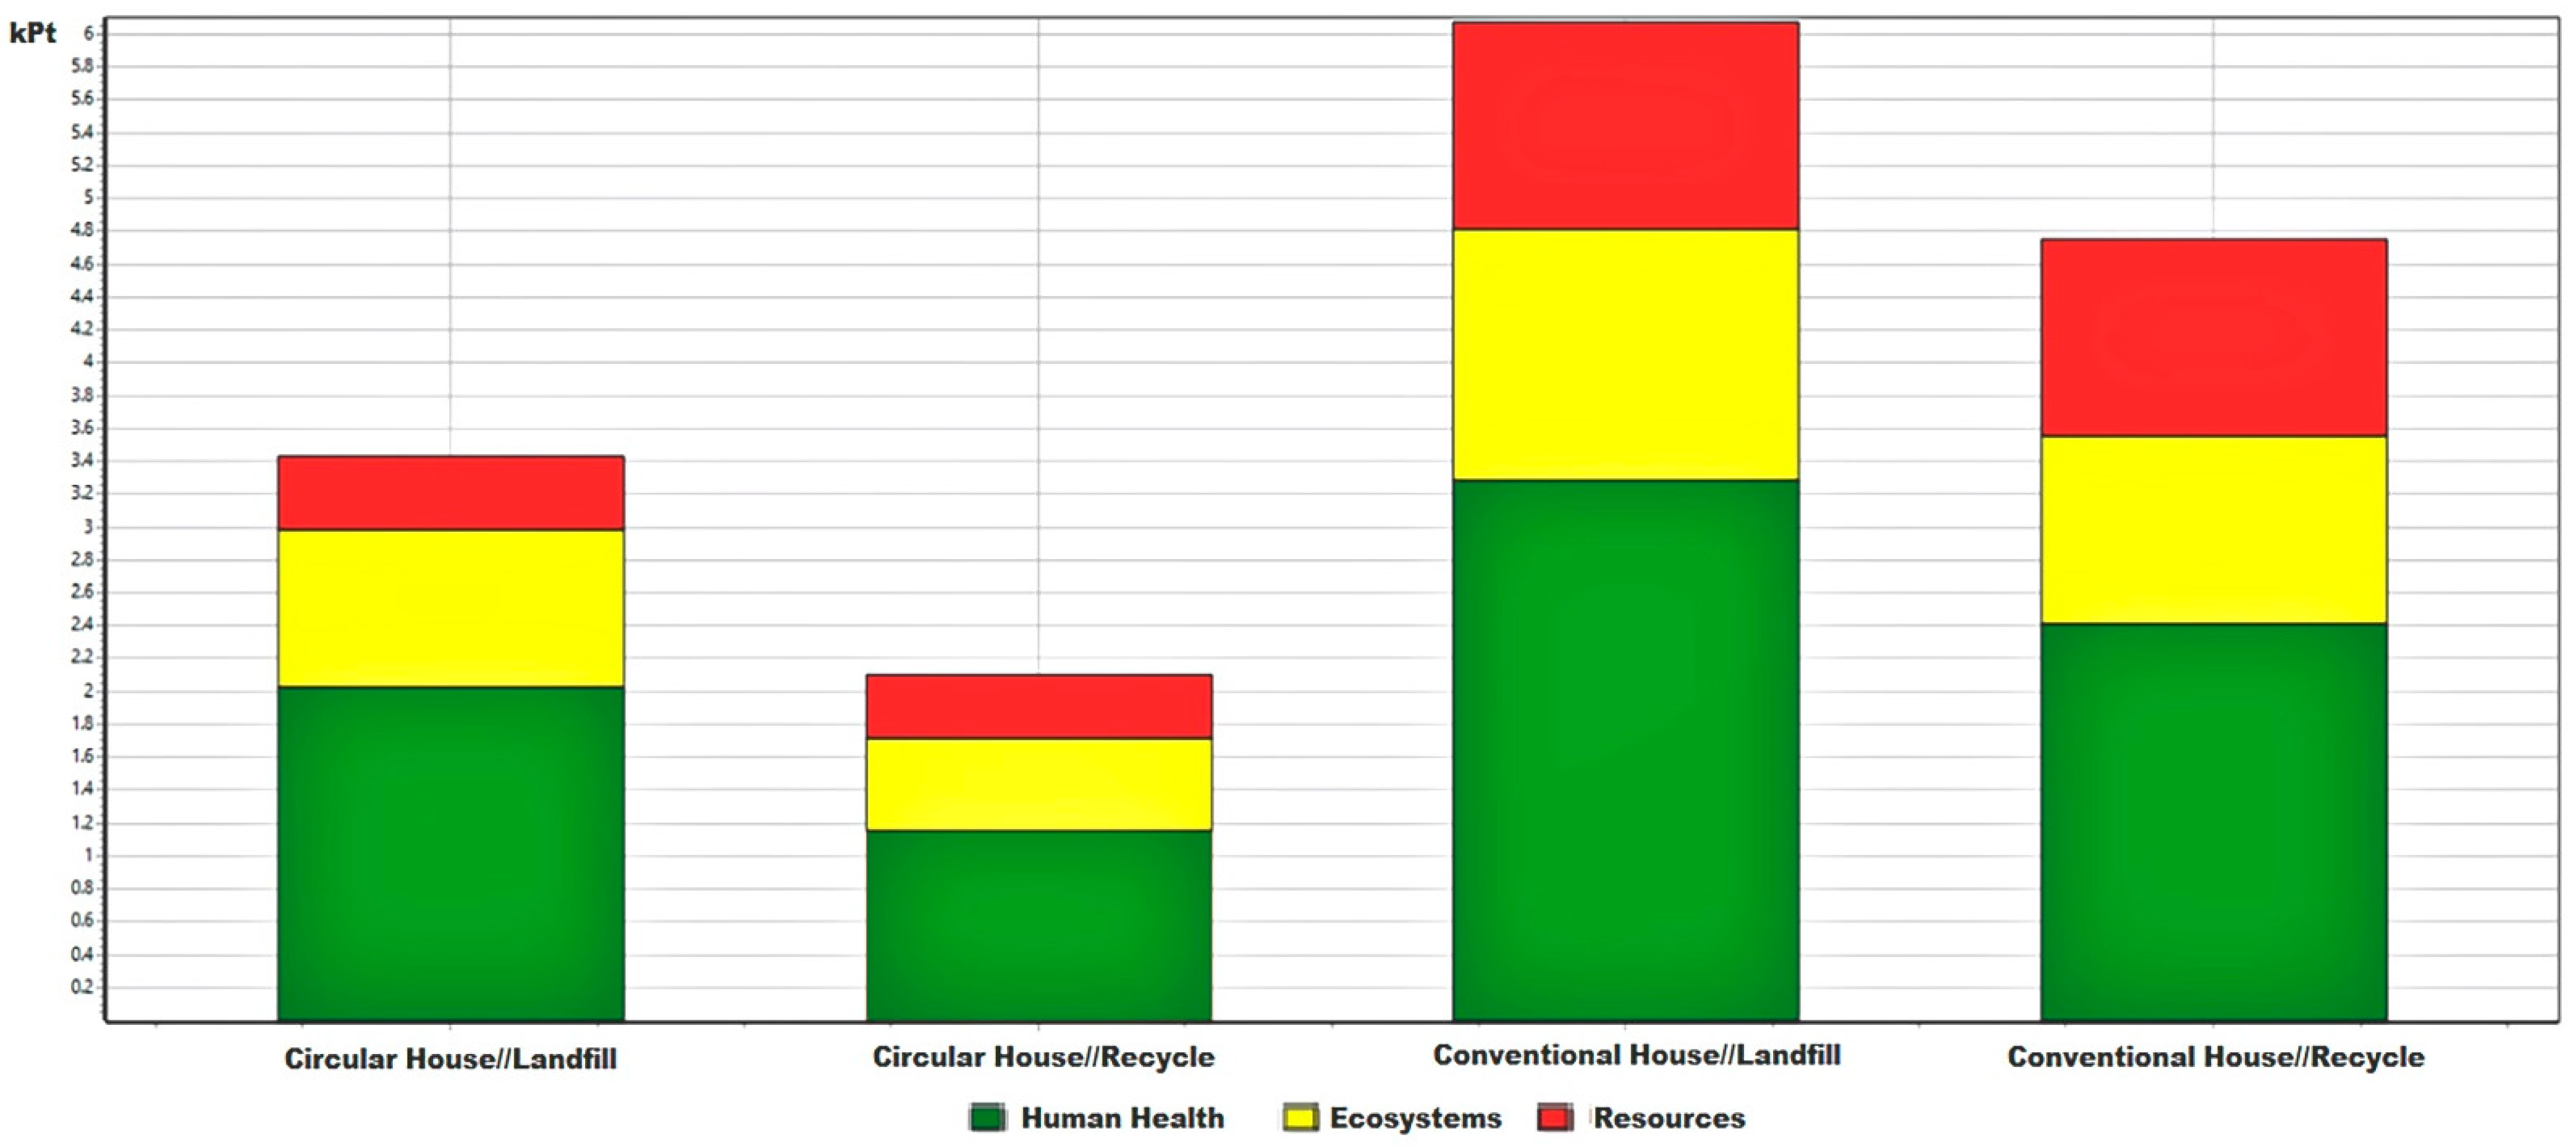
Comparing all four scenarios under total environmental impacts (which include the three categories of human health, ecosystems, and resources), the results are provided in
Table 2. In this table, the results are normalized and relatively compared in relation to the “worst scenario” (conventional landfill total impact).
Figure 7 compare the total scores of each category (human health, ecosystems, and resources) of all four scenarios, circular landfill, circular recycle, conventional landfill, and conventional recycle.
As expected, the highest environmental impacts (concerning indicators with impacts on human health, resources, and ecosystem) are found in the scenario of the conventional house that will end up in a landfill. In the case of a conventional house with disposal phase recycling, a decrease of 22% in the total impacts, with its highest contribution deriving from human health (with a 14% decrease in impacts), can be observed.
Interestingly the introduction of circularity processes in the construction phase of the built environment, with the reuse of raw materials such as cement, metal, concrete, or glass, will decrease the overall environmental impacts by almost half. More specifically, the reuse of building materials in the construction phase of a house will decrease the total impacts to 43% (with a 20% decrease in human health, 9% decrease in ecosystems, and 14% in resources). Finally, the circular with continuous recycle processes (circular recycle) will have a total environmental benefit when compared to the conventional scenario of 65%, including a 35% decrease of impacts on human health, a 15% decrease on ecosystems, and a 15% on resources.
3.3. LCA in Energy Generation from RES
3.3.1. Wind Energy
For the assessment of the use of energy generation systems for RES deriving from wind energy, the virtual wind farm (VWF) model was used [
40], taking hourly wind speed data from NASA’s MERRA [
41] and MERRA-2 [
42] reanalyses, chosen for their ease of access, good spatial and temporal resolution, and stability over long timescales. Using the specifications of the wind turbine (capacity 1.5 kW and hub height 18 m), it was found that for the area in which the case study is located, the renewable system had a total mean capacity factor of 27.3%. This results in the production of 3.587 kWh for the whole year. Since the production of the wind turbine greatly depends on meteorological conditions, for this research, an average of 3.500 kWh yearly production was used.
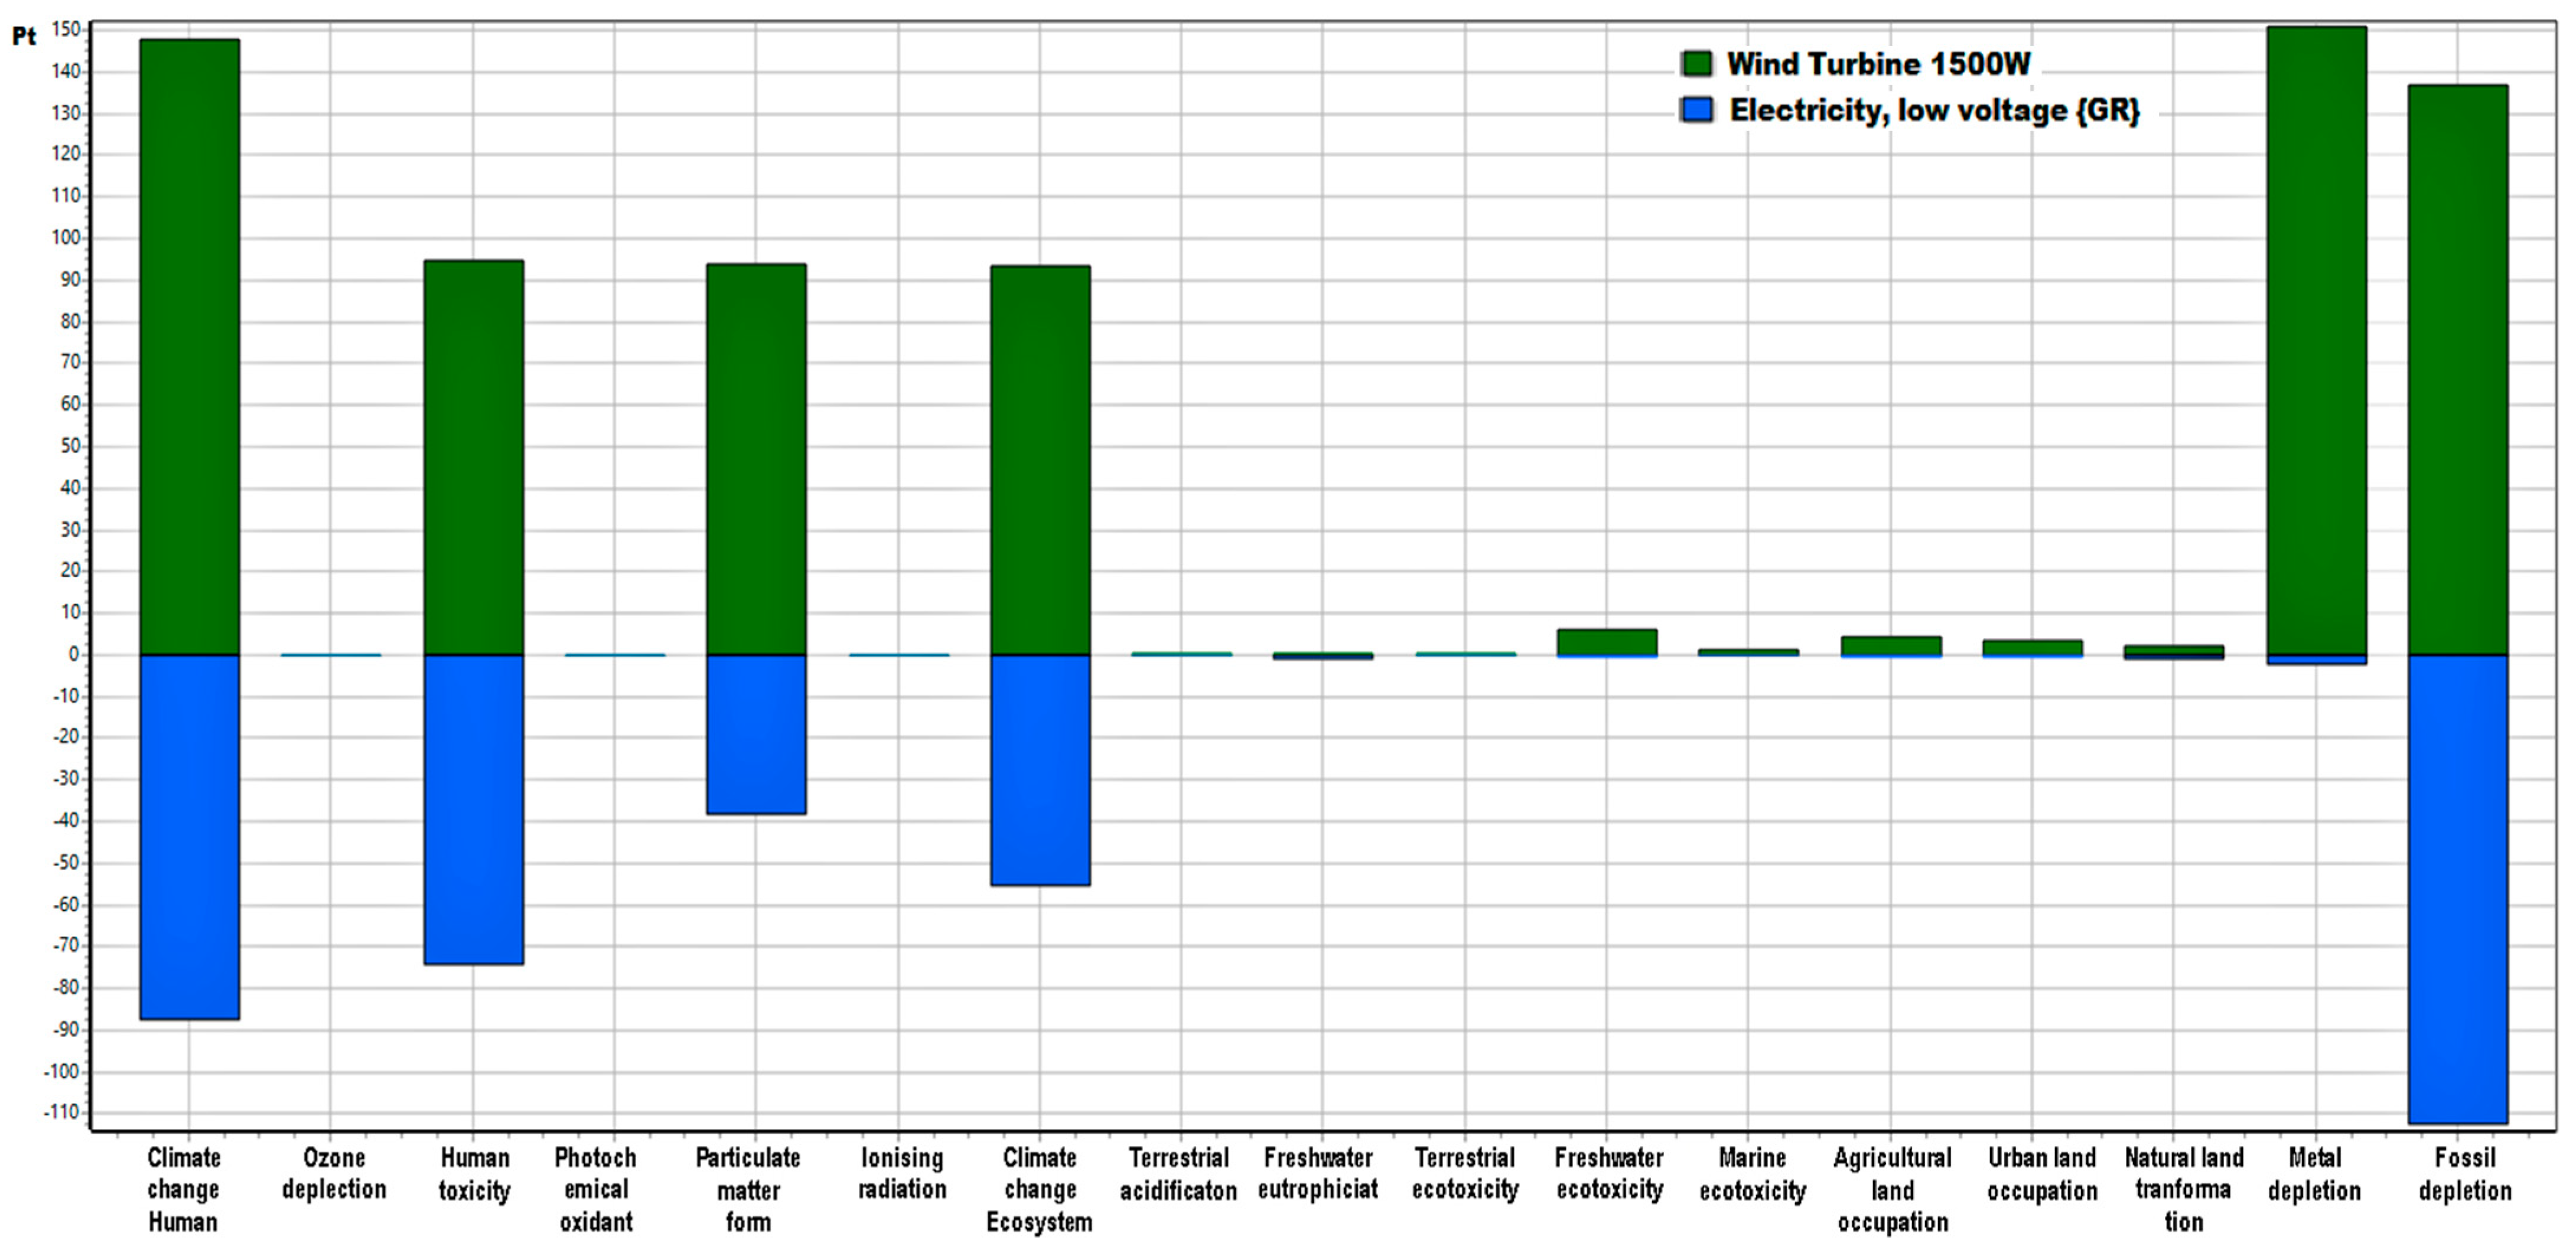
Using the wind energy generation system in the case study of this research work, an LCA was conducted considering both the production phase of the RES as well as the energy output (energy production) that the system can deliver. In
Figure 8, the environmental impacts of the system production stage (depicted with green color) are compared with the environmental gains from the energy production (depicted with blue color) for each category presented. Values above zero indicate negative impact, while values below zero positive impact.
Figure 8 show that the gains do not fully compensate for the damages; however, it must be noted that this is a calculation that considers 1 year of energy production, where the energy production of the system does not yet compensate for the energy used for its manufacturing. It is therefore clear that a complete payback of the damage will take place in the later years of the RES usage.
The categories with the highest environmental impacts (climate change for humans and ecosystem, human toxicity, particulate matter formulation, and fossil fuel depletion) are the same categories with the highest environmental gains after the energy production. However, this is not the case for metal depletion, an impact that does not recover even after the energy produced from the RES.
Figure 8 provide information on the fact that the highest environmental contributor that causes the biggest damage is the energy used to fabricate the materials of the system; therefore, after the energy is produced, the environmental gains are equally distributed to each of the impact categories. Nonetheless, metal depletion cannot be recovered by the energy gains provided by the system, leading to an increased interest in the recycling and reusage of materials in the sector of RES.
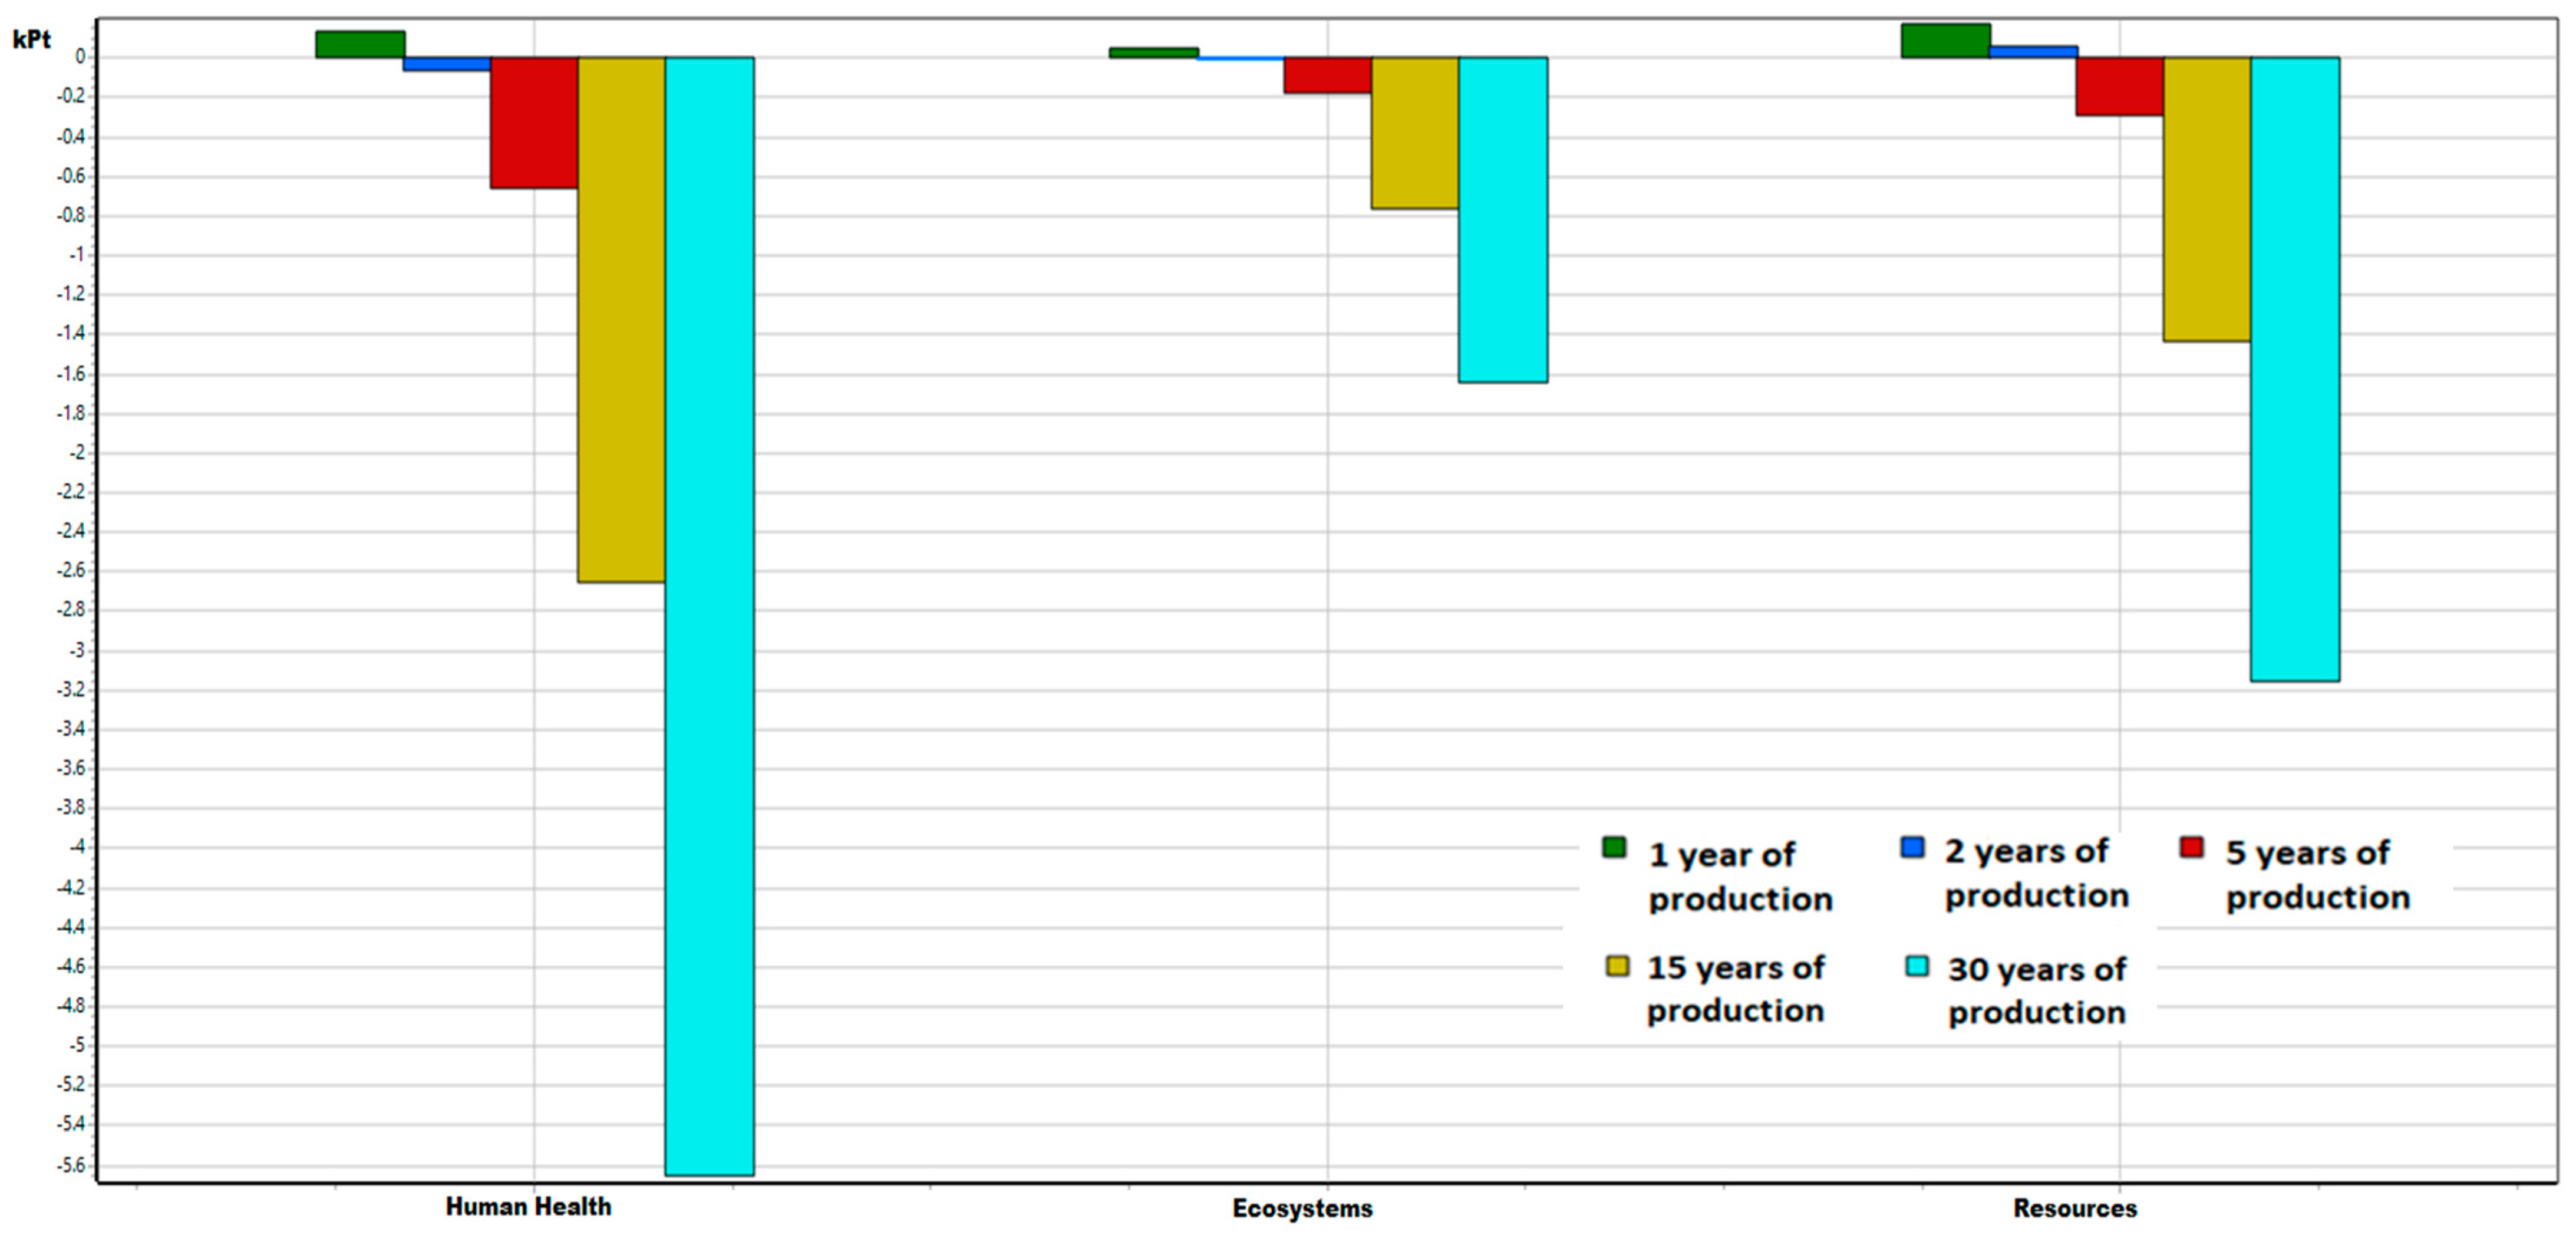
In the next step, the environmental benefits of 1, 2, 5, 15, and 30 years of electricity production were compared and presented in
Figure 9. Since environmental gains are represented as values below zero, the benefits from electricity production outweigh the environmental costs in the second year of their lifetime.
The total environmental impact of the wind turbine remains negative in the first year of electricity production. However, it was calculated (
Table 3) that the Human Health and Ecosystems damage is recovered in less than two years, specifically in 1.68 and 1.90 years, respectively. The damage on the resources is recovered at a slower rate (2.51 years), showing the need for a more in-depth analysis on the endpoint categories.
Conclusively, apart from the metal depletion, all the other impact categories pay back their impacts during the first few years of production. The total damage made to the environment from the construction, transport, assembly, and the end of life scenario of the wind turbine is recovered in almost 2 years of operation. More analytical results of each impact category are represented in
Table 3. The most crucial impact categories are human climate change, human toxicity, particulate matter formation, and fossil depletion. In these categories, the damage to the environment is recovered in 1.69, 1.28, 2.47, and 1.22 years, respectively. However, it is noted that even though the total damage of the whole life cycle of the wind turbine is recovered more than 15 times because of its electricity production, the recovery of the metal depletion needs 667 years while the life span of the wind turbine is only 30 years. This can be explained by the fact that the wind turbine requires the use of large amounts of copper, aluminium, and steel, materials that are not recovered during the operation phase of the system; thus, circular processes could also contribute highly to the renewable energy sector.
3.3.2. The PV System
The information for the PV system used is based on the database of SimaPro software, with small adjustments. Modules with crystalline silicon cells are chosen, with a cell efficiency value equal to 17.26%. The PV plant consists of eight modules, and its size is based on energy savings of 70%, compared to the previous state of the building. For the energy production of the PV system, data calculated for the specific case study with the software EnergyPlus are used. Based on these calculations, an average production of 4.300 kWh per year is assumed (responding to 70% energy savings).
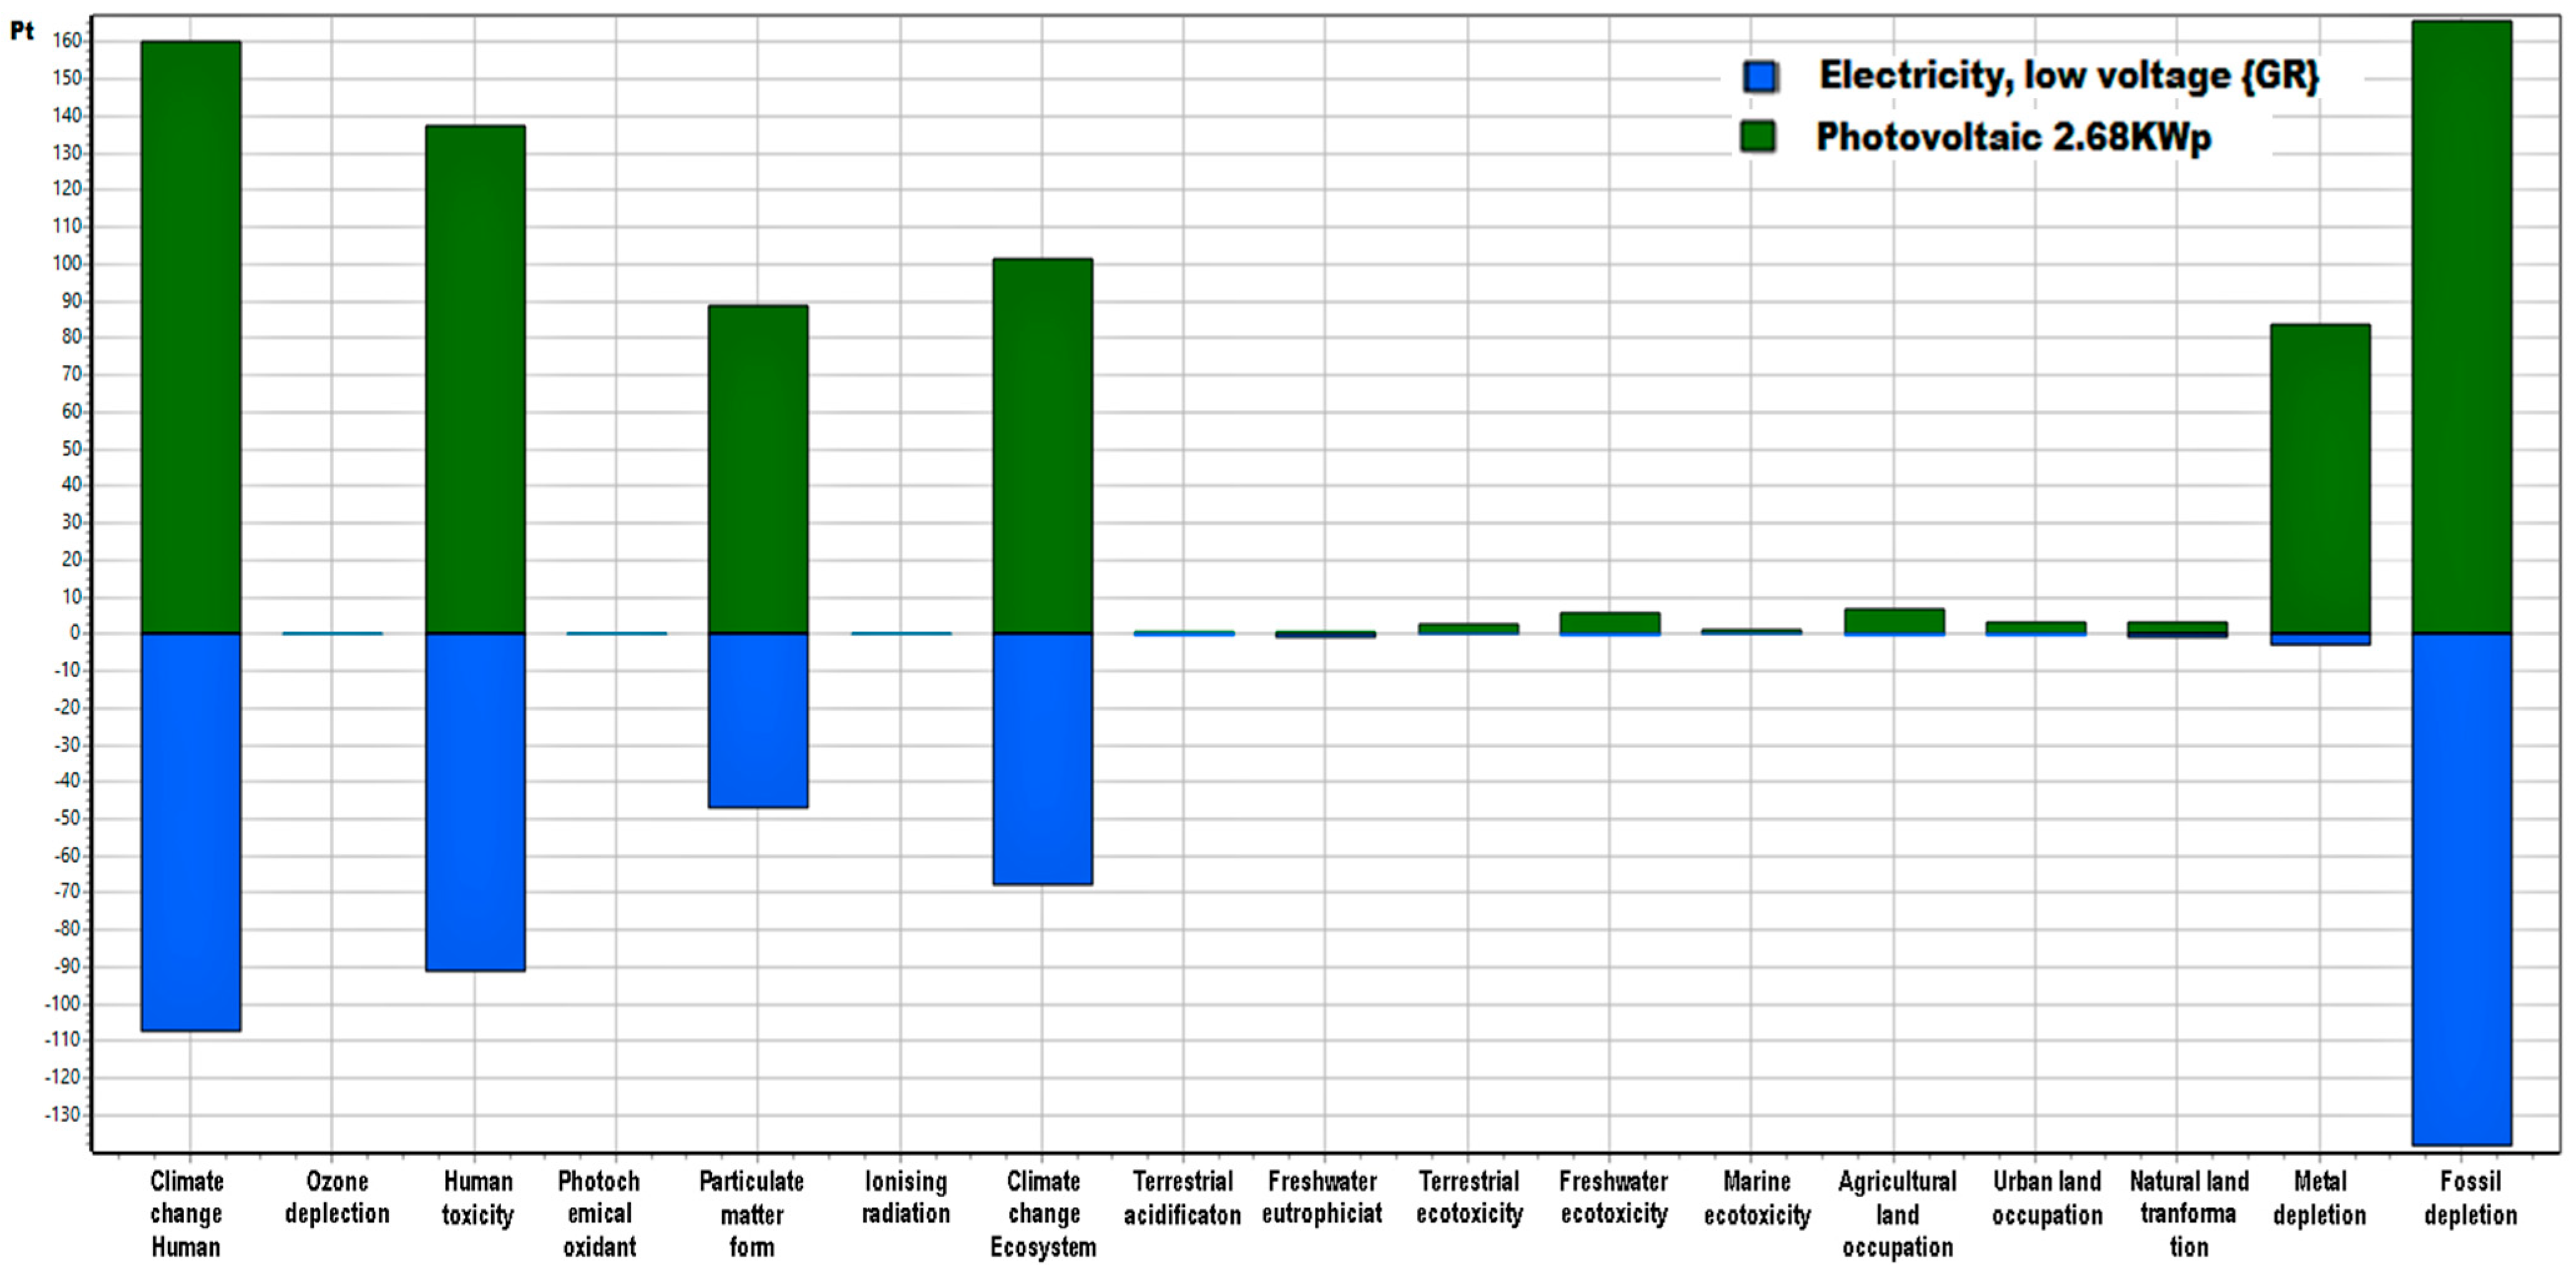
In the next step, the entire PV system is assessed for its total impact on the environment, and the results are presented in
Figure 10. The environmental impacts (green color) are compared with the environmental gains from the energy production (blue color). Values above zero indicate negative impact, while values below zero indicate positive impact. Additionally, here it is clear that the gains do not fully compensate for the damages for the first year of the lifetime of the system. The payback period of which the gains outweigh the damage is calculated in the following section.
Figure 10 depicts that fossil fuel depletion, climate change (both human and ecosystem), human toxicity, particulate matter formation, and metal depletion represent the most significant impacts. It was found that the PV panel has the largest contribution to the environmental impacts studied. This is because the process of producing PV cells is energy-intensive and involves highly poisonous and environmentally toxic chemicals [
43]. More specifically, the silicon production for the cells is by far the most damaging process in the production of the panels, as it has high impact scores on fossil depletion, climate change and particulate matter formation. However, the impact of the inverter, the mounting structure and the electric installation is not neglectable, as they account for a total of 38.1%. Furthermore, due to the Greek energy mix based on fossil fuels, energy-intense procedures release gases such as sulphur dioxide and nitrogen oxides, which contribute to the impacts of human toxicity and particulate matter formation. The increased metal depletion impact is a result of the aluminium and steel in the mounting system of the PV.
Figure 10 provide information on the fact that the highest environmental contributor that causes the biggest damage is the energy used to fabricate the materials of the system. Therefore, after the PV energy is produced, the environmental gains are equally distributed to each of the impact categories. However, this is not the case for the metal depletion, which is part of the material usage of the fabrication of the system and, unlike the energy, cannot be recovered, leading to the intense need to follow circular ways for reusing materials in the production phase.
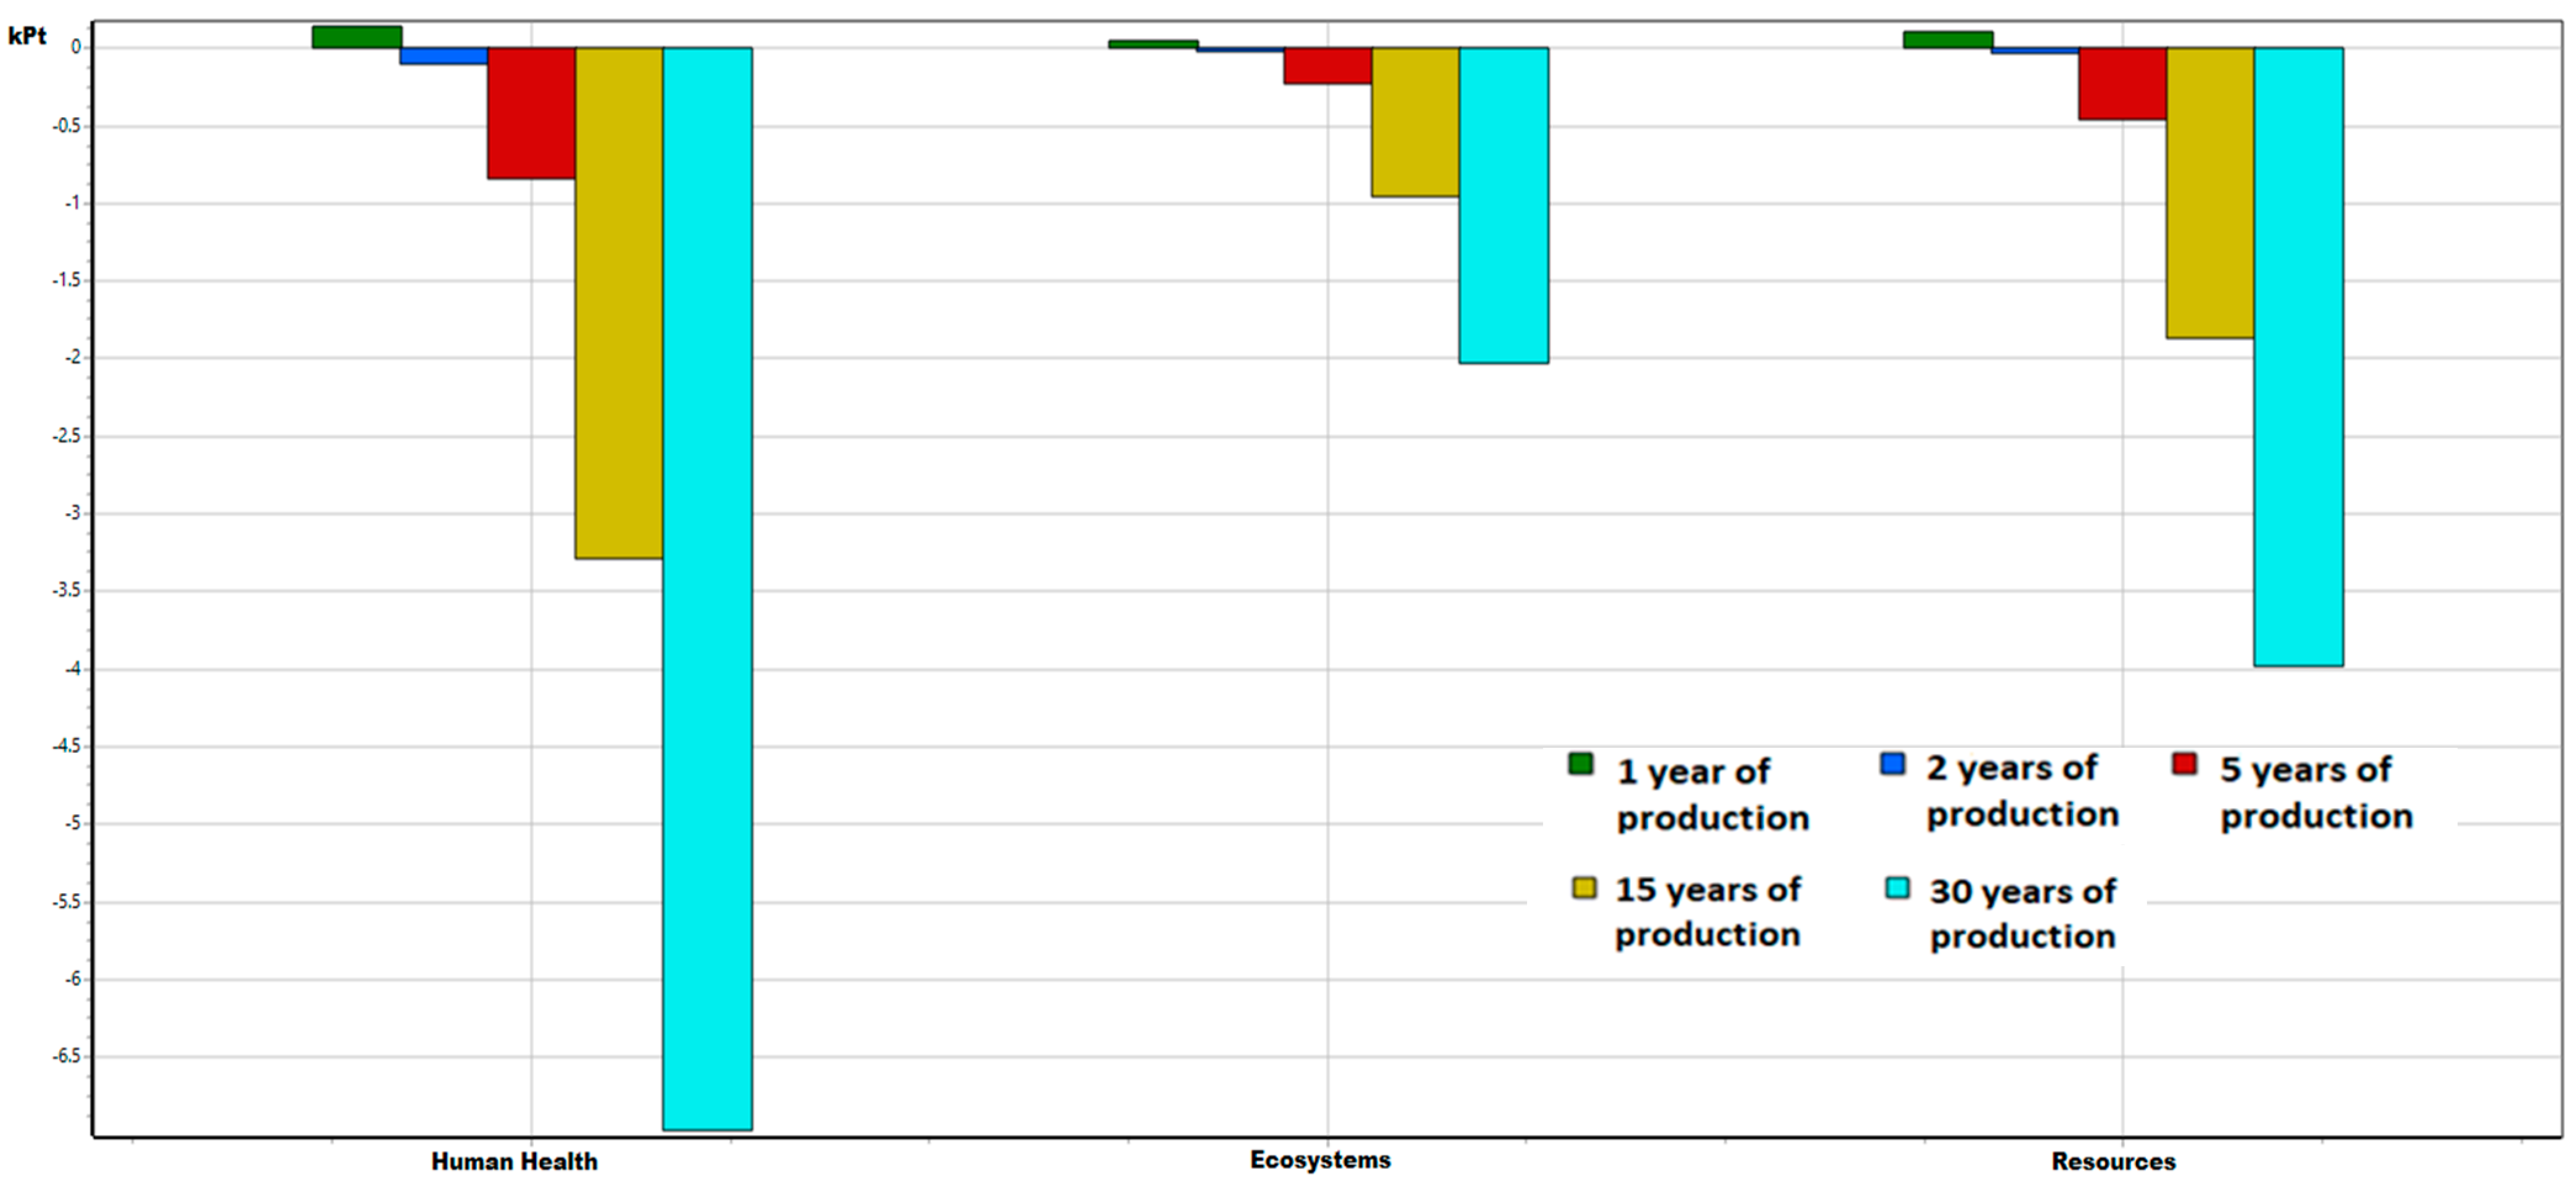
The environmental benefits of 1, 2, 5, 15, 30 years of electricity production are presented in
Figure 11.
As mentioned earlier, because the Greek energy mix is based mainly on fossil fuels, a high environmental benefit in all midpoint categories is calculated. The figure presents that the total environmental impact of the PVs remains negative in the first year of electricity production. However, it was calculated that the human health and ecosystems damage is recovered in less than two years, 1.68 and 1.90 years, respectively. The damage on the resources is recovered at a slower rate (2.51 years), showing the need for a more in-depth analysis on the endpoint categories.
Table 4 present the damage recovery calculated in years of the entire PV system per impact category. It is observed that both metal depletion and terrestrial ecotoxicity need a large amount of time to recover, even more than the total lifetime of the system itself. The terrestrial ecotoxicity is mainly caused due to the production of the PV cells, while the metal depletion derives mainly from the inverter and the mounting system. The damage made to the environment from the construction, transport, assembly, and end-of-life scenario of the PV is recovered in less than 2 years of operation in most categories. The most crucial impact categories are climate change human, human toxicity, particulate matter formation, and fossil depletion. The damage to the environment is recovered in 1.49, 1.51, 1.90, 1.49, 1.20 years, respectively. However, it is noted that even though the total damage of the whole life cycle of the PV system is recovered more than 18 times because of its electricity production, the recovery of the metal depletion needs 301 years while the life span of the PV system is only 30 years.
4. Discussion
Comparing the two RES, the impacts of the assembly processes for the PV module were found to be higher than those of the wind turbine in all categories except those of particulate matter formation and minerals. Wind turbines require the use of larger amounts of copper, iron, and steel, which is responsible for the higher impact score of mineral depletion. However, after normalization, the differences between these impacts become insignificant. Large impact differences are associated with fossil fuel usage, respiratory inorganics, climate change, and carcinogens. The higher impact for the fossil fuels category for the PV system results from the energy-intense processes requiring electricity and/or heat generated from fossil fuels. The burning of fossil fuels also releases air pollutants, causing particulate matter formation and climate change impacts increase, while human toxicity increases due to the processing of slag waste generated during the fabrication of solar cells.
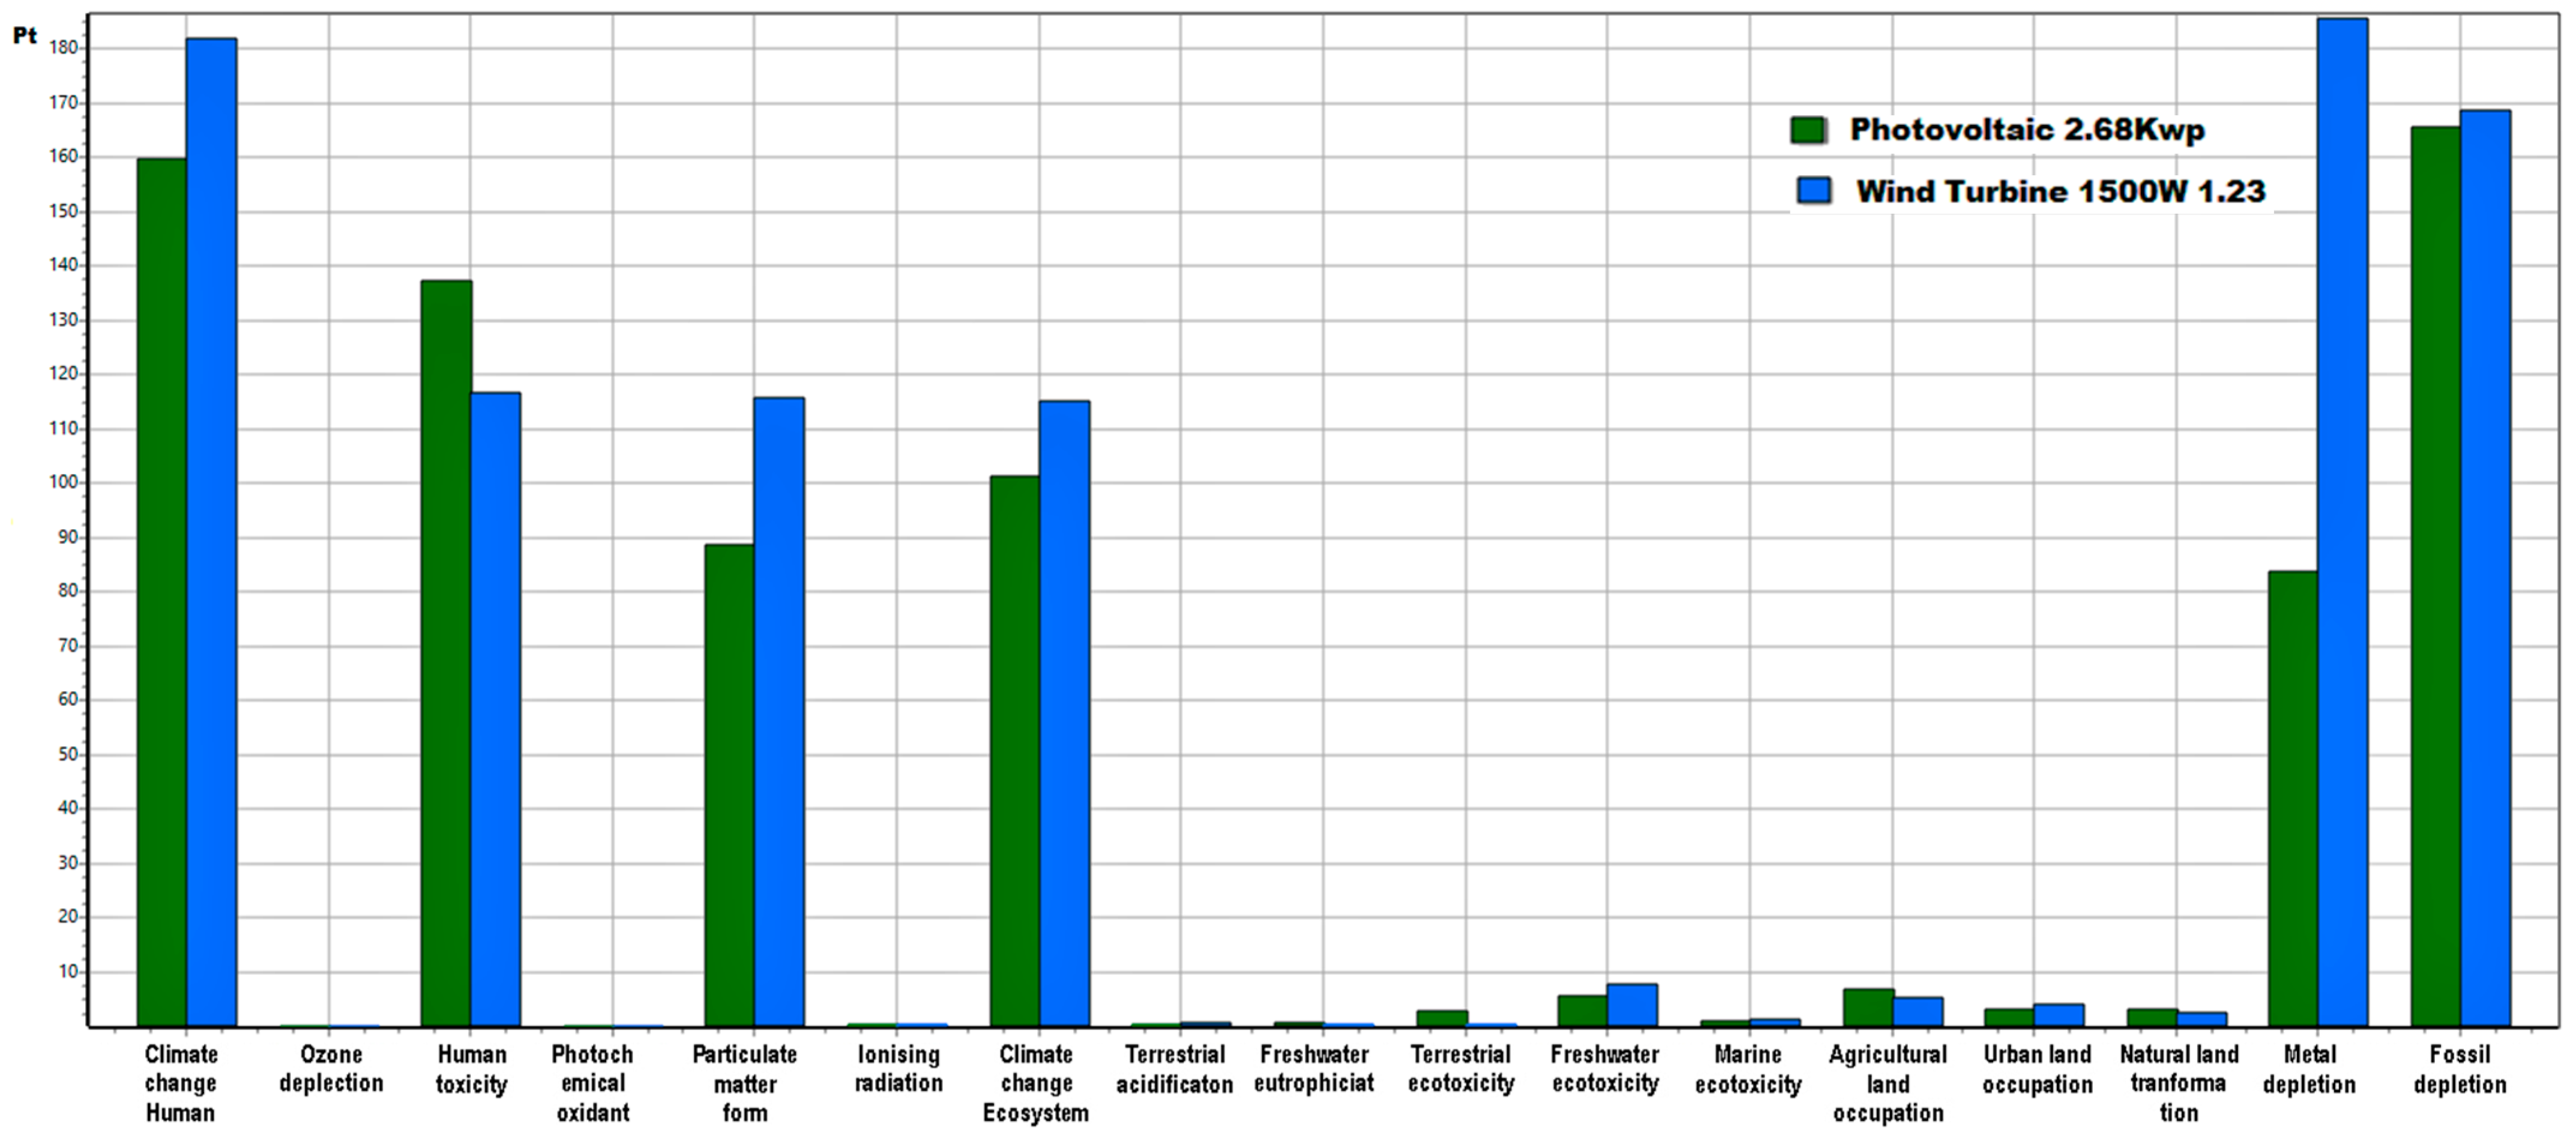
Nonetheless, since the two RES have different capacities of electricity production, a better comparison would incorporate the correlation between damage and production, normalizing both systems with their energy output. Results are found in
Figure 12, where the environmental impacts of the PV (green color) are compared with the environmental impacts of the wind turbine (blue color).
For the case study area (which is an urban area in a large cosmopolitan city), it was found that after normalizing the results with the production of electricity, the wind turbine system has a higher impact score in almost all impact categories apart from the human toxicity. This makes it clear that wind energy is not equally effective as PVs in the built environment in a big cosmopolitan capital. The maximum potential of energy production highly depends on the height of the system, as the wind turbine’s electricity production suffers heavily from turbulence caused by obstacles near the system, especially in the urban environment. Given these facts, the PV systems would provide the smallest environmental impacts, after considering their higher energy production, in the urban built environment in a city environment. From the single score comparison of the systems, presented in
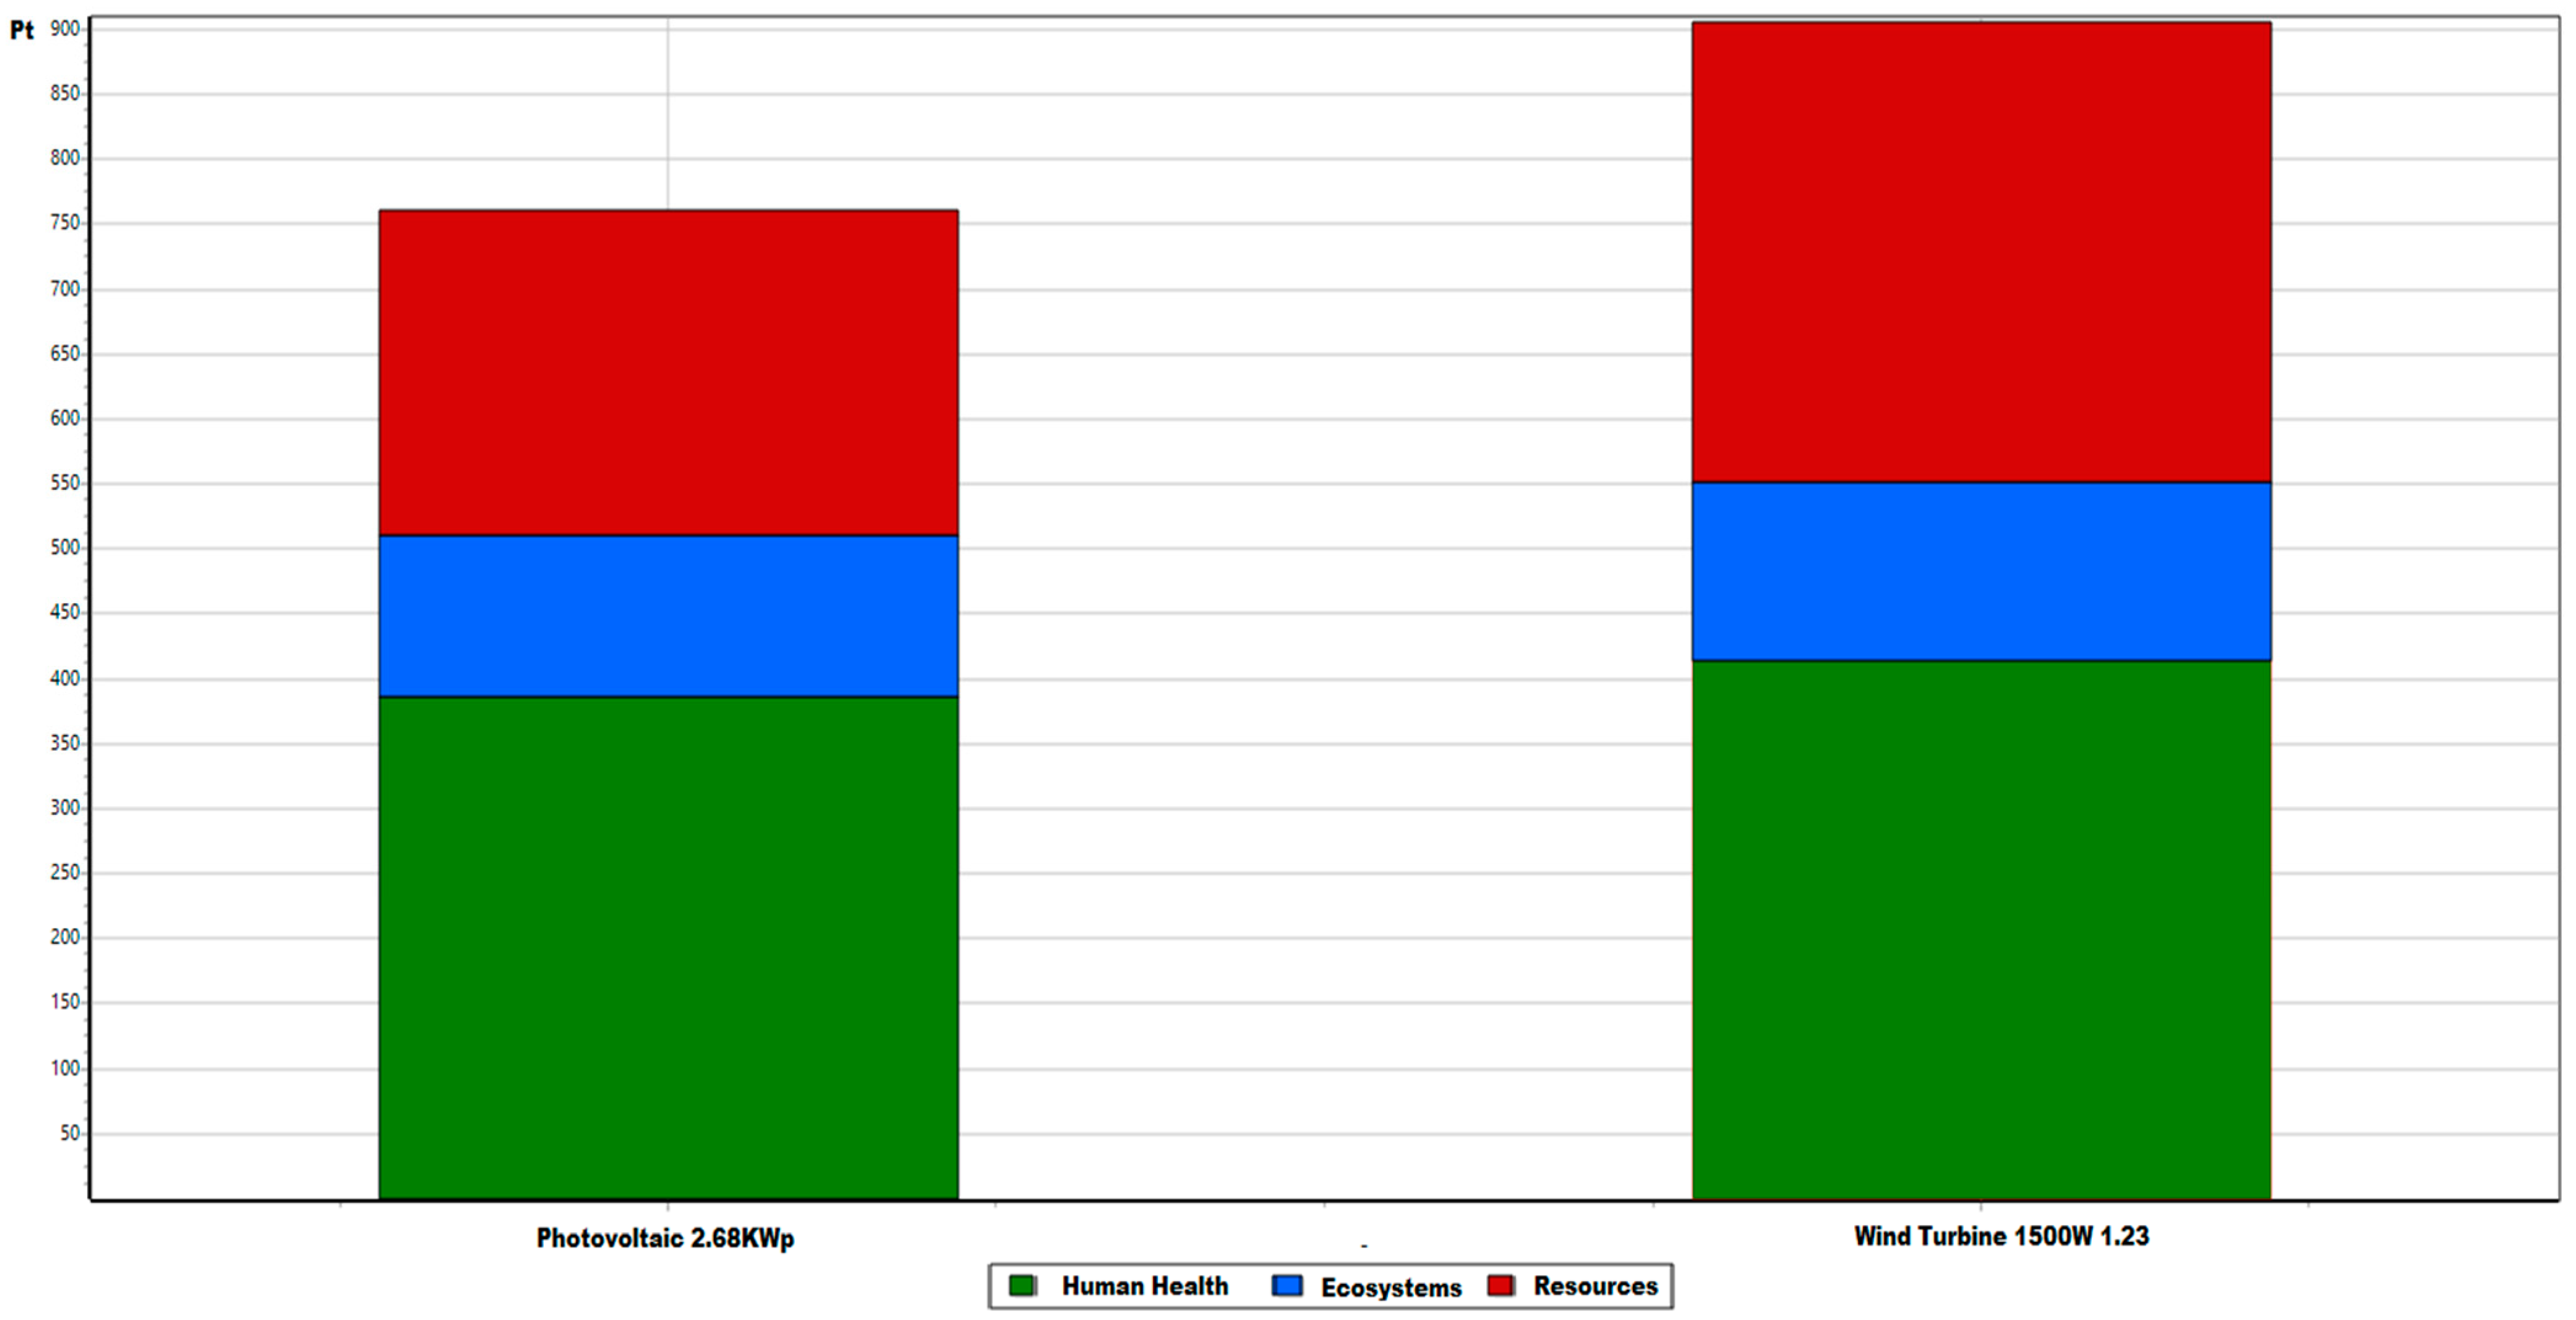
Figure 13, it was concluded that the wind turbine system has 17% higher negative impacts on the environment for its whole life cycle compared to the PV system, after considering their energy efficiency in the built environment in a city area.
Nonetheless, in both RES, metal depletion was found to be an impact that cannot recover even after the energy gains of both systems due to energy production. The reason for this is the intense use of metal-based materials in the fabrication of RES, which depicted the emerging need for inserting circularity fabrication processes for the reuse and recycling of materials in the energy production sector. Minimizing the consumption of conventional materials by using alternative materials, methods, and techniques can result in considerable energy savings as well as a reduction of CO2 emissions and the minimization of material depletion.
However, there are certain limitations that must be considered in this study. These results should be interpreted within the context of a metropolitan city center. Further research is needed to evaluate whether the outcomes of the research can be extrapolated to different settings, materials, and to determine the viability of circularity in the building sector.
5. Conclusions
The building sector is negatively characterized by both its intensive energy use and its environmental pollution. The building materials used drastically increase the embodied energy of the construction. It is also important to consider that, unlike operational carbon emissions, embodied energy cannot be reversed. Therefore, the usage of these materials should be kept to a minimum. Traditionally, construction and demolition waste is disposed of in landfills with its negative environmental impact, contaminating underground water and surrounding habitats. This study assesses the circularity processes for the construction industry with an LCA of a case study located in a large cosmopolitan city. The extraction and transformation of conventional building materials is a process that requires huge amounts of energy. Materials such as clay brick, aluminum, concrete, and ceramics are found to be the ones with the highest impact due to their mass or energy intensity. The impact categories with the highest contribution are fossil depletion, climate change (both human health and ecosystem), and particulate matter formation.
Summarizing this research, circularity processes are proven to be highly effective when incorporating them in the fabrication of building materials for construction purposes. If CDW is given for recycling instead of landfill disposal, the overall environmental impacts would decrease by 22%, with the highest contribution deriving from human health (14% decrease). The recycling and reuse of building materials in the construction phase of a house will decrease the total impacts by 43% (with a 20% decrease in human health, 9% decrease in ecosystems, and 14% in resources). While in new constructions, if already recycled building materials were used (such as recycled cement, metal, concrete, or glass) and during their disposal, they would be recycled again, following a complete circle of circularity, the total impacts would decrease up to 65%, including a 35% decrease of impacts on human health, a 15% decrease on ecosystems, and a 15% on resources.
Furthermore, to address the need for a complete sustainable design of a building, this work assesses two energy production systems based on RES. In an urban environment, a PV system, as this case study shows, will have a 17% higher energy efficiency compared to wind energy. In a rural environment, wind energy could prove to be more efficient, considering a more efficient setting for the technology; however, this needs to be studied. Lastly, in both wind and solar systems, most of the environmental impacts related to the production phase are being paid back during the second year of the life of both systems due to the energy gains provided by the RES. The most crucial impact categories are climate change human, human toxicity, particulate matter formation, and fossil depletion. In these categories, the damage to the environment is recovered in 1.69, 1.28, 2.47, and 1.22 years, respectively. However, metal depletion is proved to be an impact that cannot recover during the entire lifecycle of both energy systems, even after the energy gains of both systems due to energy production. The reason for this is the intense use of metal-based materials in the fabrication of RES, proving the emerging need to integrate circular processes for the recycling and reuse of materials, not only in the construction sector but also in the energy-generating sector for the manufacturing of more sustainable energy systems. Minimizing the consumption of materials by using alternative materials, methods, and techniques can result in considerable energy savings as well as the reduction of CO2 emissions and the minimization of materials’ depletion.


