1. Introduction
With the rapid development of the global economy and the continuous reduction of fossil energy [
1], the greenhouse effect is becoming more and more serious. Low-pollution, low-emission electric vehicles (EVs) are gradually attracting great attention [
2]. Batteries are the main power source of EVs, but due to the limitations of current battery technology, EVs are not practical for long-distance travel and charging. This can lead to mental distress or apprehension caused by the driver’s fear of suddenly running out of power when driving an electric vehicle (range anxiety) [
3], which has become an important factor hindering the development of EVs. It can be concluded from this that the key to solving the driving range problem of electric vehicles is to optimize the layout of charging stations according to the charging demand.
The reasonable deployment of charging infrastructure plays a positive role in extending the driving range of EVs and promoting the development of EVs. In order to solve the problems of insufficient range, inconvenient charging, and unreasonable charging infrastructure layout of EVs, a lot of studies have investigated the location problem of public charging stations for EVs from different perspectives.
In terms of the influencing factors, some researchers have found that charging demand [
4], vehicle miles traveled [
5,
6], geographic distribution of cities [
6], path deviation [
7], traffic flow patterns [
8], and other factors are important in influencing the location of charging stations, of which charging demand is the most fundamental factor. The current market penetration of EVs is low, and the accurate estimation of charging demand can help achieve an optimized layout of charging stations.
To ensure more accurate estimation of charging demand, some researchers have used GPS trajectory data of gasoline vehicles to simulate the trajectory data of EVs for charging infrastructure location selection. For example, Pan et al. [
9] used survey data of household trips to simulate the charging selection behavior of drivers with the decision process of EV charging selection so that the existing travel activities of drivers are maximally unaffected. Chen et al. [
10] used parking information from more than 30,000 individual trip records collected from a household trip survey in Seattle, Washington, USA, to determine the optimal number of charging stations to be allocated. Liu et al. [
11] proposed an intelligent optimization method as well as data-driven and particle swarm optimization based on GPS trajectory data of hybrid vehicles in Chengdu, China, to achieve intelligent siting of EV charging stations. Yang et al. [
12] used the GPS trajectory information of a fleet of cabs in Changsha, China, to estimate the likelihood of EV charging using a queuing model, and investigated the relationship between installing more charging piles and the trade-off between providing more waiting space, and the effect of charging power on waiting time. Due to the short time of the emergence of electric taxis (ETs) in China, relevant GPS trajectory data are scarce to give a reasonable layout of charging stations. Shi et al. [
13] present an improved destination selection model, proposed to simulate the ET operation system and to help find the optimal ET charging station size with statistical analysis based on the charging need prediction. Therefore, this paper simulates the travel trajectory of electric taxis with GPS trajectory data of gasoline vehicles and predicts the charging demand of electric taxis by combining this with grid-based maps.
In terms of location methods, most studies focus on constructing charging station location models and siting charging stations based on different objective functions and constraints [
14,
15], while relatively few studies have applied clustering algorithms to the location of electric vehicle charging stations. Cluster analysis is a kind of unsupervised learning, and there are many kinds, such as the division-based K-means clustering algorithm [
16], hierarchical clustering algorithm (agglomerative and splitting) [
17], and DBSCAN algorithm based on density clustering, etc. At present, clustering algorithms are widely used in short-time traffic flow prediction [
18], logistics center location selection [
19], traffic flow speed prediction [
20], and travel hotspot area research [
21], etc., but they are less widely applied in charging station location selection. For example, Zhang et al. [
22] developed a siting model for electric cabs based on their dynamic distribution and charging demand using the K-means clustering method and the center of gravity method, and applied it to the problem of siting electric cabs in Chengdu, China. Straka et al. [
23] analyzed charging transactions in the Netherlands using clustering algorithms (K-means, dbscan, and cohesive hierarchical clustering) to identify usage related segments of charging stations, which helps to improve the planning of charging infrastructure and the development of smart charging technologies. Liu et al. [
24] used existing service areas on highways as potential locations for charging infrastructure, clustered the close service areas, and calculated the optimal location of charging stations for each cluster. Gilanifar et al. [
25] proposed a Gaussian process based on the Clustered Multi-Node Learning (CMNL-GP) method to fuse and learn data from multiple charging stations simultaneously. Zhang et al. [
26] proposed a density peak clustering-based optimization method for siting and sizing EV charging stations in an urban area. Sánchez et al. [
27] proposed a clustering strategy based on the K-means algorithm to define potential charging station locations. The above studies are based on different clustering algorithms for the siting and sizing determination of charging stations, and there are not yet multiple clustering algorithms combined and applied in the siting study.
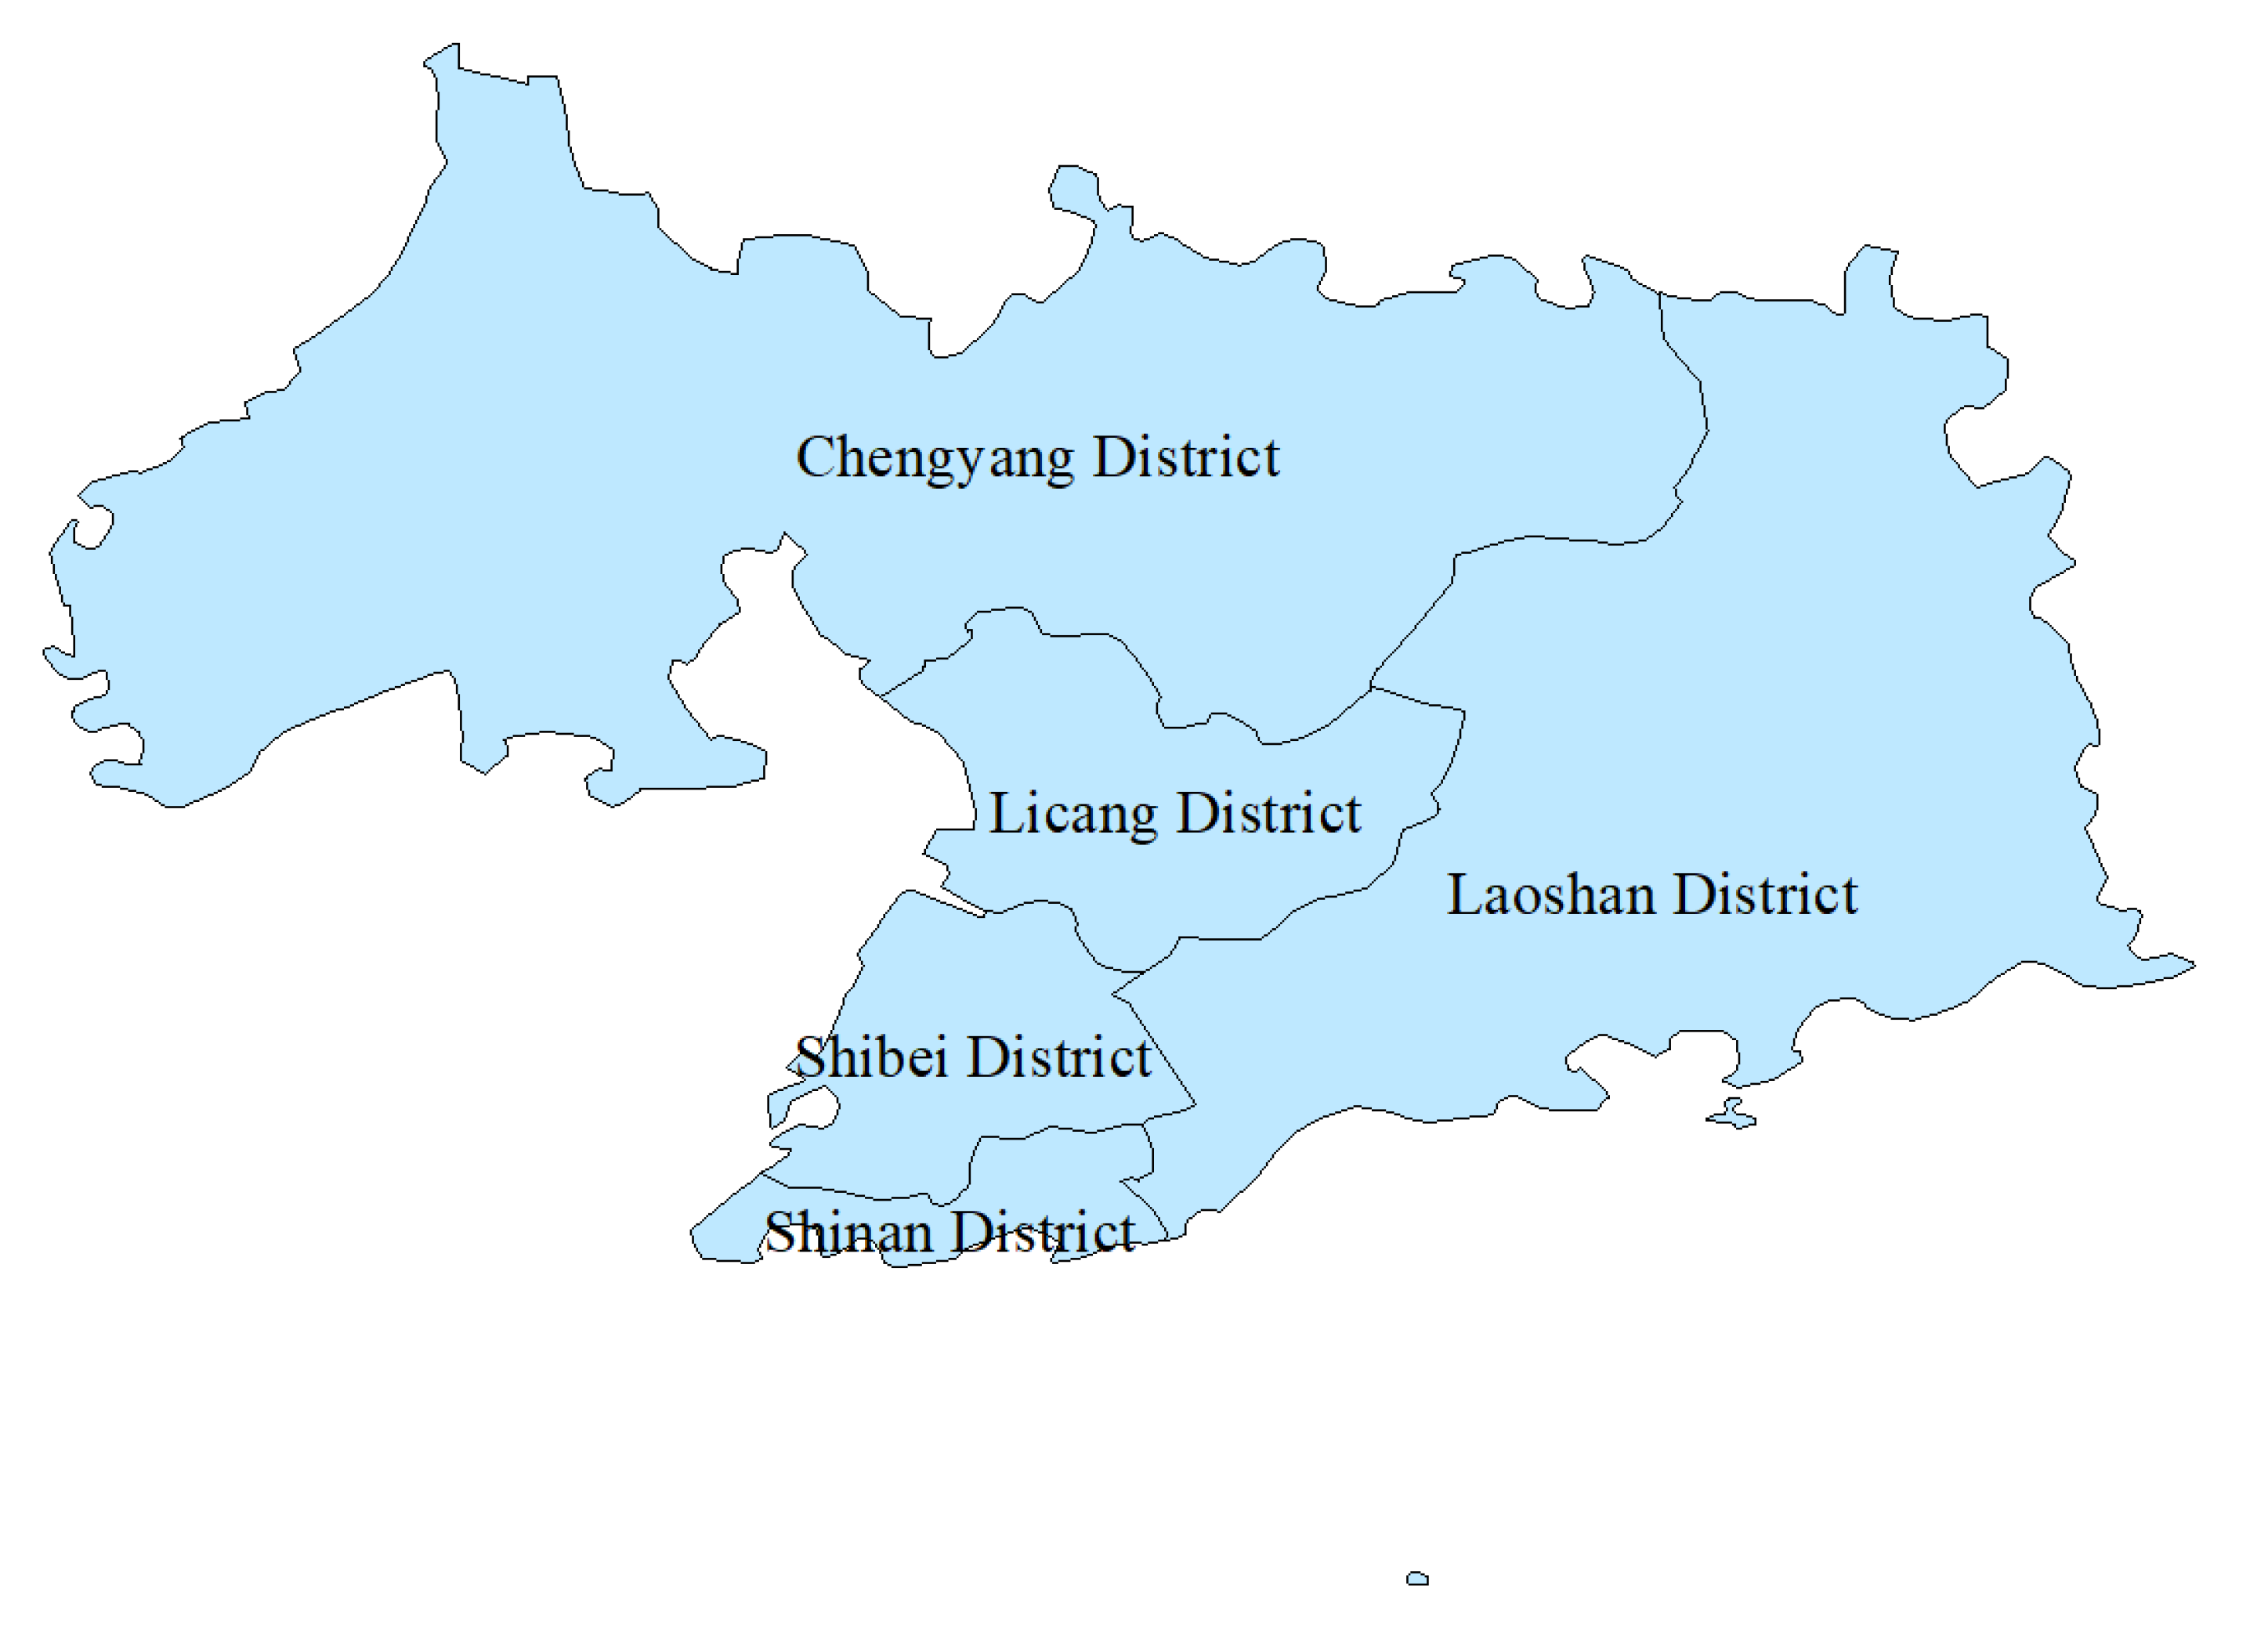
This paper uses multiple and multi-type clustering algorithms to optimize the location of charging stations and obtain the optimal charging station location and clustering algorithm combination. At present, electric taxis have not been fully popularized in Qingdao. Therefore, we can only estimate the charging demand of electric taxis through the GPS trajectory data of gasoline taxis in reality. The research areas are five main districts of Qingdao (Shinan District, Shibei District, Licang District, Chengyang District, and Laoshan District). Firstly, the map of the study area is gridded, and the number of vehicles in each grid that stay longer than the time threshold is recorded as the number of dwell events, and the number of dwell events in each grid is used as the charging demand of the grid. Finally, the overall weighted Euclidean distance sum of the two location selection methods is compared, and the optimal location and the best location selection method for charging stations are obtained. The proposed method is of theoretical and practical significance as it provides quantitative charging station location solutions to help deal with actual charging station location problems in urban management.
This paper is organized as follows:
Section 2 presents the problem statement and data processing.
Section 3 presents the location selection methodology.
Section 4 presents the results of the charging station location. Finally, we summarize this paper and present the limitations and future research directions in
Section 5.
3. Methodology
To achieve the optimal layout of charging stations and find the best combination of clustering sizing algorithms, this paper proposes the multiple and multi-type clustering algorithms, which mainly involve the K-means clustering algorithm, K-means weighted clustering algorithm, and hierarchical clustering algorithm.
3.1. Calculation of Euclidean Distance
The difference between the K-means clustering algorithm and the K-means weighted clustering algorithm is whether Euclidean distance or the weighted Euclidean distance is used in the clustering process.
The Euclidean distance calculation formula of the K-means clustering algorithm is
where
,
represent two data objects containing
-dimensional attributes [
15].
In this paper, the position coordinates of the
i-th grid can be expressed as
where
represents the position of the
i-th grid;
xposi and
yposi denote the x-coordinate and y-coordinate of the
i-th grid position expressed in terms of GPS longitude and latitude, respectively.
is the set of grid numbers in this category.
Suppose the coordinates of the
k-th cluster center can be written by Equation (3)
where
represents the position of the
k-th cluster center;
zxk and
zyk represent the x-coordinate and y-coordinate of the
k-th cluster center, respectively.
Therefore, the calculation formula of the Euclidean distance between the
i-th grid and the
k-th cluster center can be written by Equation (4)
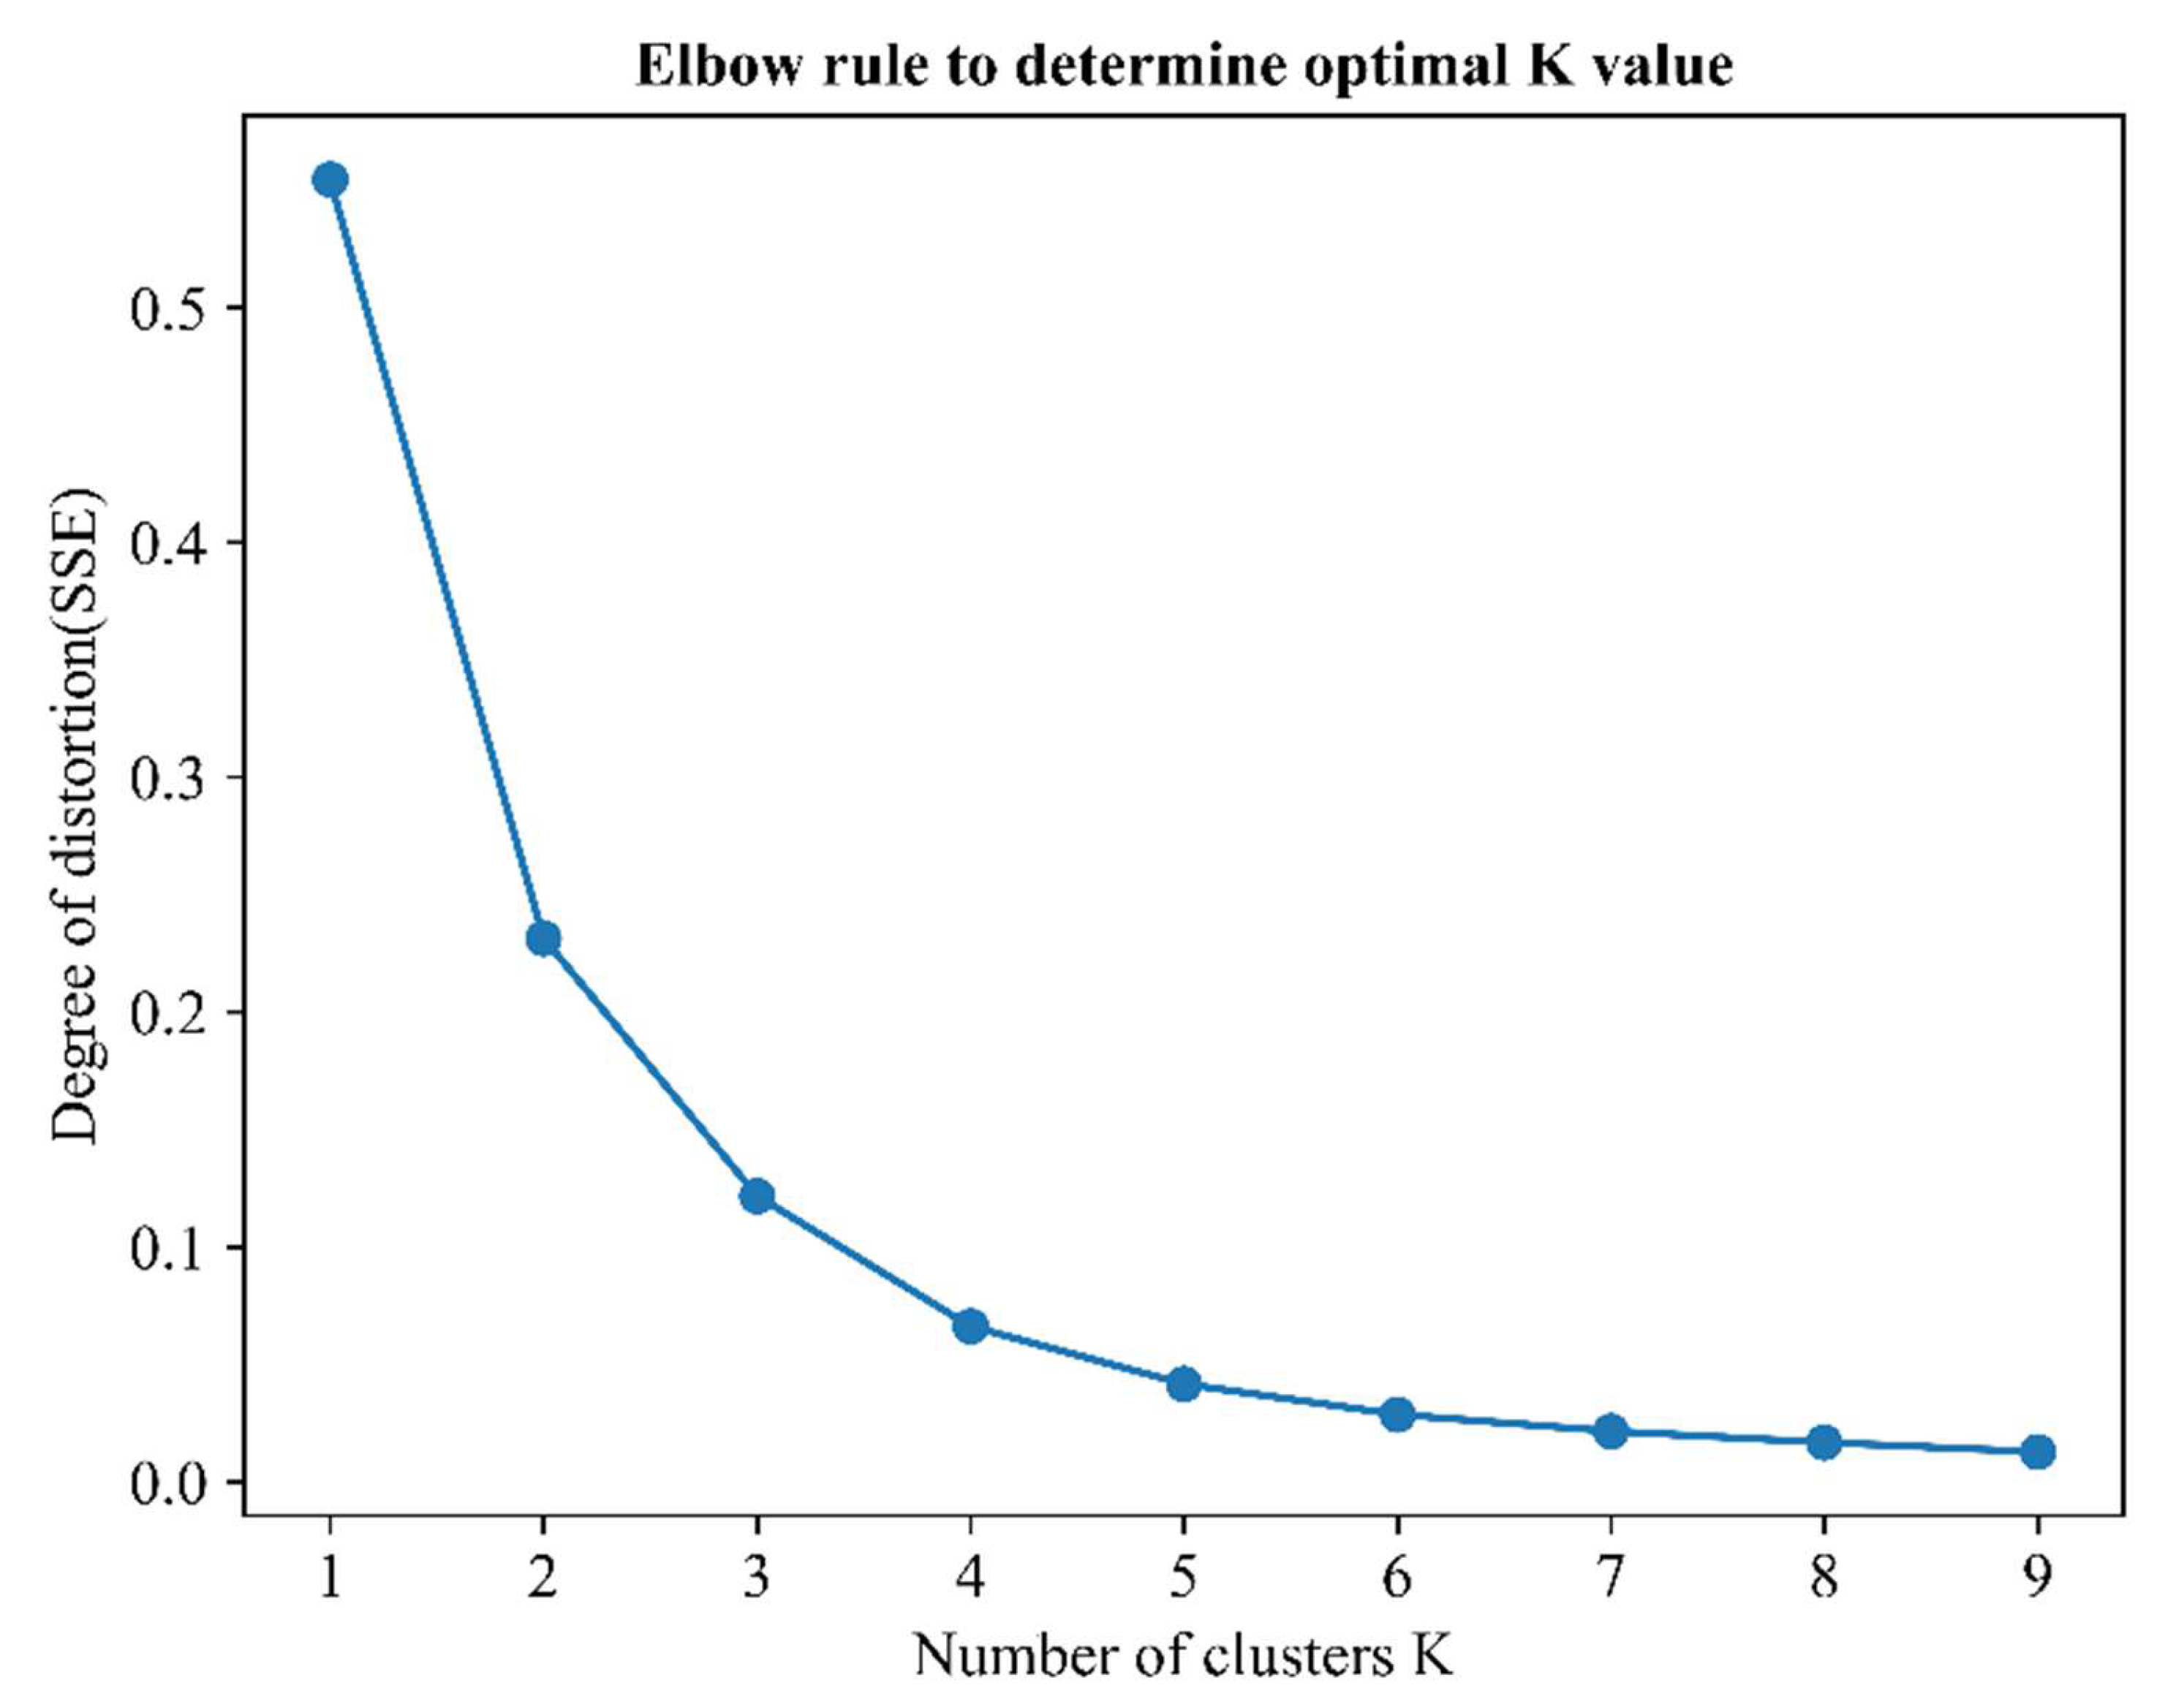
In the K-means clustering algorithm, the commonly used methods for determining the number of clusters are the silhouette coefficient method and the elbow rule. The silhouette coefficient method determines the optimal value by finding the local optimal result; the elbow rule determines the optimal value by judging the change of the sum of squared errors (SSE) within the class.
This paper uses the elbow rule to determine the number of clusters
. In the elbow rule, the sum of squared errors (SSE) of the distance between the cluster center of each class and the sample points in the class is called the degree of distortion. For a class, the lower the degree of distortion, the closer the sample points within the class are. The more the number of clusters, the fewer sample points each class contains, and the closer the sample points are to the center point of the cluster, so the degree of distortion will decrease with the increase of the number of clusters. If the number of clusters exceeds the actual number of categories, the degree of distortion changes little, even if the number of clusters
increases, the degree of distortion does not change significantly, so an area similar to “elbow” will be formed on the line graph composed of the degree of distortion and the corresponding
value of the elbow is the selected number of clusters. The formula for calculating the degree of distortion (SSE) can be written by Equation (5)
In addition, the K-means weighted clustering algorithm selects a weight in the K-means clustering process and improves the Euclidean distance into the weighted Euclidean distance, so the weighted Euclidean distance between the position of the
i-th grid and the center of the
k-th cluster is calculated (Equation (6)).
where
is the weight of the
i-th grid.
3.2. Multiple Same-Type Clustering and Multiple Multi-Type Clustering Algorithms
This paper presents multiple and multi-type clustering algorithms for the siting layout of charging stations. The so-called multiple, that is, repeatedly applying the same clustering algorithm and improving this algorithm in the application; the so-called multi-type, that is, comprehensive application of multiple clustering algorithms.
Method 1: The multiple same-type clustering algorithms first use K-means clustering to obtain the classification results based on the geographical location between grids; secondly, using the charging demand of each grid as the weight, K-means weighted clustering is performed on the sample points of each category. The new cluster center of each class is obtained, which is the location of the charging station, and the intra-class weighted Euclidean distance sum from the sample points of each class to the cluster center is calculated, and finally, the overall weighted Euclidean distance sum is obtained.
Method 2: The multiple multi-type clustering algorithms use K-means clustering to obtain classification results based on the geographical location between grids; secondly, considering the charging demand of each grid, the two-step clustering method is used to select the location of charging stations. The so-called two-step clustering method is to perform agglomerative hierarchical clustering for each class of sample points, choose a fixed relative distance to reclassify each class of sample points, and then perform K-means weighted clustering for each class of sample points after classification to obtain the location of charging stations, and calculate the intra-class weighted Euclidean distance sum for each class. Therefore, finally, we obtain the overall weighted Euclidean distance sum.
4. Results
In order to obtain a reasonable layout and siting method for charging stations, this paper firstly clusters the screened 295 grids using a K-means clustering algorithm based on the geographic location attributes between the grids. The input data samples of the K-means clustering algorithm are shown in
Table 2, which contains the grid number, the longitude and latitude corresponding to the grid location, and the number of dwell events for the grid.
The choice of
value is crucial for K-means clustering algorithm.
Table 3 shows the number of clusters
and the specific values of the corresponding degree of distortion (SSE) obtained by the elbow rule, and
Figure 5 is the elbow diagram obtained by the elbow rule. According to the elbow diagram judgment
value is obtained by human subjective observation, so this paper sets a limit value for the variation difference of the degree of distortion (SSE). If the variation difference of the degree of distortion is less than this limit value, the former
value is selected. The limit value of the variation difference of the degree of distortion is set to 0.02, so
can be set to 4. Meanwhile, through the observation of the elbow diagram in
Figure 5, it can be seen that when
, the degree of distortion (SSE) does not change significantly, so the final number of clusters
is determined to be 4. The simultaneous use of the two methods ensures the accuracy of the
value.
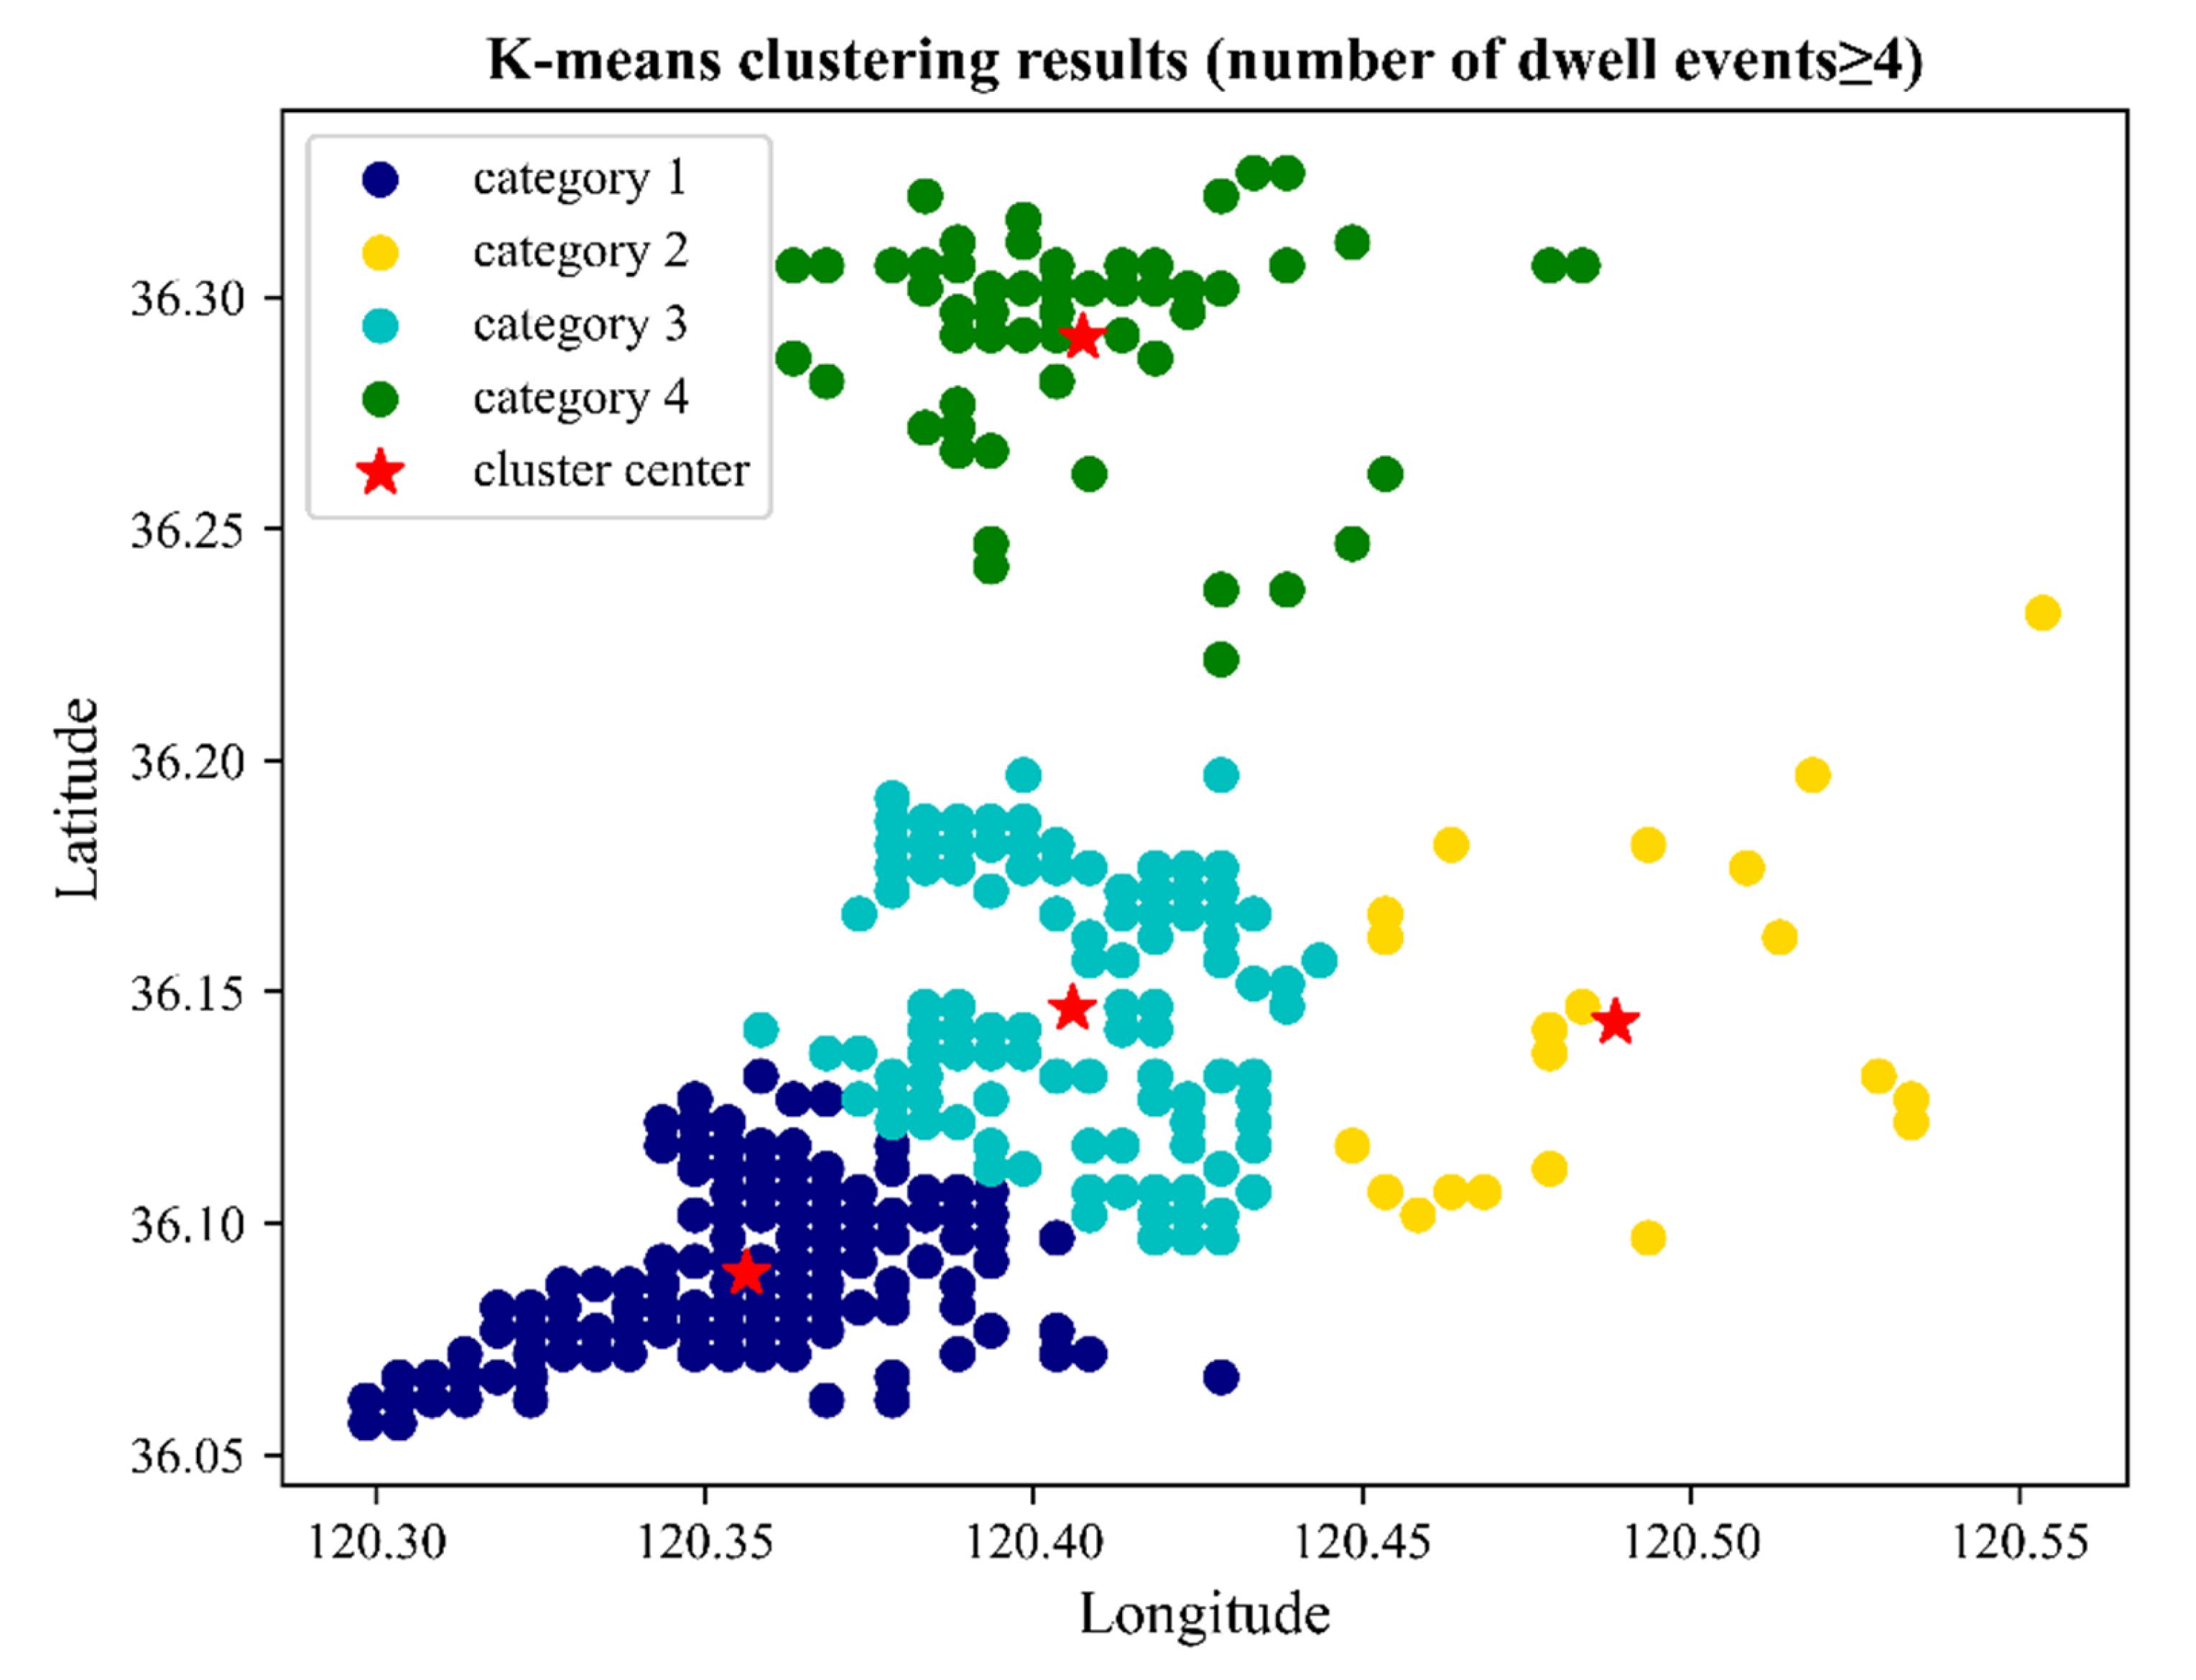
Figure 6 shows the clustering diagram of K-means clustering with selected
. The dots of different colors represent different clustering categories. The geographical locations between the grids within each category are the closest, and the number of grids in the 4 categories are 118 (category 1), 21 (category 2), 102 (category 3), and 54 (category 4), respectively. From
Figure 6, we can see that the sample points in category 1, category 3 and category 4 are more concentrated, while the sample points in category 2 are more dispersed. The grids in category 2, belonging to the Laoshan District, are unevenly distributed because there is a large mountainous area in Laoshan District.
K-means clustering only considers the geographic location between 295 grids without considering the charging demand of electric taxis in each grid, so the 4 clustering centers obtained are not the best locations for charging stations. Therefore, the following two optimization modes of location selection are chosen to select the optimal location of the charging station on the basis of the K-means clustering results.
4.1. Location Results of Multiple Same-Type Clustering Algorithms
The more the number of dwell events in the grid, the greater the charging demand of electric taxis in the grid. According to the 4 classes of grid data obtained by K-means clustering, the charging demand of electric taxis in each grid is considered, and the charging demand of electric taxis in each grid is used as the weight of the grid. Then K-means weighted clustering (
= 1) is performed for each class of the sample points to obtain 4 new cluster centers and the corresponding intra-class weighted Euclidean distance sums (
Table 4), and finally obtain the overall weighted Euclidean distance sum of the four types of grid data is 24.1.
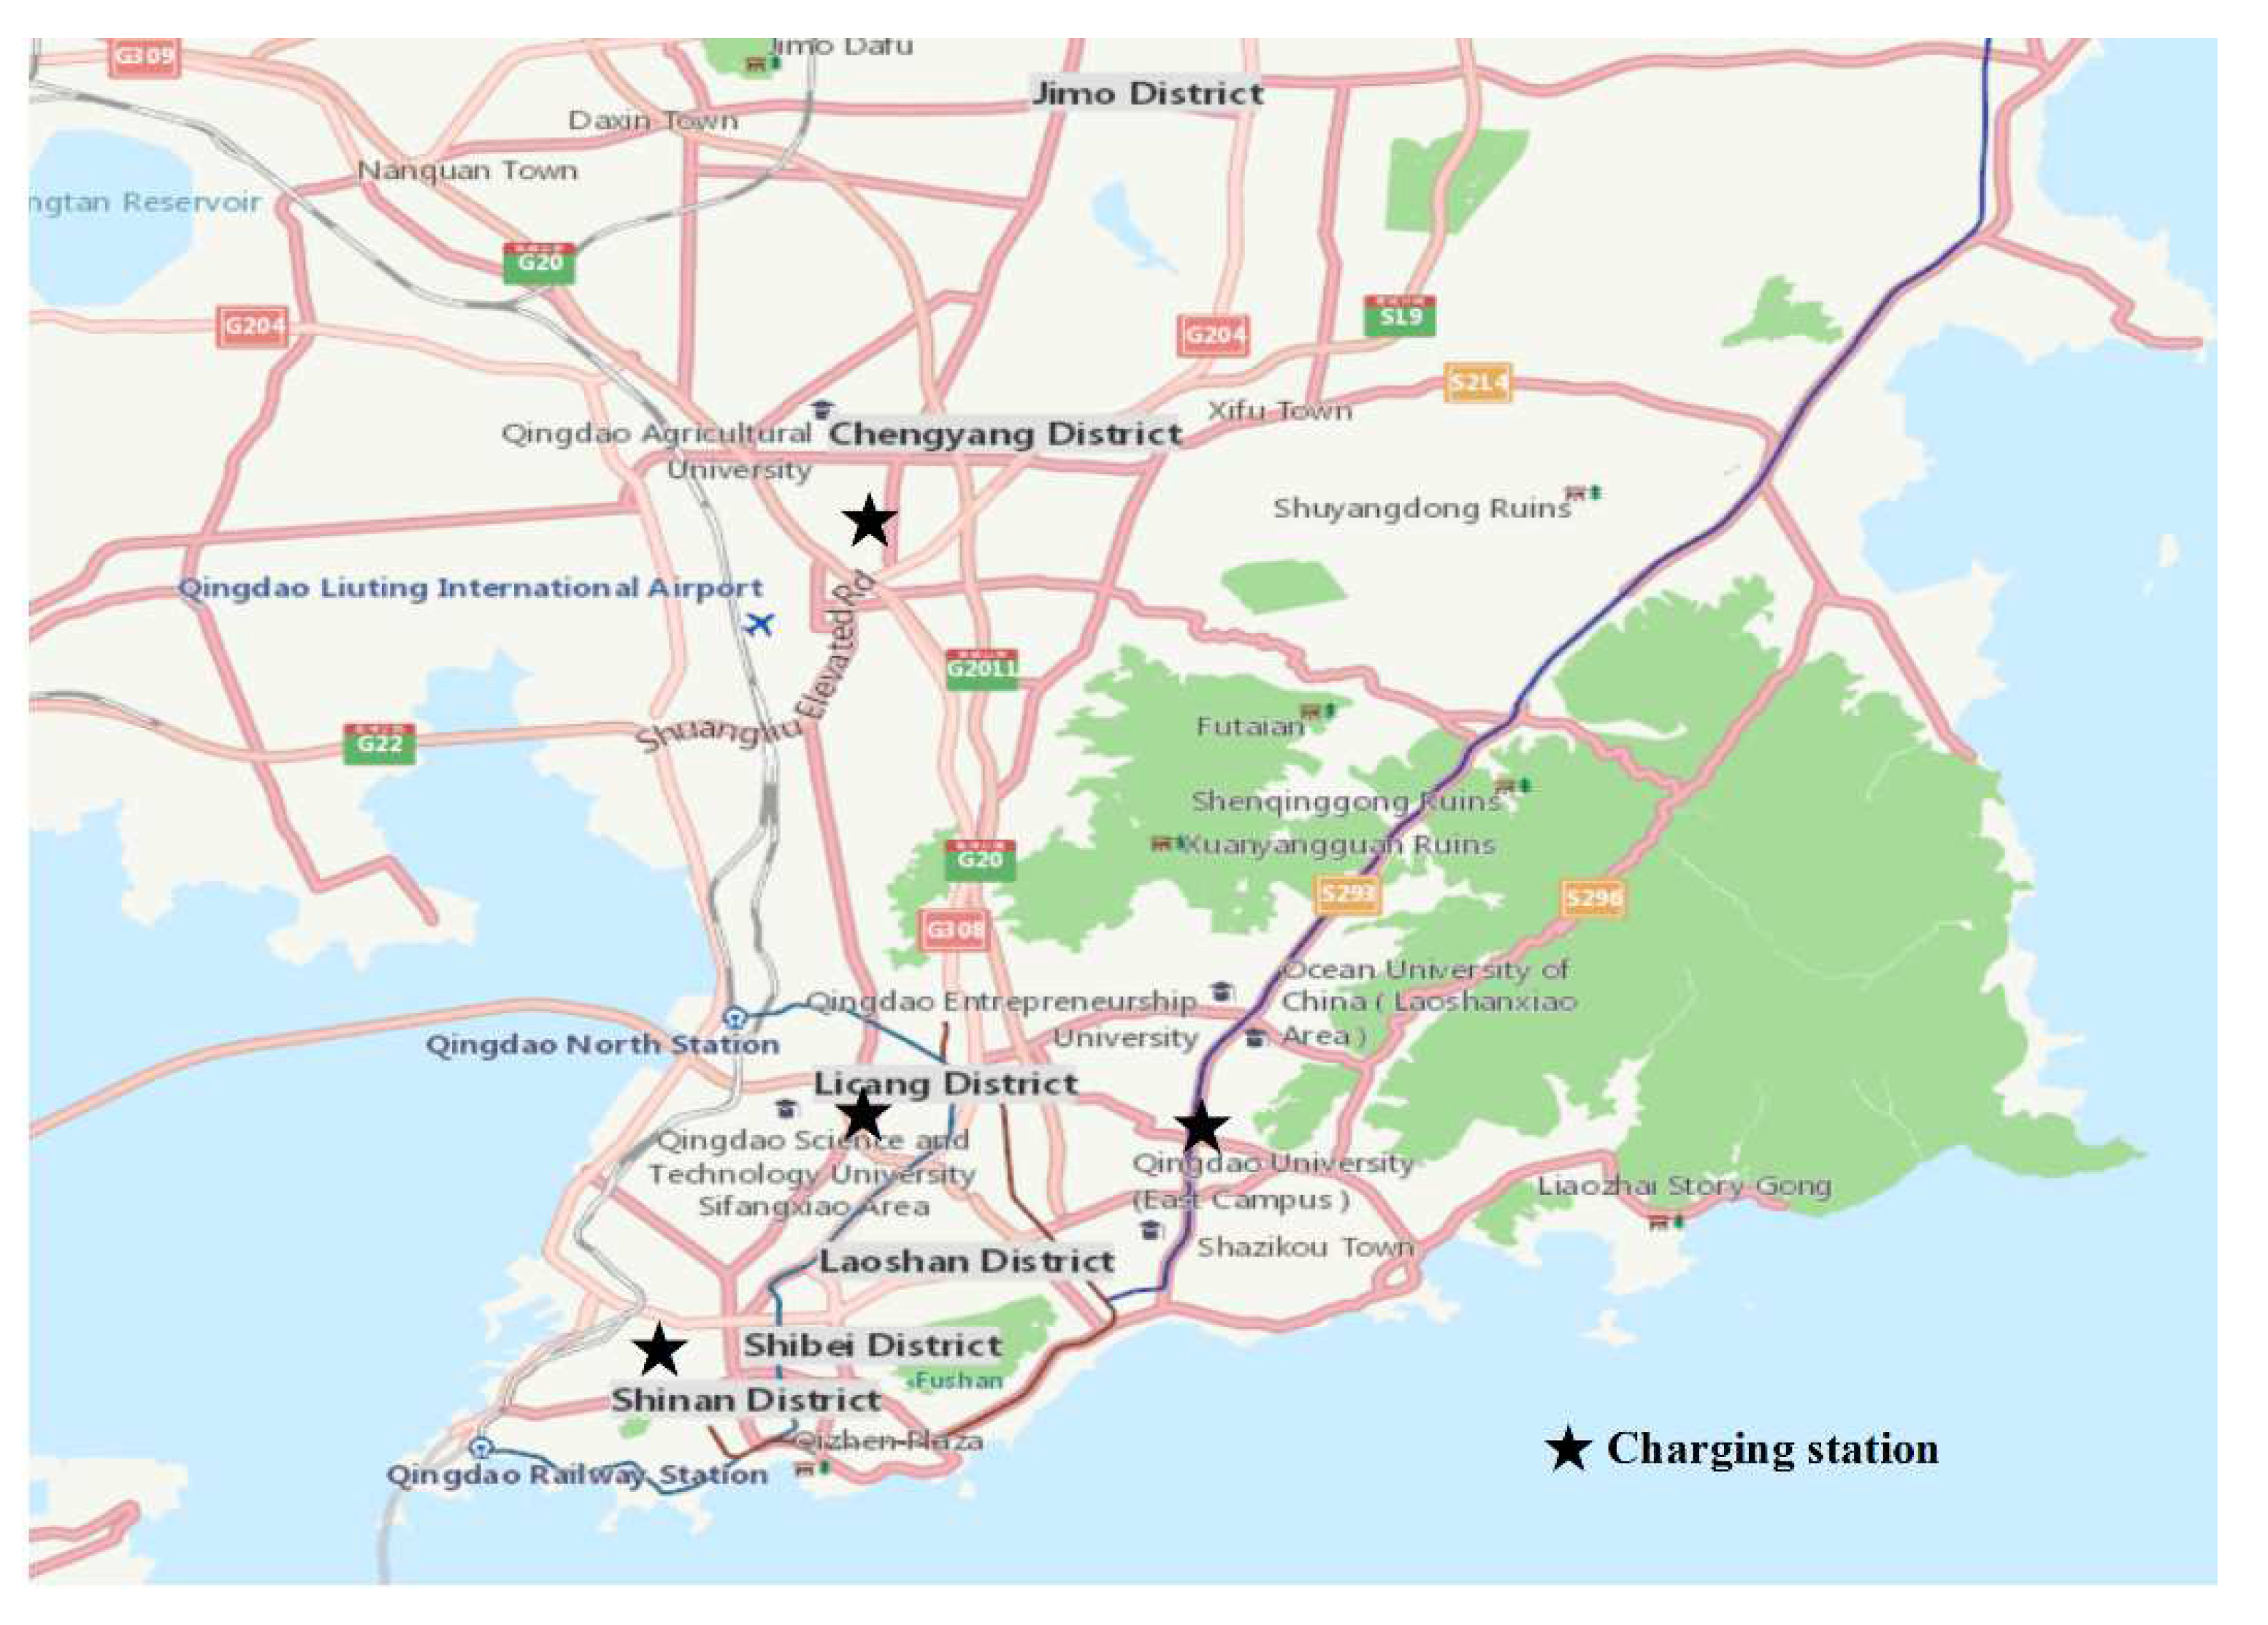
Figure 7 shows the best locations of charging stations obtained by the multiple same-type clustering algorithms. As can be seen from
Figure 7, charging stations are located in the economic and residential centers of Shibei District, Licang District, Laoshan District, and Chengyang District, respectively. However, the small number of charging stations may cause long queues of electric taxis and reduce drivers’ satisfaction with charging, while the long queues may cause traffic congestion problems around the charging stations. Therefore, it is necessary to further deal with.
4.2. Location Results of Multiple Multi-Type Clustering Algorithms
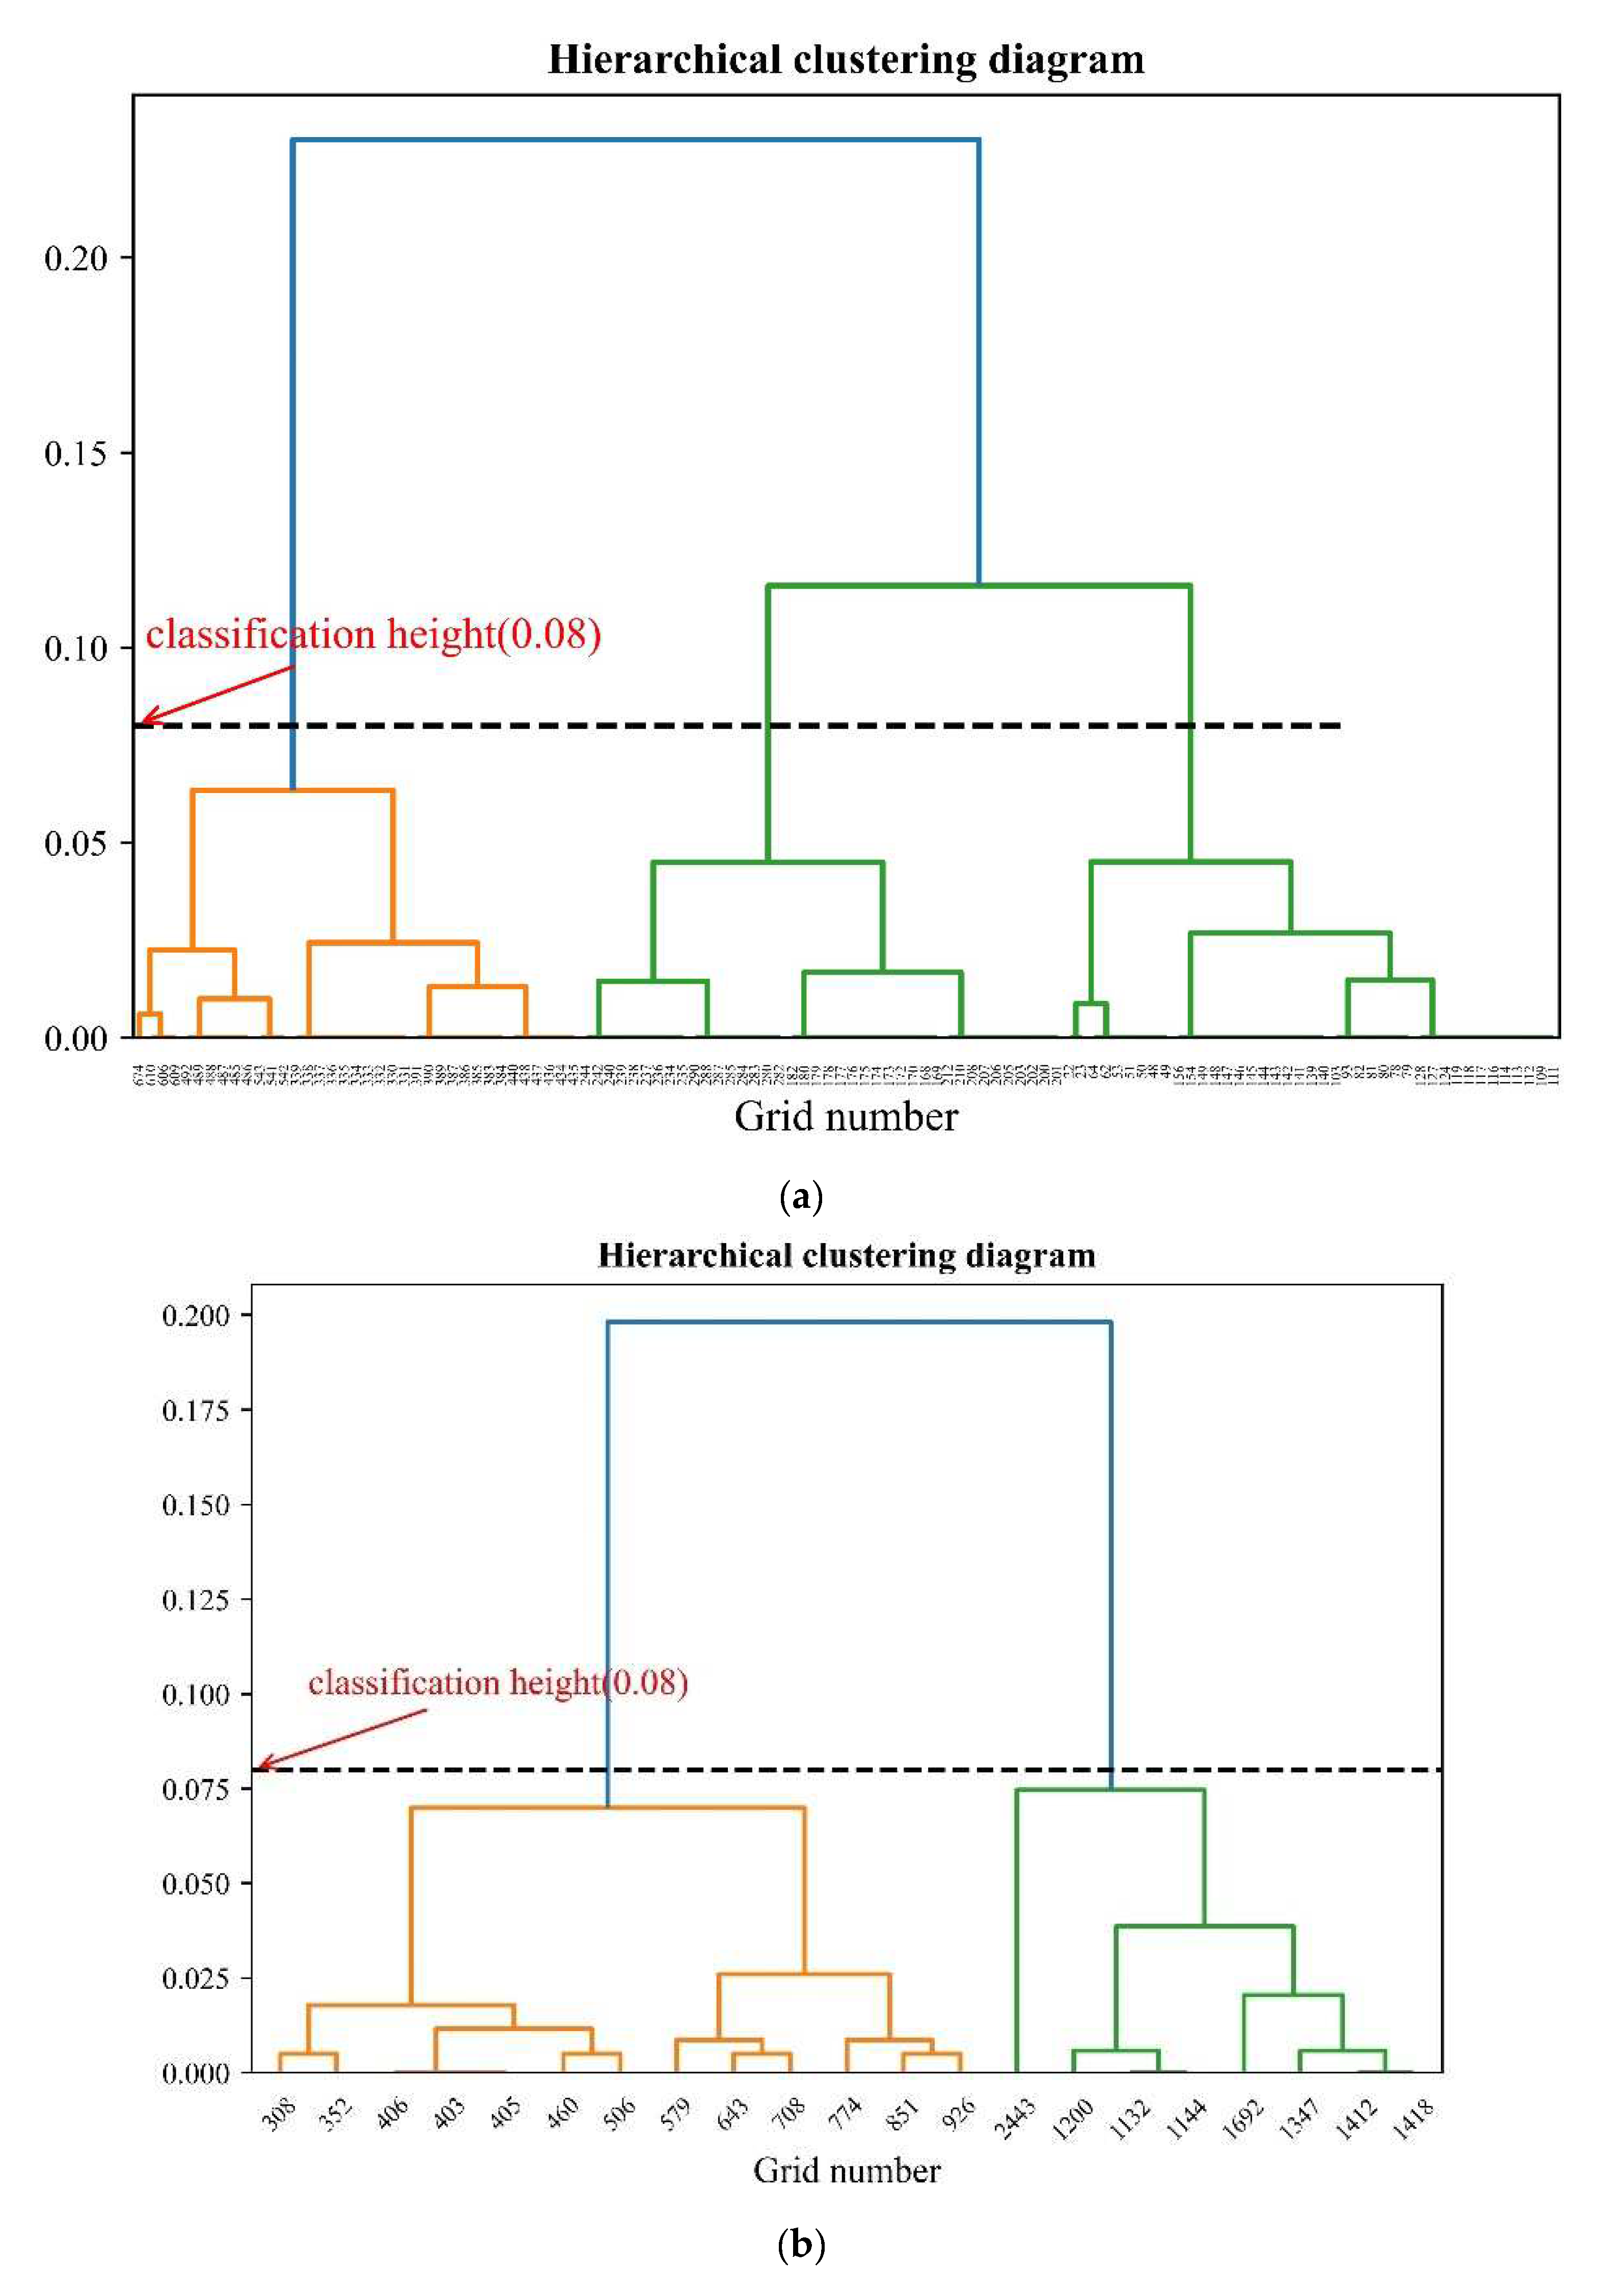
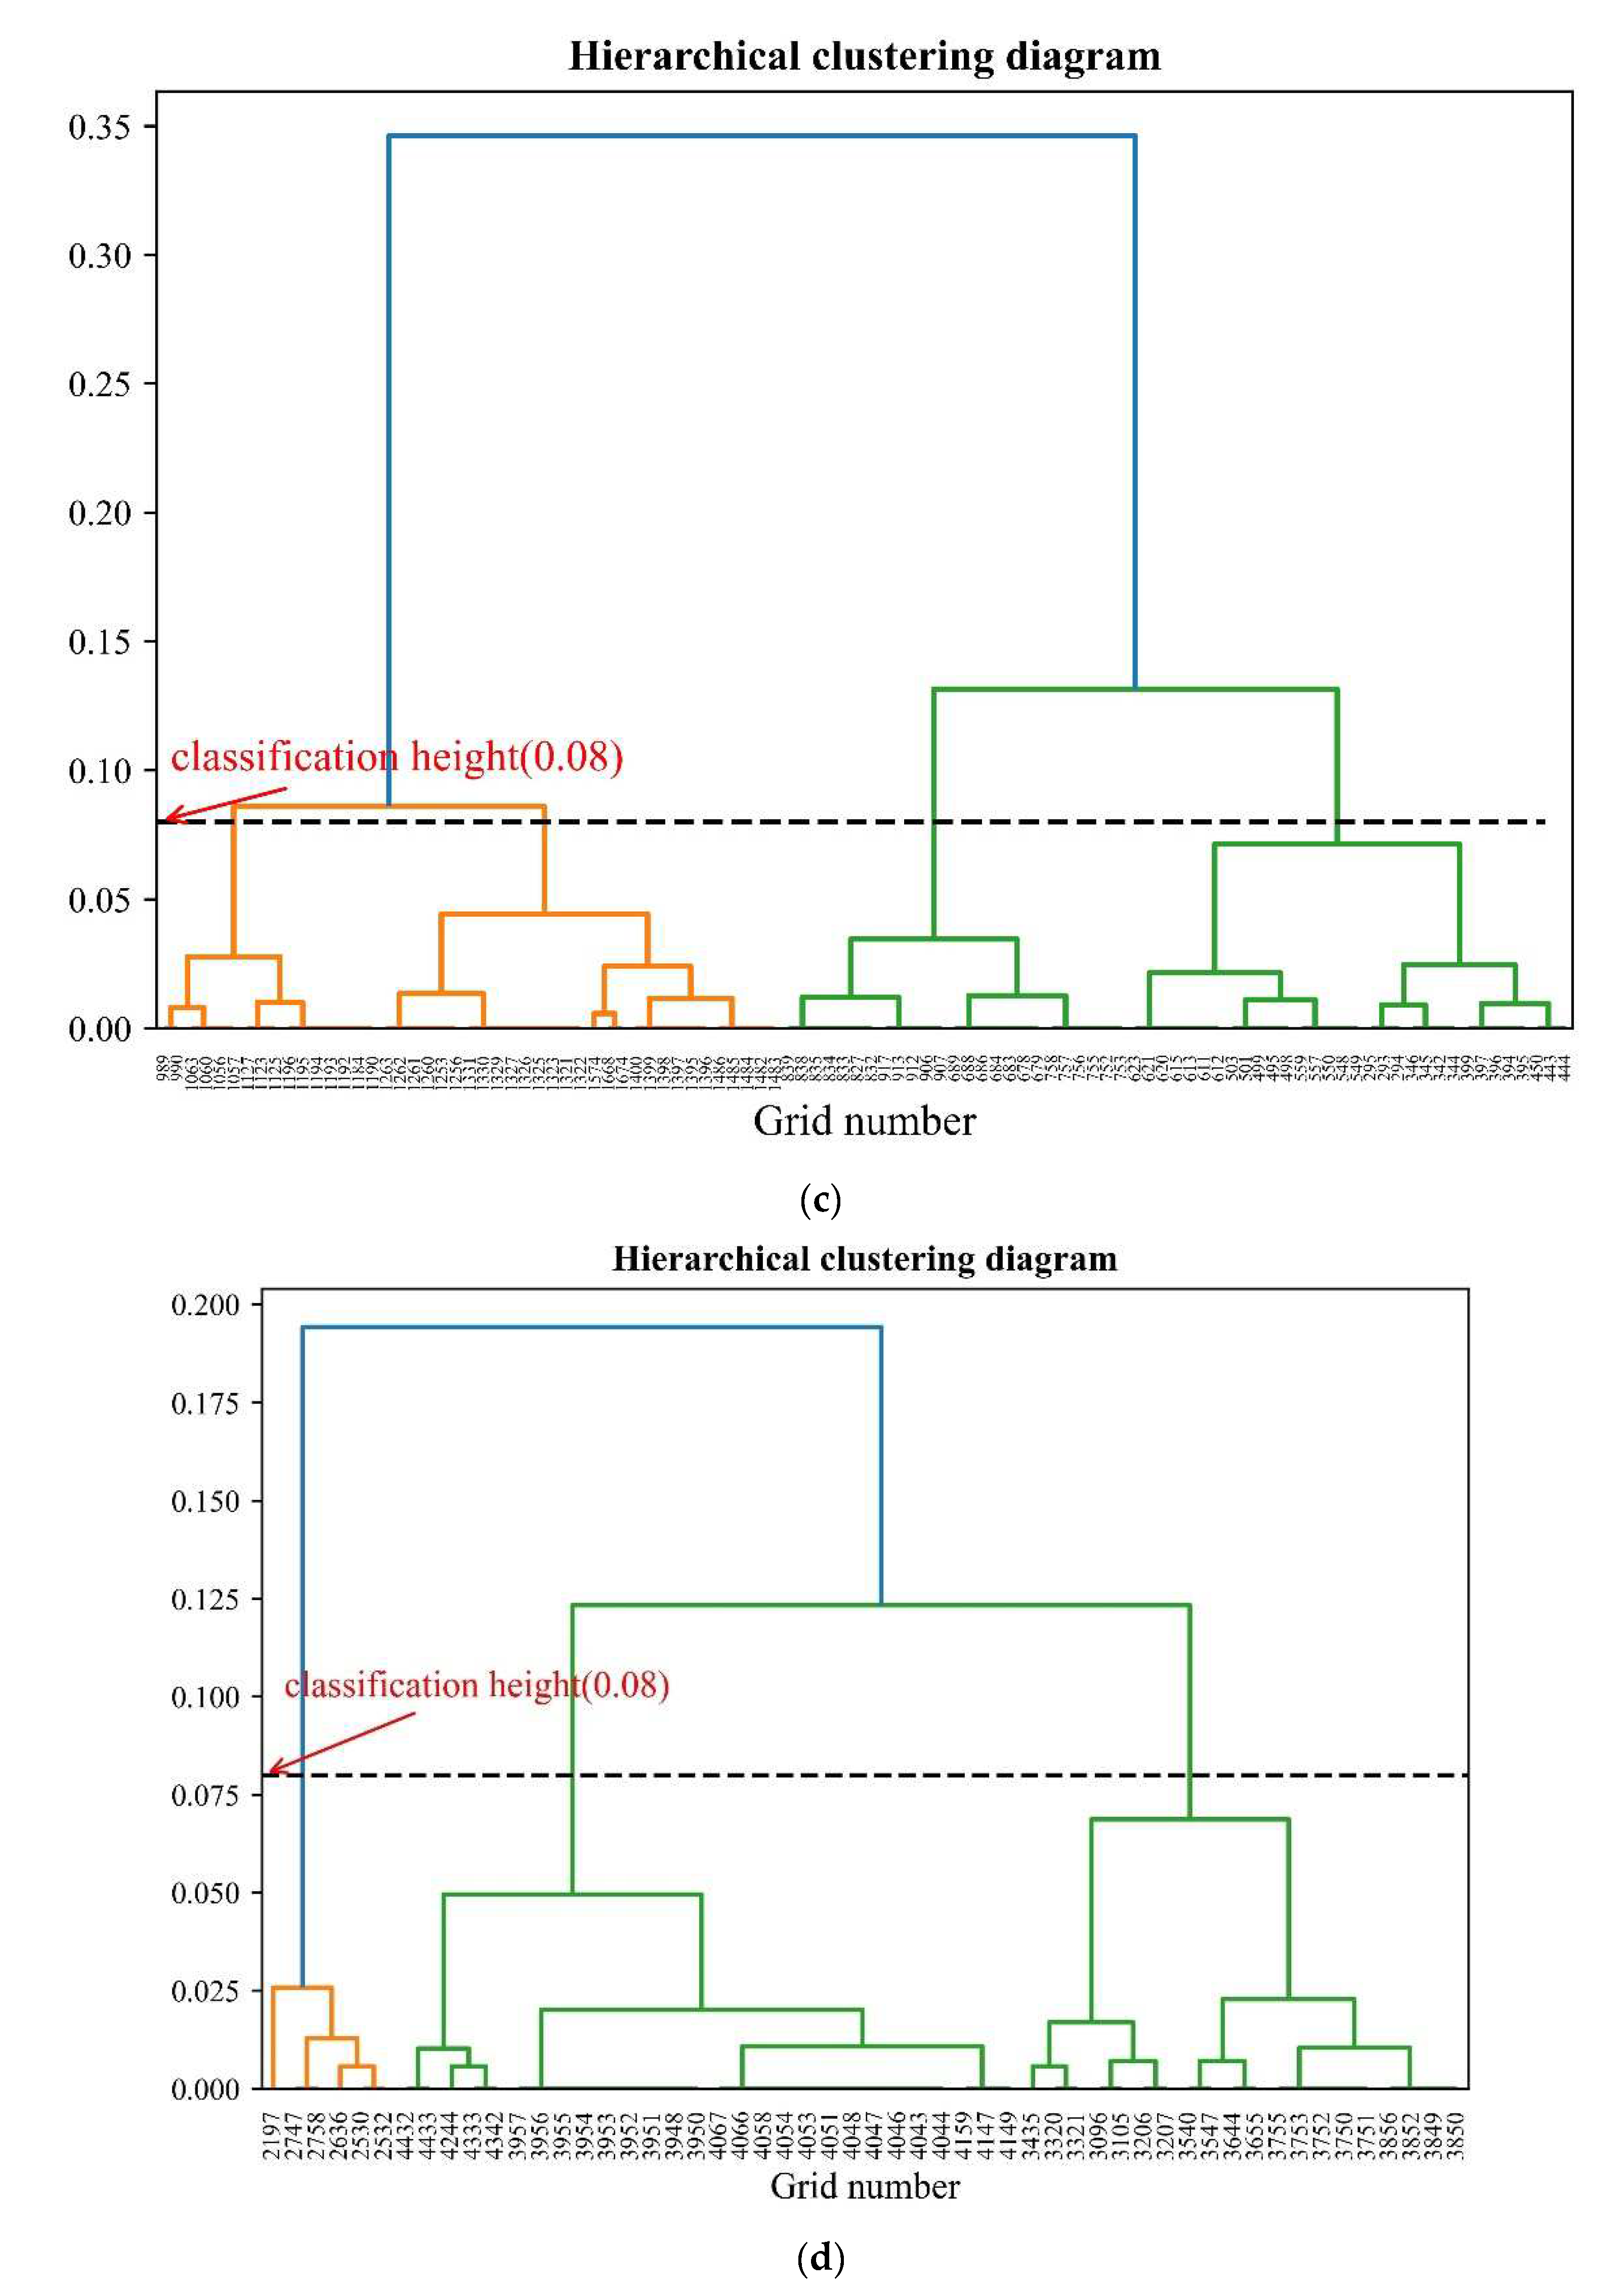
Based on the results of K-means clustering, a two-step clustering method (agglomerative hierarchical clustering and K-means weighted clustering) is used to optimize the location of charging stations. Firstly, agglomerative hierarchical clustering is performed on the sample grid data of each class obtained by K-means clustering, and a relative distance of 0.08 is selected to classify the grid.
Figure 8 shows the tree diagram obtained by agglomerative hierarchical clustering for each of the 4 classes of sample grid data. The black dotted line in the tree diagram represents the relative height of 0.08, which is used to divide the results of agglomerative hierarchical clustering.
Figure 8a shows the agglomerative hierarchical clustering result of category 1. The grids in the sample are basically located in the southern parts of Shinan District and Shibei District. The areas of the two urban areas are relatively small, but the daily vehicle flow is large and the number of grids is large, so it is divided into 3 categories.
Figure 8b shows the agglomerative hierarchical clustering result of category 2. Most of the grids in the sample are located in Laoshan District, and the distance between grids is long, so it is divided into 2 categories.
Figure 8c shows the agglomerative hierarchical clustering results of category 3. The grids in the sample are mostly located in the northern part of Licang District and Shibei District, the location between grids is close and the number of grids is large, which indicates that the charging demand of electric vehicles in this area is large. So it is divided into 4 categories.
Figure 8d shows the agglomerative hierarchical clustering result of category 4. The grids in the sample are basically located in Chengyang District. Most grids are densely located, and some grids are scattered around, so it is divided into 3 categories. After performing agglomerative hierarchical clustering on grid samples, all sample grid data are divided into 12 categories.
The 12 categories of data obtained by the agglomerative hierarchical clustering method are respectively subjected to K-means weighted clustering (
) to obtain 12 cluster centers, which are the optimal locations of charging stations. The 12 cluster centers and the corresponding intra-class weighted Euclidean distance sums are shown in
Table 5, and the final overall weighted Euclidean distance sum is 16.1.
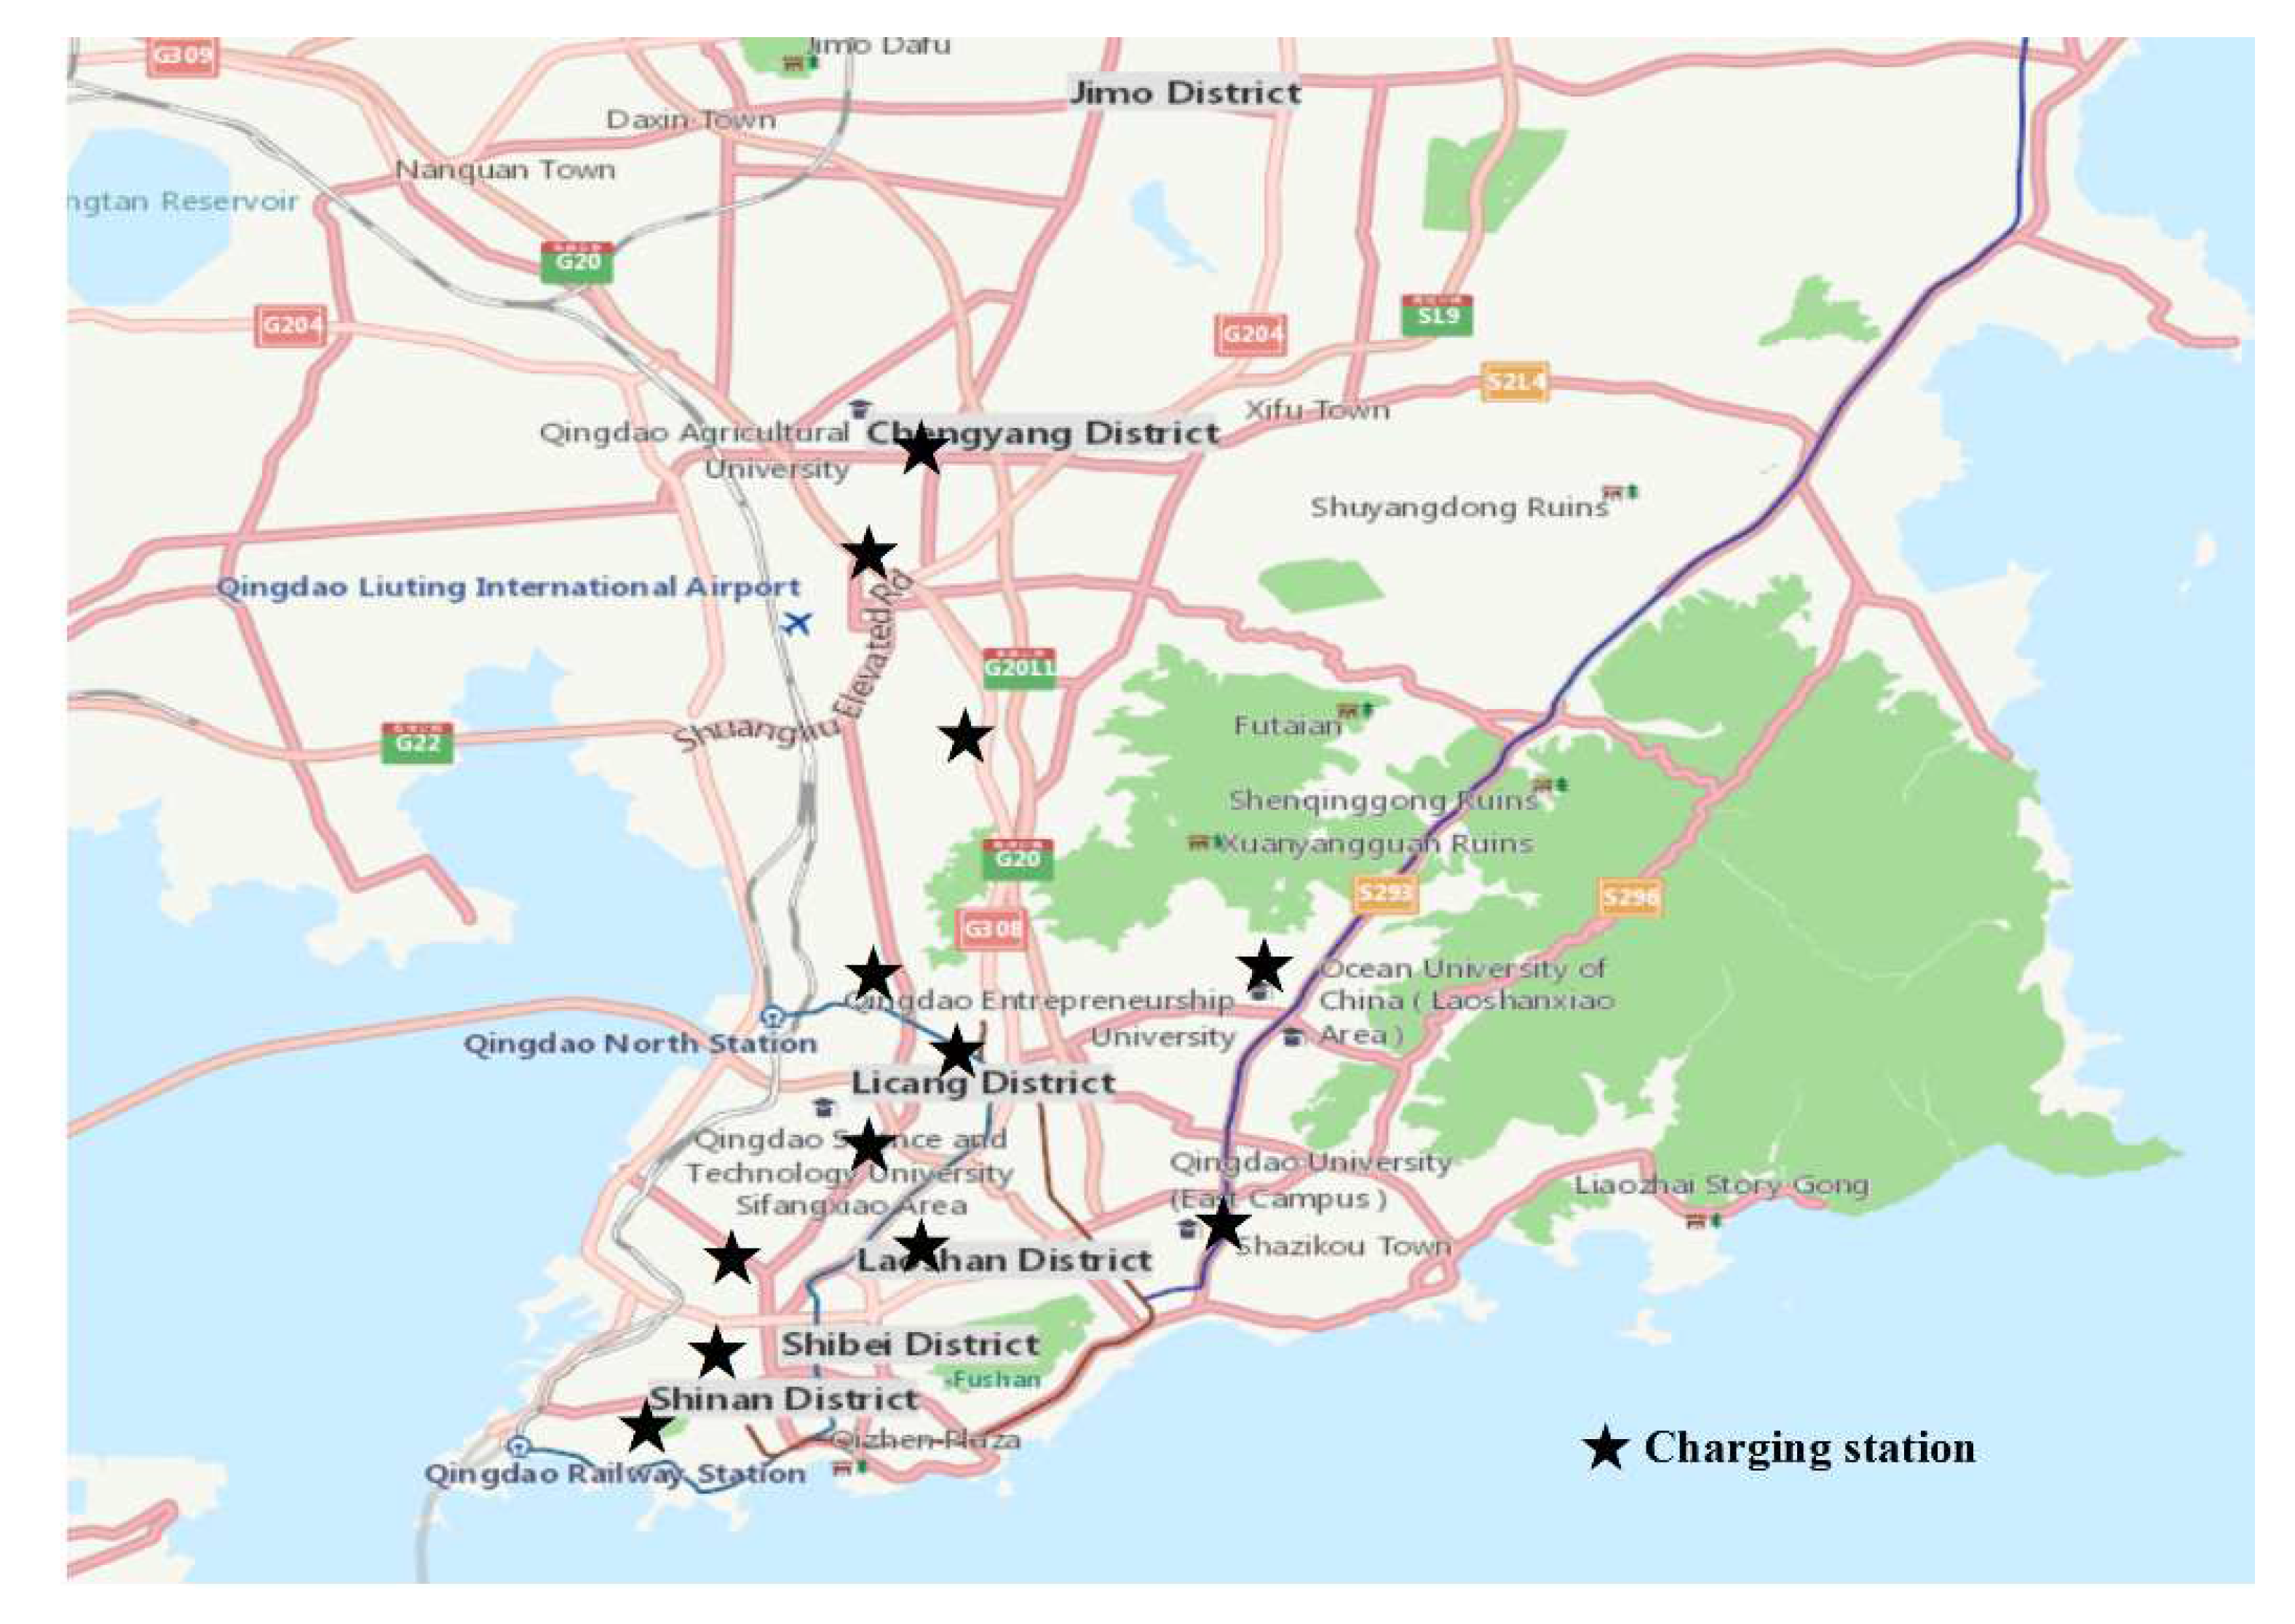
Figure 9 shows the optimal layout of charging stations obtained by the two-step clustering method. It can be seen from
Figure 9 that the location of the charging station matches the grid with many dwell events, which meets the charging demand of electric vehicles. Compared to Laoshan District and Chengyang District, the number of charging stations in Shinan District, Shibei District, and Licang District is higher. This is because the three areas are densely populated with residential areas, commercial areas, scenic spots, and high population density, resulting in high traffic flow, many dwell events, and a high charging demand for electric vehicles.
4.3. Results Analysis
By comparing the overall weighted Euclidean distance sum obtained by the multiple same-type clustering algorithms and the multiple multi-type clustering algorithms, it can be seen that the multiple multi-type clustering algorithms effectively reduces the overall weighted Euclidean distance sum. That is, they reduce the traveling distance from the electric vehicle to the charging station, save the travel time of the electric vehicle driver, and increase the operating time. From
Figure 7 and
Figure 9, it can be found that the location and layout of the charging station in
Figure 9 is more reasonable, which can meet the charging demand of electric vehicles as much as possible and achieve the goal of optimizing the location of the charging station. Meanwhile, it can be seen that the multiple multi-type algorithms proposed in this paper are better than the multiple same-type clustering algorithms in the application of charging station locations, which provides a new method for future charging station locations.
5. Conclusions
This paper takes the gridded map of five major municipal districts of Qingdao (Shinan District, Shibei District, Licang District, Chengyang District, and Laoshan District) as the research area, extracts the number of vehicles in each grid with a dwell time of more than 20 min, based on the GPS trajectory data of gasoline taxis in the five main municipal districts, and takes the grid with the number of dwell events no less than 4. Assuming that the geometric center of each grid and the number of dwell events, respectively, represent the location of the grid and the charging demand of electric taxis. Then, the location of charging stations is selected using the clustering method. Based on the geographic location among grids, multiple same-type clustering algorithms and multiple multi-type clustering algorithms are performed for all grids separately. Finally, the overall intra-class weighted Euclidean distance sum obtained by the multiple same-type clustering method is 24.1, and the overall intra-class weighted Euclidean distance sum obtained by the multiple multi-type clustering method is 16.1, which indicates that the overall weighted Euclidean distance sum obtained by the multiple multi-type clustering algorithms is significantly smaller than that of the multiple same-type clustering algorithms, reducing the traveling time of electric taxis. The location selection result of the multiple multi-type clustering algorithms is more reasonable than that of the multiple same-type clustering algorithms. This paper provides feasible suggestions and methods for the location and optimal layout of charging stations in five major municipal districts of Qingdao.
Currently, the market penetration rate of electric vehicles is increasing, and the reasonable layout of charging stations plays a positive role in the promotion of electric vehicles. The multiple multi-type clustering location selection method proposed in this paper provides a new solution for the optimal layout of urban charging stations. However, only the travel time of electric vehicle drivers is considered, and the trajectory data of gasoline taxis are used to simulate the trajectory of electric taxis, which has some errors in terms of station location. In future research, the cost problem can be considered, more clustering algorithms can be integrated, and GPS trajectory data of electric vehicles can be used to further improve the scientific and reasonable location of charging stations.


