
Employing Eye Tracking to Study Visual Attention to Live Streaming: A Case Study of Facebook Live


Abstract
:1. Introduction
- What is the order of fixation on the ROIs?
- What is the order of the attention span for the ROIs?
- What is the amount of dedicated fixation given to each ROI?
2. Related Work
2.1. Business Model and Studies of Live Ecommerce
2.2. Eye Tracking Technology and Related Studies
2.3. Eye Tracking Technology and Visual Attention
3. Research Method
3.1. Participants
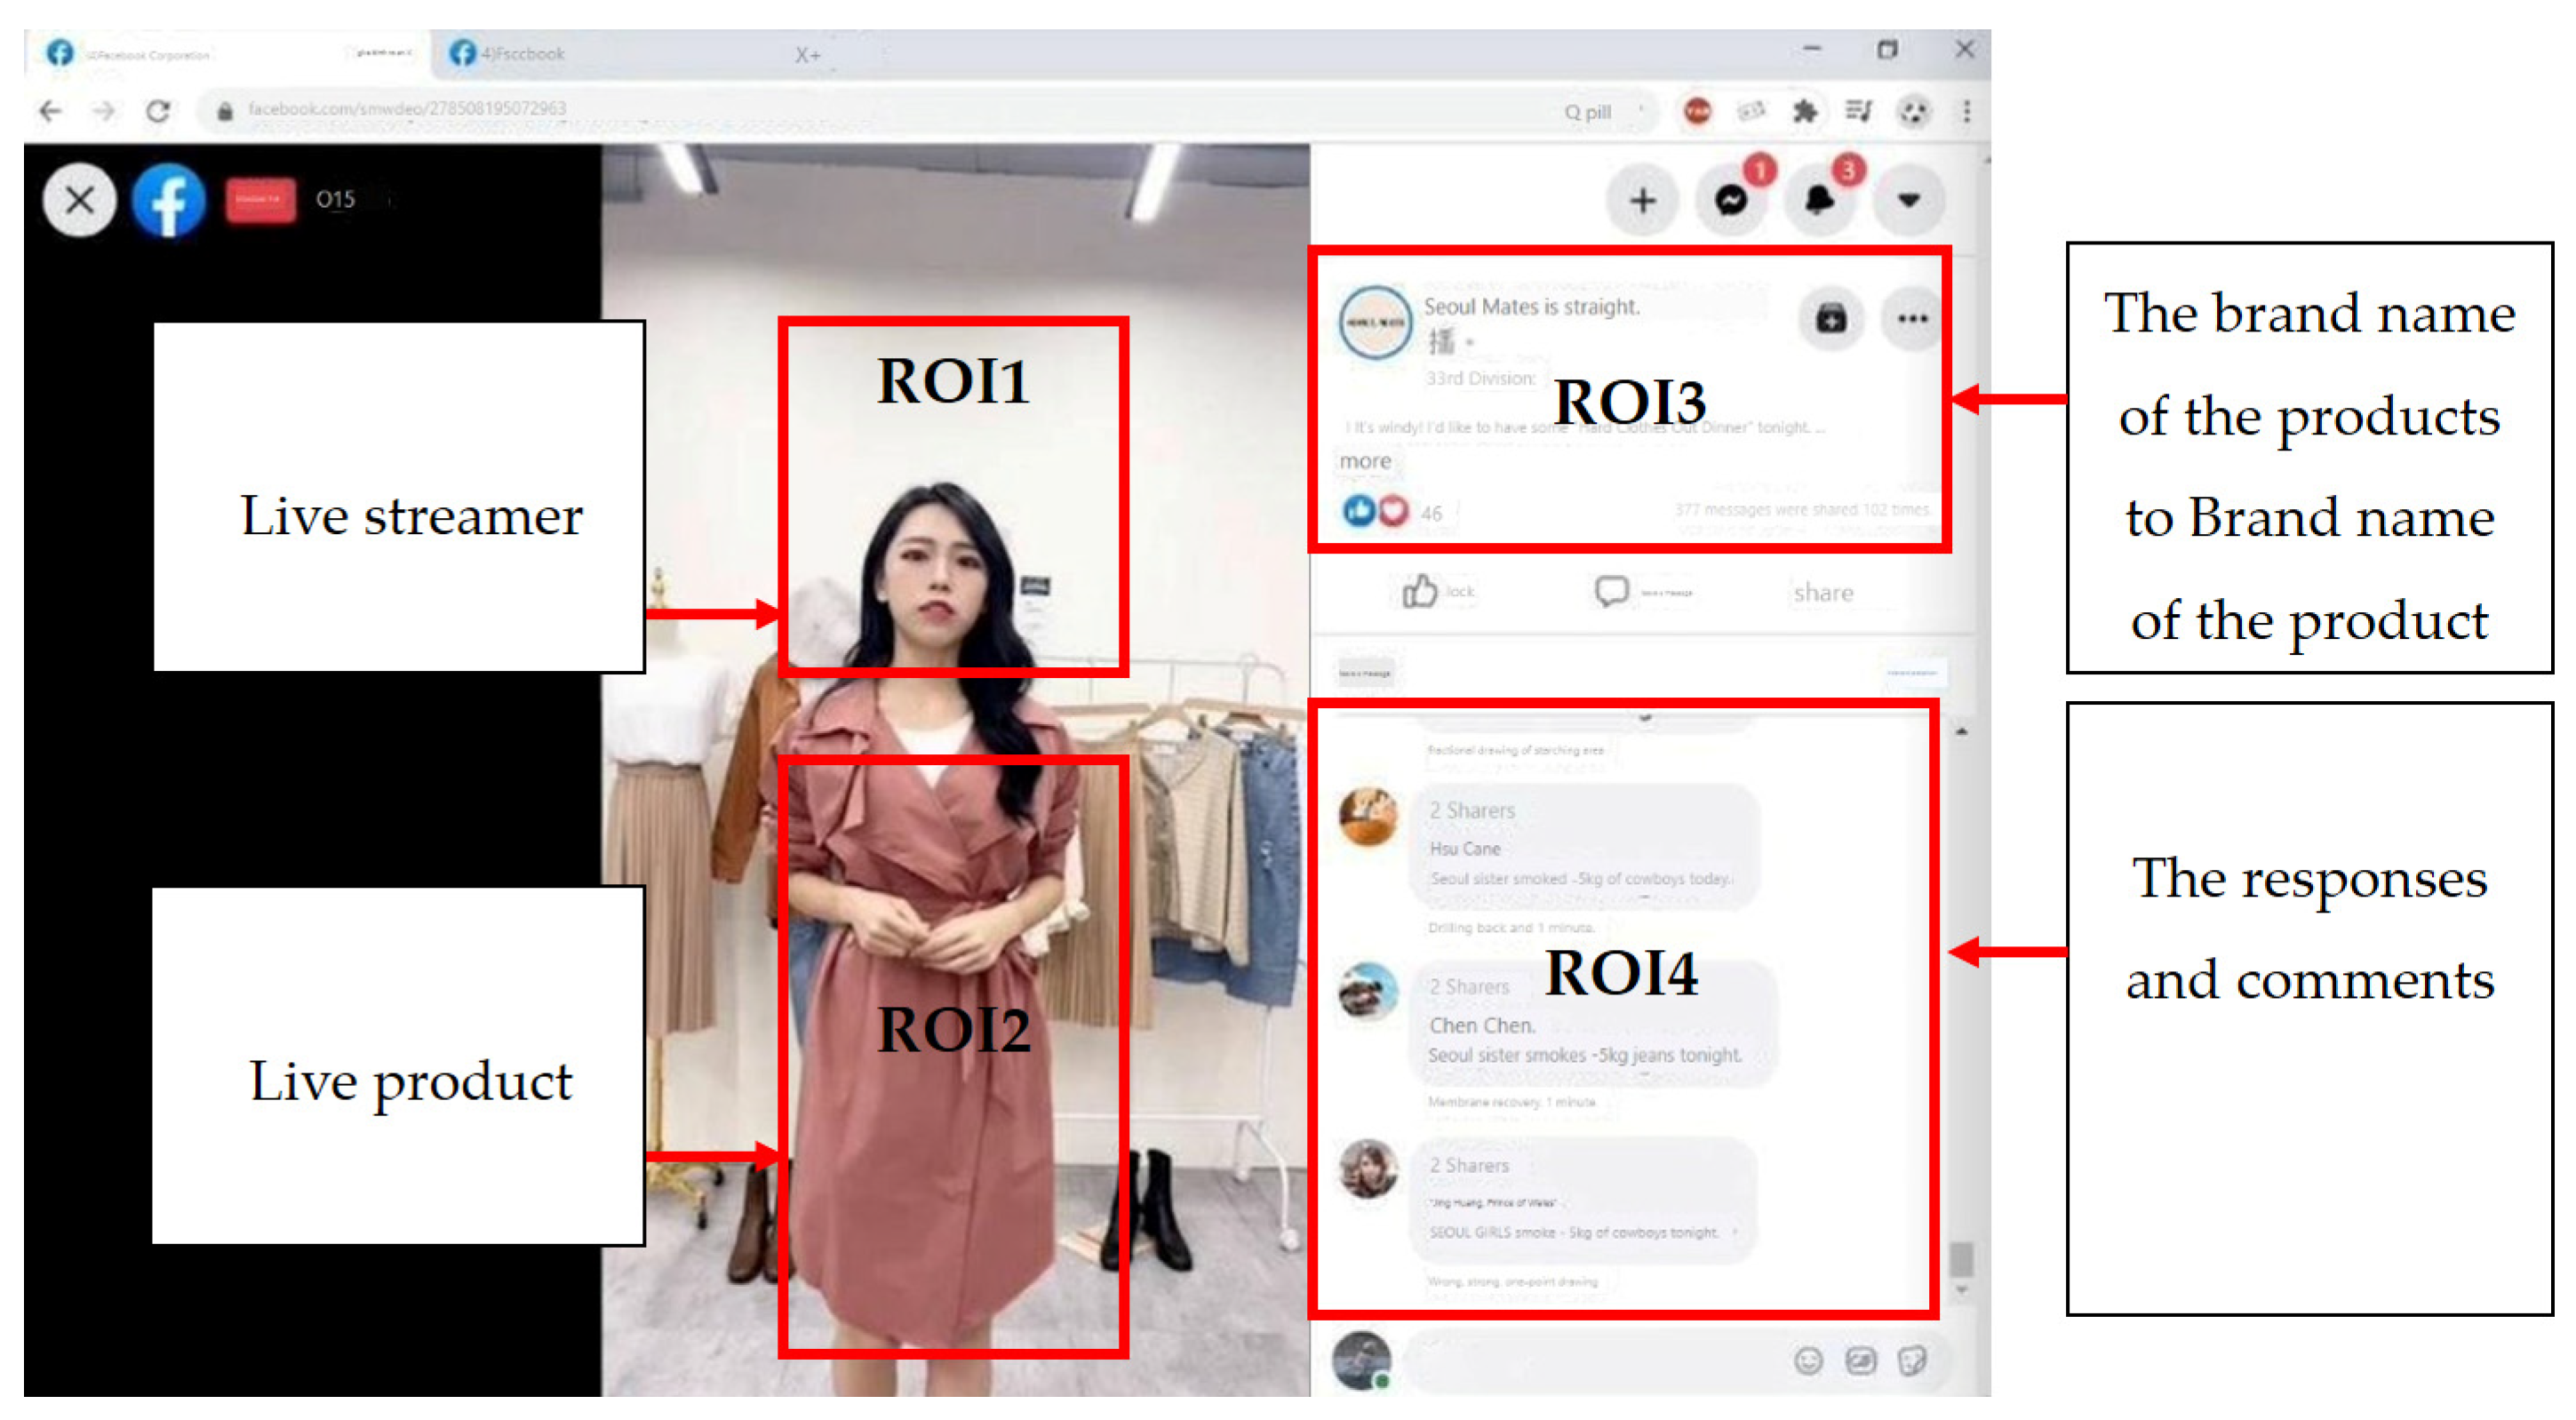
3.2. Stimuli
3.3. Experimental Design
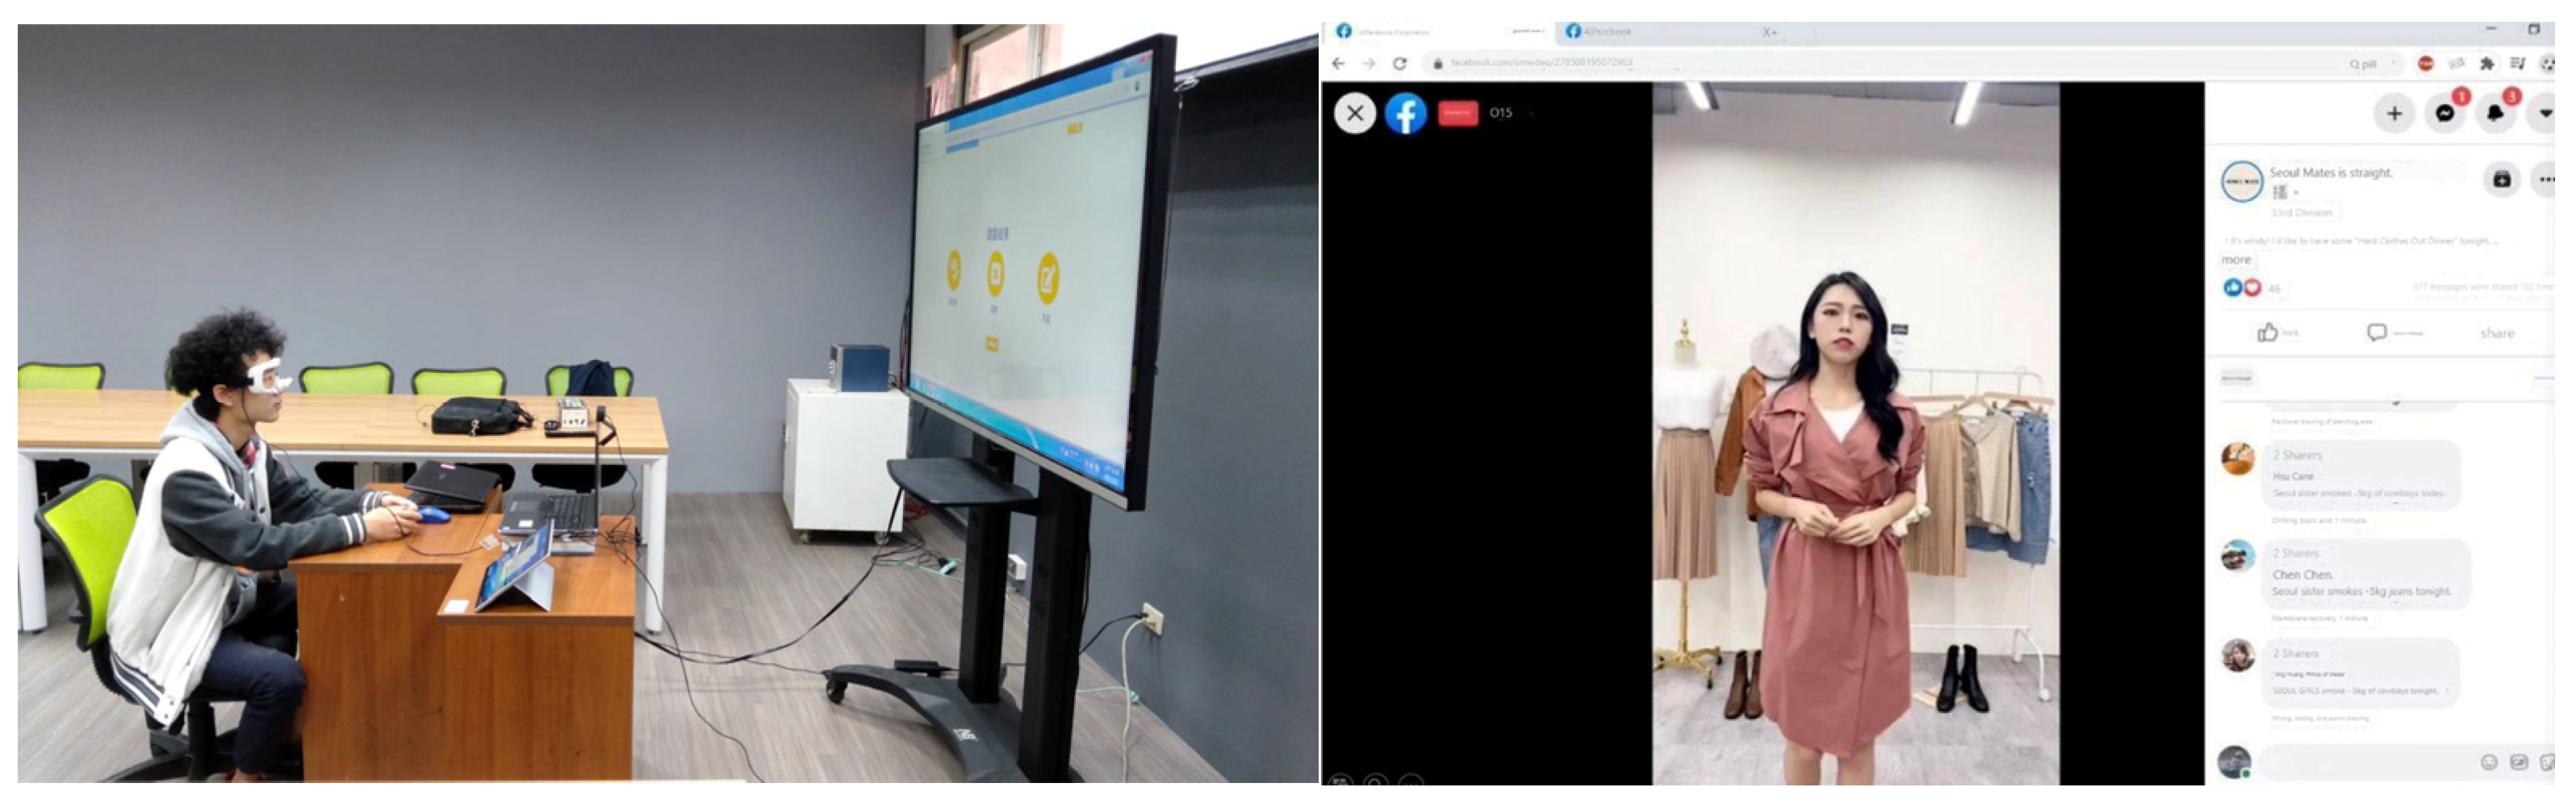
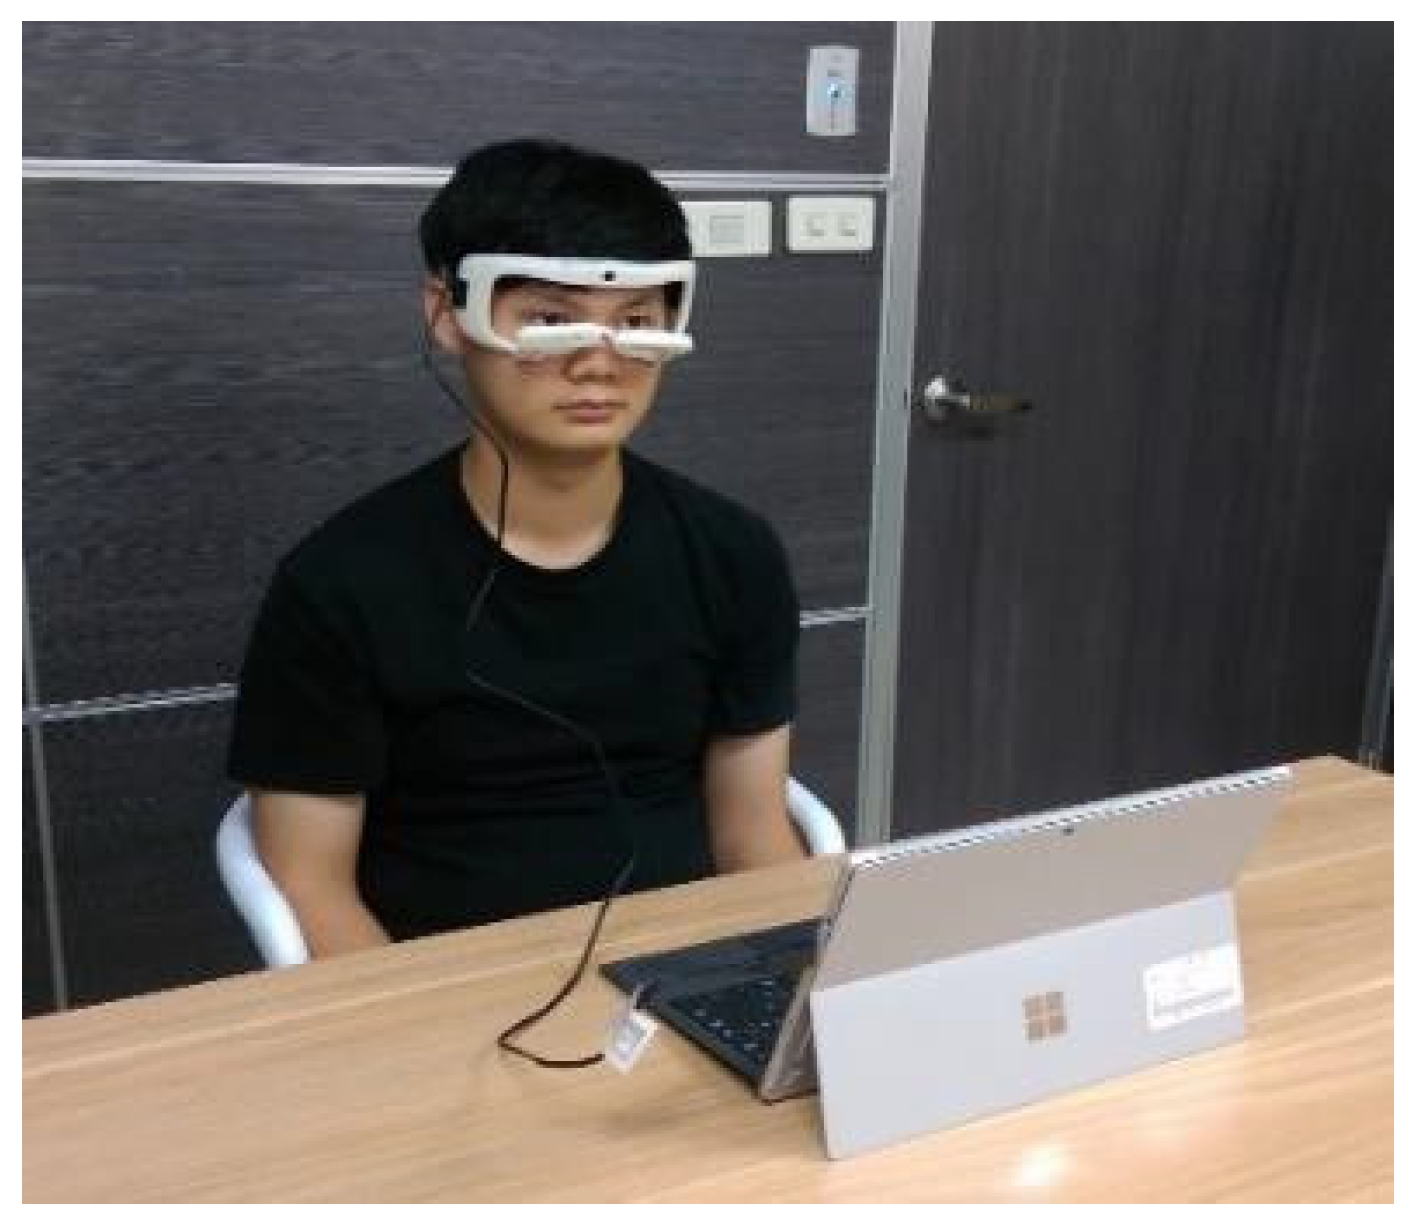
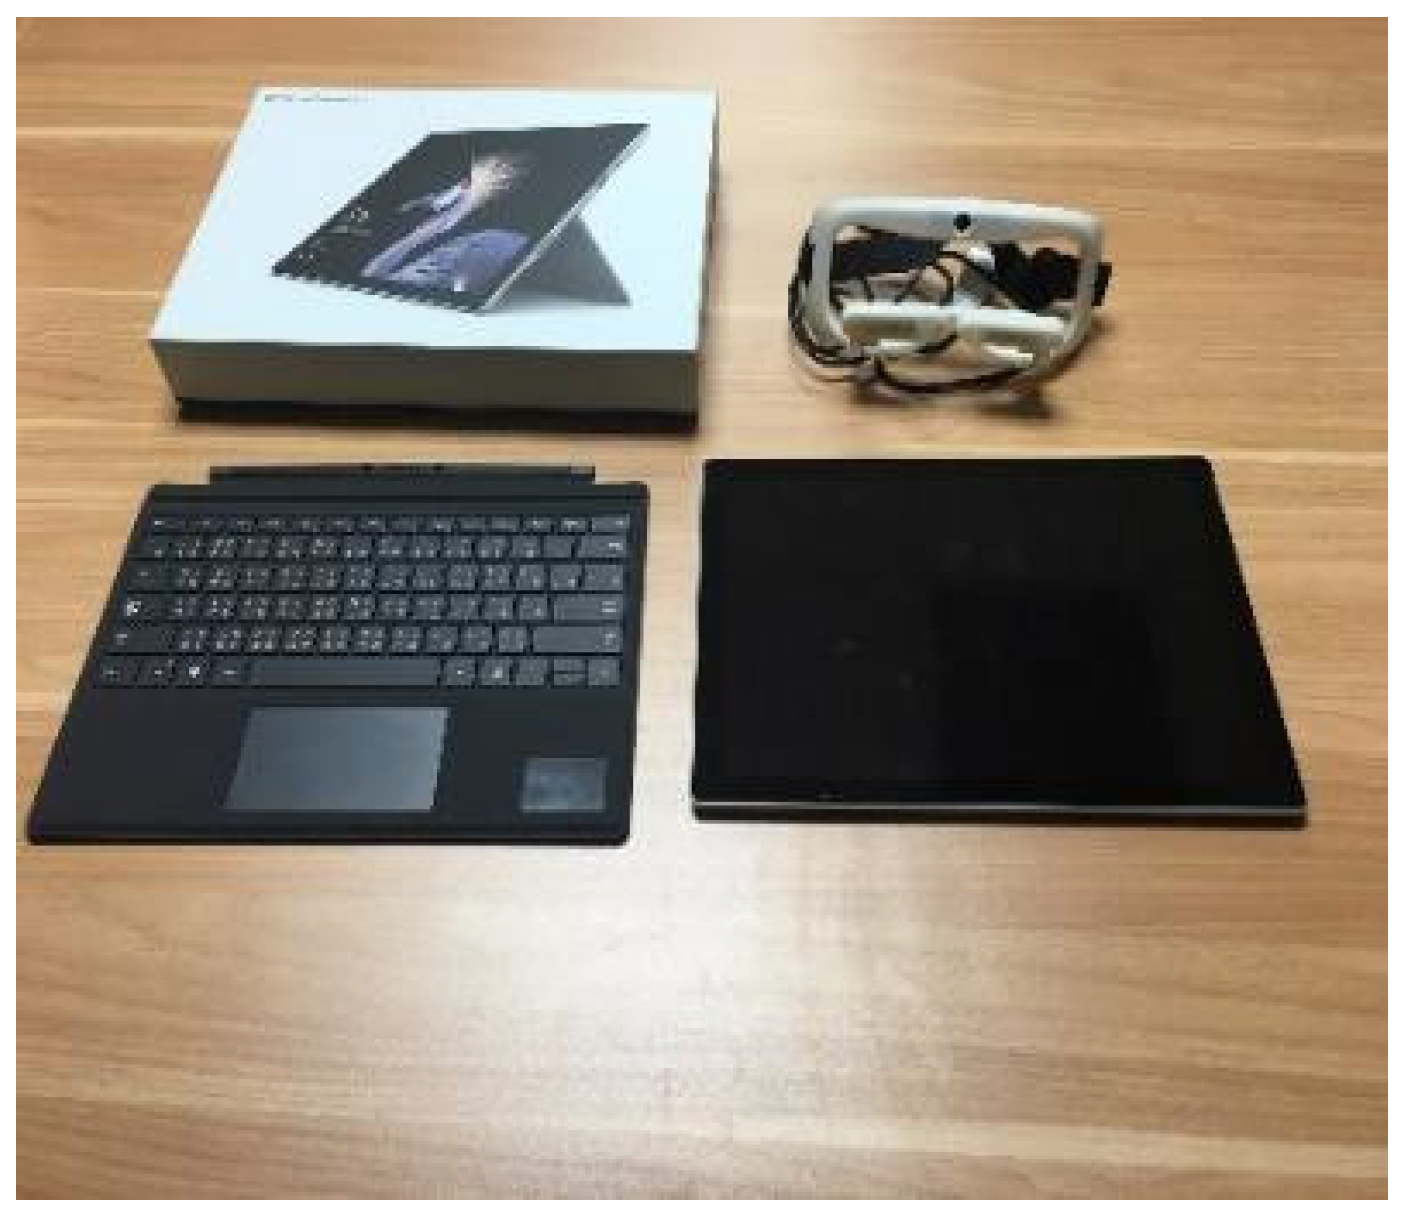
3.4. Experimental Instruments
3.5. Procedures
3.5.1. Experimental Process
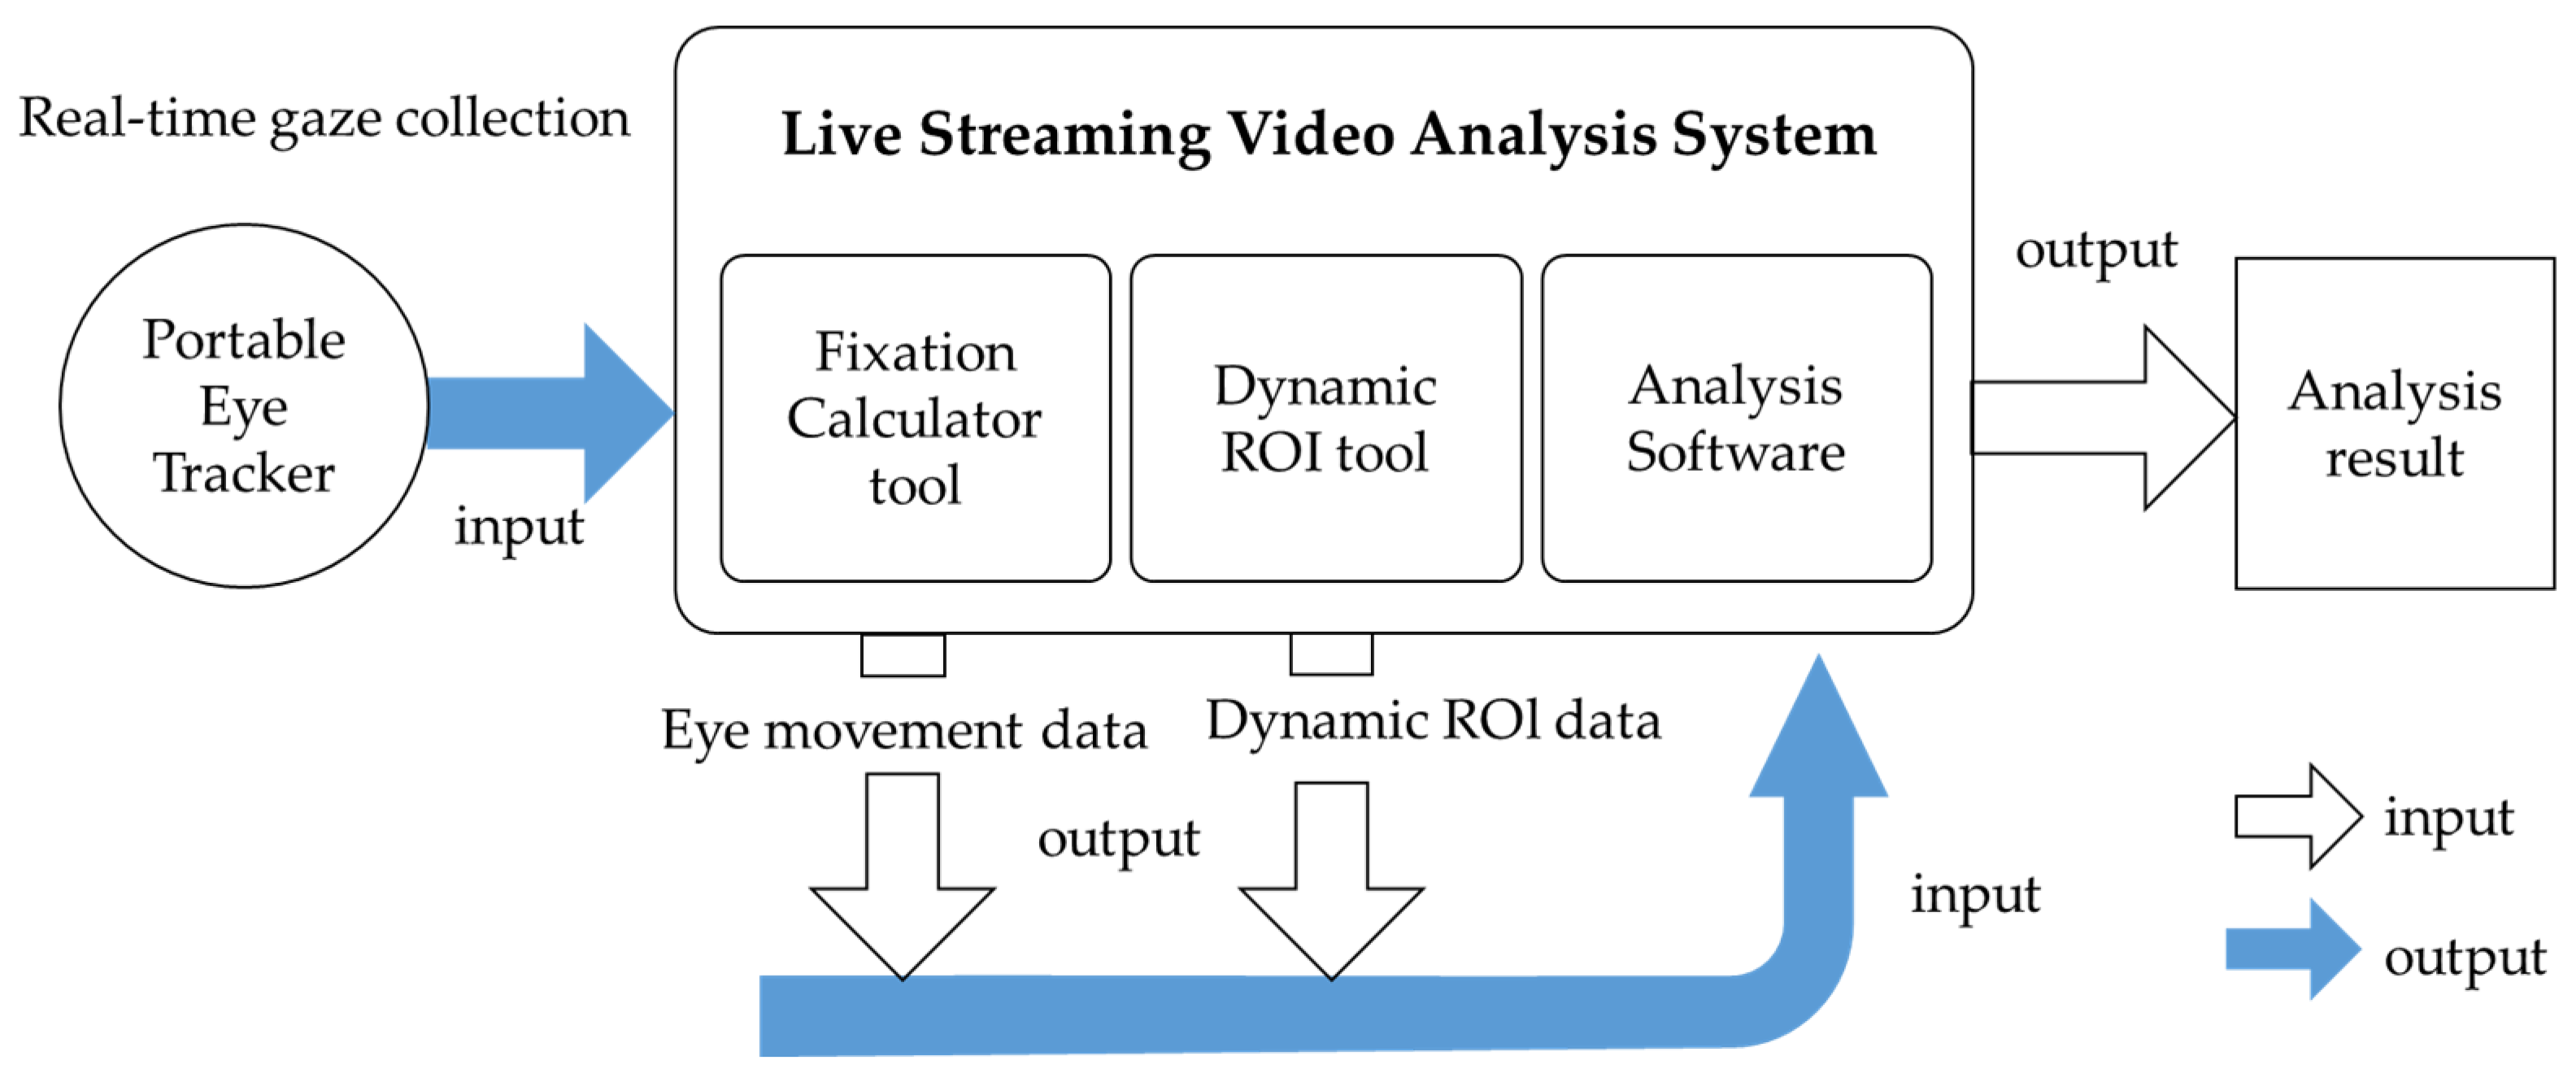
3.5.2. Eye Tracking Data Output (Output)
3.5.3. Data Collection and Analysis
- We imported the post-experimental motion pictures into the dynamic ROIs tool.
- We began to execute the pictures.
- We pressed the left mouse button, dragged the mouse to the region to be analyzed, and released the left mouse button to define the ROI.
- We repeated Step 3 according to the fixation calculator tool, and once all the ROIs were defined for the entire experiment, the information from all the ROIs could be used for the eye movement analysis.
3.5.4. Data Analysis
- LFF: The length of time elapsed from the beginning of the stimulus until the participant first looked at the defined ROI. The shorter the time elapsed, the faster it received attention.
- DFF: The amount of time the participant spent fixed on an ROI for the first time. The longer the fixation, the more attention this received. Therefore, the extent to which this ROI was attractive to the participants can be determined.
- TFD: The total amount of time the participant fixed on an ROI during the experiment, including the “DFF” and the “re-fixation” durations. TFD is often used to observe the participants’ visual attention or the extent to which they are interested in the ROI.
- NOF: The number of times a participant fixed on an ROI, during the experiment. The number of fixations reflects the importance of the ROI, and a higher number of fixations indicates that the ROI was more important to the participants or provided more cues to the participants.
- 1.
- What is the order of fixation on the ROIs?H1: The LFF of each participant was lowest for ROI1.
- 2.
- What is the order of the attention span for the ROIs?H2: The DFF of each participant was highest for ROI1.
- 3.
- What is the amount of dedicated fixation given to each ROI?H3: The sum of the TFD and NOF spent in each ROI was highest for ROI1.
4. Results and Discussion
4.1. Visual Attention by LFF and Sex
4.2. Visual Attention by DFF and Sex
4.3. Visual Attention by Sex Based on TFD and NOF
5. Conclusions and Suggestions
5.1. Conclusions
5.2. Suggestions and Research Limitations
Author Contributions
Funding
Institutional Review Board Statement
Informed Consent Statement
Data Availability Statement
Conflicts of Interest
References
- Gunawan, J.; Permatasari, P.; Tilt, C. Sustainable development goal disclosures: Do they support responsible consumption and production? J. Clean. Prod. 2020, 246, 118989. [Google Scholar] [CrossRef]
- Leal Filho, W.; Azul, A.M.; Brandli, L.; Özuyar, P.G.; Wall, T. Responsible Consumption and Production. Encyclopedia of the UN Sustainable Development Goals; Springer: Cham, Switzerland, 2020. [Google Scholar]
- Katila, P.; Colfer, C.J.P.; de Jong, W.; Galloway, G.; Pacheco, P.; Winkel, G. SDG 12: Responsible Consumption and Production—Potential Benefits and Impacts on Forests and Livelihoods. Sustainable Development Goals: Their Impacts on Forests and People; Cambridge University Press: Cambridge, UK, 2019; pp. 386–418. [Google Scholar]
- Franco, I.B.; Newey, L. SDG 12 Responsible Consumption and Production. In Actioning the Global Goals for Local Impact. Science for Sustainable Societies; Franco, I., Chatterji, T., Derbyshire, E., Tracey, J., Eds.; Springer: Singapore, 2020. [Google Scholar]
- Jubin, J.J.; Clare, D.; Tim, M.; Stephen, S. Synergistic Interactions of SDGs in Food Supply Chains: A Review of Responsible Consumption and Production. Sustainability 2021, 13, 8809. [Google Scholar]
- Whitson, J.; French, M. Productive play: The shift from responsible consumption to responsible production. J. Consum. Cult. 2021, 21, 14–33. [Google Scholar] [CrossRef]
- Ameli, M.; Esfandabadi, Z.S.; Sadeghi, S.; Ranjbari, M.; Zanetti, M.C. COVID-19 and Sustainable Development Goals (SDGs): Scenario analysis through fuzzy cognitive map modeling. Gondwana Res. 2022, in press. [CrossRef]
- Biasutti, M.; Frate, S. A validity and reliability study of the Attitudes toward Sustainable Development scale. Environ. Educ. Res. 2017, 23, 214–230. [Google Scholar] [CrossRef]
- Messner, D.; Nakicenovic, N.; Zimm, C.; Clarke, G.; Rockström, J.; Aguiar, A.P.; Boza-Kiss, B.; Campagnolo, L.; Chabay, I.; Collste, D.; et al. The Digital Revolution and Sustainable Development: Opportunities and Challenges-Report Prepared by the World in 2050 Initiative; International Institute for Applied Systems Analysis (IIASA): Laxenburg, Austria, 2019. [Google Scholar]
- Luers, B.A. The Missing SDG: Ensure the Digital Age Supports People, Planet, Prosperity & Peace; Inter Press Service: Rome, Italy, 2020; pp. 7–8. [Google Scholar]
- Alfonso, V.; Boar, C.; Frost, J.; Gambacorta, L.; Liu, J. E-commerce in the pandemic and beyond. BIS Bull. 2021, 36, 1–5. [Google Scholar]
- Liu, K.; Liu, B.; Xu, H.; He, Y.; Cao, Y. Research on E-Commerce Live Broadcasts Helping Poverty Alleviation under the Influence of the COVID-19: Take Xinhua County, Hunan Province as an Example. In Proceedings of the 2nd International Conference on Economic Management and Model Engineering (ICEMME), Chongqing, China, 20–22 November 2020; pp. 858–865. [Google Scholar]
- Guo, H.; Liu, Y.; Shi, X.; Chen, K.Z. The role of e-commerce in the urban food system under COVID-19: Lessons from China. China Agric. Econ. Rev. 2020, 13, 436–455. [Google Scholar] [CrossRef]
- Salem, M.A.; Nor, K.M. The effect of COVID-19 on consumer behaviour in Saudi Arabia: Switching from brick and mortar stores to E-Commerce. Int. J. Sci. Technol. Res. 2020, 9, 15–28. [Google Scholar]
- Addo, P.C.; Jiaming, F.; Kulbo, N.B.; Liangqiang, L. COVID-19: Fear appeal favoring purchase behavior towards personal protective equipment. Serv. Ind. J. 2020, 40, 471–490. [Google Scholar] [CrossRef] [Green Version]
- Chen, C.; Hu, Y.; Lu, Y.; Hong, Y. Everyone Can Be a Star: Quantifying Grassroots Online Sellers’ Live Streaming Effects on Product Sales. In Proceedings of the 52nd Hawaii International Conference on System Sciences, Grand Wailea, HI, USA, 8–11 January 2019; pp. 2548–2557. [Google Scholar]
- Cai, J.; Wohn, D.Y.; Mittal, A.; Sureshbabu, D. Utilitarian and Hedonic Motivations for Live Streaming Shopping. In Proceedings of the 2018 ACM International Conference on Interactive Experiences for TV and Online Video, Newark, NJ, USA, 26–28 June 2018. [Google Scholar]
- Chen, A.; Lu, Y.; Wang, B. Customers’ purchase decision-making process in social commerce: A social learning perspective. Int. J. Inf. Manag. 2017, 37, 627–638. [Google Scholar] [CrossRef]
- Chen, C.C.; Lin, Y.C. What drives live-stream usage intention? The perspectives of flow, entertainment, social interaction, and endorsement. Telemat. Inform. 2018, 35, 293–303. [Google Scholar] [CrossRef]
- Hilvert-Bruce, Z.; Neill, J.T.; Sjöblom, M.; Hamari, J. Social motivations of live-streaming viewer engagement on Twitch. Comput. Hum. Behav. 2018, 84, 58–67. [Google Scholar] [CrossRef] [Green Version]
- Hong, Z.; Yi, L. Research on the influence of perceived risk in consumer on-line purchasing decision. Phys. Procedia 2012, 24, 1304–1310. [Google Scholar] [CrossRef] [Green Version]
- Gajewski, A.S. A Qualitative Study of How Facebook Storefront Retailers Convert Fans to Buyers. Ph.D. Dissertation, Walden University, Minneapolis, MN, USA, 2013. [Google Scholar]
- Leeraphong, A.; Sukrat, S. How Facebook Live Urge SNS Users to Buy Impulsively on C2C Social Commerce? In Proceedings of the 2nd International Conference on E-Society, E-Education and E-Technology, Taipei, Taiwan, 13–15 August 2018; pp. 68–72. [Google Scholar]
- Huang, Z.; Benyoucef, M. The effects of social commerce design on consumer purchase decision-making: An empirical study. Electron. Commer. Res. Appl. 2017, 25, 40–58. [Google Scholar] [CrossRef]
- Scheibe, K.; Fietkiewicz, K.J.; Stock, W.G. Information Behavior on Social Live Streaming Services. J. Inf. Sci. Theory Prat. 2016, 4, 6–20. [Google Scholar] [CrossRef] [Green Version]
- Skjuve, M.; Brandtzaeg, P.B. Facebook live: A mixed-methods approach to explore individual live streaming practices and motivations on Facebook. Interact. Comput. 2019, 31, 589–602. [Google Scholar] [CrossRef]
- Just, M.A.; Carpenter, P.A. Eye fixations and cognitive processes. Cogn. Psychol. 1976, 8, 441–480. [Google Scholar] [CrossRef]
- Just, M.A.; Carpenter, P.A. A theory of reading: From eye fixations to comprehension. Psychol. Rev. 1980, 87, 329–354. [Google Scholar] [CrossRef]
- Hopkins, E. Machine Learning Tools, Algorithms, and Techniques. J. Self-Gov. Manag. Econ. 2022, 10, 43–55. [Google Scholar]
- Kliestik, T.; Kovalova, E.; Lăzăroiu, G. Cognitive decision-making algorithms in data-driven retail intelligence: Consumer sentiments, choices, and shopping behaviors. J. Self-Gov. Manag. Econ. 2022, 10, 30–42. [Google Scholar]
- Nica, E.; Sabie, O.M.; Mascu, S.; Luţan, A.G. Artificial Intelligence Decision-Making in Shopping Patterns: Consumer Values, Cognition, and Attitudes. Econ. Manag. Financ. Mark. 2022, 17, 31–43. [Google Scholar]
- Lai, M.L.; Tsai, M.J.; Yang, F.Y.; Hsu, C.Y.; Liu, T.C.; Lee, S.W.Y.; Li, M.H.; Chiou, G.L.; Liang, G.C.; Tsai, C.C. A review of using eye-tracking technology in exploring learning from 2000 to 2012. Educ. Res. Rev. 2013, 10, 90–115. [Google Scholar] [CrossRef]
- Rayner, K. Eye movements in reading and information processing: A 20-year study. Psychol. Bull. 1998, 124, 372. [Google Scholar] [CrossRef]
- Rayner, K.; Chace, K.H.; Slattery, T.J.; Ashby, J. Eye movements as reflections of comprehension process in reading. Sci. Stud. Read. 2006, 10, 241–255. [Google Scholar] [CrossRef]
- Rayner, K. Eye movements and attention in reading, scene perception, and visual search. Q. J. Exp. Psychol. 2009, 62, 1457–1506. [Google Scholar] [CrossRef]
- Vernet, M.; Kapoula, Z. Binocular motor coordination during saccades and fixations while reading: A magnitude and time analysis. J. Vis. 2009, 9, 2. [Google Scholar] [CrossRef] [Green Version]
- Nyström, M.; Holmqvist, K. An adaptive algorithm for fixation, saccade, and glissade detection in eye tracking data. Behav. Res. Methods 2010, 42, 188–204. [Google Scholar] [CrossRef] [Green Version]
- Agnieszka, A.T. Basic terminology of eye-tracking research. Appl. Linguist. Pap. 2018, 25, 123–132. [Google Scholar]
- Hessels, R.S.; Niehorster, D.C.; Nyström, M.; Andersson, R.; Hooge, I.T. Is the eye-movement field confused about fixations and saccades? A survey among 124 researchers. R. Soc. Open Sci. 2018, 5, 180502. [Google Scholar] [CrossRef] [Green Version]
- Heller, D.; Müller, H. On the Relationship between Saccade Size and Fixation Duration in Reading. In Eye Movements and Psychological Functions; Routledge: London, UK, 2021; pp. 287–302. [Google Scholar]
- Stuart, S.; Hickey, A.; Vitorio, R.; Welman, K.; Foo, S.; Keen, D.; Godfrey, A. Eye-tracker algorithms to detect saccades during static and dynamic tasks: A structured review. Physiol. Meas. 2019, 40, 02TR01. [Google Scholar] [CrossRef]
- Tanke, N.; Barsingerhorn, A.D.; Boonstra, F.N.; Goossens, J. Visual fixations rather than saccades dominate the developmental eye movement test. Sci. Rep. 2021, 11, 1162. [Google Scholar] [CrossRef]
- Hooge, I.T.; Niehorster, D.C.; Nyström, M.; Andersson, R.; Hessels, R.S. Fixation classification: How to merge and select fixation candidates. Behav. Res. Methods 2022, 1–12. [Google Scholar] [CrossRef]
- Kang, K.; Lu, J.; Guo, L.; Li, W. The dynamic effect of interactivity on customer engagement behavior through tie strength: Evidence from live streaming commerce platforms. Int. J. Inf. Manag. 2021, 56, 102251. [Google Scholar] [CrossRef]
- Ho, H.F. The effects of controlling visual attention to handbags for women in online shops: Evidence from eye movements. Comput. Hum. Behav. 2014, 30, 146–152. [Google Scholar] [CrossRef]
- Ho, H.F.; Chen, G.A.; Vicente, C.T. Impact of Misplaced Words in Reading Comprehension of Chinese Sentences: Evidences from Eye Movement and Electroencephalography. In Proceedings of the 23rd International Conference on Computers in Education(ICCE 2015), Hangzhou, China, 30 November–4 December 2015; pp. 573–579. [Google Scholar]
- Pang, J. E-Commerce Business Model Innovation Under the Background of Internet Celebrity Economy. In Proceedings of the 6th International Conference on Financial Innovation and Economic Development, Sanya, China, 29–31 January 2021; pp. 513–519. [Google Scholar]
- Geng, R.; Wang, S.; Chen, X.; Song, D.; Yu, J. Content marketing in e-commerce platforms in the internet celebrity economy. Ind. Manag. Data Syst. 2020, 120, 464–485. [Google Scholar] [CrossRef]
- Djafarova, E.; Rushworth, C. Exploring the credibility of internet celebrities’ Instagram profiles in influencing the purchase decisions of young female users. Comput. Hum. Behav. 2017, 68, 1–7. [Google Scholar] [CrossRef]
- Kang, J.; Tang, L.; Fiore, A.M. Enhancing consumer-brand relationships on restaurant Facebook fan pages: Maximizing consumer benefits and increasing active participation. Int. J. Hosp. 2014, 36, 145–155. [Google Scholar] [CrossRef]
- Zorah, H.B.; James, T. Neill Social motivations for viewer engagement on Twitch live streams. Comput. Hum. Behav. 2018, 84, 58–67. [Google Scholar]
- Sanders, M.S.; McCormick, E.J. Human Factors in Engineering and Design; McGraw-Hill: New York, NY, USA, 1987. [Google Scholar]
- Viviani, P. Eye movements in visual search: Cognitive, perceptual, and motor control aspects. Rev. Oculomot. Res. 1990, 4, 353–393. [Google Scholar]
- Cornsweet, T.N. New technique for measuring small eye movements. J. Opt. Soc. Am. 1958, 48, 808–811. [Google Scholar] [CrossRef]
- Valliappan, N.; Dai, N.; Steinberg, E.; He, J.; Rogers, K.; Ramachandran, V.; Navalpakkam, V. Accelerating eye movement research via accurate and affordable smartphone eye tracking. Nat. Commun. 2020, 11, 4553. [Google Scholar] [CrossRef] [PubMed]
- Duchowski, A.T. A breadth-first survey of eye-tracking applications. Behav. Res. Methods Instrum. Comput. 2002, 34, 455–470. [Google Scholar] [CrossRef] [PubMed]
- Henderson, J.M.; Hollingworth, A. Advanced scene awareness. Annu. Rev. Psychol. 1999, 50, 243–271. [Google Scholar] [CrossRef] [Green Version]
- Klaib, A.F.; Alsrehin, N.O.; Melhem, W.Y.; Bashtawi, H.O.; Magableh, A.A. Eye tracking algorithms, techniques, tools, and applications with an emphasis on machine learning and Internet of Things technologies. Expert Syst. Appl. 2021, 166, 114037. [Google Scholar] [CrossRef]
- Carter, B.T.; Luke, S.G. Best practices in eye tracking research. Int. J. Psychophysiol. 2020, 155, 49–62. [Google Scholar] [CrossRef] [PubMed]
- Dixson, B.; Grimshaw, G.; Ormsby, D.; Dixson, A. Eye tracking women’s preferences or men’s body type. Evol. Hum. Behav. 2014, 35, 73–79. [Google Scholar] [CrossRef]
- Wu, S.C. Using Eye-Tracking Technology to Examine the Relationship between Landscape Preference, Attention Recovery, Image Features and Number of Gazes. Ph.D. Dissertation, Feng Chia University Civil and Hydraulic Engineering, Taichung, Taiwan, 2015. [Google Scholar]
- Galvan, A. Neural plasticity of development and learning. Hum. Brain Mapp. 2010, 31, 879–890. [Google Scholar] [CrossRef]
- Phillips, D.C.; Soltis, J.F. Perspectives on Learning; Teachers College Press: New York, NY, USA, 2009. [Google Scholar]
- Mayer, R.E. Multimedia Learning; Cambridge University Press: Cambridge, UK, 2001. [Google Scholar]
- Yang, F.Y.; Chang, C.Y.; Chien, W.R.; Chien, Y.T.; Tseng, Y.H. Tracking learners’ visual attention during a multimedia presentation in a real classroom. Comput. Educ. 2013, 62, 208–220. [Google Scholar] [CrossRef]
- Chen, H.C.; Lai, H.D.; Chiu, F.C. Eye tracking technology for learning and education. Sci. Res. Educ. 2010, 4, 39–68. [Google Scholar]
- Goldberg, H.J.; Kotval, X.P. Computer interface evaluation using eye movements: Methods and constructs. Int. J. Ind. Ergon. 1999, 24, 631–645. [Google Scholar] [CrossRef]
- Van Gog, T.; Scheiter, K. Eye tracking as a tool to study and enhance multimedia learning. Learn. Instr. 2010, 20, 95–99. [Google Scholar] [CrossRef]
- Yildirim, B.; Sahin-Topalcengiz, E.; Arikan, G.; Timur, S. Using virtual reality in the classroom: Reflections of STEM teachers on the use of teaching and learning tools. J. Educ. Sci. Environ. Health 2020, 6, 231–245. [Google Scholar] [CrossRef]
- Zhang, X.B.; Yuan, S.M.; Chen, M.D.; Liu, X.L. A complete system for analysis of video lecture based on eye tracking. IEEE Access 2018, 6, 49056–49066. [Google Scholar] [CrossRef]
- Pan, T.W.; Tsai, M.J. Eye-Tracking Analyses of Text-and-Graphic Design Effects on E-Book Reading Process and Performance:“SPANISH Color Vocabulary” as an Example. In Proceedings of the 22nd International Conference on Computers in Education(ICCE2014), Nara, Japan, 30 November–4 December 2014; pp. 494–498. [Google Scholar]
- Leung, C.Y. Can Japanese EFL Learners “See” before They “Read”? In 2014 Studies in Japan Association for Language Education and Technology, Kansai Chapter; Methodology Special Interest Groups (SIG): Kobe, Japan, 2014; Volume 5, pp. 16–27. [Google Scholar]
- Was, C.; Sansosti, F.; Morris, B. Eye-Tracking Technology Applications in Educational Research; IGI Global: Hershey, PA, USA, 2016. [Google Scholar]
- Hamilton, W.A.; Garretson, O.; Kerne, A. Twitch Streaming: Fostering a Participatory Gaming Community in Live Mixed Media. In Proceedings of the 32nd ACM Annual Conference on Human Factors in Computing Systems, Toronto, ON, Canada, 26 April–1 May 2014; pp. 1315–1324. [Google Scholar]
- Liu, H.C.; Chuang, H.H. An examination of cognitive processing of multimedia information based on reviewers’ eye movements. Interact. Learn. Environ. 2011, 19, 503–517. [Google Scholar] [CrossRef]
- Liu, H.C.; Lai, M.L.; Chuang, H.H. Using eye-tracking technology to investigate the redundant effect of multimedia web pages on viewers’ cognitive processes. Comput. Hum. Behav. 2011, 27, 2410–2417. [Google Scholar] [CrossRef]
- Tsai, M.J.; Huang, L.J.; Hou, H.T.; Hsu, C.Y.; Chiou, G.L. Visual behavior, flow and achievement in game-based learning. Comput. Educ. 2016, 98, 115–129. [Google Scholar] [CrossRef]
- Romero-Hall, E.; Watson, G.S.; Adcock, A.; Bliss, J.; Adams Tufts, K. Simulated environments with animated agents: Effects on visual attention, emotion, performance, and perception. J. Comput. Assist. Learn. 2016, 32, 360–373. [Google Scholar] [CrossRef]
- Liu, W.; Yu, M.; Fan, Z.; Xu, J.; Tian, Y. Visual Attention Based Evaluation for Multiple-Choice Tests in E-Learning Applications. In Proceedings of the 2017 IEEE Frontiers in Education Conference (FIE), Indianapolis, IN, USA, 18–21 October 2017; pp. 1–6. [Google Scholar]
- Klein, P.; Dengel, A.; Kuhn, J. Students’ Visual Attention While Solving Multiple Representation Problems in Upper-Division Physics. In Positive Learning in the Age of Information; Zlatkin-Troitschanskaia, O., Wittum, G., Dengel, A., Eds.; Springer VS: Wiesbaden, Germany, 2018; pp. 67–87. [Google Scholar]
- Wang, C.C.; Hung, J.C. Comparative analysis of advertising attention to Facebook social network: Evidence from eye-movement data. Comput. Hum. Behav. 2019, 100, 192–208. [Google Scholar] [CrossRef]
- Wang, C.C.; Hung, J.C.; Chen, H.C. How Prior Knowledge Affects Visual Attention of Japanese Mimicry and Onomatopoeia and Learning Outcomes: Evidence from Virtual Reality Eye Tracking. Sustainability 2021, 13, 11058. [Google Scholar] [CrossRef]
- Kaakinen, K.J.; Hyönä, J.; Keenan, M.J. How prior knowledge, working memory capacity, and information relevance affect fixation in expository texts. J. Exp. Psychol. Learn. Mem. Cogn. 2003, 29, 447–457. [Google Scholar] [CrossRef]
- Clay, V.; König, P.; Koenig, S. Eye tracking in virtual reality. J. Eye Mov. Res. 2019, 12. [Google Scholar] [CrossRef] [PubMed]
- Zhao, D.; Lucas, J. Virtual reality simulation for construction safety promotion. Int. J. Inj. Control Saf. Promot. 2015, 22, 57–67. [Google Scholar] [CrossRef] [PubMed]
- Teng, Y.Y.; Chou, W.C.; Cheng, M.T. Learning immunology in a game: Learning outcomes, the use of player characters, immersion experiences and visual attention distributions. J. Comput. Assist. Learn. 2021, 37, 475–486. [Google Scholar] [CrossRef]
- Son, M.; Kim, J.; Kim, H. Viewers’ Visual Attention on Subtitles in Home Shopping Broadcasts: The NS Home Shopping Channel. Arch. Des. Res. 2022, 35, 217–235. [Google Scholar]
- Richardson, P.S.; Jain, A.K.; Dick, A. House Hold store Brand Proness:a framework. J. Retail. 1996, 72, 159–185. [Google Scholar] [CrossRef]
- Chovanová, H.H.; Korshunov, A.I.; Babčanová, D. Impact of brand on consumer behavior. Procedia Econ. Financ. 2015, 34, 615–621. [Google Scholar] [CrossRef] [Green Version]
- Lv, X.; Zhang, R.; Su, Y.; Yang, Y. Exploring how live streaming affects immediate buying behavior and continuous watching intention: A multigroup analysis. J. Travel Tour. Mark. 2022, 39, 109–135. [Google Scholar] [CrossRef]
- Guo, Y.; Zhang, K.; Wang, C. Way to success: Understanding top streamer’s popularity and influence from the perspective of source characteristics. J. Retail. Consum. Serv. 2022, 64, 102786. [Google Scholar] [CrossRef]
- Wongkitrungrueng, A.; Assarut, N. The role of live streaming in building consumer trust and engagement with social commerce sellers. J. Bus. Res. 2020, 117, 543–556. [Google Scholar] [CrossRef]
- Hou, F.; Guan, Z.; Li, B.; Chong, A.Y.L. Factors influencing people’s continuous watching intention and consumption intention in live streaming. Internet Res. 2019, 30, 141–163. [Google Scholar] [CrossRef]


| Eye Movement Indicator | Participants | ROI1 | ROI2 | ROI3 | ROI4 |
|---|---|---|---|---|---|
| LFF (Latency of First Fixation) | Male (N = 14) | 43,061 | 28,526 | 2910 | 13,372 |
| order | 4 | 3 | 1 | 2 | |
| Female (N = 17) | 32,863 | 40,238 | 22,597 | 64,558 | |
| order | 2 | 3 | 1 | 4 |
| Eye Movement Indicator | Participants | ROI1 | ROI2 | ROI3 | ROI4 |
|---|---|---|---|---|---|
| DFF (Duration of First Fixation) | Male (N = 14) | 1383 | 4394 | 1764 | 1268 |
| order | 3 | 1 | 2 | 4 | |
| Female (N = 17) | 3226 | 3044 | 5360 | 1003 | |
| order | 2 | 3 | 1 | 4 |
| Eye Movement Indicator | Participants | ROI1 | ROI2 | ROI3 | ROI4 |
|---|---|---|---|---|---|
| TFD (Total Fixation Durations) | Male (N = 14) | 9072 | 24,350 | 3305 | 4083 |
| Female (N = 17) | 19,475 | 21,157 | 5352 | 2729 | |
| TFD | 27,812 | 44,428 | 8,657 | 6,732 | |
| Mean | 920.87 | 1467.97 | 279.26 | 219.74 | |
| NOF (Number of Fixations) | Male (N = 14) | 26 | 105 | 10 | 18 |
| Female (N = 17) | 110 | 103 | 24 | 20 | |
| TFD | 127 | 196 | 34 | 37 | |
| Mean | 4.39 | 6.71 | 1.10 | 1.23 |
Publisher’s Note: MDPI stays neutral with regard to jurisdictional claims in published maps and institutional affiliations. |
© 2022 by the authors. Licensee MDPI, Basel, Switzerland. This article is an open access article distributed under the terms and conditions of the Creative Commons Attribution (CC BY) license (https://creativecommons.org/licenses/by/4.0/).
Share and Cite
Chen, H.-C.; Wang, C.-C.; Hung, J.C.; Hsueh, C.-Y. Employing Eye Tracking to Study Visual Attention to Live Streaming: A Case Study of Facebook Live. Sustainability 2022, 14, 7494. https://doi.org/10.3390/su14127494
Chen H-C, Wang C-C, Hung JC, Hsueh C-Y. Employing Eye Tracking to Study Visual Attention to Live Streaming: A Case Study of Facebook Live. Sustainability. 2022; 14(12):7494. https://doi.org/10.3390/su14127494
Chicago/Turabian StyleChen, Hsuan-Chu, Chun-Chia Wang, Jason C. Hung, and Cheng-Yu Hsueh. 2022. "Employing Eye Tracking to Study Visual Attention to Live Streaming: A Case Study of Facebook Live" Sustainability 14, no. 12: 7494. https://doi.org/10.3390/su14127494