1. Introduction
Due to massive urbanization, traffic volume in urban areas has grown, making urban life very congested and polluted, leading to many negative impacts on human life, such as higher energy consumption, global warming, and airborne diseases [
1]. According to World Resource Institute [
2], 74% of CO
2 is produced by greenhouse gas emissions, and 93% of it results from fossil fuel usage, transportation, manufacturing, and consumption. In fact, 2020 has been recorded as the hottest year per NASA analysis. For the sustainable development of cities, the efficient use of resources and the adoption of effective measures have become crucial for survival. We have witnessed the COVID-19 effects in different areas of life, making the internet and information the heart of modern and sustainable cities. To reap the benefits of the internet and Information Communication Technologies (ICT), many city governments have initiated the concept of a “Smart City” with the deployment of advanced ICT aiming to provide a better living experience to its citizens [
3]. At the heart of a smart city is the Internet of Things (IoT) which enables different devices to interact and draws upon various underlying operations of a smart city for sustainable living such as smart services, smart health, smart transportation, smart agriculture, smart energy to name a few [
4].
The goal of sustainable transport in smart cities is to ensure efficient traffic movement while minimizing a negative impact on the environment and public health [
5]. The most discussed area in smart cities is intelligent transportation highlighting its impact on intelligent mobility, the environment, and the economy. For example, Cisco Barcelona Jurisdiction Profile 2014 [
6] reveals an annual increase of
$50 million through parking fee revenues using smart parking technology. The main goal of smart parking is finding and providing appropriate parking for each user. However, the problem of finding a parking area is still challenging due to increased traffic flow in urban areas. For example, some studies reveal that an average of 30–40% increase in traffic is caused by drivers looking for vacant parking spots, and on average, a New York driver spends 107 h a year searching for a parking spot [
7]. This phenomenon has increased air pollution and has had a negative environmental effect. With an efficient parking infrastructure, the cities can reduce carbon emissions caused by additional fuel combustion and avoid delays and traffic congestion while looking for a free parking slot.
In previous research, smart parking solutions are mainly categorized as off-street and on-street [
8,
9]. Off-street parking includes garages and closed parking spaces which could be outdoors or indoors. Off-street, the problem is simpler since it is straightforward to count the number of available slots by counting the number of cars entering and leaving a closed parking space. Off-street parking management has been tackled quite well due to its simpler problem and data availability [
10]. On the other hand, on-street parking is challenging due to the absence of parking entrances and significant changes in occupancy rates as more cars enter and leave the spots. On-street parking can directly affect streets regarding traffic congestion and air pollution. Numerous research has been done on both problems leading to an effective search for vacant parking spots. The research is usually based on parking spaces equipped with sensors to sense whether the spots are occupied and provide information. The data from occupancy sensors allows us to learn availability patterns and predict probabilities of parking occupancy of the spots. Based on Parking Sensor Data (PSD), various machine learning methods have been used to predict parking occupancy rates [
1,
11]. The most common ML used for parking prediction are Regression Trees [
12,
13,
14], DTs [
14], Support Vector Machine [
13,
15], Genetic Algorithm [
16], Bayesian [
17], and Neural Network [
13,
18]. The performance of these models depends on the accuracy of information provided to users about the availability of parking lots. However, multiple traffic factors may influence car parking activity regarding on-street parking. For example, the occupancy status may change due to other traffic factors present at that time, such as weather, pedestrian mobility, and traffic volume; therefore, the information provided by PSD is not very efficient. These factors can influence car parking conditions; therefore, it is essential to identify possible factors to predict future parking availability accurately.
It is necessary to install many sensors in various cities with substantial setup costs to collect data for contextual factors. Using a publicly available dataset can provide a good starting point for understanding the impact of external elements on the real-time prediction of the availability of parking spaces. Therefore, in this paper, we took advantage of publicly available data from the sensors deployed in the City of Melbourne (COM). Based on the literature review, on-street car parking, pedestrian, traffic, and weather data are identified as possible relevant categories of data that can influence prediction accuracy. None of the existing studies has investigated the influence of these factors on their predictions.
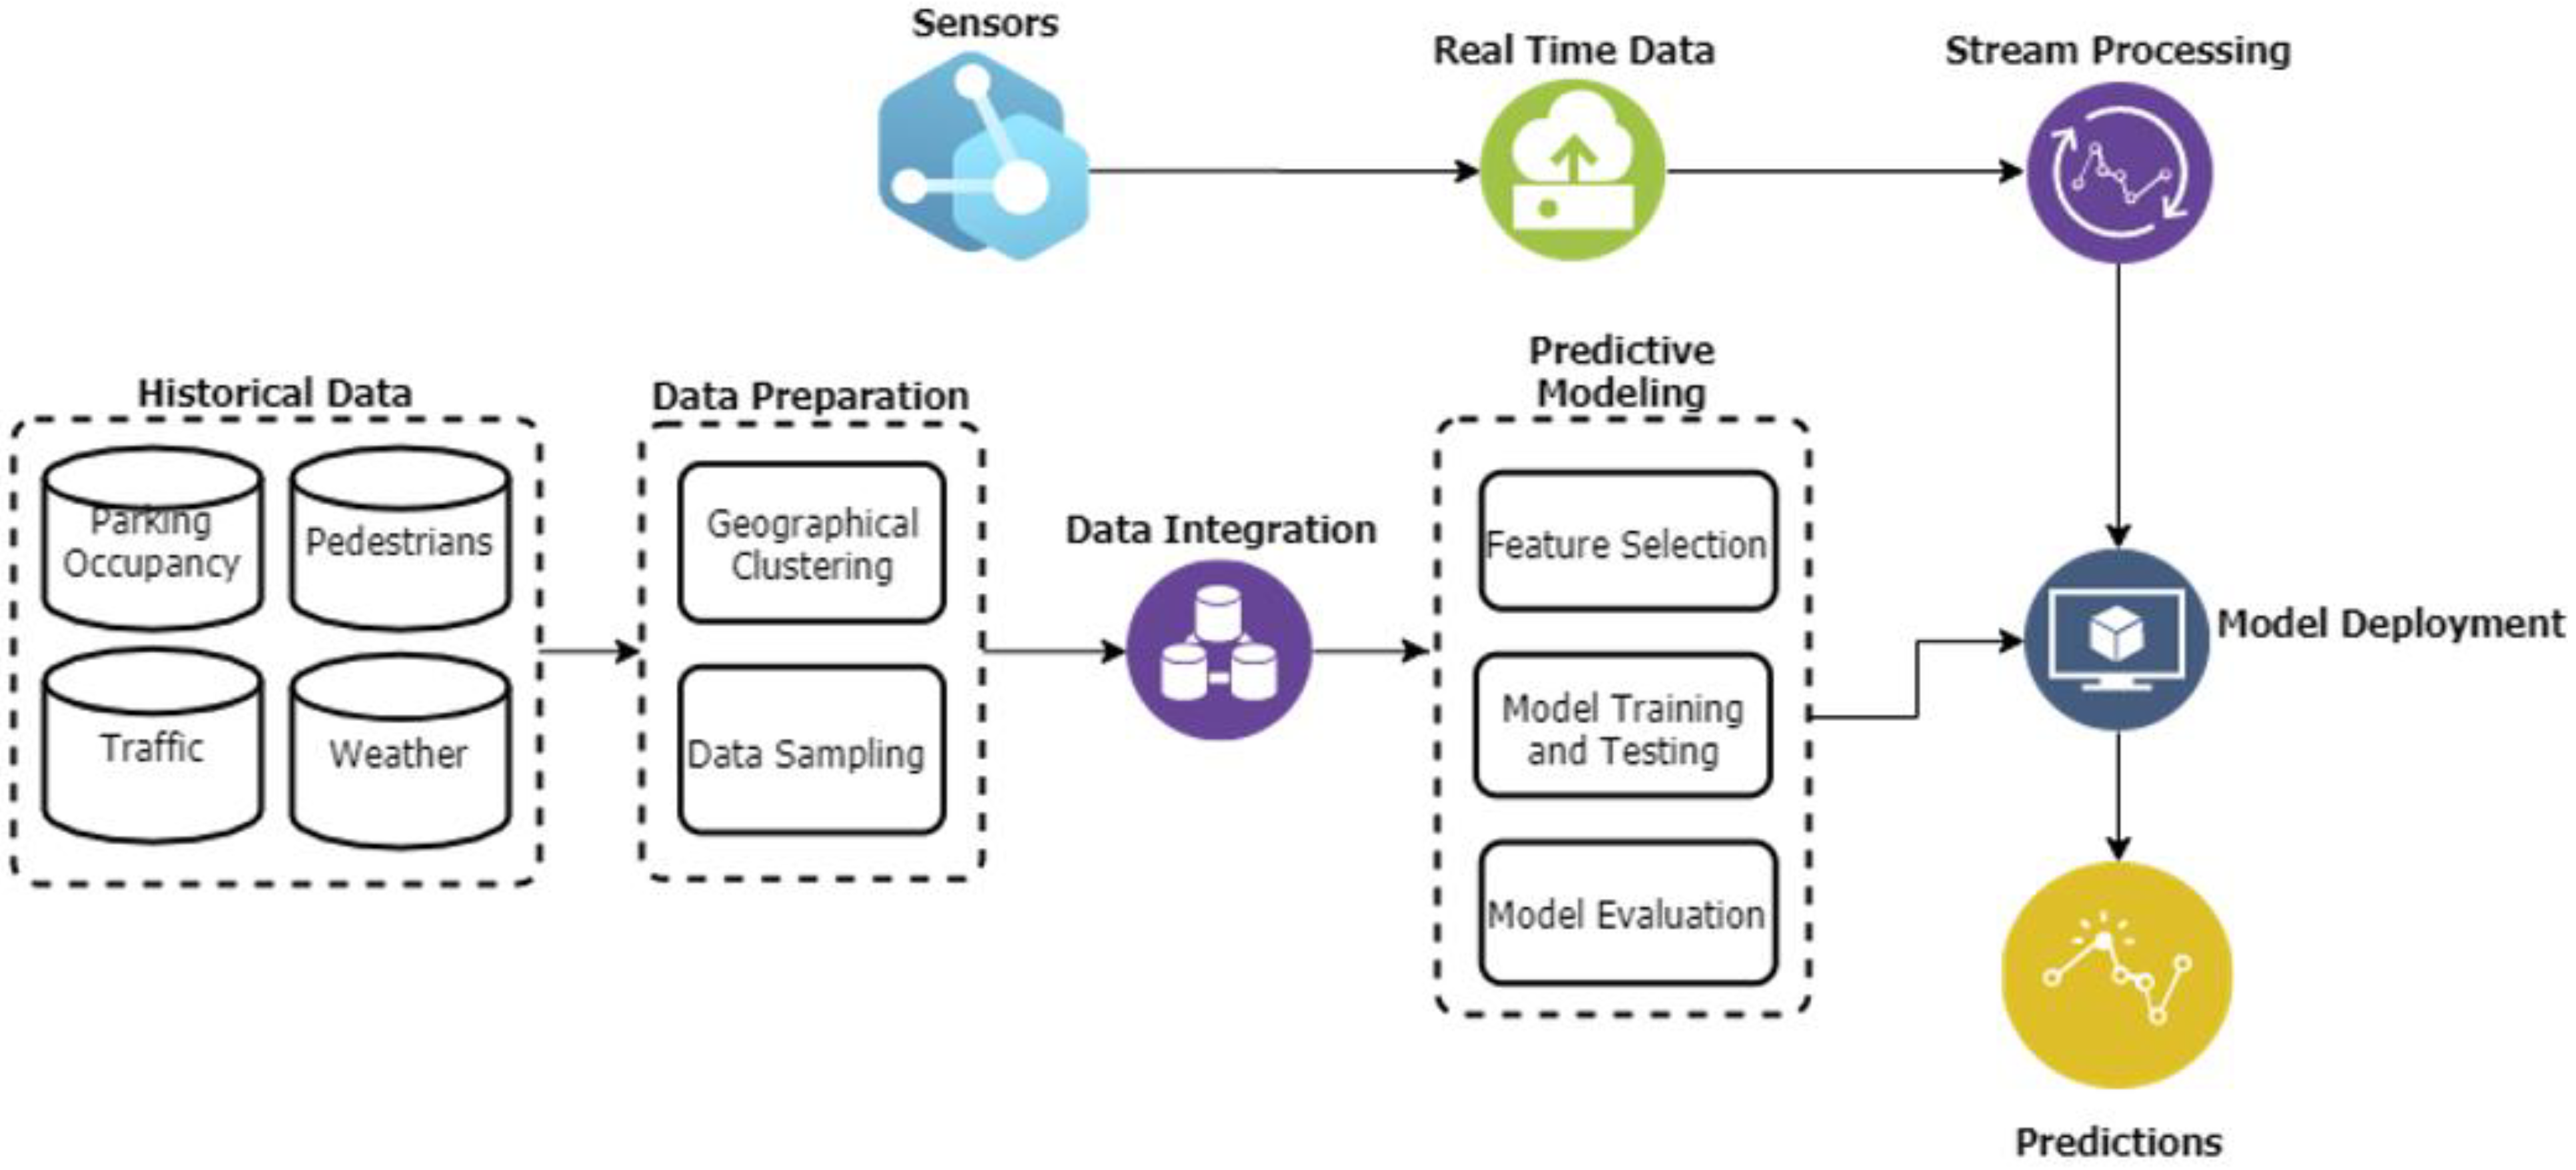
The main objective of this study is to design, build and evaluate an end-to-end ML pipeline for an on-street parking prediction using multisource data. We plan to integrate the ML pipeline into a smart parking application for future experimentation. The research objectives are achieved through the following contributions:
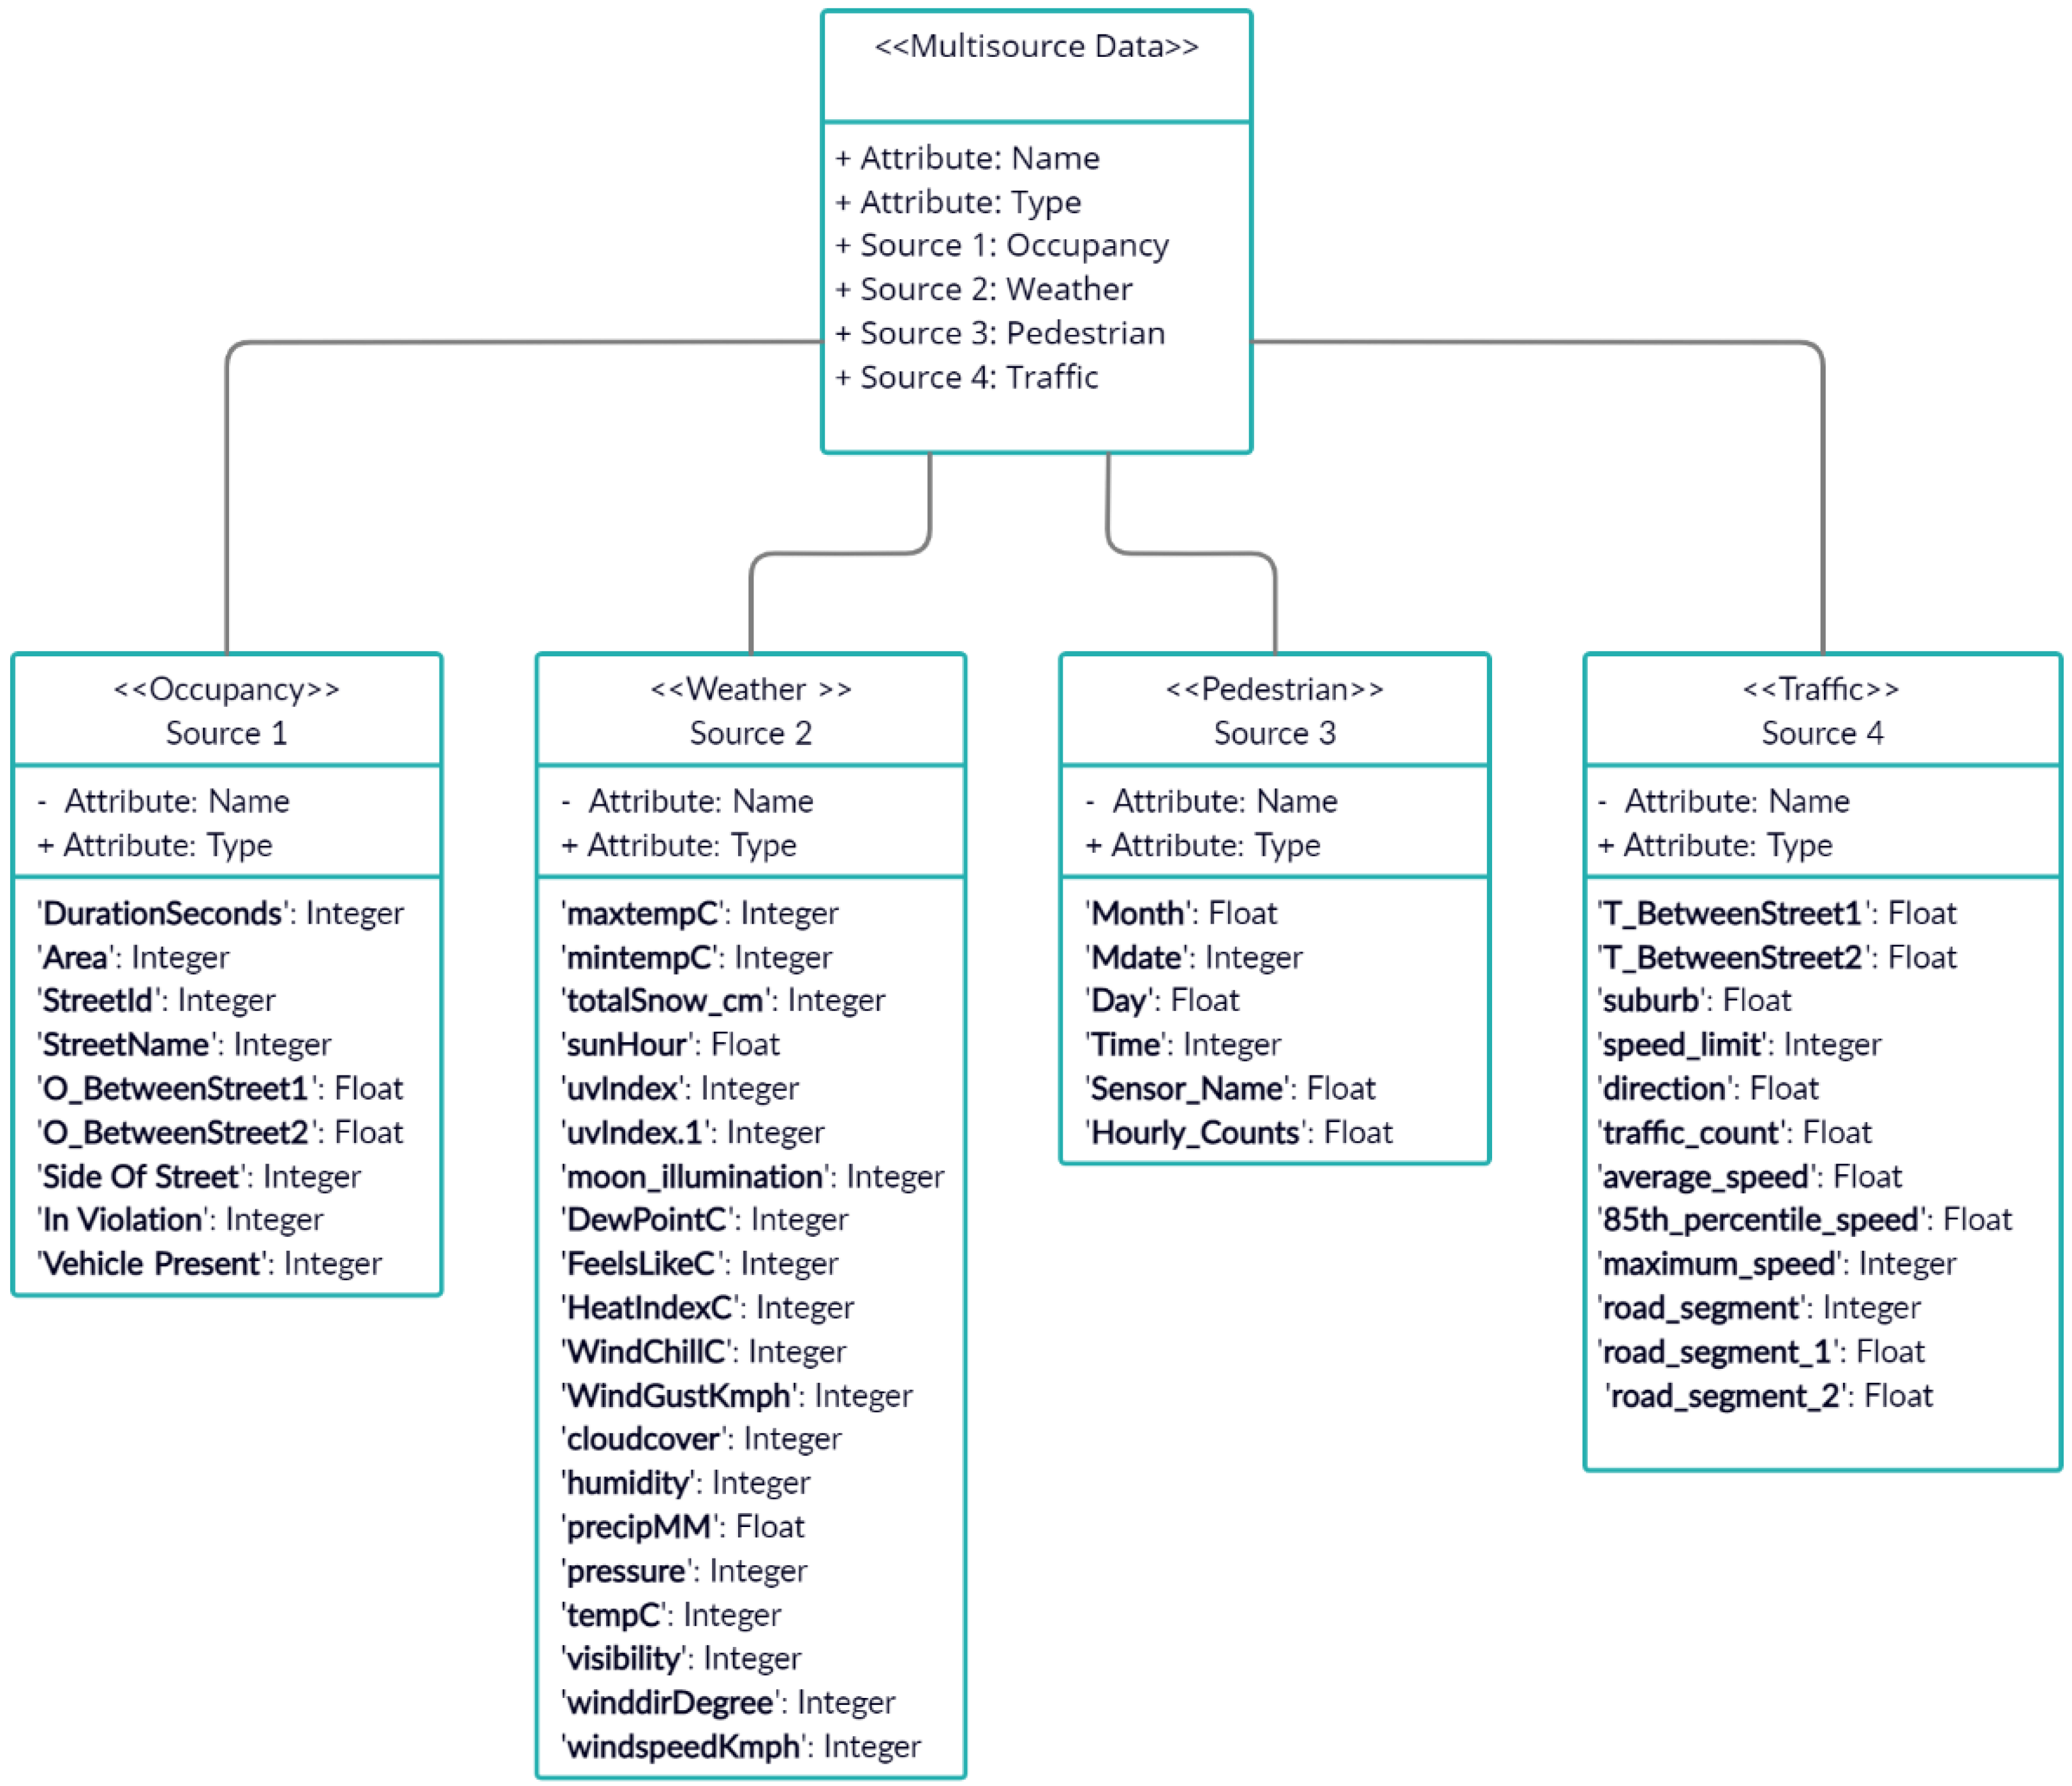
We integrated four datasets, i.e., car occupancy, weather, pedestrian, and traffic datasets, for more reliable predictions. The research question is: does the integration of multisource data impact the prediction accuracy of ML/DL models?
We investigated the relationship of car occupancy data with other external factors such as pedestrian volume, traffic flow, and weather conditions. The research question is: to what extent can each external factor help in improving the accuracy of the occupancy prediction model?
We analyzed the performance of well-known and generally used ML/DL models (e.g., MLP, RF, DTs, KNN, GA, AB, and linear SVC) to identify the best prediction model. The research question is: which ML/DL model can be used to achieve a more accurate prediction?
Using basic streaming operations, we deployed the best On-Street Prediction (ONSP) model for real-time prediction. The simulation results have shown an ingest rate of 0.1 and throughput of 0.3 events per second, demonstrating a fast and reliable prediction approach for available slots within 5–10 min. The research question is: how to scale the solution for IoT-driven big data environments to achieve sustainable parking solutions?
The rest of the paper is structured as follows—
Section 2 reviews related work to summarize previous research on parking prediction.
Section 3 describes the methodology adopted for predictive analysis based on a multisource data-driven approach. Evaluation of machine learning algorithms and comparison results of different modeling approaches are discussed in
Section 4. Finally, the future insights on intelligent real-time decision-making for smart city applications are discussed in
Section 5, followed by the concluding remarks.
2. Review of the Scientific Literature
The prediction of car park availability is the subject that has received significant attention in the context of smart cities where parking facilities have installed sensors as part of their infrastructure. Many research efforts have focused on improving parking search efficiency, reservation, and prediction for an available parking space. For example, Kizilkaya et al. [
19] used a hierarchical approach for predicting free parking spots using a binary search tree (BST). For the experiment, synthetic data is used with attributes such as parking distance, capacity, and availability status. The approach first searches for the nearest parking location and then finds a free spot in the nearest car park. Horng [
20] used the Artificial Fish Swarm Algorithm(AFSA) to minimize search time and traffic congestion. The performance is evaluated through simulations by randomly distributing 300–1800 vehicles in a 5.0 × 5.0 km
2 field. The results are compared with the conventional opportunistic methods revealing the effectiveness of AFSA in terms of reducing search time and congestion. However, the studies discussed above are promising, but the focus is limited to exploring only algorithmic capability in the domain.
Similarly, Thomas and Kovoor [
16] used Genetic Algorithm (GA) to solve the scheduling problem in the parking system, but the proposed prototype can only be used for reserving parking spots. The decision-making of parking slots is based on the maximized fitness score of the GA objective function. The performance analysis metrics include efficiency, utilization, and average waiting time. Customers can book a parking slot in advance for a specific time period. When parking time duration exceeds, the system sends a notification of time exceeded. All the parking information is stored in the cloud. A multi-criteria decision analysis-based Parking space Reservation (MCPR) algorithm is proposed by Rehena et al. [
21] for improvement in the reservation algorithm. The MCPR automatically finds the nearest parking space based on the users’ preferences, from parking space availability to pricing for the reservations. The studies mentioned in this section is a step further in optimizing the decision capability for predicting parking slot and highlighting the significance of using Machine Learning (ML) algorithms.
The previous research efforts indicate that several ML algorithms have been widely studied and explored in the direction of predicting occupancy. For example, Raj et al. [
22] used parking data and tested the Random Forest method for predicting parking spots in a parking lot. The question is how contextual data and other ML methods can predict parking availability. Stolfi et al. [
23] used historical car parking occupancy data from the Birmingham city council for testing various prediction strategies such as polynomial fitting, Fourier series, K-means clustering, and time series to predict future occupancy. The results are validated using K- fold cross-validation with the final output testing on unseen occupancy data. The solution is made available for the users through a webpage. However, it faces challenges due to the inconsistency in the sensor’s data, as the data may not be updated for the whole day. Klandev et al. [
24] used garage occupancy and traffic congestion data to predict the parking spot availability ratio within 60 min. They tested the XGBoost regression model, which received a low error rate confirming its efficiency of predictions.
Similarly, Claudio et al. [
17] compared different prediction techniques utilizing traffic flow, weather, and historical data to predict parking in the city garages of Florence. The resulting solution proved the Bayesian regularized network for reliable and fast predictions. Zheng et al. [
13] perform a comparative analysis of SVM, Regression Tree, and Neural Networks using San Francisco and Melbourne datasets to predict long-term occupancy in 24 h intervals. The results indicate that the Regression tree outperforms the other two methods they evaluated with the highest accuracy and minimum error rate.
The discussed research shows the importance of contextual data such as traffic and weather being used along with ML approaches, but they are only tested on off-street parking prediction. Alajali et al. [
12] investigated the use of on-street car parking, pedestrian, and daily traffic count data to predict short-term parking slots using Boosting Regression Tree. The study was implemented for a particular location Central Business District Melbourne, using data for special days and events since getting pedestrian counts were costly and hard to scale. Here, only in one study, the impact of pedestrian data and traffic is utilized for on-street parking. The results show that multisource data had an improved performance using gradient boosting (GBRT) with MSE 0.029. Still, the results are reported with only pedestrian data as the traffic data lacked proper mapping with other sources due to limited availability.
One of the critical challenges in addressing parking prediction is considering the nature of underlying data, suitable predictive models, and the accuracy of real-time decision-making. All the research done has focused on either one or the other challenge. For example, Liu et al. [
8] proposed an online parking guidance system considering the delay in real-time parking space availability. The authors discussed the multiuser online street problem, and the study was validated on a Melbourne dataset. The results illustrated that the proposed framework reduces 63.8% delay.
On the other hand, Vlahogianni et al. [
25] proposed a two-step methodological framework for real-time car occupancy prediction based on sensor data. The first step predicts the real-time parking space using Recurrent Neural Networks (RNN). The second module is based on finding the available parking space with traffic volume. This approach, however, proved computationally expensive.
Among the studies discussed above, each has tried to solve different problems, such as minimizing delay and congestion, techniques to deal with inconsistent sensor data, and ML methods to improve the prediction accuracy for on-street and off-street parking prediction. Many studies used only car parking sensor data to evaluate the predictive performance of ML methods. Only a few studies focus on contextual factors such as traffic flow, weather, or pedestrian mobility data. However, these studies are evaluated on off-street prediction problems such as city garages and parking lots, where data accessibility of occupancy status is easier to obtain. None of the existing studies has investigated the relationship of car occupancy data with weather conditions, traffic count, and pedestrian mobility in their predictive models for on-street parking.
Additionally, most studies are evaluated via simulation, and very few are evaluated in real-time. Real-time studies lack computational scalability, which is crucial for today’s smart city applications. There have also been gaps in one way or the other, such as taking advantage of multisource data for on-street parking and making a solution scalable for real-time predictions. This work proposes a scalable predictive solution for real-time on-street parking prediction utilizing multisource data. To the best of our knowledge, this is the first study that serves as a starting point toward integrating multisource in designing and developing real-time parking solutions.
4. Experimental Results
The experimental setup, along with the results of model training and validation on historical and real-time data, is discussed in this section.
4.1. Experimental Setup
The experiments are performed using various available resources. The system requirements used for data engineering are described in
Table 6. To evaluate the impact of all four sources and model testing and validation, the Jupyter Notebook 6.0.1 is accessed via Anaconda 3 with python version Python 3.7.4. on Google Colaboratory (
https://colab.research.google.com/notebooks/intro.ipynb, accessed on 12 September 2021). The ONSP training and deployment are performed on IBM Watson using IBM Cloud. All the required services, such as Watson Studio, Watson Machine Learning, streaming analytics, and IBM cloud object storage, were added to IBM Cloud using the Lite version. The Lite version is freely available but with limited computing hours.
4.2. Feature Selection
By applying the feature selection technique discussed in
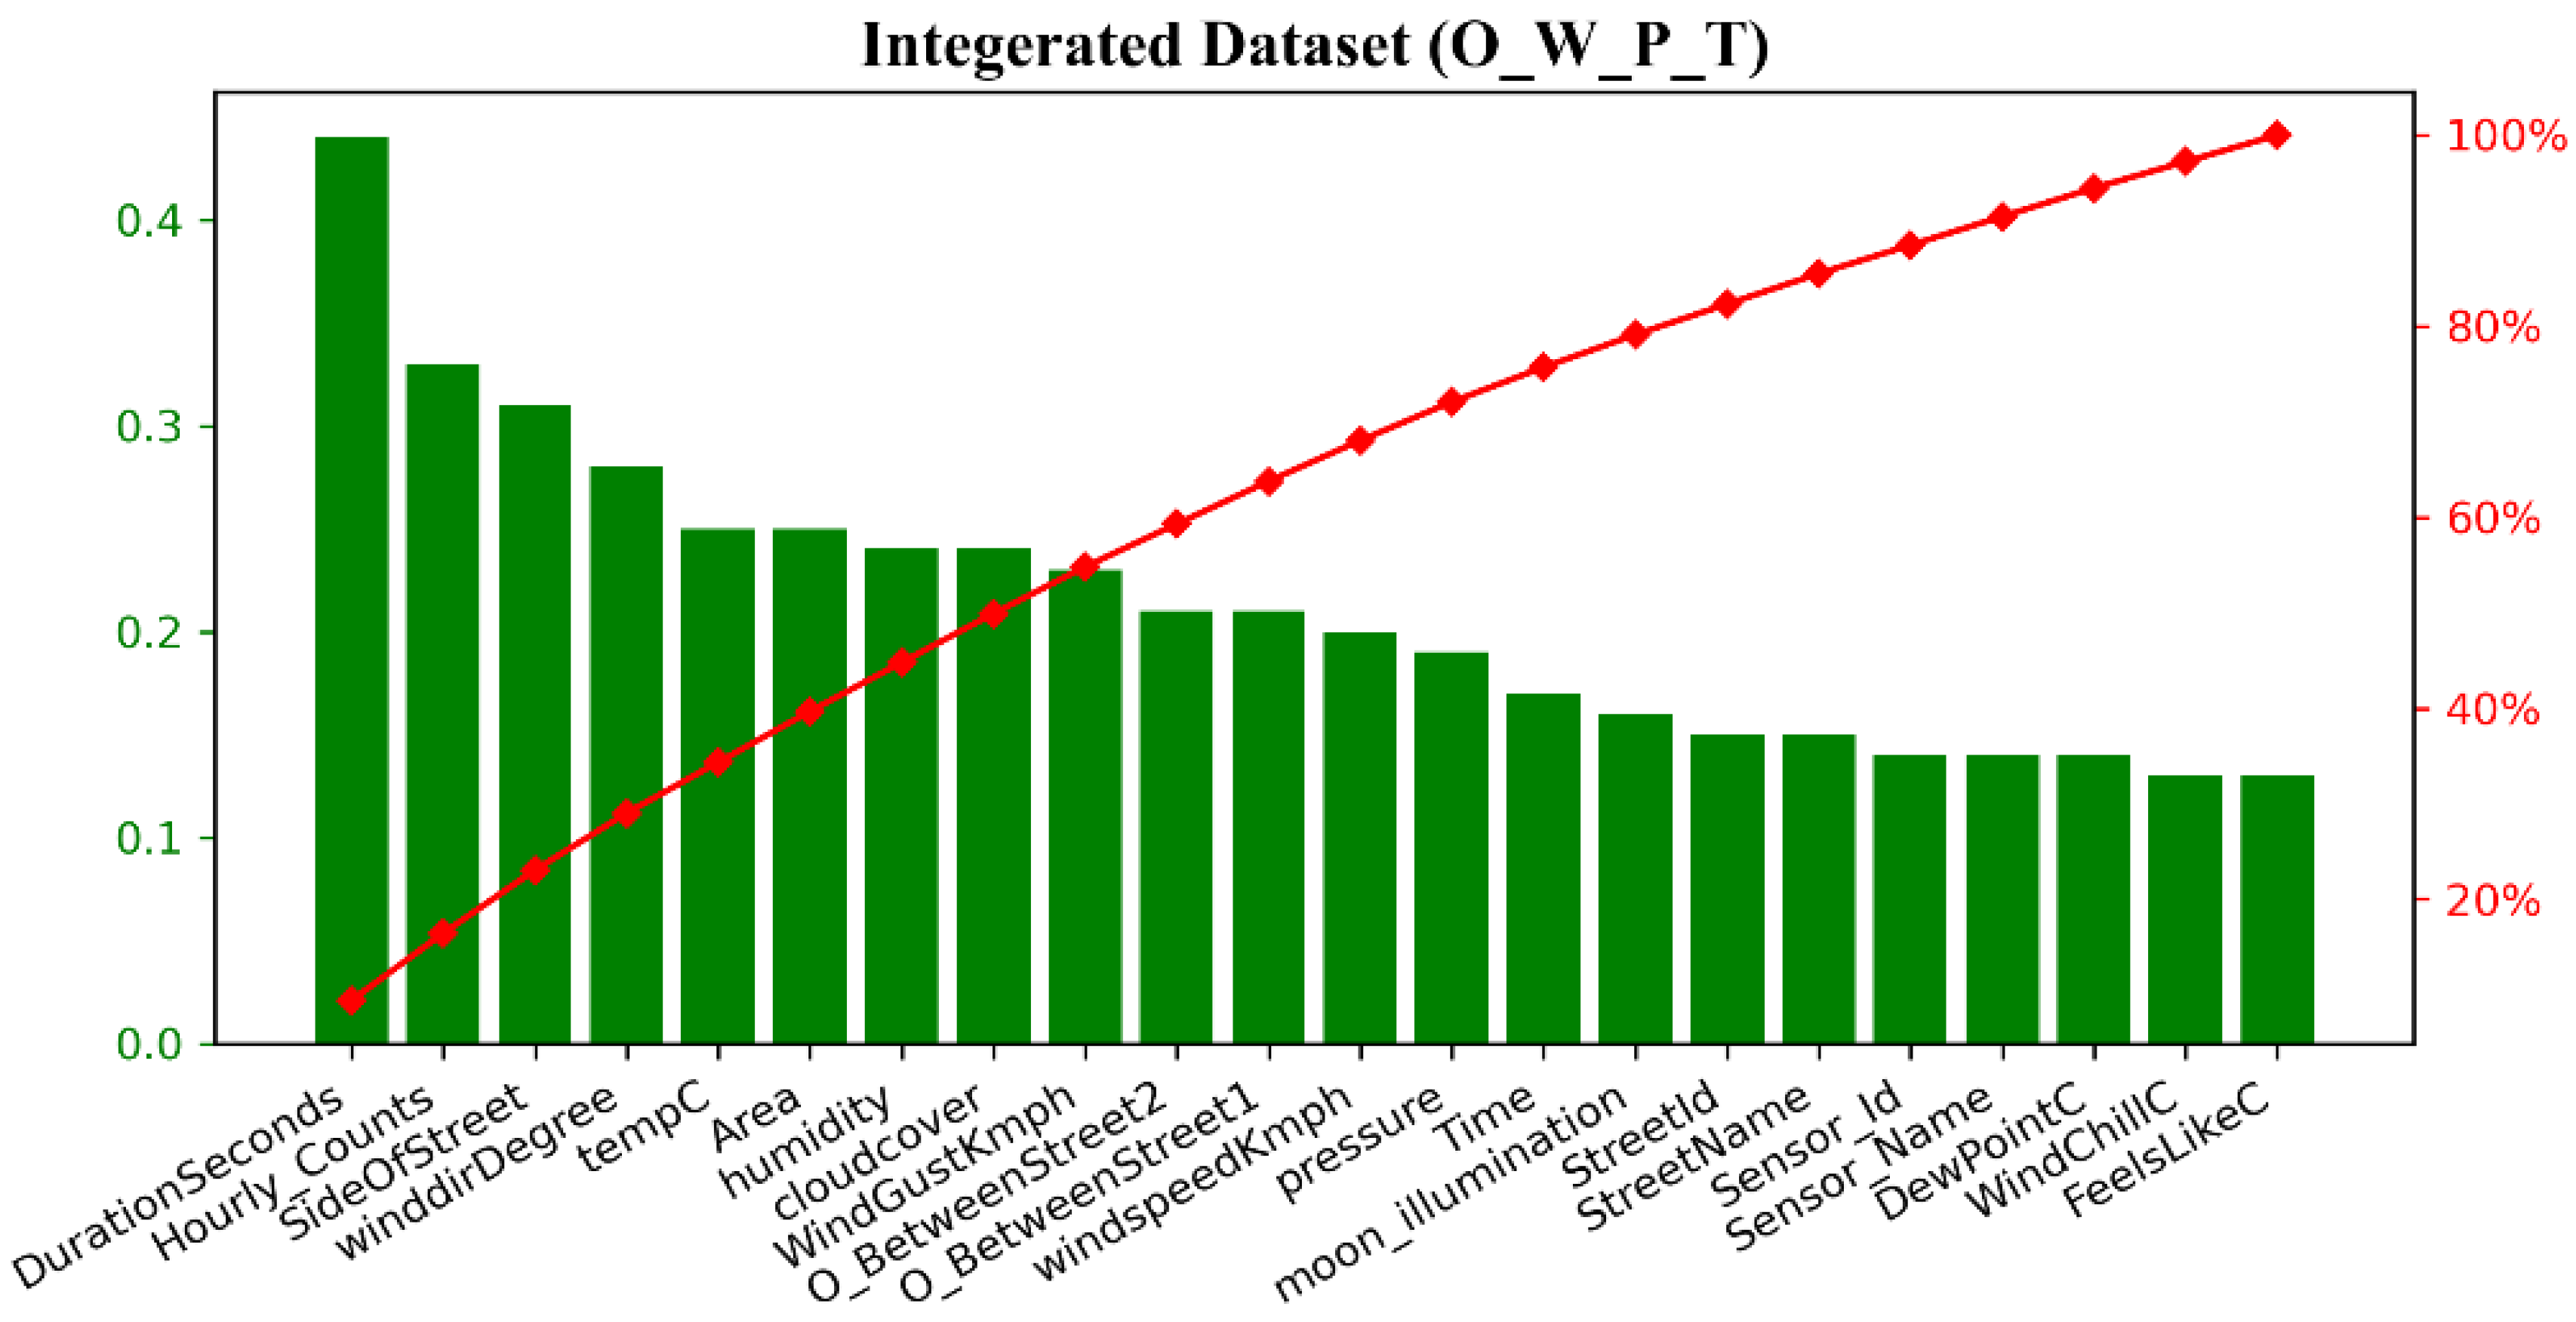
Section 3.3 the important features are selected based on their importance score to understand the predictive capabilities of features from integrated datasets. The resultant features identified by the proposed feature selection technique from the integrated dataset (O_W_P_T) are shown in
Figure 5, ranked from highest to lowest scores. It can be observed from
Figure 5 that DurationSecond and SideOfStreet received the highest score from the occupancy data. Other features from occupancy data are streetID and StreetName. Hourly_Count, Area, and time of the day received the highest scores from pedestrian data. Traffic between streets, which was mapped with the occupancy data points, received a high score from the traffic data. However, due to the small traffic dataset, the traffic condition does not show much significance. From the weather data winddirDegree, humidity and cloudcover have shown the highest score. Other features from weather data are WindGustKmph, pressure, moon_illumination, DewPointC, tempC, WindChillC, and feelLikeC, which indicates the importance of weather data in occupancy prediction. Only 22 features (shown in
Figure 5) are retained for further analysis out of 51 features from the original datasets based on the feature scores.
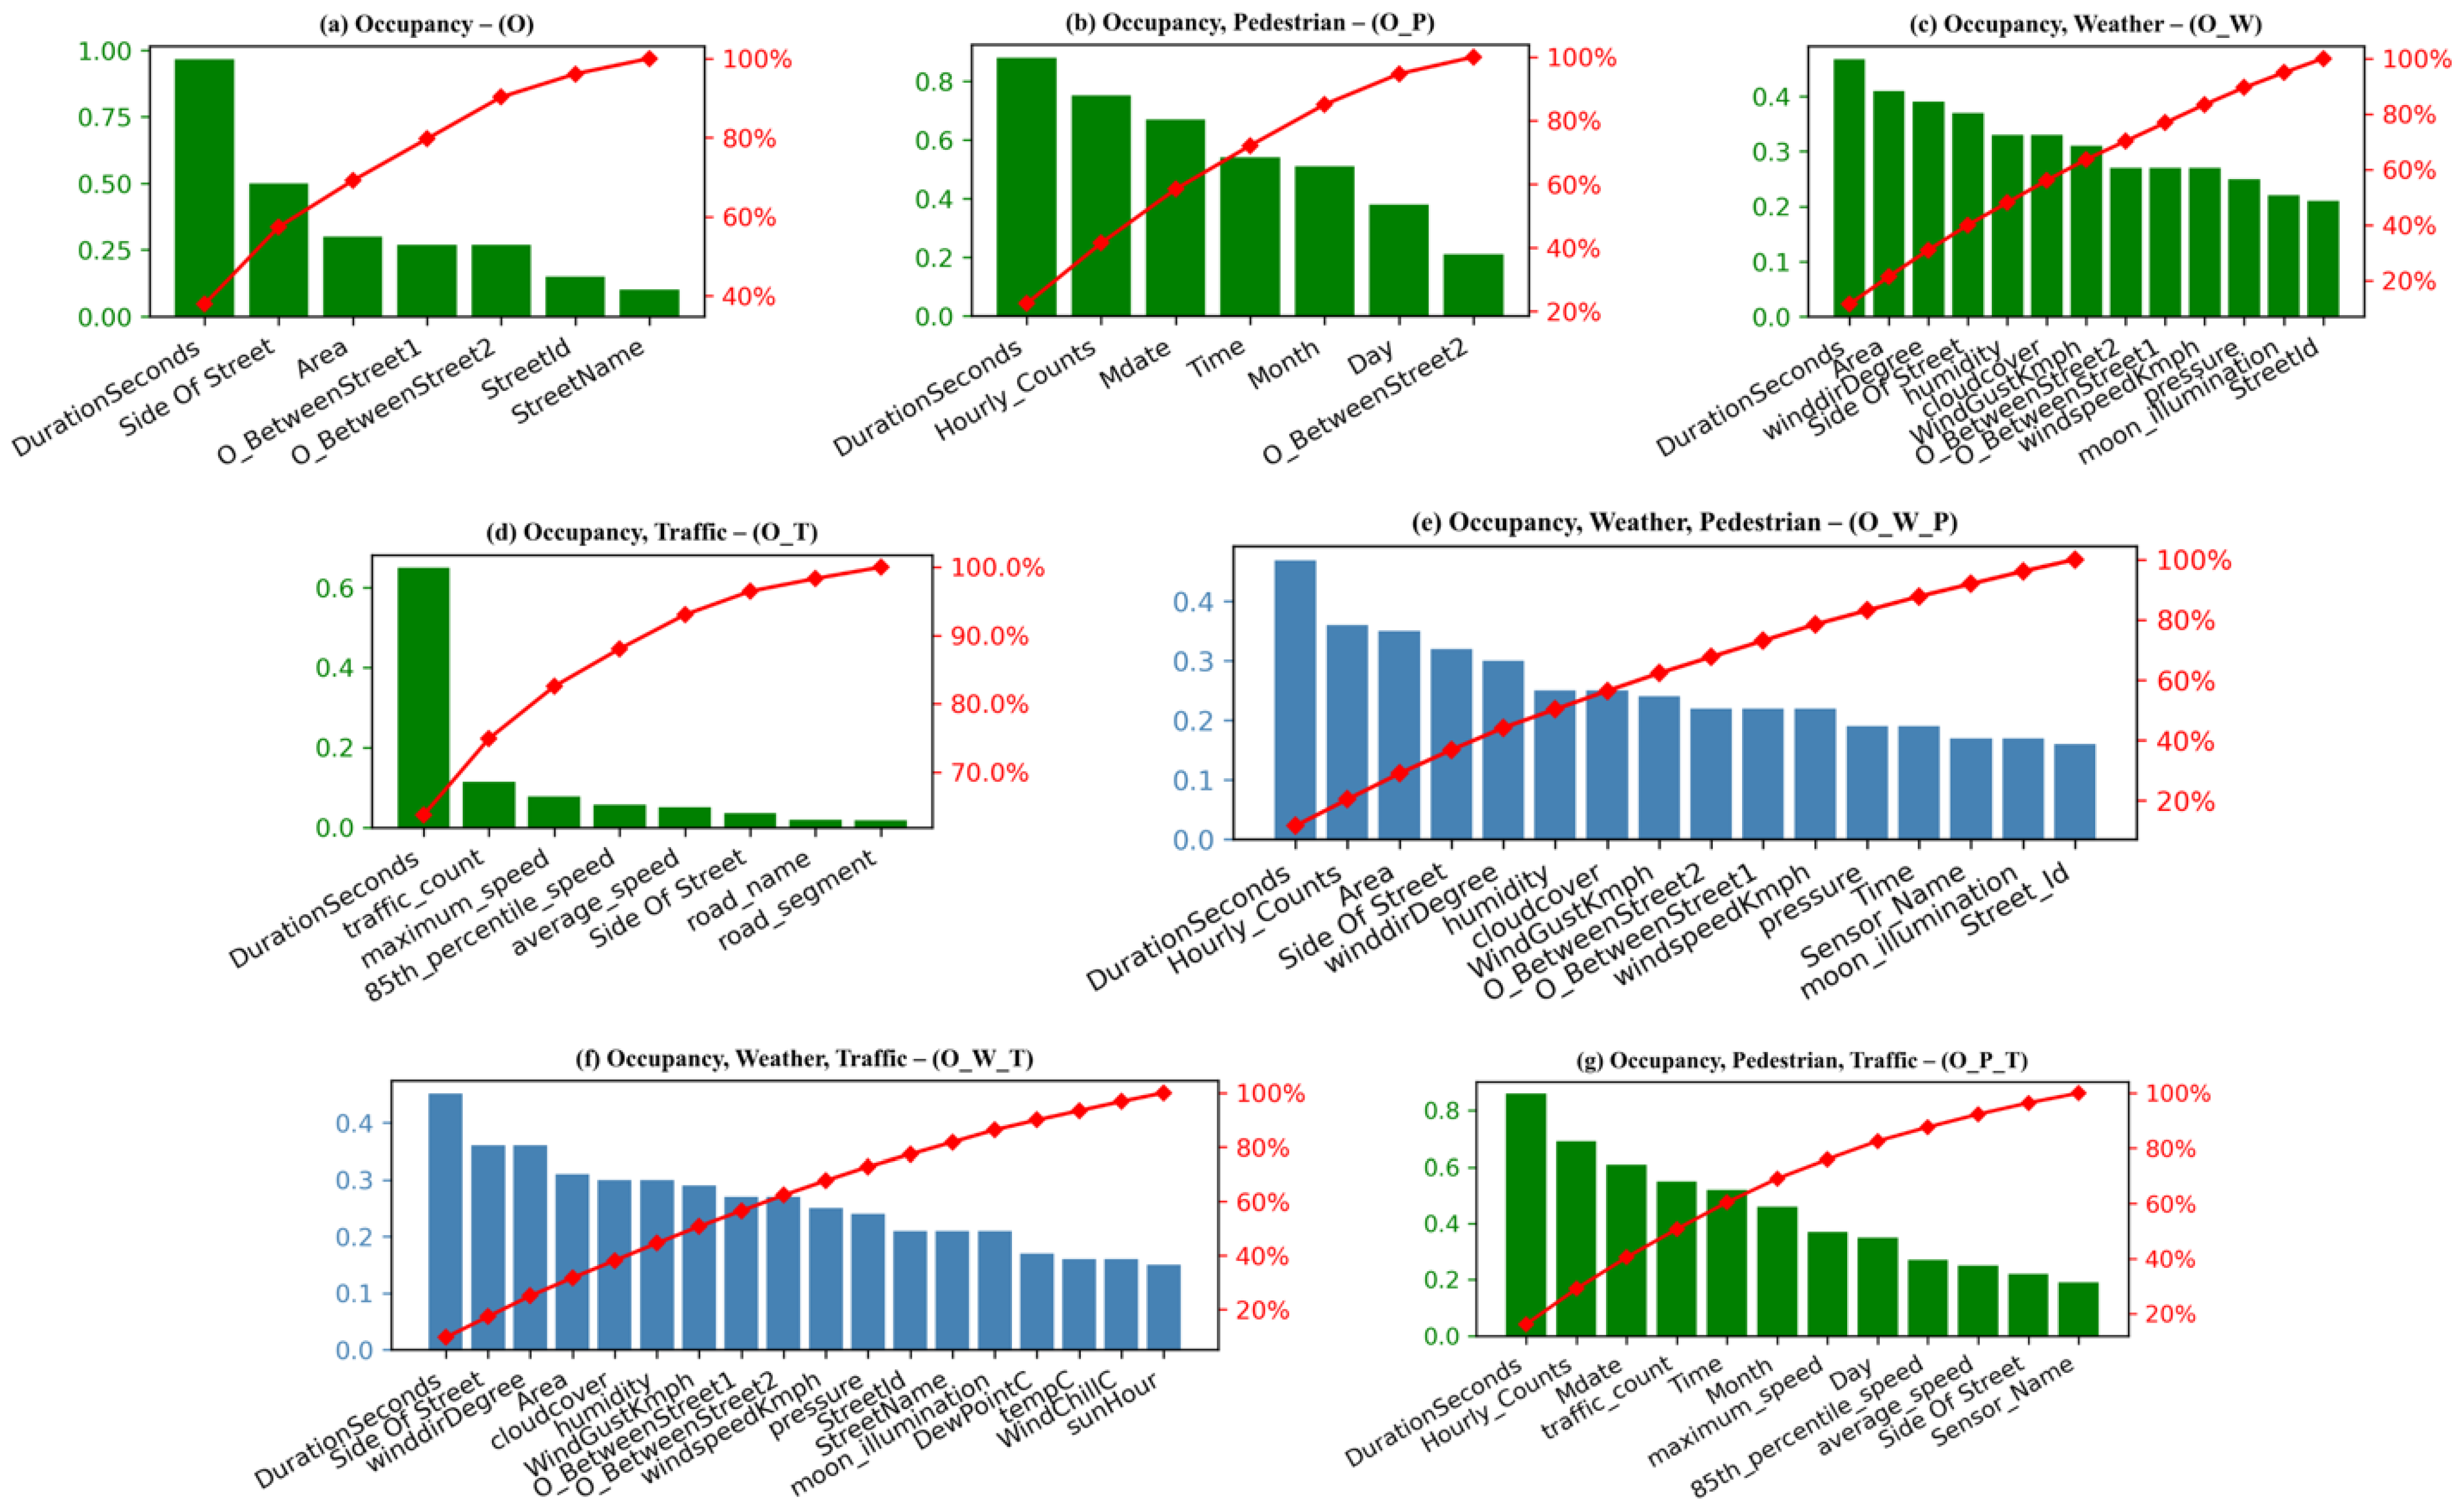
Besides the feature’s capabilities of the integrated dataset (O_W_P_T), understanding the importance of each feature as the possible predictive variable for different combinations of the datasets is worth mentioning. The importance of each feature in all possible combinations of the historical dataset is shown in
Figure 6. These combinations include occupancy (O), occupancy_weather (O_W), occupancy_pedestrian (O_P), occupancy_traffic (O_T), occupancy_weather_pedestrian (O_W_P), occupancy_weather_traffic (O_W_T), and occupancy_pedestrian_traffic (O_P_T).
It can be observed from
Figure 6 that the important features from Occupancy (O) data include DurationSeconds, Side Of Street, and the area between streets, making them basic features for all other combinations. When occupancy is combined with pedestrian data in (O_P), the hourly pedestrian count becomes the next influential variable, while in (O_T) combination, traffic count received the highest scores making the traffic flow the most influential variable from the traffic dataset. The winddirDegree, humidity, and cloudcover are amongst the top weather features in the O_W combination. The Hourly_Counts, Mdate, and Time from the pedestrian and traffic_count, maximum_speed, and 85th_percentile_speed came as the top traffic features from the O_P_T combination. The figure proved that the parking duration (DurationSeconds) and location (Side Of Street, Area, O_BetweenStreet1, and O_BetweenStreet2) are present in every combination hence making them the most influential variables in every combination. The other influential variables are traffic count, pedestrian hourly count, and wind degree from traffic, pedestrian, and weather data, respectively, proving that the availability of a free parking slot is tightly coupled with the number of pedestrians, traffic flow, and weather conditions.
4.3. Performance Evaluation of ML/DL Models
We performed two sets of experiments to evaluate the performance of selected algorithms, first on the integrated database and the second on different combinations of multisource datasets. At first ONSP model is trained using RF and tested on integrated data with the 22 most influential features. The performance is compared using well-known evaluation metrics accuracy, recall, F1-score, and AUC (Area under Curve) [
11,
30]. A comparative analysis with the various models such as DT, KNN, GB, AB, MLP, and linear SVC is performed. Although there are many ML/DL techniques in the literature, we choose these six techniques since they are widely used by the community and have proven the best results. Secondly, this is a preliminary work focused on identifying the impact of contextual data points on the prediction accuracy of the most used techniques. The model validation is performed using 6 K-fold cross-validations [
31] for traditional ML approaches as part of training. For the deep learning model, MLP, we adopted five-layered sequential network architecture and tuned different hyperparameters discussed in the next section.
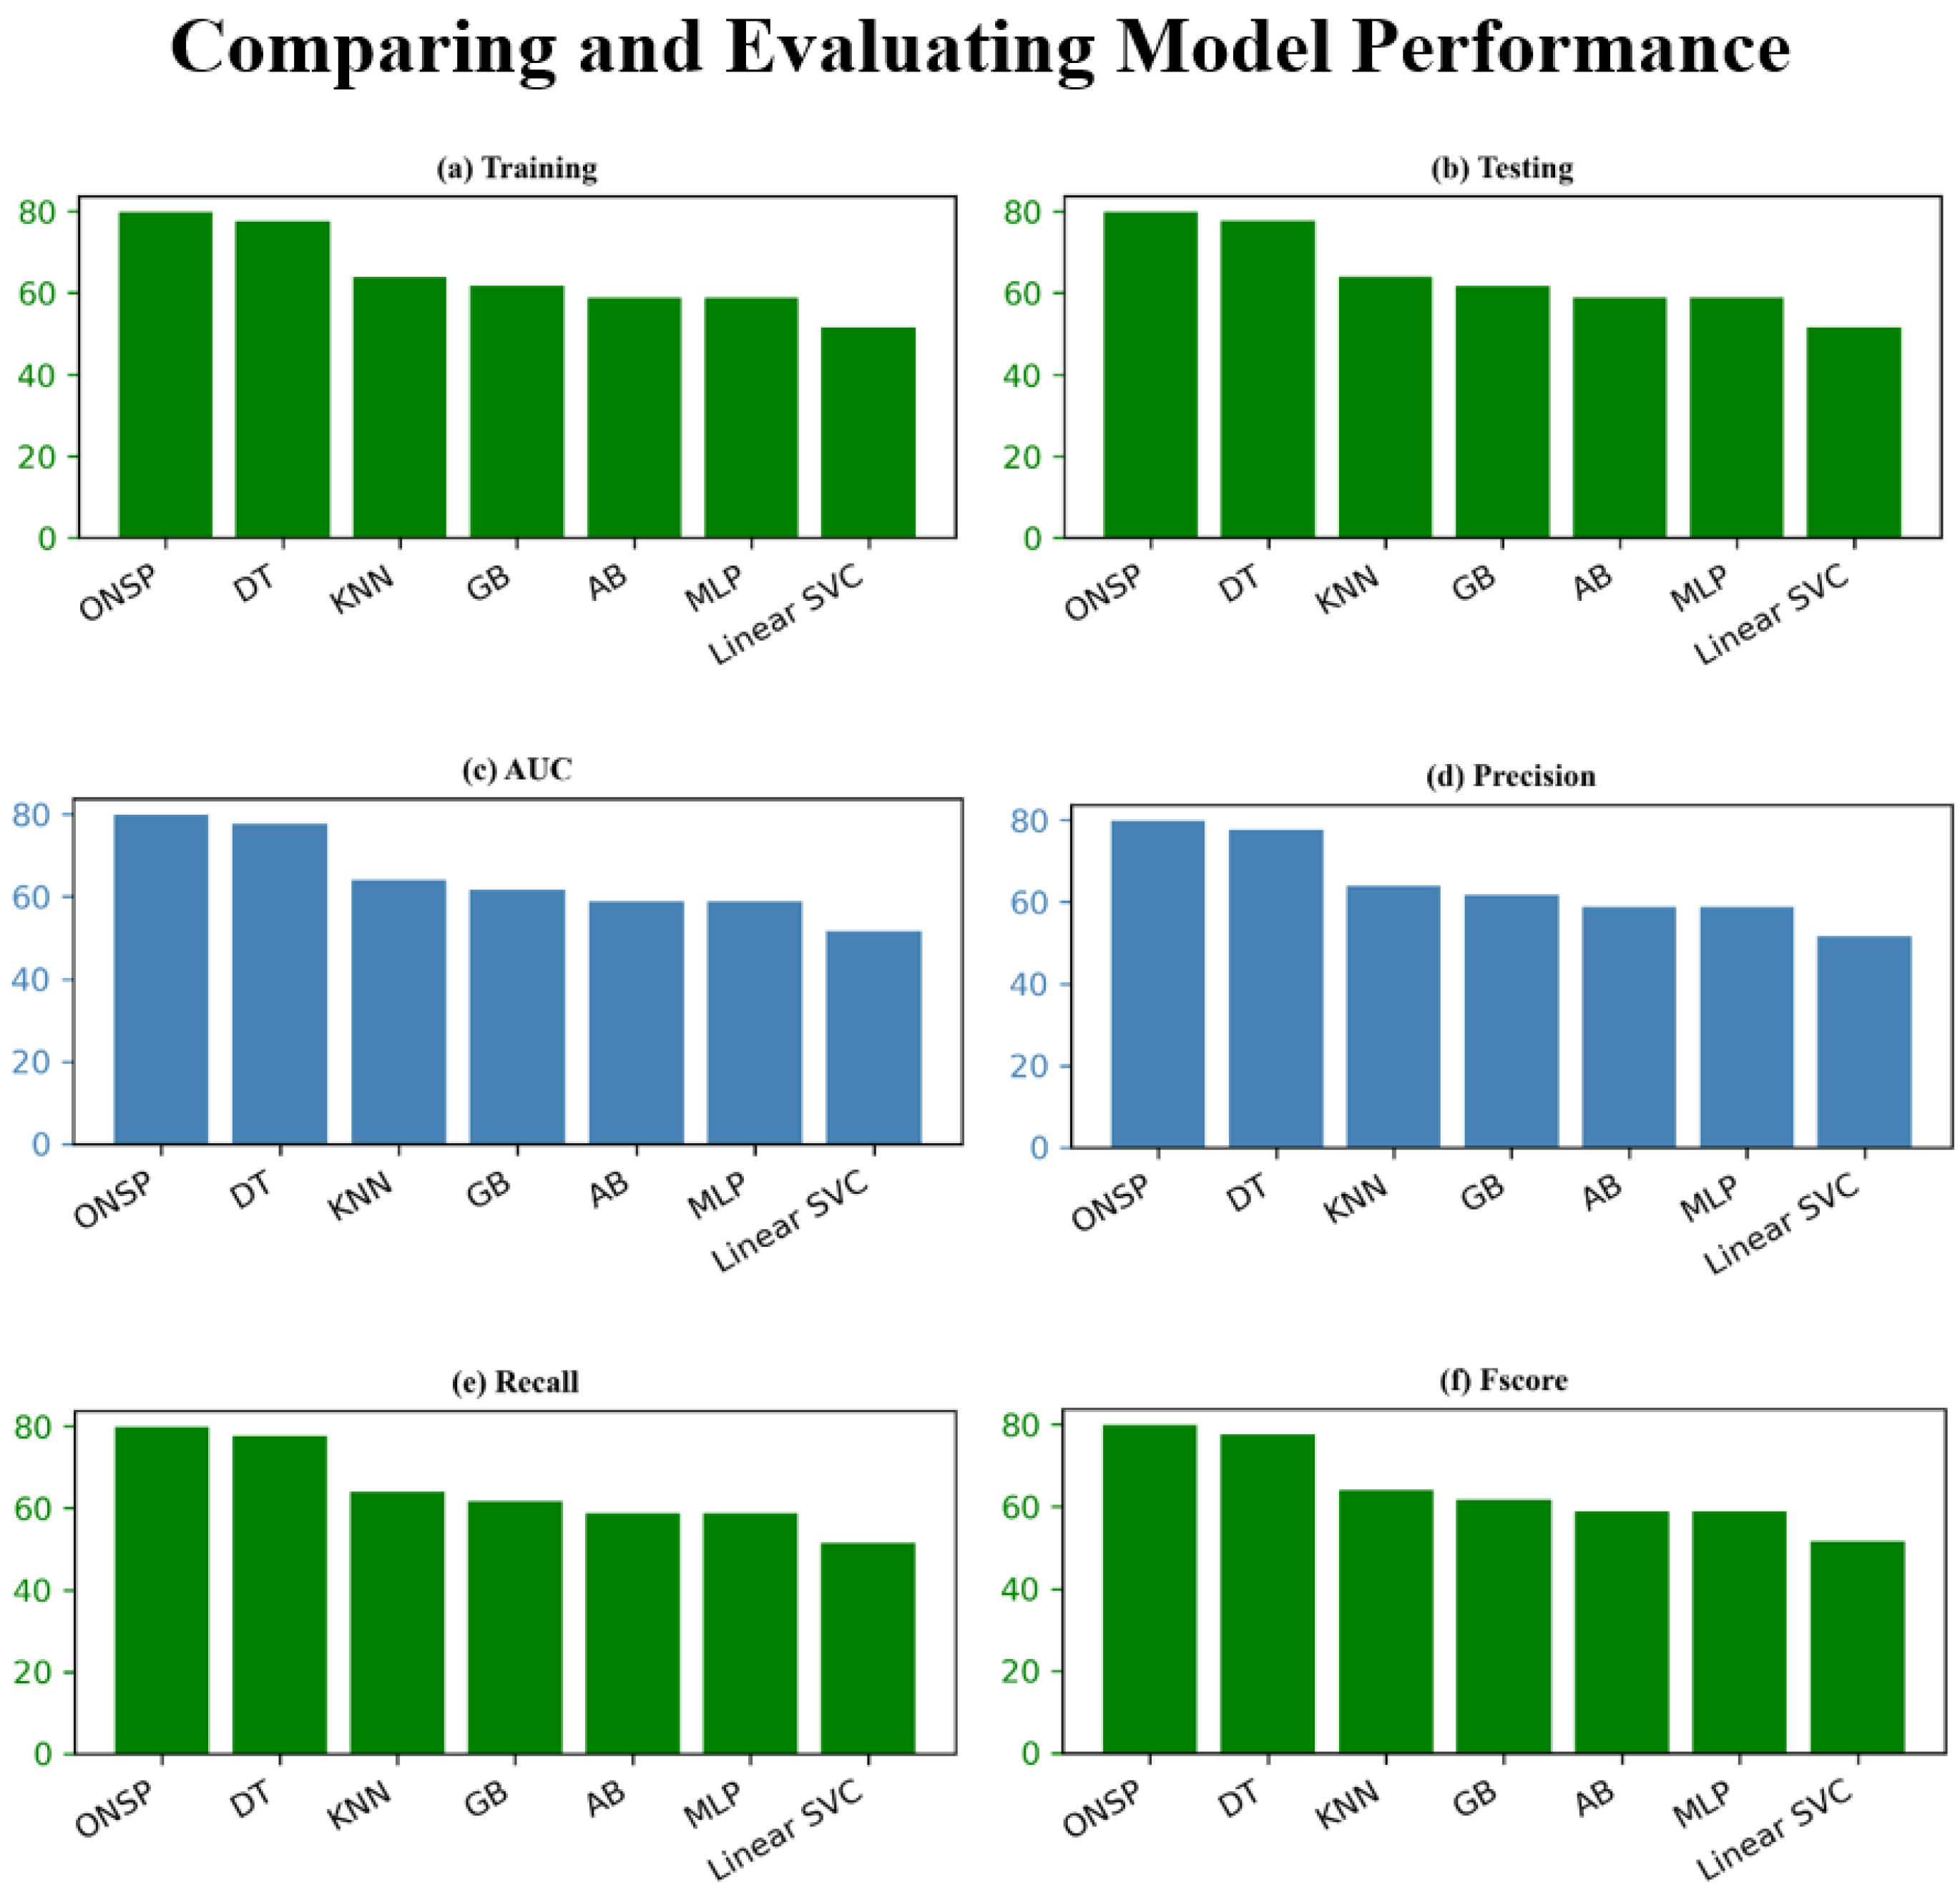
The results obtained are shown in
Table 7, from which we generated
Figure 7, which clearly illustrates these comparative performances. Overall the ONSP showed the best results for all measurements compared to other models. It received a training accuracy of approximately 80%, higher than DT, KNN, GB, AB, Linear SVC, and MLP which is 77.7%, 64.0%, 61.7%, 58.8%, 51.5%, and 58.8%, respectively. Besides accuracy, the model is evaluated in terms of other metrics such as precision, recall, AUC, and F-score (see
Table 7 and
Figure 7). With an 81% value for each of these metrics, it is proved that ONSP is prone to a low number of false-positive rates compared to other classifiers under the study, where values vary from 51 to 78%. The comparative analysis revealed that the complex model, MLP showed the lowest performance with an average of 58.8% accuracy, 60% precision, 56% recall, 62% AUC, and 58% F-score. In contrast, one of the simplest ML models, DT, outperformed MLP with the results of 78% precision, recall, F-Score, and 77.7% accuracy. KNN and GB also outperformed MLP, and their performances were quite close to each other. KNN showed 63% average precision, while GB had 62% average precision. The average recall scores for KNN and GB were 63% and 61%, respectively. AB and Linear SVC showed the lowest performance of all other ML algorithms, with 58% and 51% testing accuracy.
Moreover, the results are compared with similar research on on-street car parking prediction [
12], where Gradient Boosting has achieved maximum performance. However, the model was only evaluated to explore the relationship between car occupancy and pedestrian data of 13.2M rows with 57 streets. We validate the ONSP model to assess the relationship of multisource data, i.e., car occupancy, pedestrian, weather, and traffic data of size 22 M rows with 24 streets. In the data sampling, we shortlisted the common streets among different data segments, and it has shown its impact on the results by achieving a testing accuracy of 81%. Furthermore, we applied the feature reduction technique to select the most influential variables. The proposed ONSP model performed better than those that used the original features in terms of accuracy and other performance variances.
4.4. Performance Evaluation of Multilayer Perceptron (MLP) Neural Network
To evaluate deep learning with traditional ML approaches, we adopted MLP, which is the most common neural network. The MLP architecture consists of an input layer, three hidden layers, and an output layer. We ran multiple iterations to determine hidden layers and neuron size range by considering accuracy and loss. As a result, three hidden layers (24, 24, 8) with 24, 24, and 8 neuron sizes are being used in the network. The hyperparameters used to tune MLP are shown in
Table 8. We trained MLP for three different epoch sizes of 100, 250, and 1500 on different batch sizes with adam optimizer and binary cross-entropy loss function to test the training loss and accuracy. The hyper-parameters “learning_rate” and “learning_rate_init” are responsible for optimizing and minimizing the loss function. We used the “adaptive” learning rate to keep the learning rate constantly equal to the initial learning rate as long as there is a decrease in the training loss in each epoch. “Activation” determines how active a specific neuron (hidden unit) is. We adopted the widely-used ReLU activation function to determine how active a specific hidden unit is.
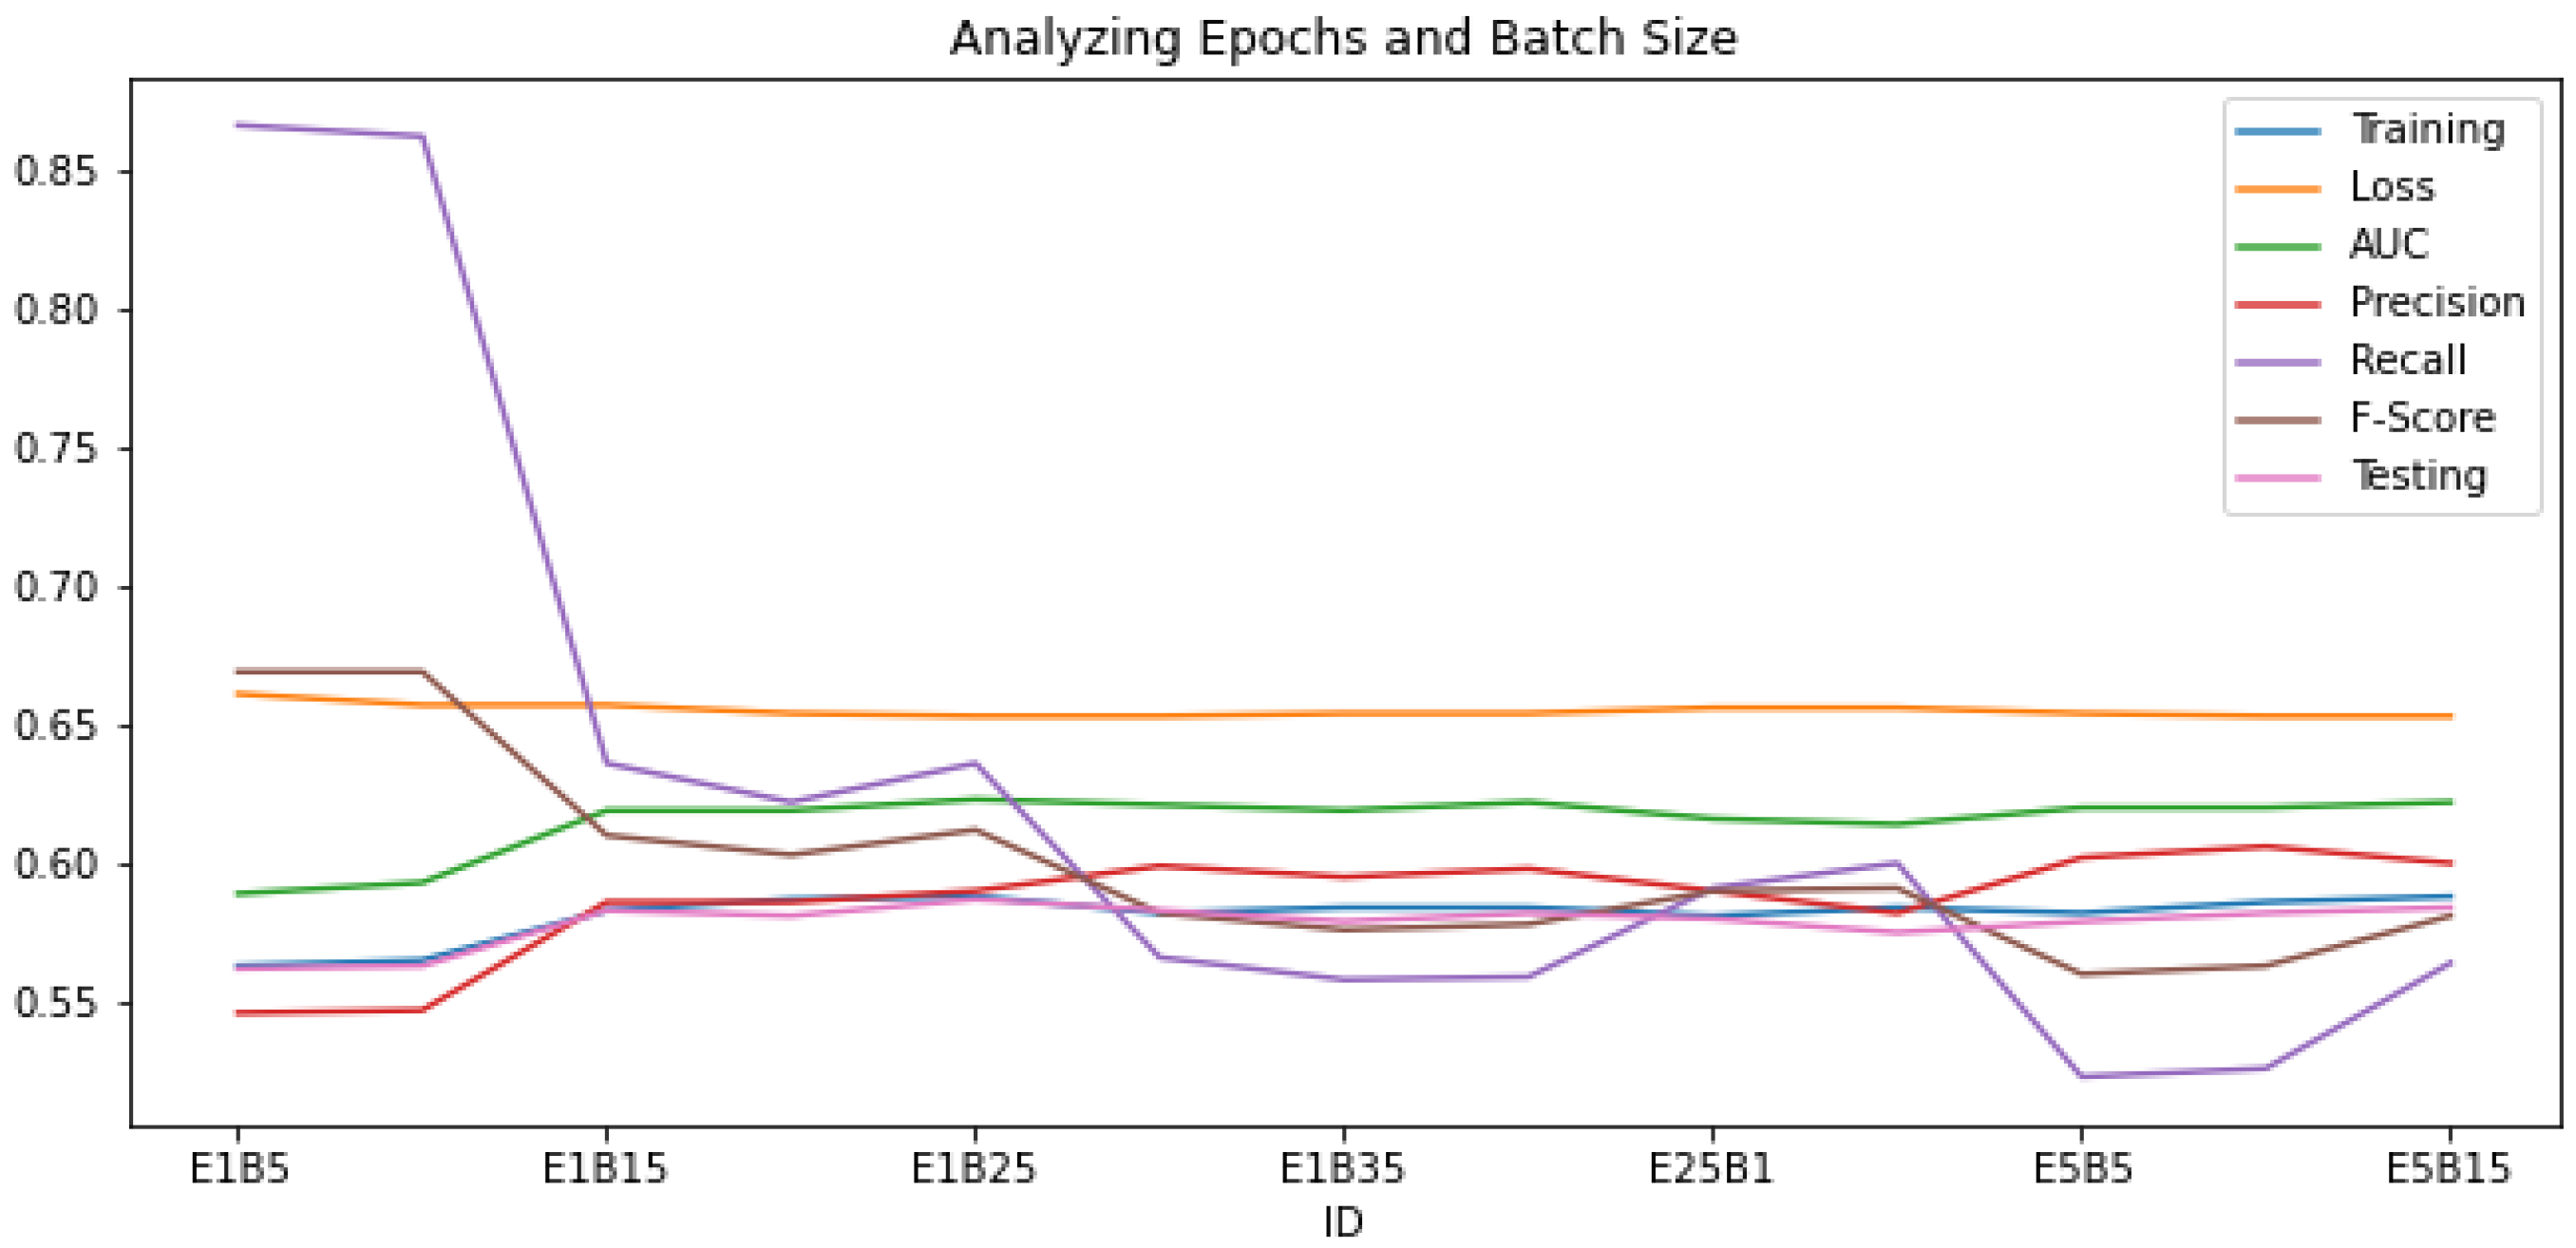
The training and testing results of different epochs and batch settings (EiBi, where i is the size of each epoch and batch) are shown in
Table 9.
Figure 8 is generated from
Table 9 to identify the most stable epochs and batch pairs in terms of loss and accuracy. In
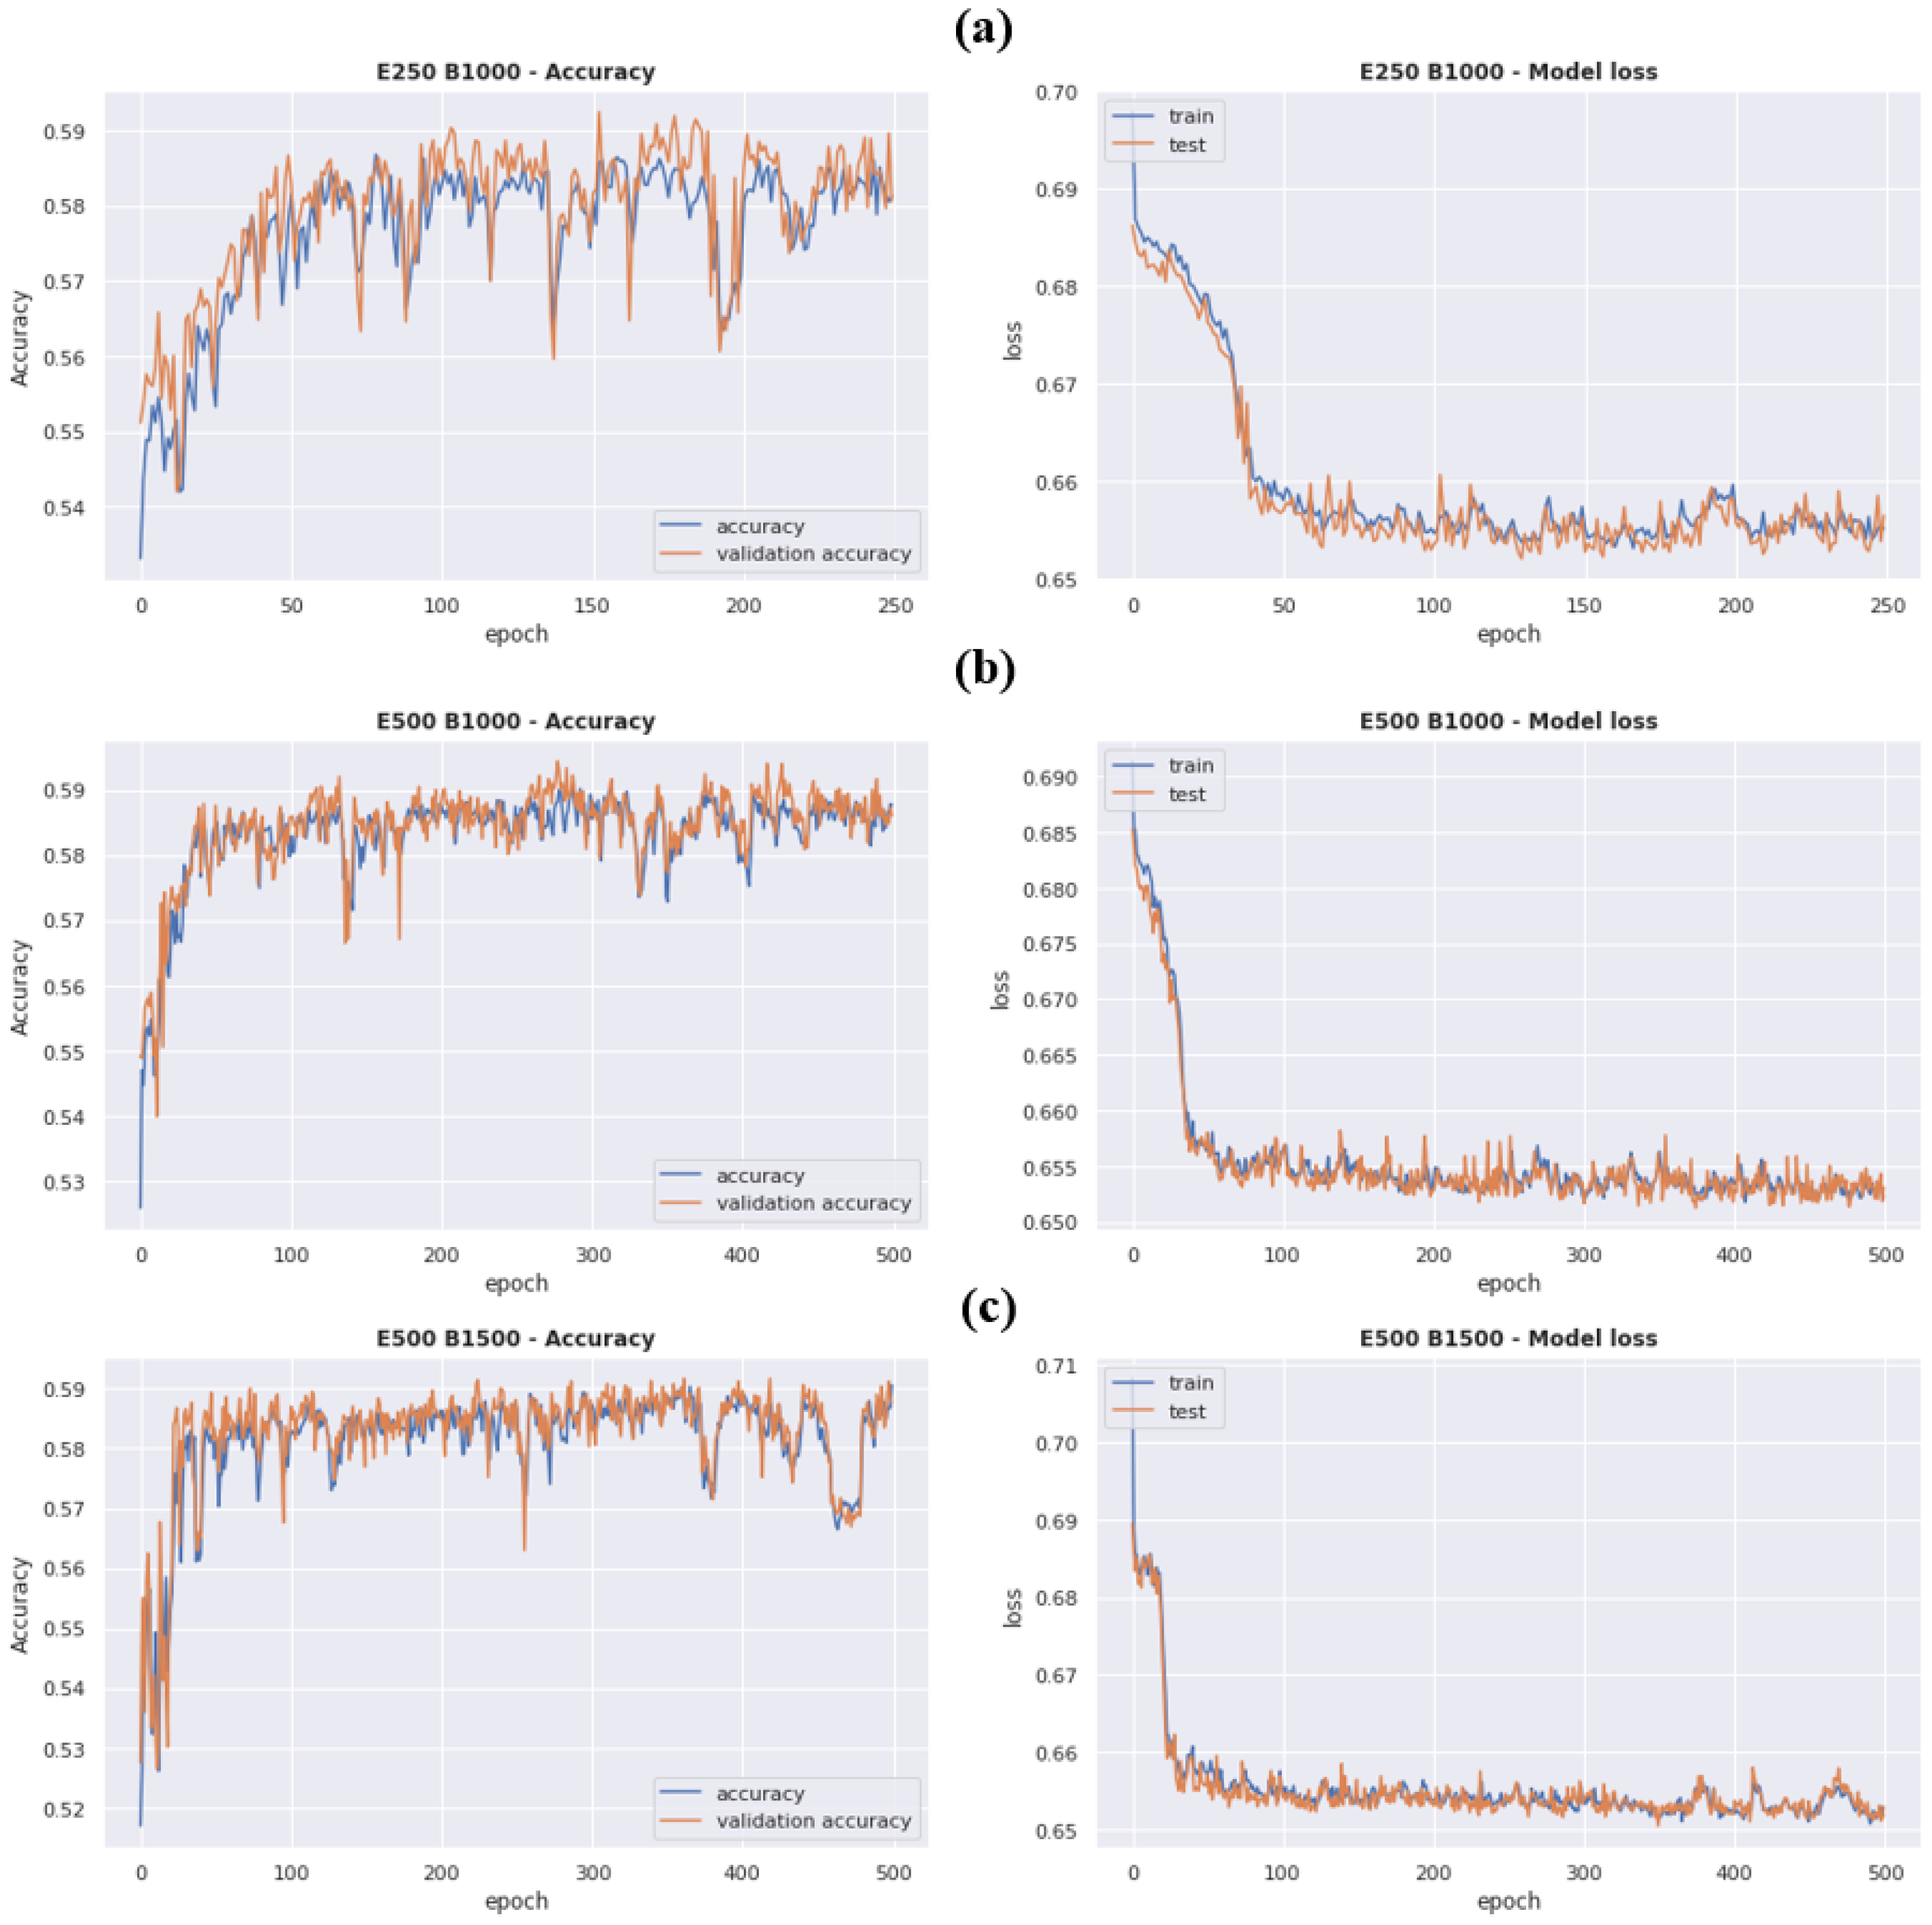
Figure 8, the loss has a slight decreasing curve as we move from E1B5 to E5B15 with an increased value of AUC. However, we can notice that F-score and recall dropped first but became stable again at E5B15. Hence, the E5B15 setting, with the epoch size of 500 (E5) and batch size of 1500 (B15), resulted in the highest training and testing accuracy of 0.588 and 0.584, respectively, with a loss of 0.653 and an F-score of 0.581. In
Figure 9, the accuracy and loss curves of different epoch combinations and batch sizes are shown. It can be observed from
Figure 9c that epoch size of 500 and batch size of 1500 (E500, B1500) have better results compared to (E150, B1000) and (E500, B1000).
4.5. Impact of Multisource Data on the Prediction Performance
Apart from training and validating ONSP on integrated data discussed above, the proposed model is also evaluated to investigate the relationship of occupancy with pedestrian volume, traffic flow, and weather conditions resulting in eight possible combinations, as shown in
Table 10. These combinations include occupancy (O), occupancy_weather (O_W), occupancy_pedestrian (O_P), occupancy_traffic (O_T), occupancy_weather_pedestrian (O_W_P), occupancy_weather_traffic (O_W_T), occupancy_pedestrian_traffic (O_P_T) and occupancy_weather_pedestrian_traffic (O_W_P_T). The performance in term of accuracy is observed as 71%, 79%, 67%, 60%, 80%, 79%, 62%, and 80%, respectively using 6 folds validation. The results indicate that the overall training accuracy of the model has increased when the occupancy data has integrated with traffic, followed by pedestrians and weather.
Interestingly, a higher performance is observed with the data segment mapped for all occupancy streets and weather, followed by pedestrians and traffic with common street mapping. For the pedestrian and traffic datasets, the performance varies with street mapping. For example, the pedestrian data sharing 20 common streets with the occupancy data resulted in an accuracy of 67% in O_P datasets, and traffic data sharing seven streets with occupancy data resulted in an accuracy of 60% in the O_T combination. The presence of weather data in any combination has improved the accuracy to 80%, 79%, and 80% in O_W_P, O_W_T, and O_W_P_T combinations. Performance could have been even higher with more street data available for pedestrian and traffic segments since no common streets were identified between these two in the dataset used for this study.
4.6. Prediction Using Stream Analytics
To scale the proposed solution for a big data environment, real-time analytics was performed. Previously in [
25], the real-time prediction was implementable at a small scale, and due to missing location features, drivers spent more time searching for a parking space.
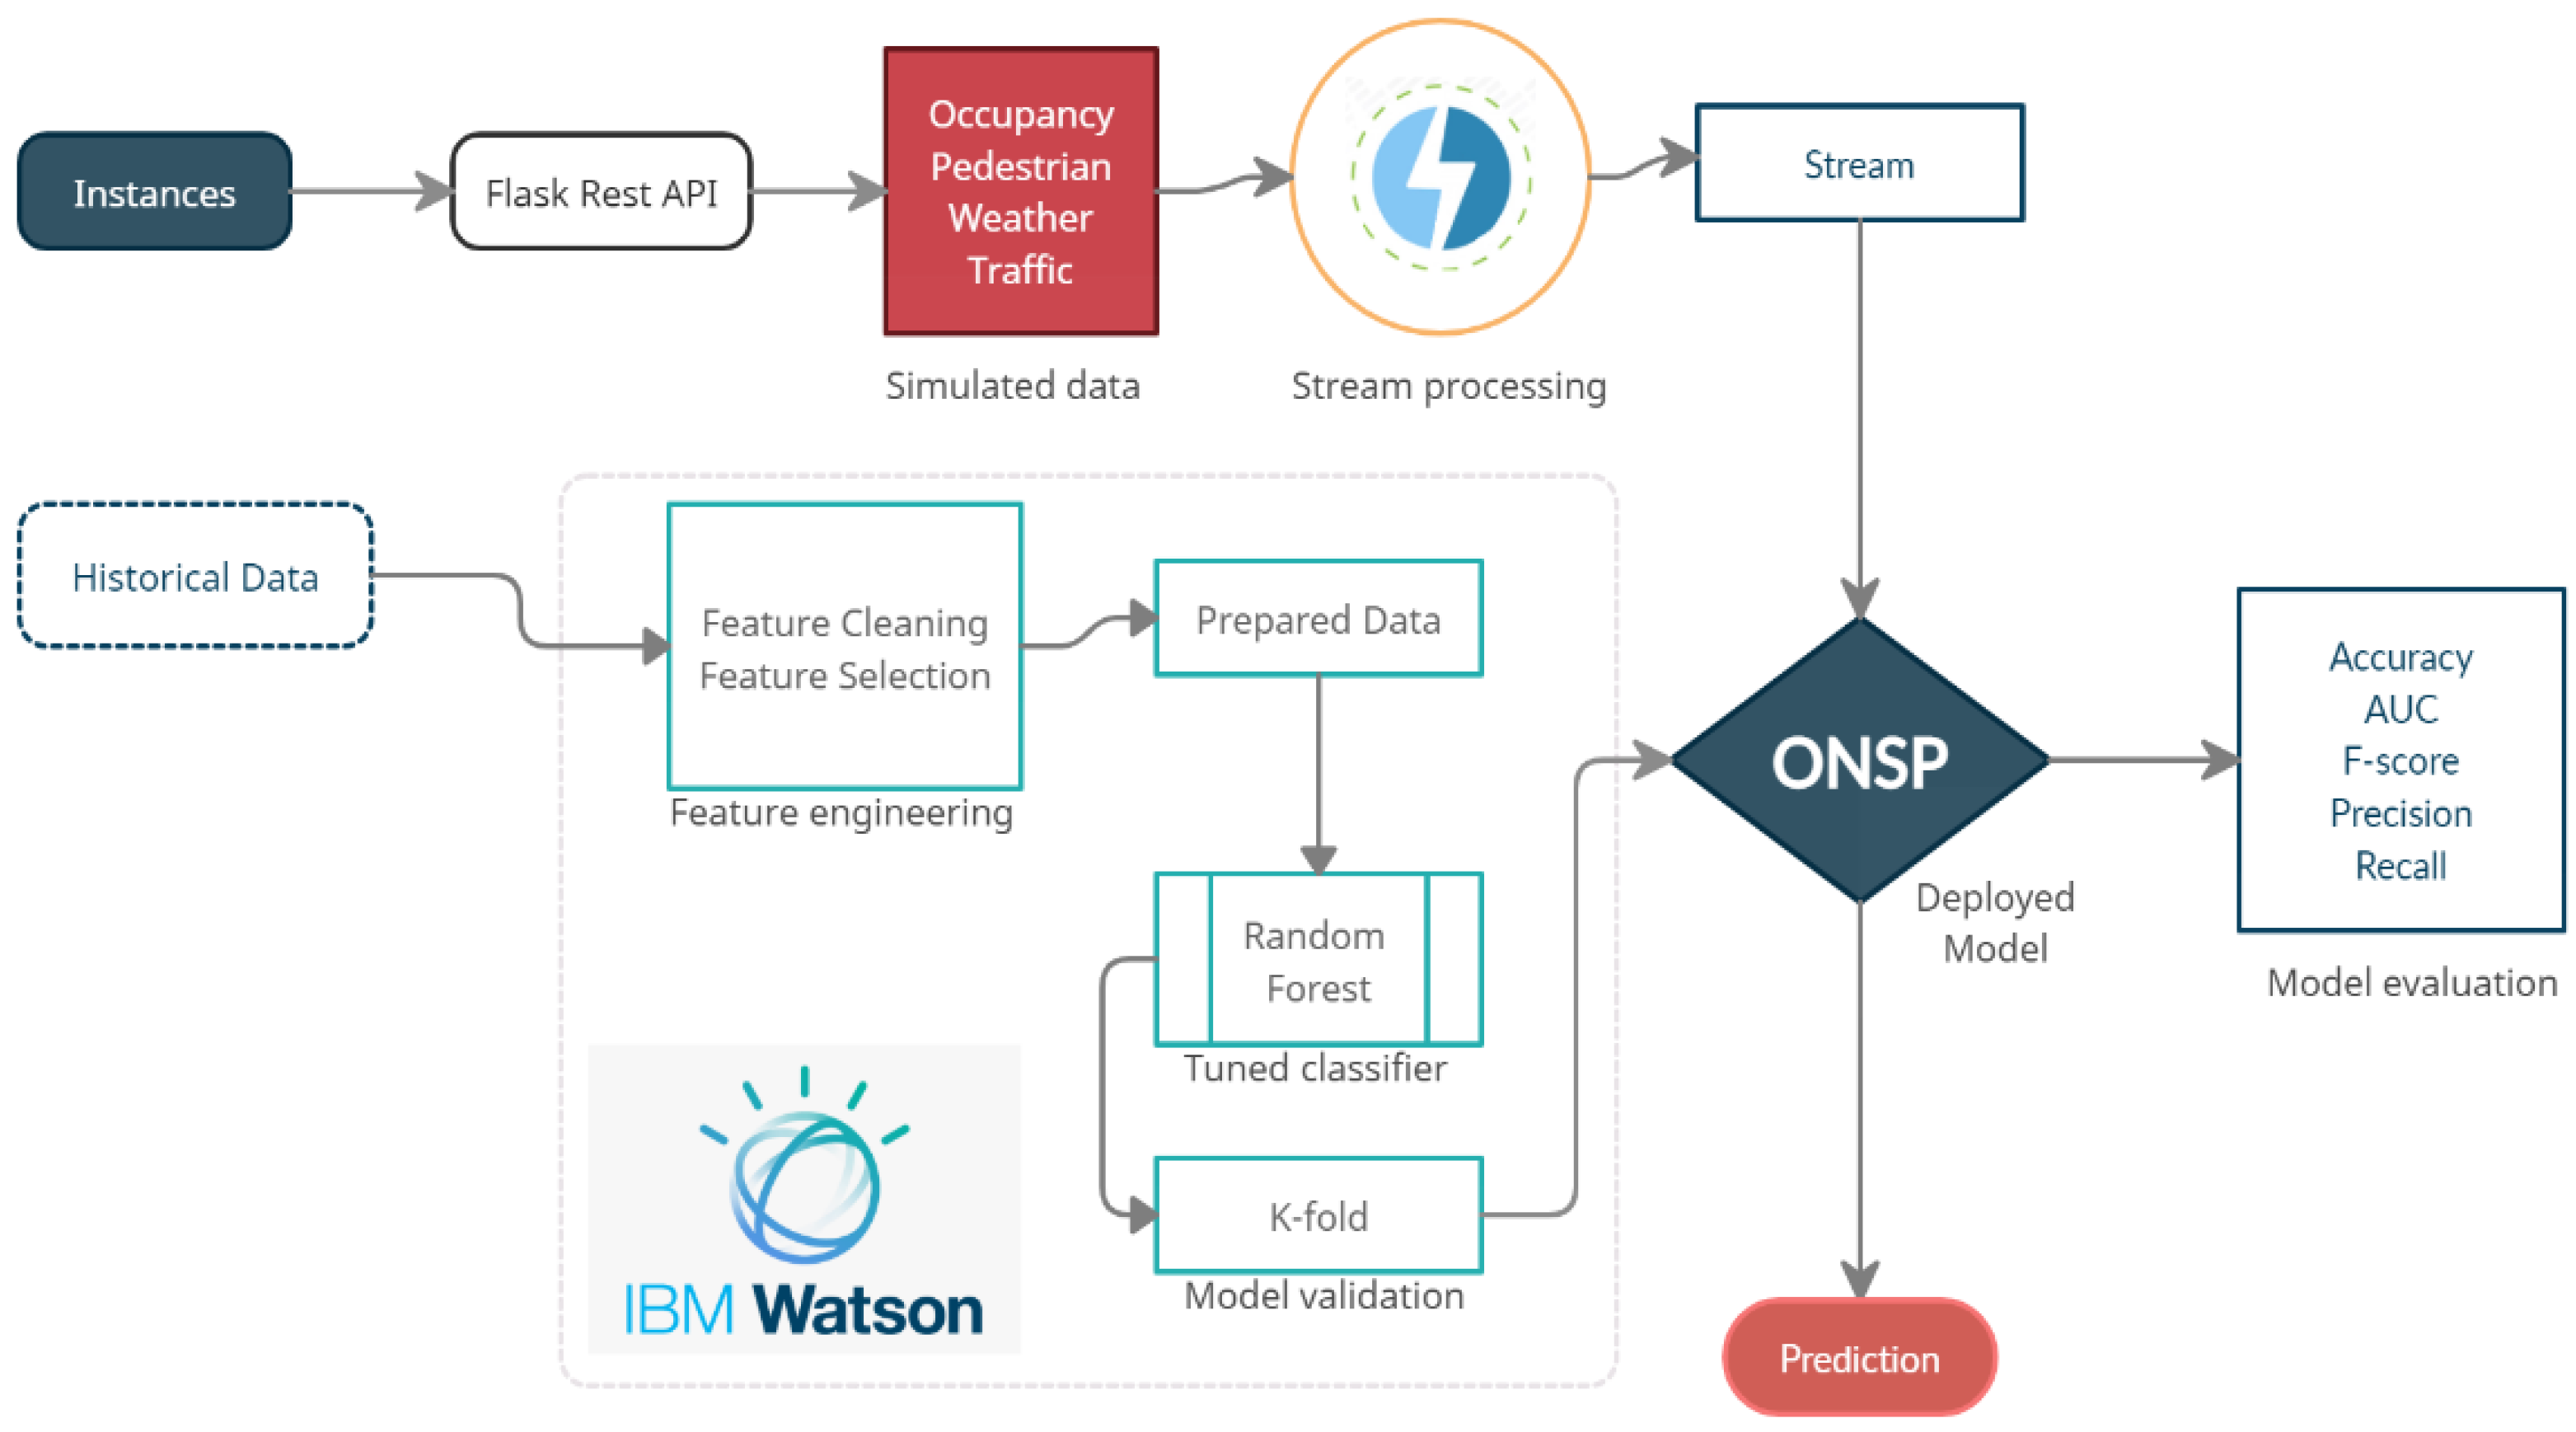
Hence, this study has fulfilled these gaps for on-street parking prediction using the ONSP for live predictions on IBM Watson, making the prediction system scalable for a big data environment. Also, the prediction is based on the precise location features (Side_Of_Street, Area, O_BetweenStreet1, and O_BetweenStreet2) that help reduce search time. The ONSP predicts a sample size of approximately 100 instances. A dataset of this size is used because of the limited cloud storage available in Lite Plan, but the whole procedure is scalable for large data using advanced plans.
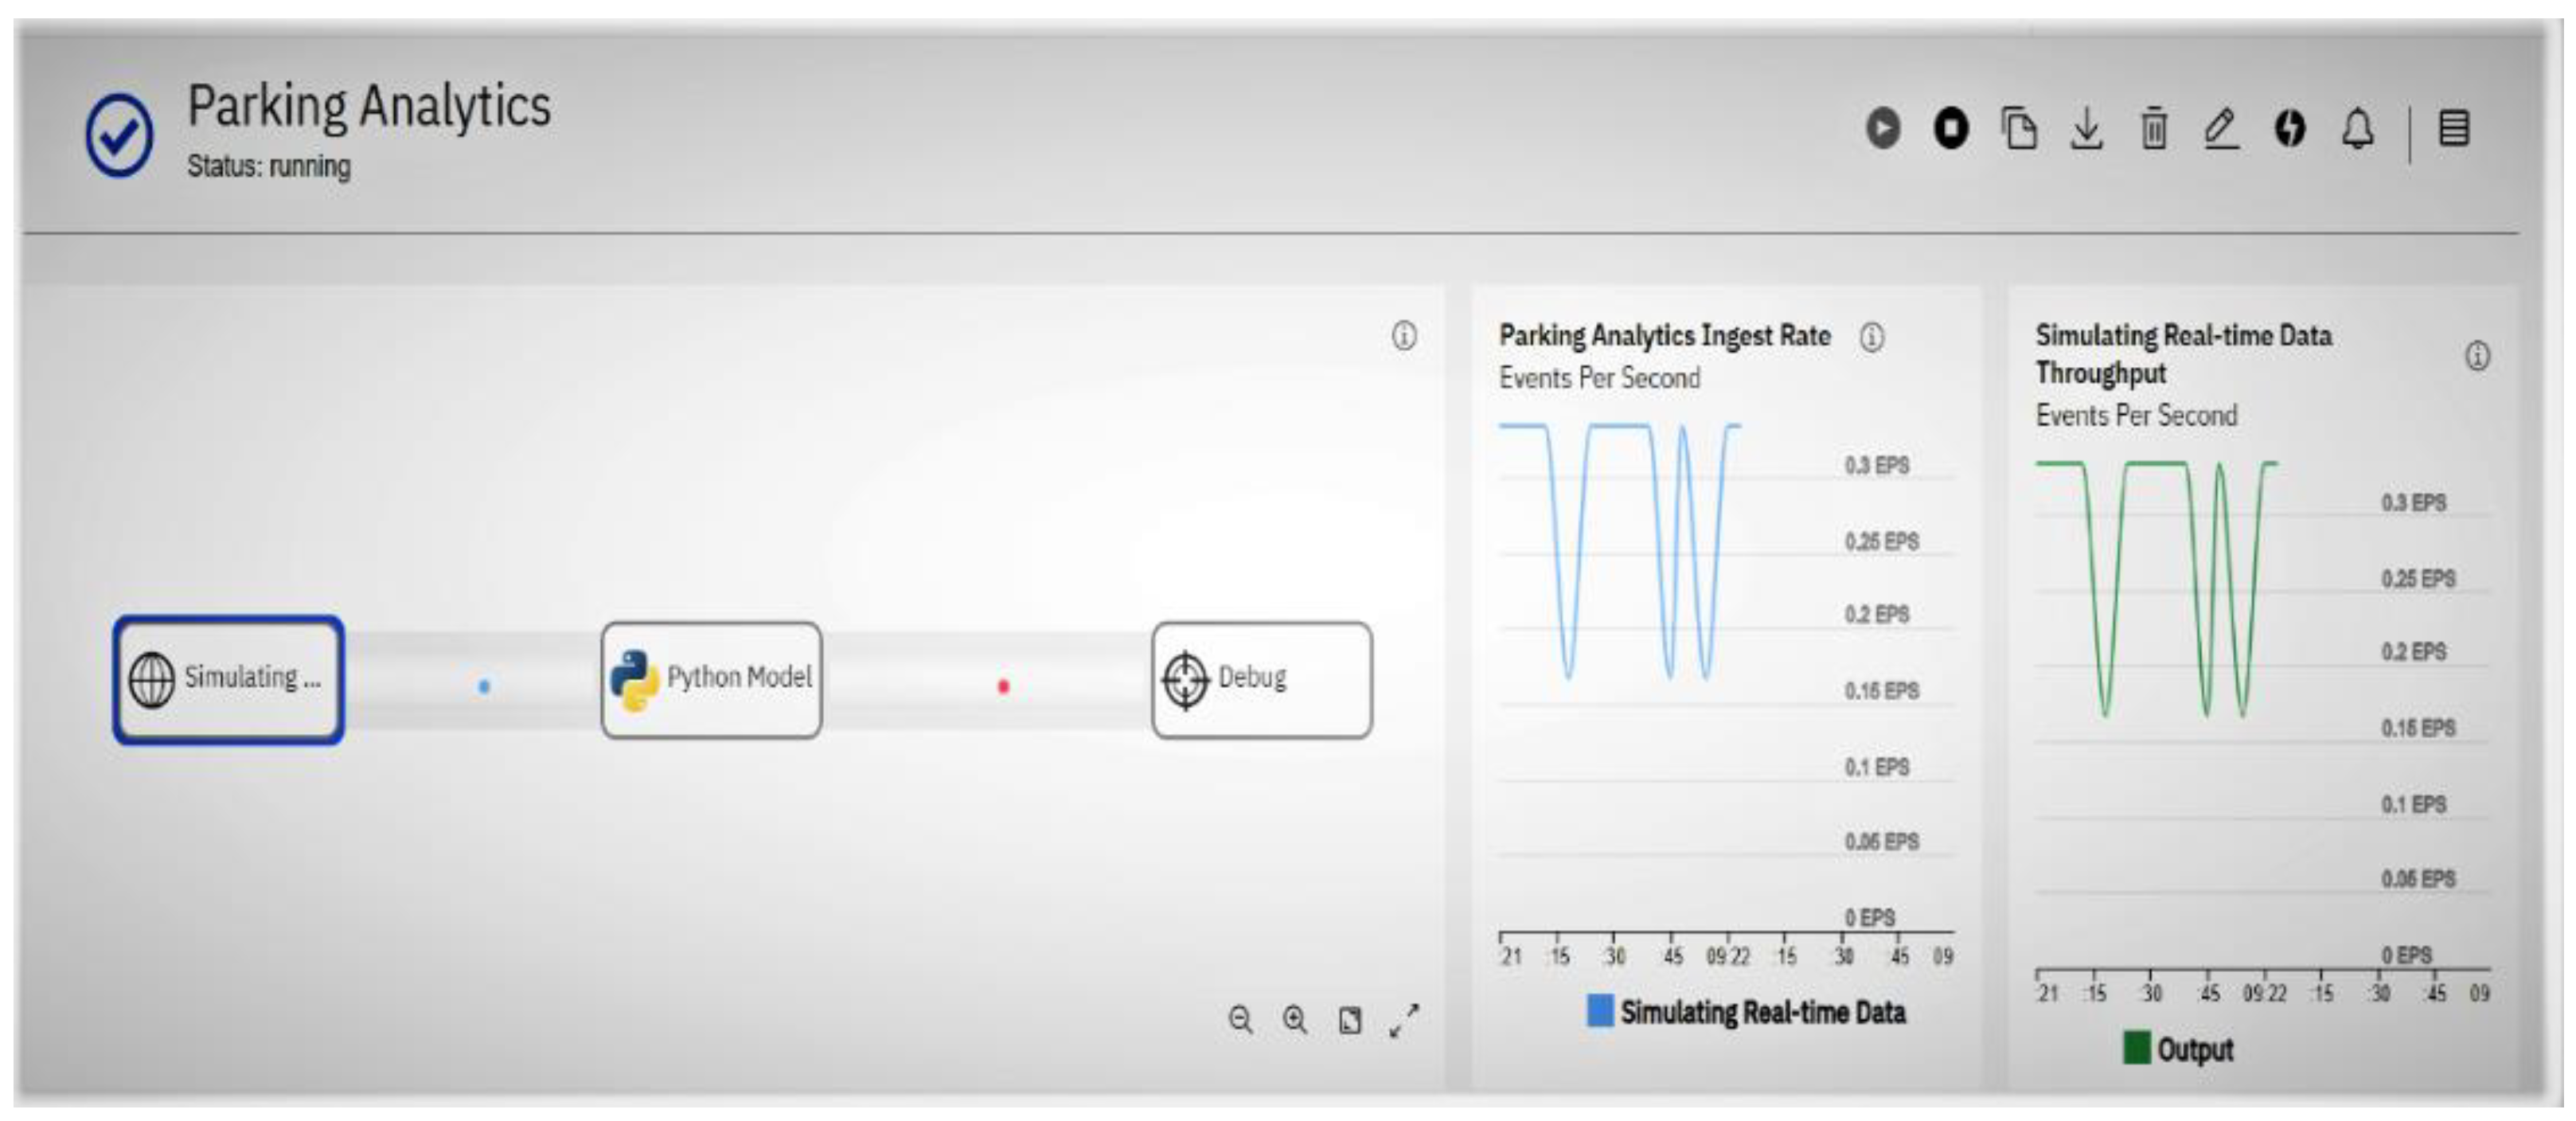
The streaming flow is shown in
Figure 10, where the first operator with the label ‘Simulating’ generates the data streams. The second operator with the label ‘Python Model’ is the trained ONSP model, which is used for predicting incoming tuples. The predicted outcomes can be accessed from the ‘Debug,’ the third operator. The analytics performance is evaluated using two performance metrics: ingest rate and throughput. Ingest rate shows the number of events submitted to streamflow per second. From
Figure 10, we can see that 0.1–0.3 events are received by the sample data operator per second (shown in the blue line). The throughput rate measures the flow of predicted events, which is equivalent to the ingest rate (shown in the green line). Both graphs show a steady flow of events suggesting that instant predictions occur as soon as the events are ingested.
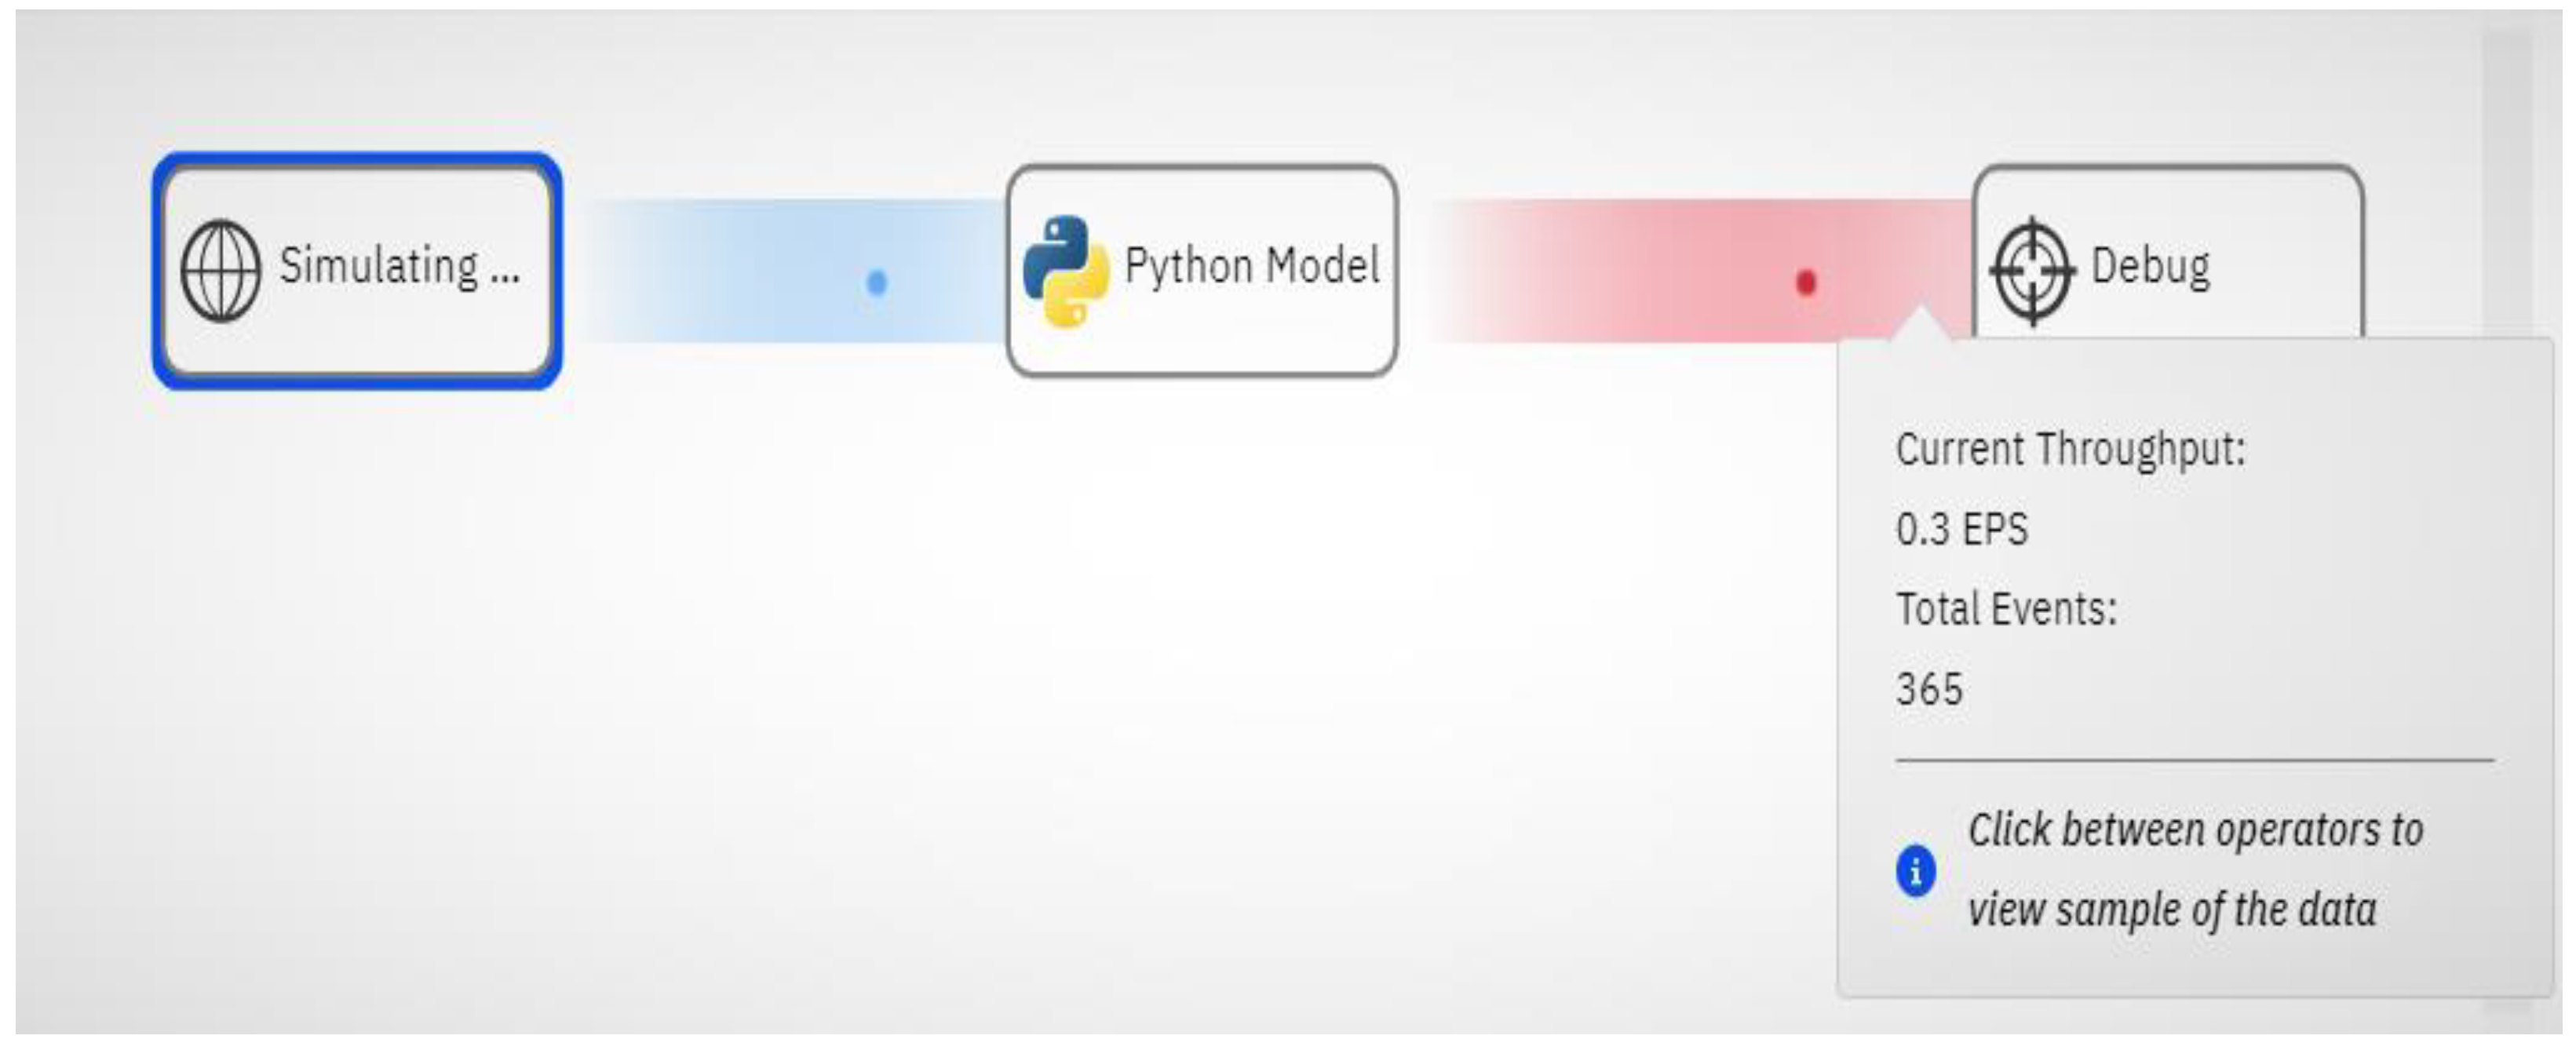
The live streaming was performed for 30 min with a constant rate of 0.1–0.3 events per second, resulting in 360 events (see
Table 11). The total number of events shown in
Figure 11 is 365, approximately what is calculated in
Table 11.
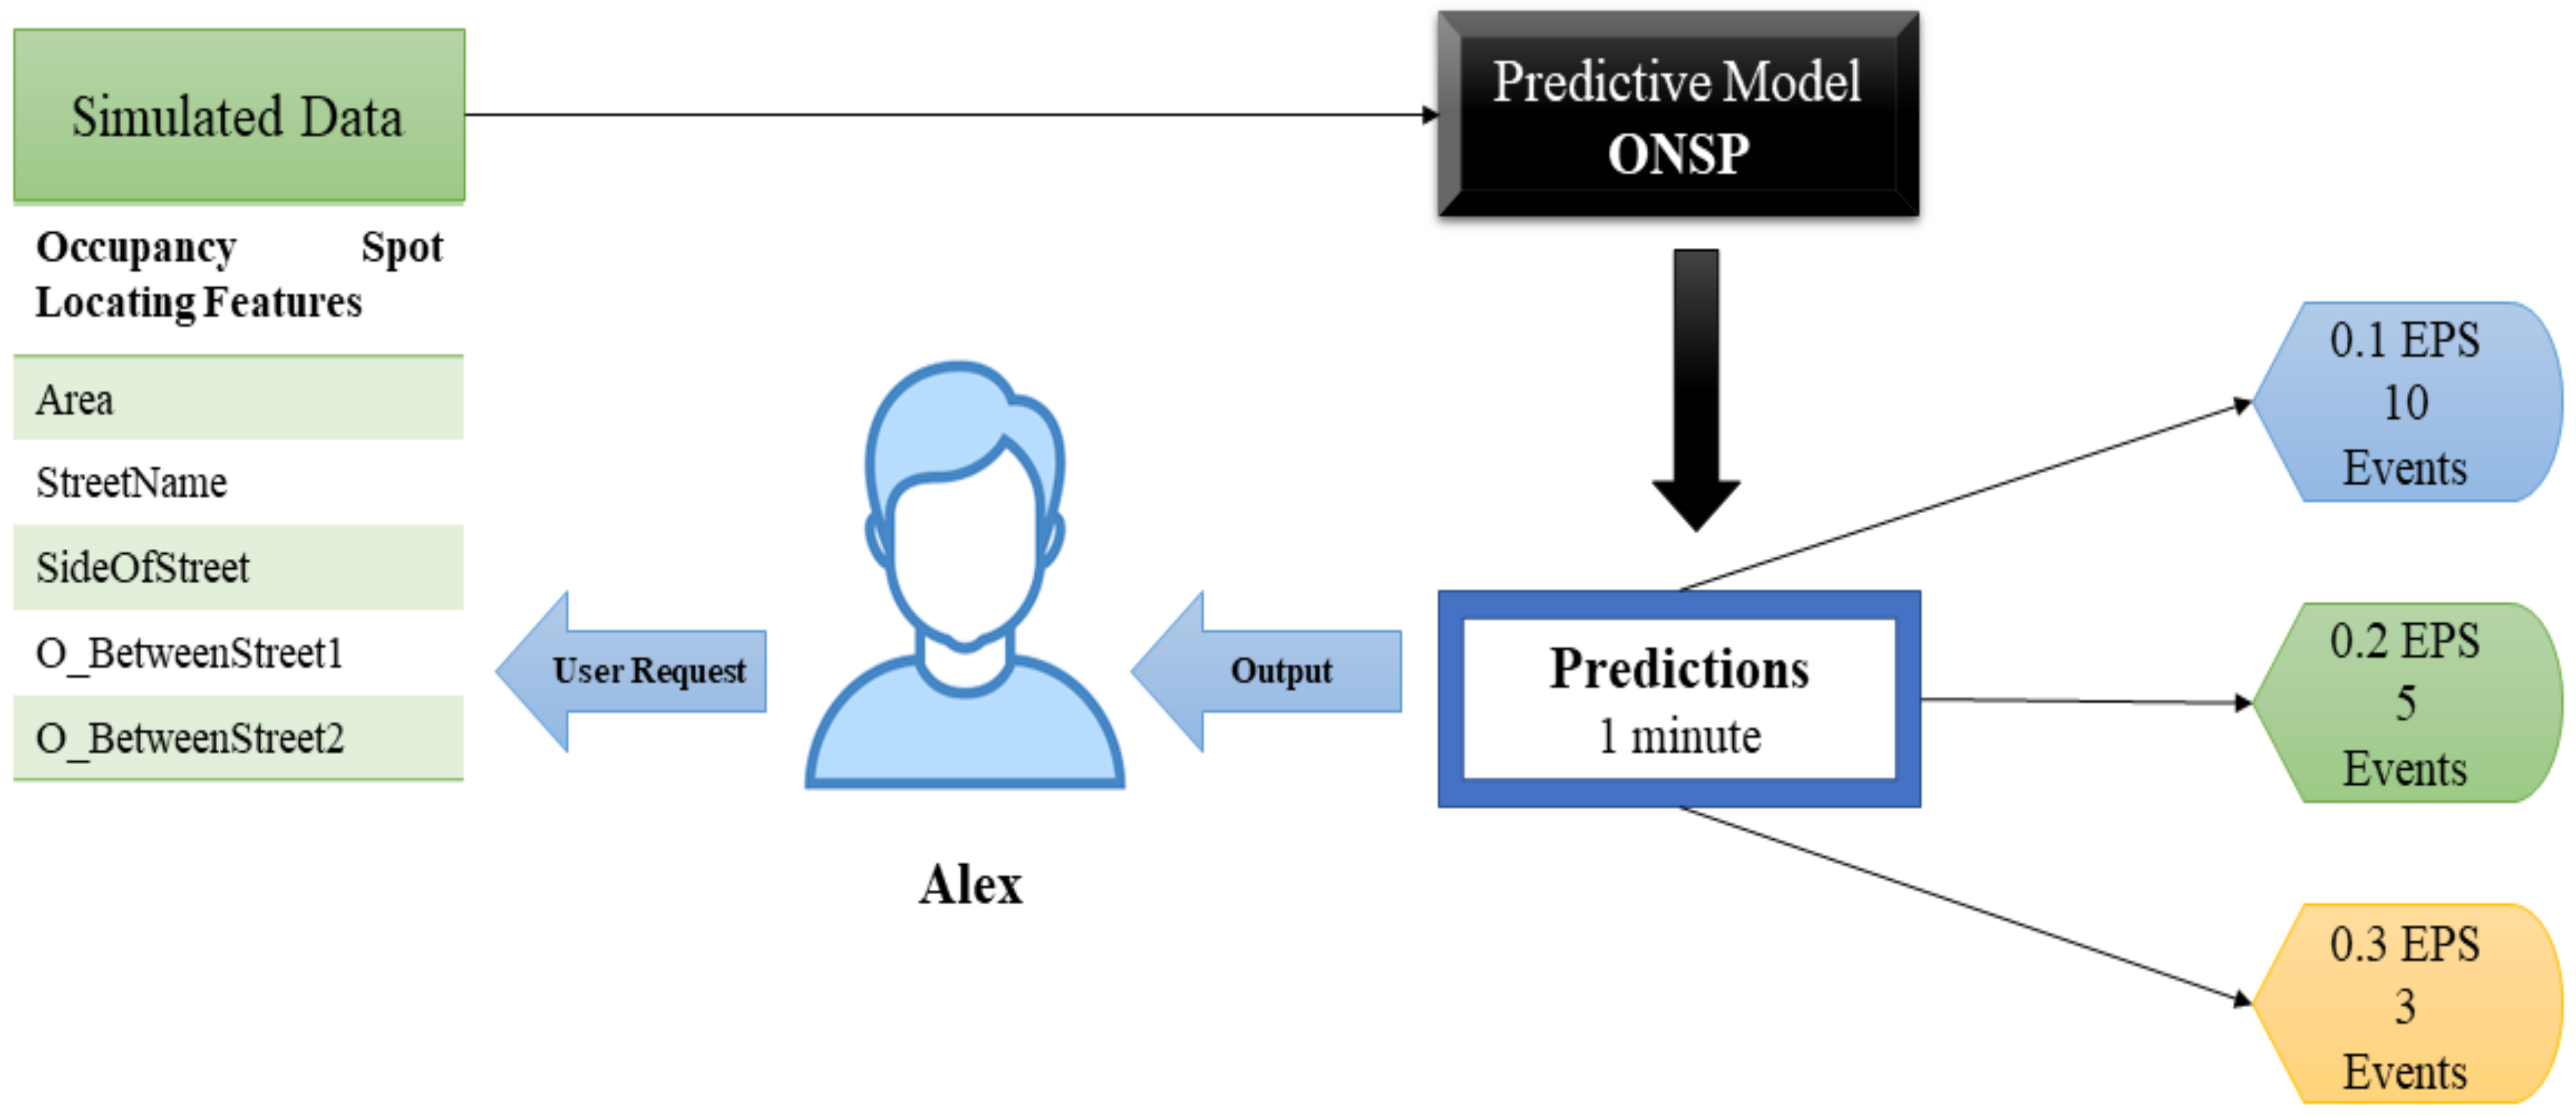
The process of on-street parking prediction is summarized with a use case, ‘next best option strategy,’ shown in
Figure 12. In Use Case—1, Alex predicts occupancy through a user request. On submitting a request, the feature values are ingested by the ONSP. Although the data is simulated in the use case, data generated from an IoT infrastructure can be ingested precisely in the same way. The ONSP is thus predicting the occupancy for Alex using data. In analyzing the prediction based on the observed results shown in
Table 9, with a rate of 0.1, 0.2, and 0.3 EPS, 10, 5, and 3 events can be predicted in a 1-min duration using IBM Lite Plan (
https://cloud.ibm.com/docs/Db2onCloud?topic=Db2onCloud-free_plan, accessed on 1 January 2022).
5. Future Implications
The prediction for on-street parking spots depends on the two types of models. The first is training the model on historical data, which is adopted in this study. As shown in
Figure 13, the second model is the most used for live predictions using basic stream operations. In the future, both model types can be integrated based on how advanced a parking spot prediction is needed. To predict a parking spot within 30 min, the ONSP model can select the best possible options based on the weather, traffic, and pedestrian load. On the other hand, the basic stream operations can be performed in predicting spots within a time span of 5–10 min.
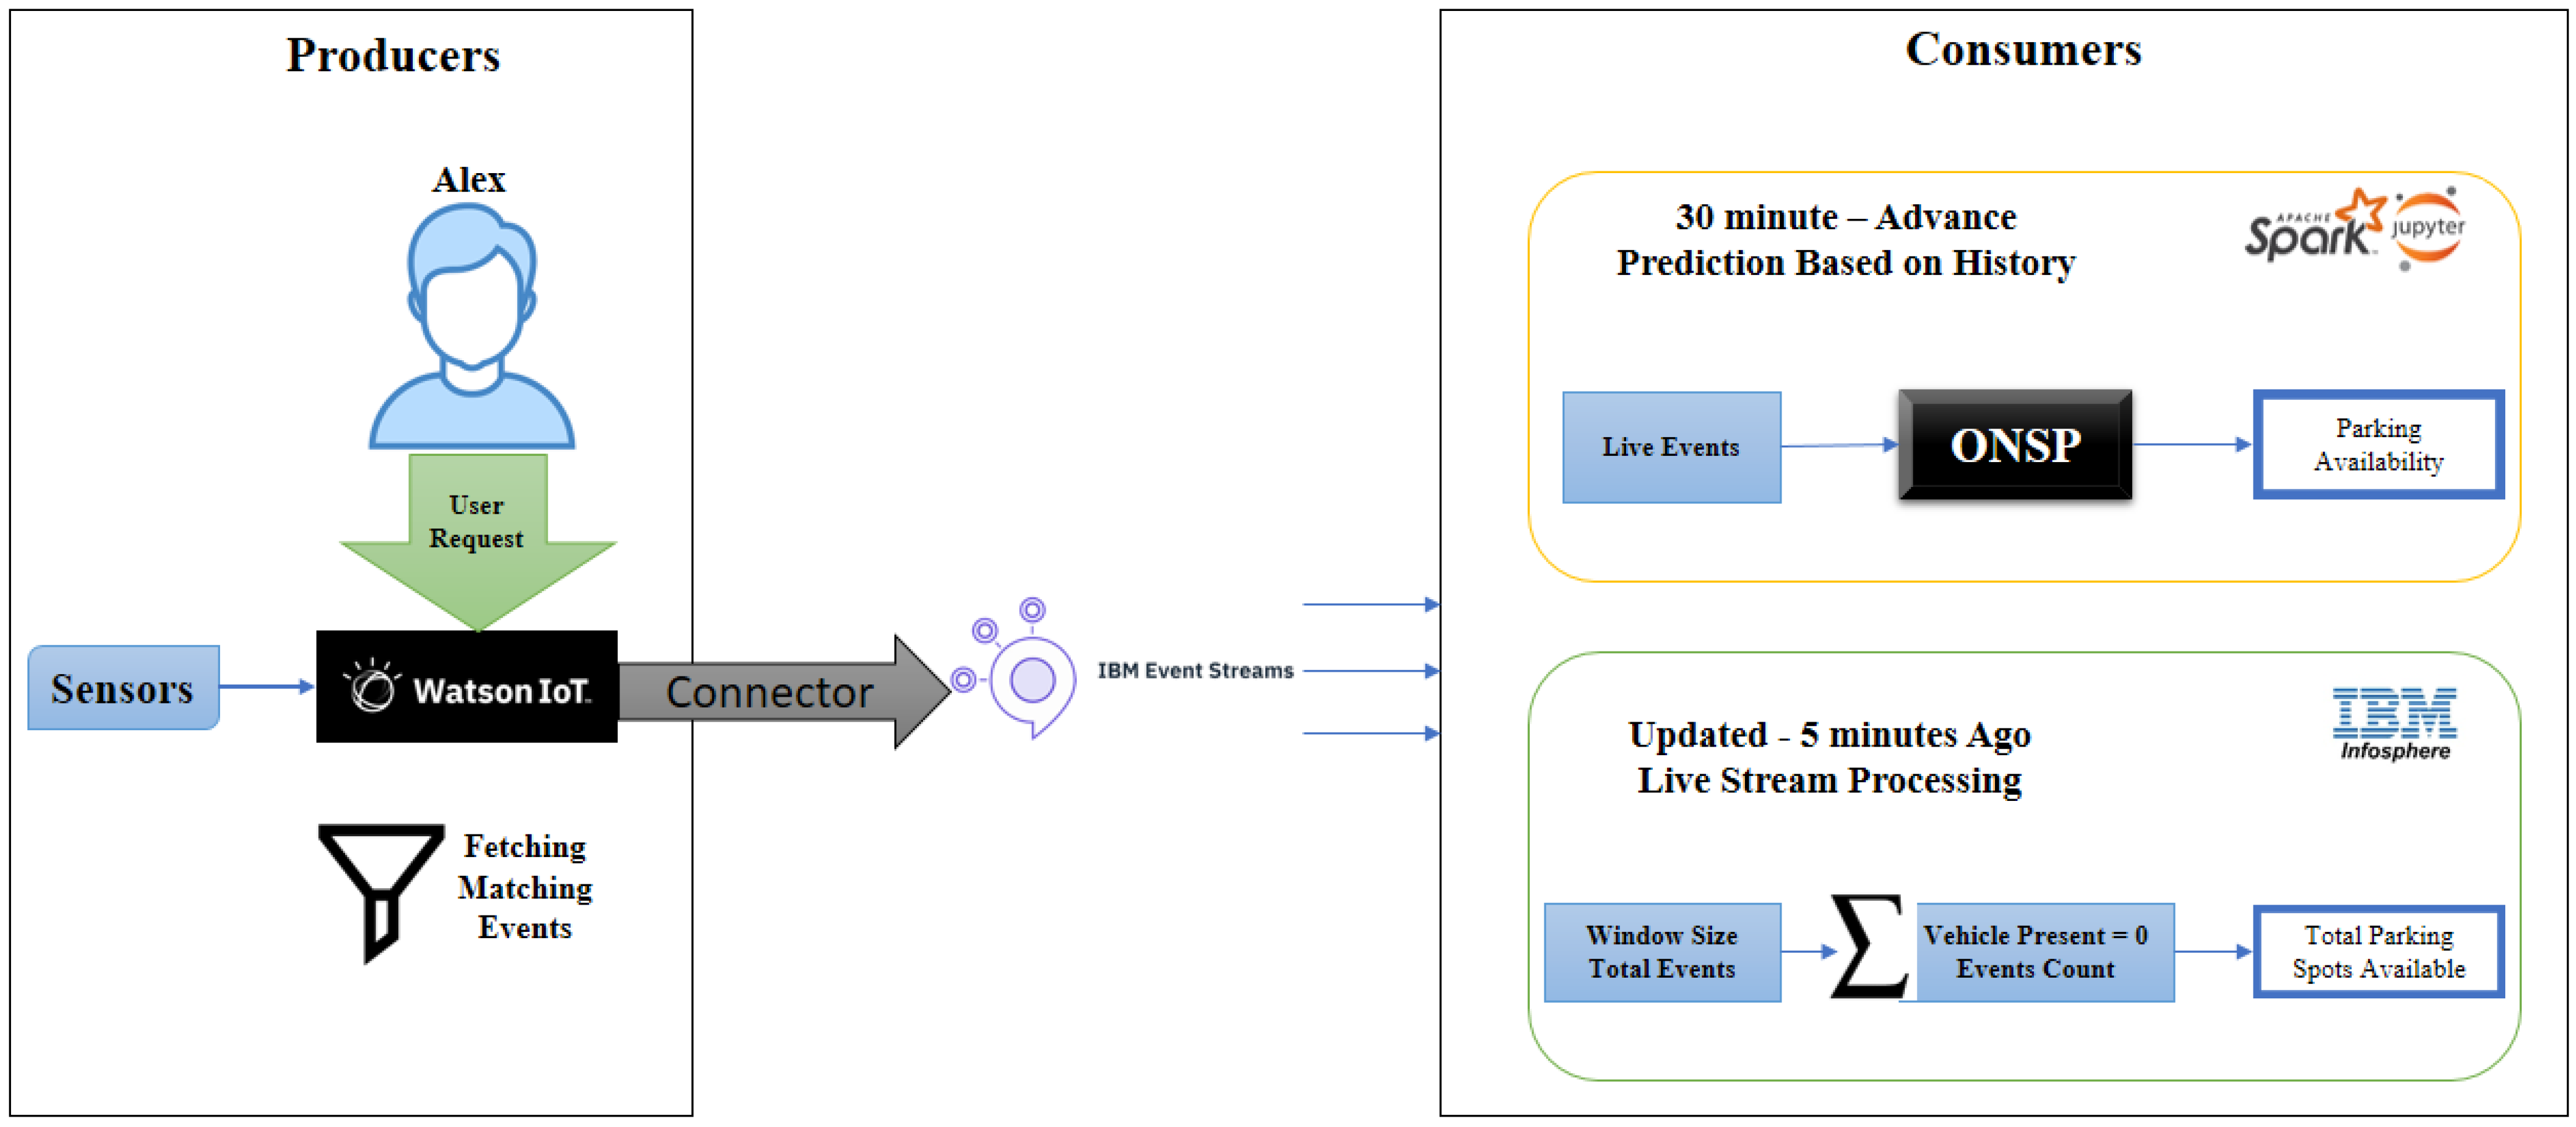
In the live prediction based on the window size, for instance, 5 min, all the number of records with ‘vehicle presence’ with a value equal to zero can be considered as available spots. If the live data is updated after every five minutes, the information of available spots will generate based on the buffer size; for example, in the last five minutes, the available parking spots were 6 or 8 based on the location. The processing of live streams can be performed in the IBM Infosphere (
https://www.ibm.com/docs/en/streams/4.1.1?topic=welcome-introduction-infosphere-streams, accessed on 1 January 2022) environment. Use Case—2 demonstrates an end-to-end pipeline as a future perspective to fetch the data from sensors in predictions by utilizing the available services and our research work.
In the first step, the relevant records will be filtered based on the user requirements using the Watson IoT Platform. The filtered records will then be sent via Kafka as input to the next step. In the third step, depending on the size of the time window, the relevant model can be utilized for making live predictions.
6. Conclusions
This paper presents an end–end ML pipeline for parking prediction, which we plan to integrate into a smart parking application. The application will help drivers find the nearest parking spot in advance. We integrated contextual factors such as weather conditions, traffic flow, and pedestrian volume with occupancy data to determine parking space reliably and accurately. At first, feature engineering is performed to identify the predictive capabilities of different features from each dataset. Then several ML/DL algorithms were trained and tested on the different combinations of the historical dataset to evaluate if better results could be produced for the parking space availability prediction problem by using less complex algorithms. From the results of the comparative analysis, we found that Random Forest is the optimal solution for the parking space availability problem with an accuracy of 81%, and Decision Tree was the close second best model with 77.7% accuracy. These two models consistently outperformed one of the computationally complex algorithms (Multilayer Perceptron). We selected Random Forest for subsequent analysis and real-time deployment for the On-Street parking prediction problem (ONSP).
The results indicate that contextual features have improved the prediction accuracy by 10% compared to the models only tested on basic occupancy data. The most significant data points from the contextual features are wind direction, humidity, temperature, and pressure from the weather dataset, parking duration and location from the occupancy dataset, and hourly count and time of the day from the pedestrian dataset. We did not observe any significant impact on the traffic dataset; the reason is the limited traffic information available for occupancy data compared to weather and pedestrian. However, even with the smaller data size, the feature traffic count appeared to be the second most influential variable after parking duration, showing a tight coupling of traffic flow with parking space availability. The ONSP is deployed for real-time predictions using stream processing services in the next step. The simulation results showed an ingest rate of 0.1 and a throughput of 0.3 events per second, demonstrating a fast and reliable prediction approach for available slots within a time frame of 5–10 min.
Results prove the worth of the proposed prediction pipeline over existing techniques in predicting parking availability in time frames (e.g., 15 min, 30 min) by considering multiple contextual factors. The study has a limitation in terms of the datasets used. We used multiple datasets for the year 2017, and since then, there has been a significant update on multiple data sources, especially in terms of traffic flow in the City of Melbourne. Providing the updated data associated with multiple sources might impact the results. However, it is worth mentioning that this study aims to identify the predictive capabilities of underlying features from each data source used in the study so that future research will consider the influence of such variables on parking prediction. Another limitation is the real-time prediction of simulated data; however, the data generated by the IoT sensors and devices can be ingested by the ONSP model precisely in the same way. Hence, combining real-time data with ML approaches can be a useful step toward sustainable parking solutions.
In the future, we intend to explore more contextual features of the research study, such as special events around, to understand how temporal points of interest can impact prediction accuracy [
32]. We will leverage the historical dataset to more recent data and evaluate more deep learning techniques (LSTM, GRU, etc.). Finally, we plan to develop a web-based application for the end-users to show parking space availability in a time window of 15, 30 min, and so on.


