Article

Influence of Freeze–Thaw Cycles on Physical and Mechanical Properties of Cement-Treated Silty Sand

Department of Civil and Environmental Engineering, Nazarbayev University, Nur-Sultan 010000, Kazakhstan
*
Author to whom correspondence should be addressed.
Sustainability 2022, 14(12), 7000; https://doi.org/10.3390/su14127000
Submission received: 5 May 2022 / Revised: 27 May 2022 / Accepted: 29 May 2022 / Published: 8 June 2022

Abstract

:
The problem of weak ground conditions is currently of great interest, as with the rapid development of infrastructure, researchers are trying to cope with the improvement of problematic soil properties to build structures on it. In cold regions, the problem of weak soils is further exacerbated by freeze–thaw cycling. For the improvement of soil properties, the soil stabilization method using ordinary Portland Cement (OPC) is commonly applied, but it produces a significant amount of carbon dioxide emissions. Therefore, the purpose of this research study is to present laboratory testing results for the evaluation of soil treatment using Calcium Sulfoaluminate (CSA) cement that has a lesser carbon footprint. On stabilized soil specimens cured for 3, 7, and 14 days and subjected to freeze–thaw cycles, unconfined compressive strength (UCS) and ultrasonic pulse velocity (UPV) testing were performed. Samples were prepared at optimum moisture content using different cement content, 3%, 5%, and 7%. Applying the results from the UCS test, the strength loss/gain and resilient modulus of treated soil were obtained. The test results show that the strength and pulse velocity values decreased with the increase of freeze–thaw cycles. However, improvement in soil performance can be observed with the increase in cement content. Overall, the use of CSA as a stabilizer for silty sand would be useful to achieve sufficient strength of subgrade.

1. Introduction

In regions with a cold climate, soils undergo cyclic freezing and thawing, which subsequently leads to a change in the structure and properties of the soil, which further causes a potential loss of soil strength. The effect of freeze–thaw cycles on soil, especially on problematic soils, can reduce the ultimate strength of soil, and affects the resilient modulus, volume, compressibility, bearing capacity, and microstructure. That can be explained by the formation of ice lenses during freezing and excess water during thawing processes [1,2,3,4,5]. Such soil damage causes the collapse of the infrastructure built on them.
The characteristics of soil can be improved by applying the soil stabilization method, which includes various methods applied to modify soil properties for better engineering performance [6,7,8]. There are two main types of soil stabilization methods, which are physical and chemical soil stabilization. Physical methods are based on the application of physical processes to enhance the soil properties, while the chemical soil stabilization method uses chemicals, emulsions, and various binders [9]. Several research papers have examined the effectiveness of various additives using chemical stabilization techniques in improving soil performance by evaluating the mechanical and physical properties of treated soil subjected to freeze–thaw cycles. Among the existing soil additives, ordinary Portland cement (OPC) in combination with other binding materials (e.g., fibers, fly ash, and lime) is extensively used. Although OPC has been widely utilized in geotechnical engineering, there is a concern due to the emission of carbon dioxide from the production of cement. Therefore, there is a need for an environmentally friendly alternative that could replace OPC. One type of sustainable cement is Calcium Sulfoaluminate cement (CSA), which releases 50% less carbon dioxide than OPC, and it is already widely used in the concrete industry for a variety of applications such as bridge construction and concrete pipe manufacturing. Moreover, many research works were carried out to test the CSA cement for ground improvement purposes under various conditions. The results of experimental and numerical studies proved the rapid strength gain property of CSA cement while comparing it with other binding materials [4,10,11,12,13]. Furthermore, Jumassultan et al. [14] investigated the effect of cyclic freezing and thawing on CSA-treated quartz sand, where CSA-treated sand has shown better performance with insignificant changes after freeze–thaw cycles. However, there is a lack of studies conducted for problematic soils treated with CSA cement under cyclic freezing and thawing.
The treatment of weak soils in severe weather and geological conditions requires the use of modified methods that increase durability and reduce the environmental impact. The use of CSA cement for soil stabilization can be an effective solution to achieve sustainability in the construction industry while reducing carbon emissions and energy consumption.
Table 1 presents the comparison of parameters and conditions used for freezing and thawing tests for experimental works in different research studies. By the review of previous research works and analysis of Table 1, curing conditions and other variables for the current experimental work were decided.
This study aims to investigate the effectiveness of CSA cement treatment to stabilize weak soil subjected to freeze–thaw cycles. For that purpose, this research work focuses on two main research questions. (1) Is the use of CSA cement effective for the stabilization of weak soils? (2) How do freeze–thaw cycles affect CSA stabilized weak soil?
To evaluate the performance of weak soil treated with CSA cement, ultrasonic pulse velocity (UPV) and unconfined compressive strength (UCS) tests under freeze–thaw cycles were performed. The stress–strain behavior, strength loss/gain, and resilient modulus characteristics were analyzed in terms of cyclic freezing and thawing, and cement contents.

2. Experimental Work
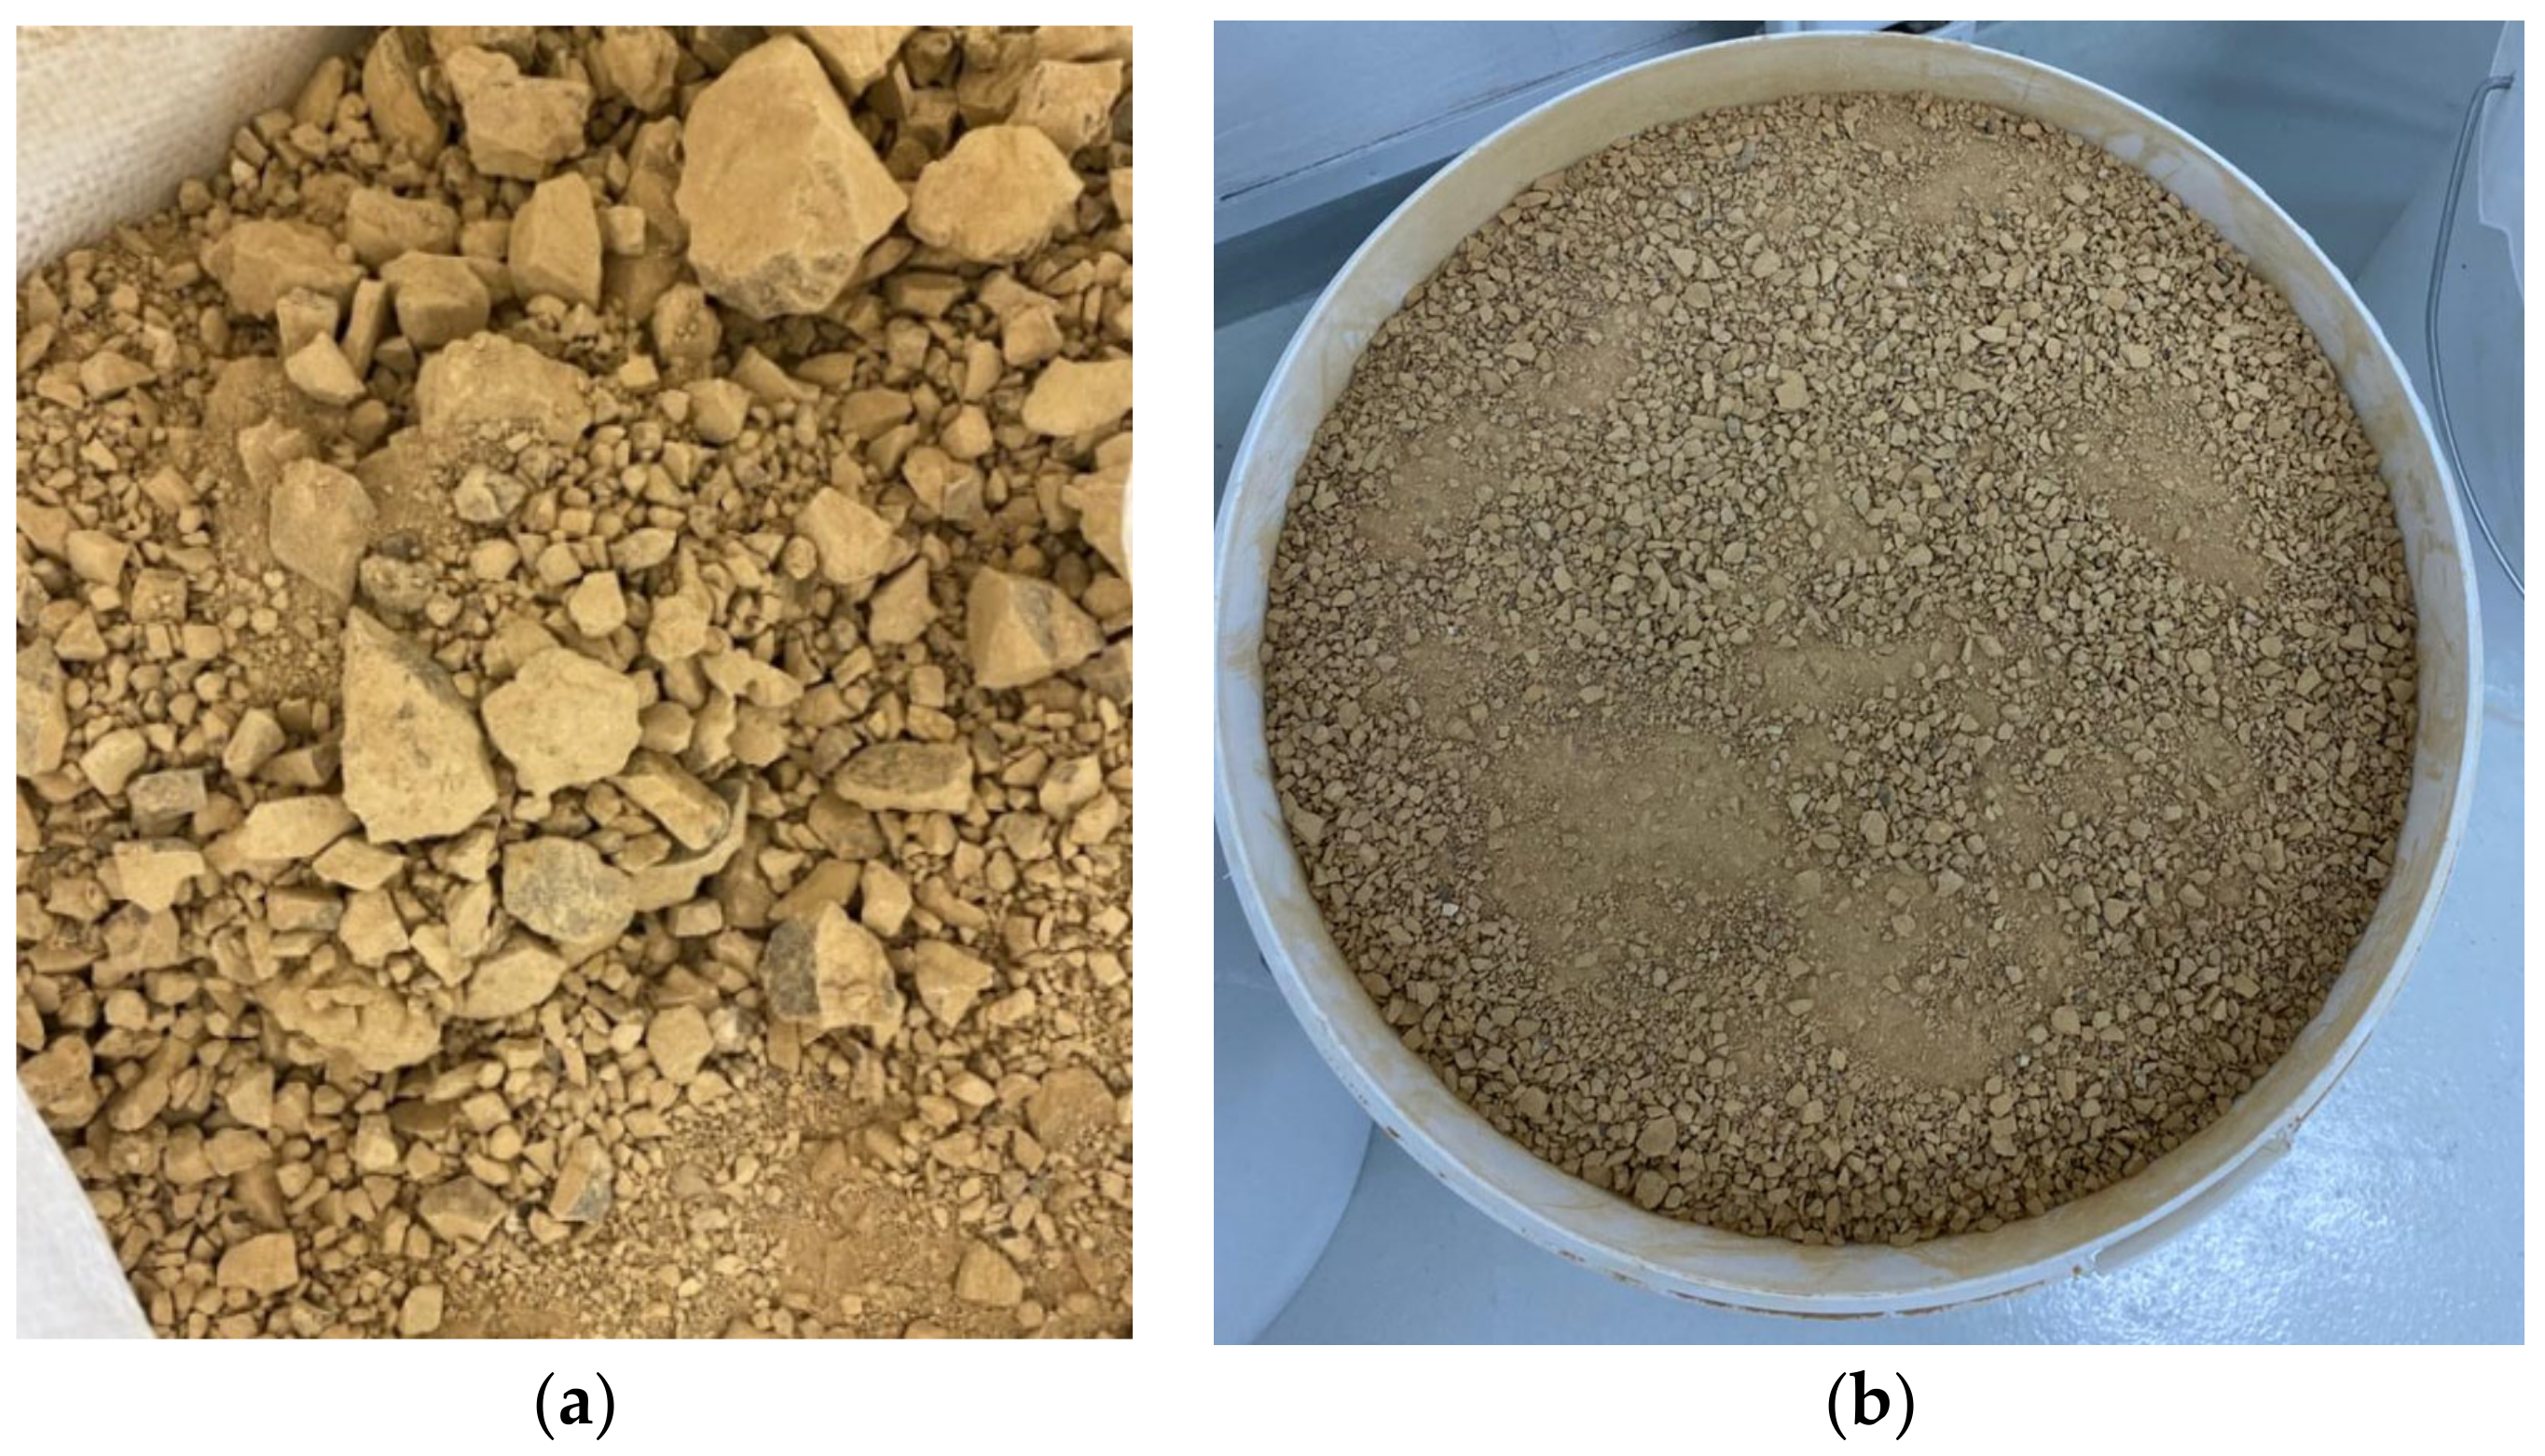
2.1. Materials

The materials used for this study are natural soil, Calcium Sulfoaluminate (CSA) cement, gypsum, and water. Natural soil used in this study was sourced from a land excavation site in Nur-Sultan, Kazakhstan. The soil color is light brown, and the size was not uniform, as shown in Figure 1a. Before the start of the experimental work, soil samples were oven dried. For the evaluation of grain sizes and to conduct other testing, soil grinders were used to get more uniform soil samples and to provide precision in the analysis of results, and the picture of grinded soil was provided in Figure 1b.
The particle size distribution curve of the soil used in this study is shown in Figure 2. The geotechnical properties of the soil are shown in Table 2. Based on the Unified Soil Classification System (USCS), the soil is defined as a well-graded sand with silt (SW-SM).
CSA cement was used as a main stabilizing binder. The CSA cement used in this research work is mainly composed of ye’elimite, belite, and ferrite. The major component of CSA cement, ye’elimite ensures an environmentally friendly production process that leads to a low carbon footprint, whereas the major component of OPC, alite, produces about 2.7 times more carbon during the synthesis of cement [22]. Previous studies have shown that partial replacement (30%) of CSA cement with gypsum will result in a high initial strength gain in the treated soil. Therefore, 30% of the CSA cement was replaced with gypsum [12].

2.2. Mix Design and Sample Preparation

The cement-soil mixture was prepared at an optimum moisture content (OMC) defined from Standard Proctor Test [23]. The results of OMC and maximum dry density (MDD) are shown in Table 3 for the soil samples with 3%, 5%, and 7% cement contents, which are 20.8%, 21.0%, and 22.0% for OMC, 1.67, 1.62, and 1.56 kN/m3 for MDD, respectively. From the results obtained, a certain trend can be traced, when with an increase in the cement content, the maximum dry density decreases, and the optimum moisture content increases. Dry soil was used to prepare the soil-cement mixture since for the Standard Proctor test dry soil is applied.
In this experimental work, the cement content is determined as the mass of cement in the mass of dry soil, while the gypsum content is defined as the mass of gypsum in the total mass of binder, which consists of CSA cement and gypsum. The water content is calculated as the ratio of the mass of water to the total mass of solids (soil and binder). The mixture is prepared in two stages: first, dry materials are mixed, and then water is added. After completing the preparation of the mixture, cement-treated soil samples were prepared in a mold with a diameter of 50 mm and a height of 100 mm in three layers using an under-compaction method [11]. Each layer was compacted 25 times by a hand rammer, and the top and middle layers were scarified to ensure contact between layers. The under-compaction technique was used to keep the uniform density in all layers of the soil sample. Three samples were prepared for each combination. After one day, samples were removed from molds and wrapped with plastic film. Then, the prepared specimens were cured for 3, 7, and 14 days at room temperature.

2.3. Experimental Methods

The experimental program consisted of four main tests, which are freeze–thaw (F-T), ultrasonic pulse velocity (UPV), unconfined compressive strength (UCS) tests, and scanning electronic microscope (SEM) tests.

2.3.1. Freeze–Thaw Test

After the completion of curing periods, soil specimens were put into the freeze–thaw chamber, where the humidity and temperature are controlled, as shown in Figure 3, and cement-soil samples were subjected to 0, 1, 3, 5, 7, 10, and 15 freeze–thaw (F-T) cycles. A closed system was used for the freeze–thaw test, since it can simulate similar conditions with the field where there is no additional water supply, except the water in the voids of soil [24]. The freezing temperature was −20 °C since it is the minimum temperature of the soil in Nursultan, Kazakhstan [25], and the thawing temperature was taken as the room temperature (23 °C), based on previous studies [26]. Freeze and thaw cycles lasted for 12 h each. The duration of one freeze–thaw cycle was 24 h.

2.3.2. Ultrasonic Pulse Velocity Test

As shown in Figure 3, after freezing and thawing cycles ultrasonic pulse velocity (UPV) test was performed. The UPV test was applied for the evaluation of stiffness development of CSA cement-treated samples. The UPV test which is one of the non-destructive techniques can be carried out several times on the same sample and subsequently used for other testing purposes. For this experimental work, the ultrasonic pulse velocity test is conducted using the portable ultrasonic non-destructive digital indicator tester (PUNDIT) device. Before the start of testing, the device was calibrated using the cylindrical block. Figure 3 shows the schematic of the experimental setup, where two transducers of PUNDIT apparatus with a diameter of 50 cm were attached to the surface of samples from both sides. The direct transmission method was used along the longitudinal length of the sample and the UPV value is determined using the travel time along the length of the soil sample. The pulse velocity values are determined from the pulse traveled along the length of the sample [26,27,28,29].

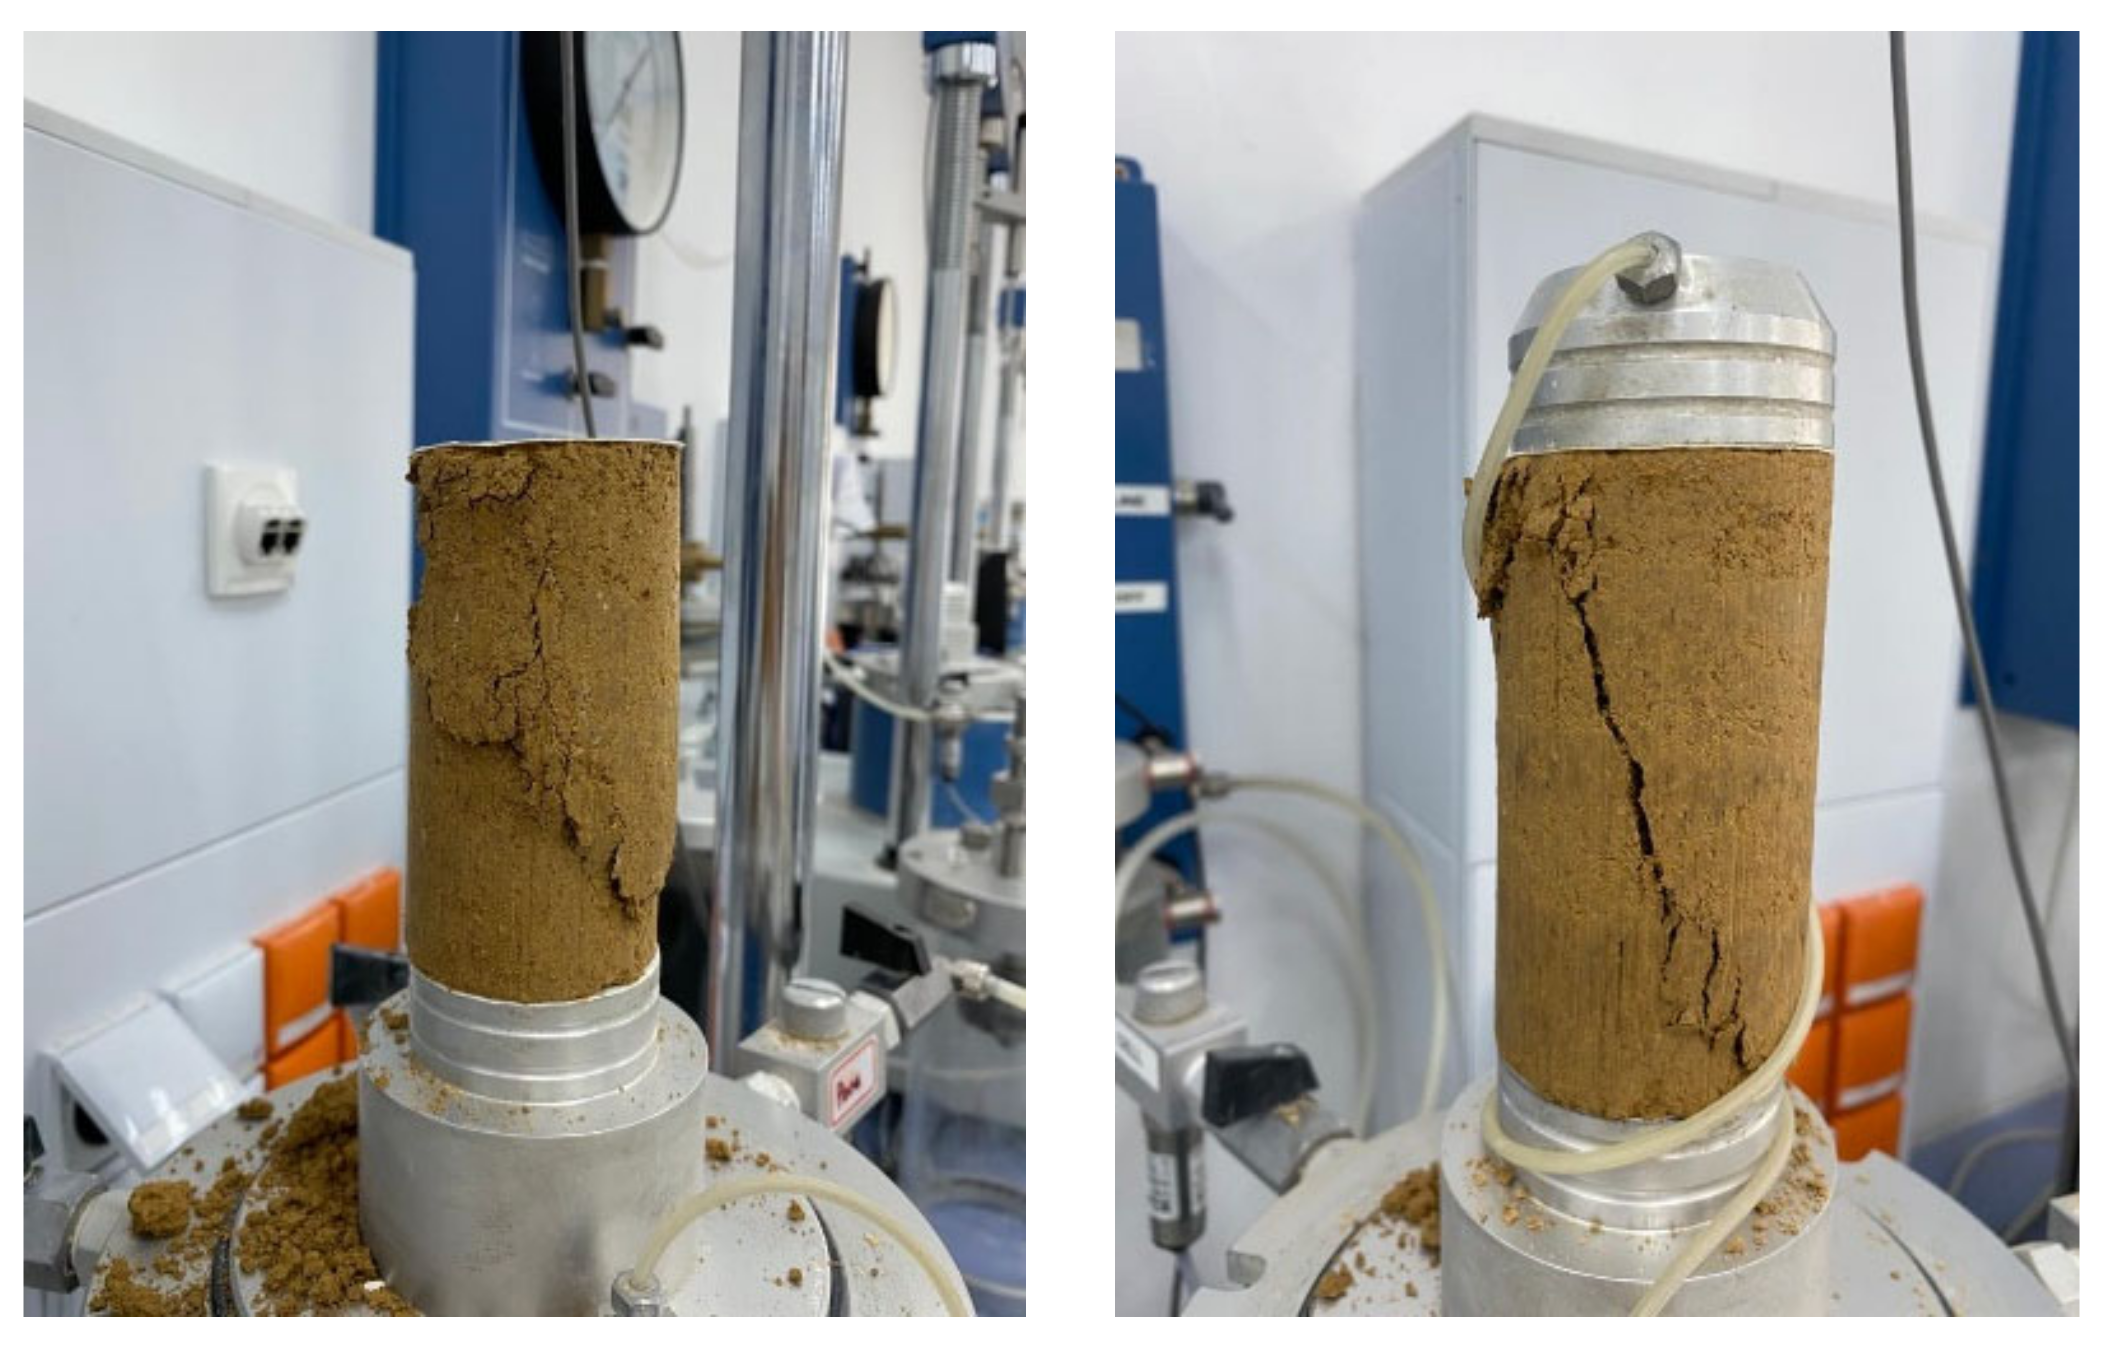
2.3.3. Unconfined Compressive Strength Test

Following the UPV tests, the UCS test was conducted to evaluate the mechanical properties of cement-treated soil before and after freeze–thaw cycles. The UCS test was conducted using the universal compression equipment at a standard strain rate of 1 mm/min, according to ASTM/2166 Standard [30]. For the analysis of the UCS test results, the average of the results of three samples was used to get more reliable results, while the analysis of obtained data.

2.3.4. Scanning Electronic Microscope Test

A scanning electron microscope test (SEM) was performed to observe the microstructure of cement-treated soil specimens before and after cyclic freezing and thawing. Zeiss Crossbeam 540 (Figure 3) high-resolution scanning electron microscope equipment is used for the microscopic analysis of soil samples. SEM images were taken at different magnifications to observe changes in the microstructure of cement-treated soil.

3. Results and Discussions

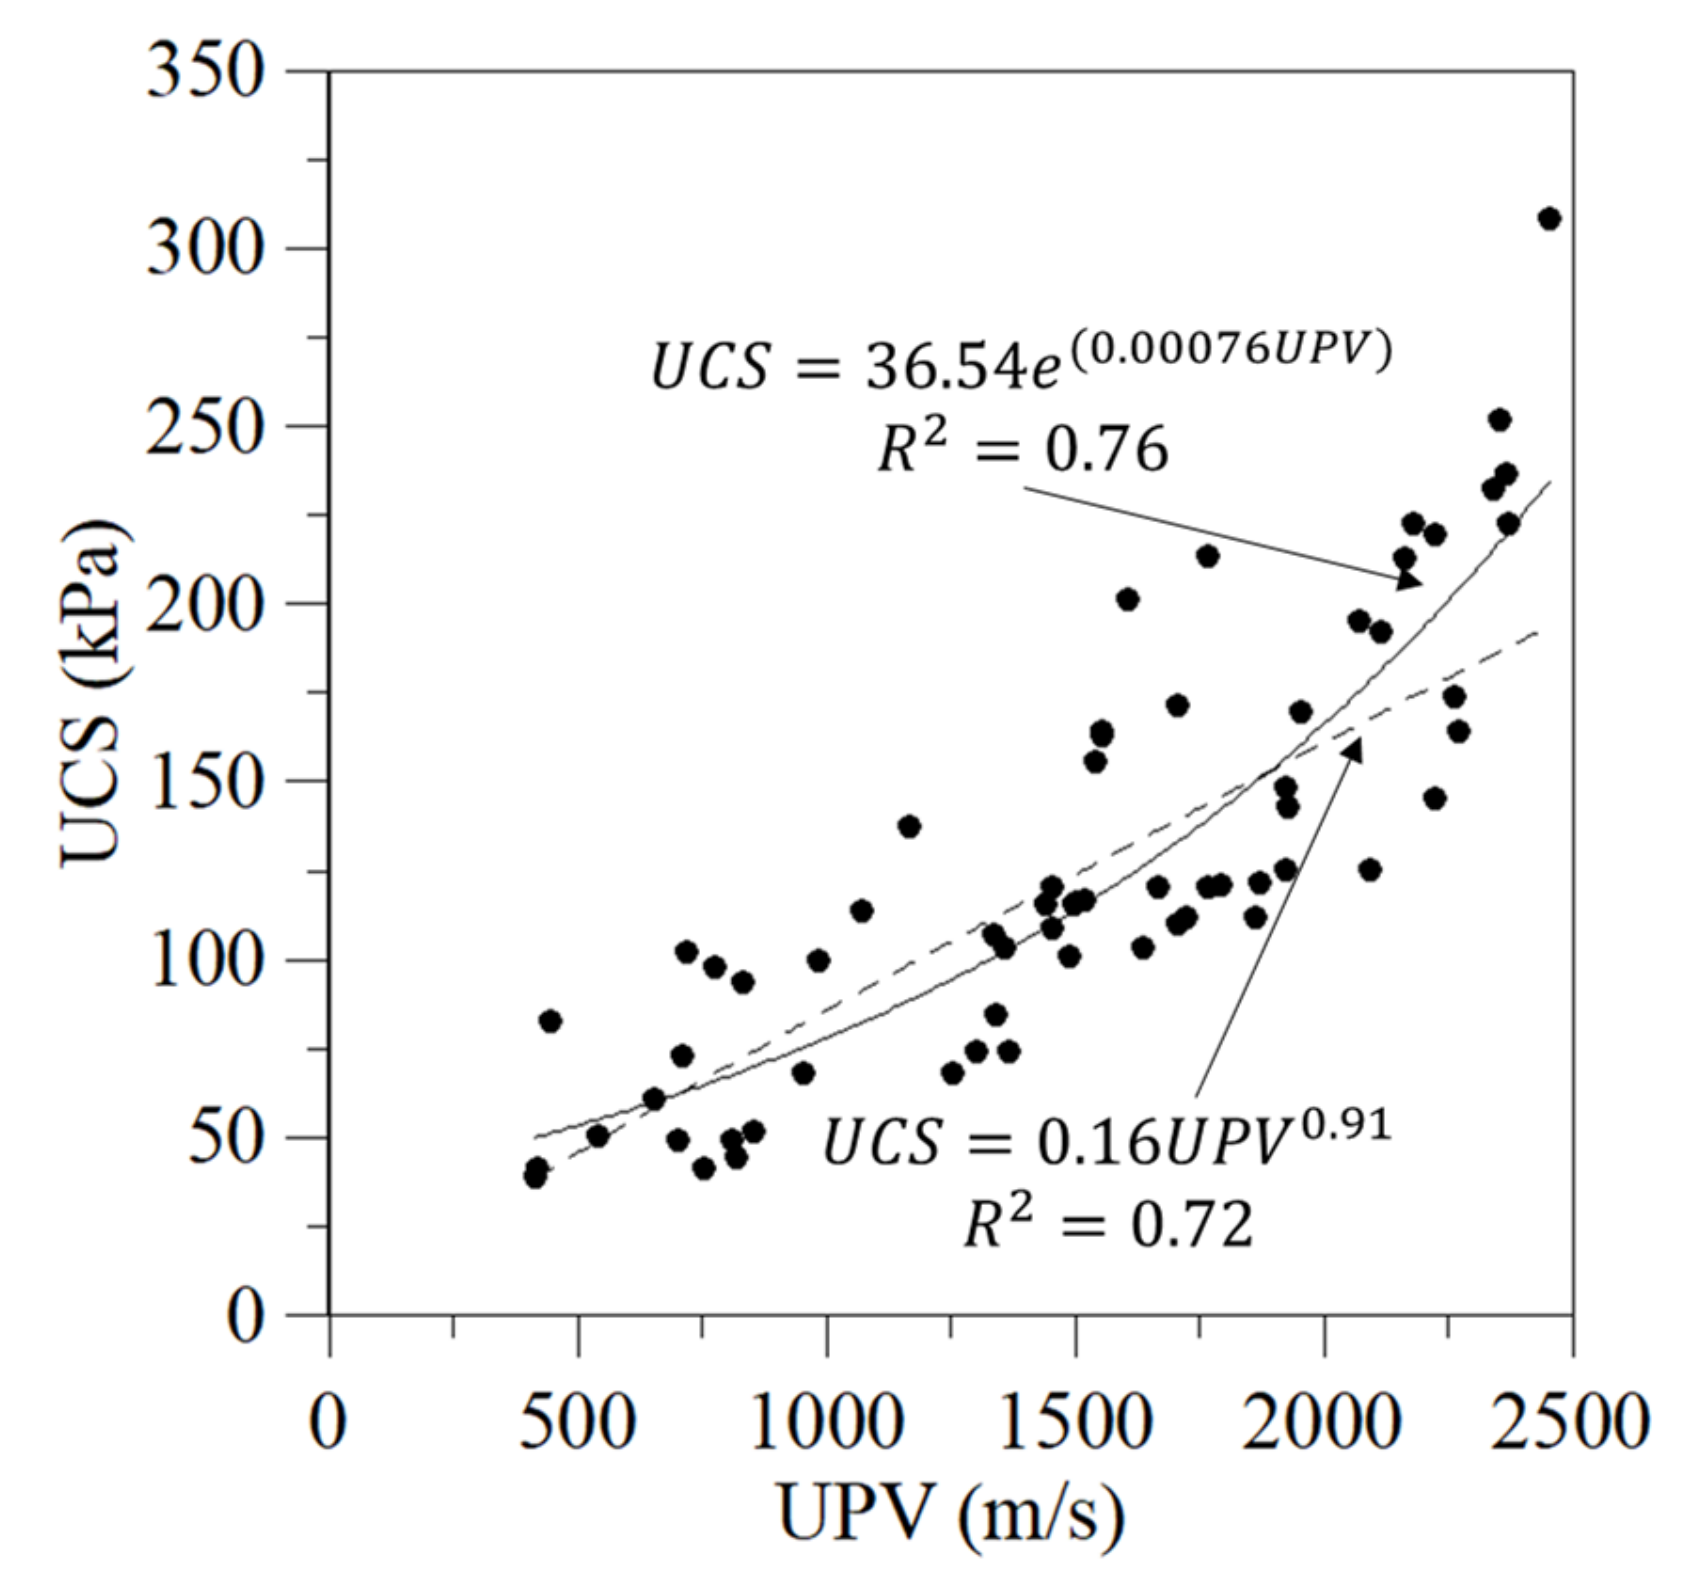
3.1. Ultrasonic Pulse Velocity

Figure 4 shows the results of UPV testing for 3, 7, and 14 cured samples under cyclic freezing and thawing. It can be seen that with the increase of freeze–thaw cycles, the pulse velocity values decrease. In addition, it can be noted that the UPV value of soil samples with 7% cement content considerably decreased after the 7th freezing and thawing cycle by 80% (Figure 4a). Such a reduction in the UPV values can be explained by the effect of cyclic freezing and thawing on soil samples. The impact of cyclic freezing and thawing causes the formation of microcracks and an increase in the volume of voids, which leads to a change in the structure of the samples. This will reduce the ability of the sample to transmit ultrasonic pulses.
Moreover, there is an increase of pulse velocity with the increase of cement content from 3% to 7%. Furthermore, the increase in pulse velocity can be observed with the increase of curing days. For instance, the pulse velocity values increased from 1872 m/s to 2340 m/s, 2090 m/s to 2373 m/s, and 2340 m/s to 2453 m/s, with the increase of curing days from 3 to 14, at 3%, 5%, and 7% of cement content, respectively. Such an increase in UPV values can be explained by the effect of cementation. Thus, increasing the cement content increases strength. There were fluctuations in the signals while measuring UPV values, due to the formation of internal cracks in the samples after F-T cycles. Especially, it was hard to conduct UPV test with specimens prepared with 3% cement content after 10 and 15 F-T cycles. Therefore, the UPV test was repeated several times in order to get values that are more reliable.

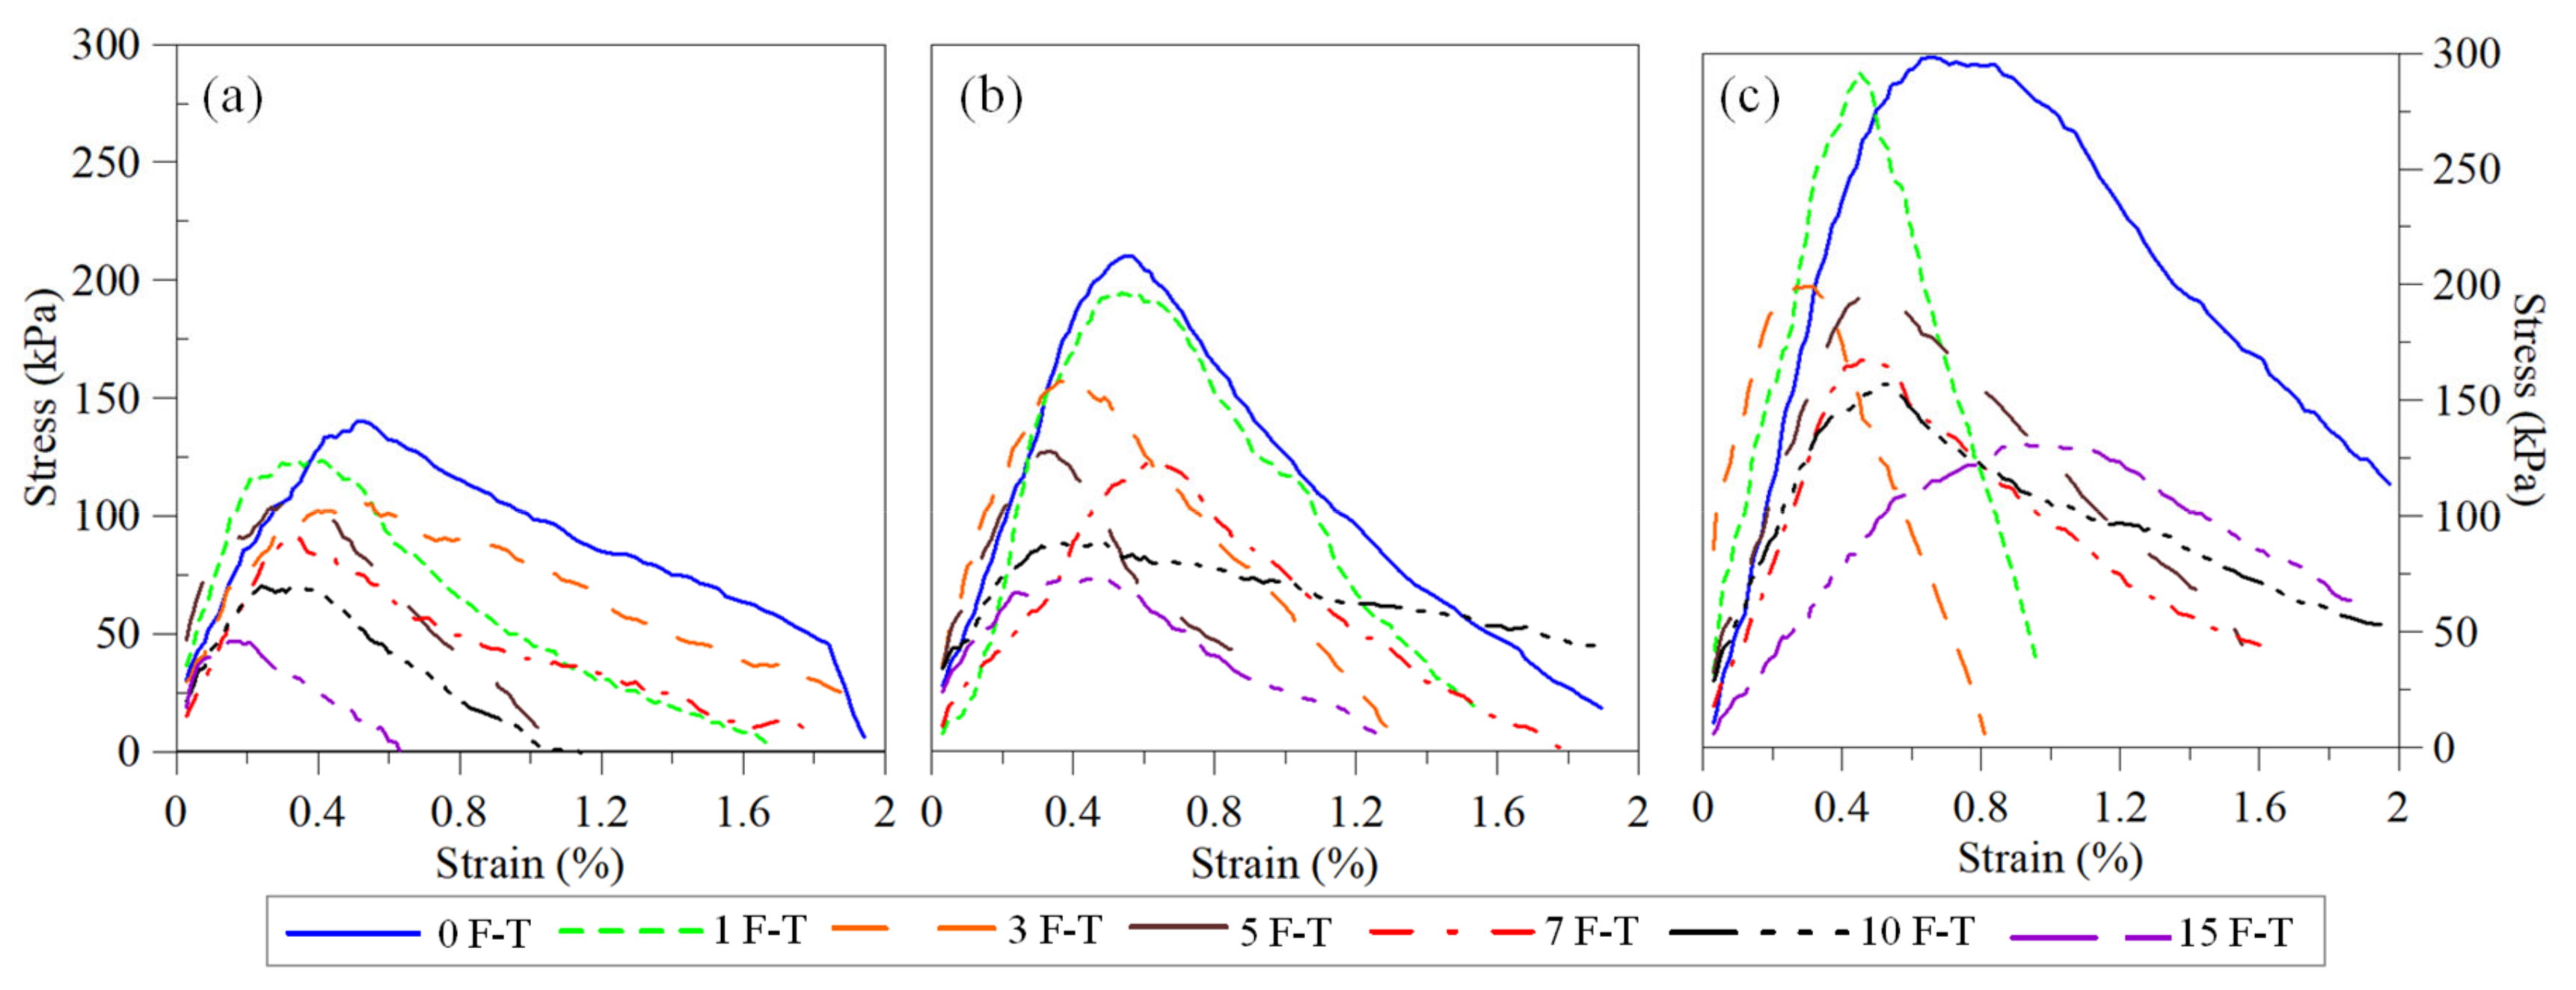
3.2. Stress–Strain Behavior

The stress–strain response of treated soil can be useful to evaluate the post-peak strength, strain hardening and ductile behavior, which will be discussed in this section. Moreover, from the stress–strain curve of treated soils, the energy absorption capability of soil can be assessed.
Figure 5 shows the stress-strain response of 14 days cured soil samples treated with CSA cement under cyclic freezing and thawing, where the ductile behavior of treated soil can be observed. It is clearly seen that at all three cement contents the cyclic freezing and thawing negatively affect the peak stress values of soil samples. The stress values decreased from 143 MPa to 49 MPa at 3% cement content, from 212 MPa to 67 MPa at 5% cement content, from 296 MPa to 111 MPa at 7% cement content with the increase of freeze–thaw cycles from 0 to 15. Moreover, it can be noticed that an increase in cement content from 3% to 7% increased the peak stress values. Increase in peak strength shows increase in the energy absorption capacity, which means that by the addition of cement energy absorption capacity significantly increases.

3.3. UCS Performance

Figure 6 illustrates the results of the UCS test for 3, 7, and 14 days cured cement-treated samples exposed under cyclic freezing and thawing. The results of UCS tests show the same trend as the results of the UPV test. Loss of strength is observed at all curing periods, with increasing freeze–thaw cycles. The strength values of soil samples without exposure to cyclic freezing and thawing have shown an increase in strength with the increase of cement content and curing days. It can be observed that the strength values of soil specimens with 3% cement content at 0 freeze–thaw cycles increased by 35% when cured from 3 days to 14 days. Beyond 7% cement content, there is another significant increase in strength by 37% at 14 days cured samples in comparison with the 3 days cured samples. This can be explained by the cementation of soil, due to the hydration of gypsum and belite in the CSA cement that produces ettringite and calcium silicate hydrate (CSH) [11].
As an illustration of failure planes, the pictures of typical failure modes of cement-treated soil specimens were taken after UCS testing as shown in Figure 7. The failure plane of cement-treated specimens has been obtained along the shear plane, which shows a brittle failure mode and it is comparable to the stress-strain curve in Figure 5.
In addition, exposure to freezing and thawing negatively affects the strength of soil samples. It can be explained by the formation of ice crystals during freezing, which melts after the thawing process which further leads to the shrinkage of soil samples. These results are consistent with the results of previous studies that examined the effect of cyclic freezing and thawing of cement-treated soil samples [2,3,14,16].
Based on the obtained data from the UCS and UPV tests, the correlation between the unconfined compressive strength and ultrasonic pulse velocity tests was plotted in Figure 8, which shows the increase of UCS with the increase of UPV values. A correlation between these two parameters would help to assess the treatment quality and estimate the compressive strength using the values of UPV testing. As can be seen from Figure 8 the exponential and power relationships were established. It can be seen that both of the correlations fit well where the R square values are equal to 0.76 and 0.72, respectively. In this plot, the experimental results of soil samples subjected to freeze–thaw cycles were also considered. Therefore, it may be a problem to achieve a better correlation between UCS and UPV tests, since the possible formation of internal cracks in the samples after a freeze and thaw cycles can cause fluctuations in the signals in the UPV test. To overcome such problems, the UPV test was repeated several times on the same sample.
Applying the results of the UCS test the loss and gain of strength values of cement-treated soil from cyclic freezing and thawing were calculated using Equation (1) below [8].
Strength loss gain % = UCS UCS FT UCS
where UCS is the compressive strength value before the freeze–thaw cycle and UCSFT is the compressive strength value after the freeze–thaw cycle. Figure 9 illustrates the strength loss/gain graph for cement-treated soil after F-T cycles. The highest loss of strength can be observed for the soil samples with 3% cement content, where strength values decreased by 67%, 68%, and 73% after 15 F-T cycles, for 3, 7, and 14 days cured samples. For the soil with 5% and 7% cement content, the strength loss values were almost the same after 15 F-T cycles. The reduction in strength loss can be explained by the formation of hydrated particles that improve the strength performance of cement-treated soil.
Furthermore, it is important to note that for all cases, where different cement contents and curing days were tested, after the 10th and 15th F-T cycles there was an inconsiderable loss in strength in comparison with the previous cycles, which means that after the 15th cycle changes in mechanical and physical properties of stabilized soil will be insignificant.

3.4. Estimation of Resilient Modulus

The resilient modulus is an important property for the subgrade of soil, especially in the design of pavement. It is determined using the repeated load triaxial method and calculated from the ratio of applied deviator stress to the resilient strain. However, this method is time-consuming and expensive to use and, since it requires sophisticated laboratory test facilities and routine tests [8]. Therefore, the resilient modulus can be correlated with other strength parameters, such as unconfined compressive strength. Lee et al. proposed an indirect method for the determination of resilient modulus using the UCS data [15]. Equation (2) shows the regression-based model for the estimation of resilient modulus.
M R = 606.6 S U 1 %
where SU1% is stress corresponding to axial 1% strain in the UCS test, it is in psi (1psi = 6.8 kPa). This model is recommended for soils that have SU1% values less than 241 kPa. Applying Equation (2) the estimated values for resilient modulus were calculated and obtained data is shown in Figure 10. The results show that freeze–thaw cycles negatively affect the resilient modulus, and with the increase of cement content, a considerable reduction in resilient modulus can be observed with the increase of F-T cycles. Moreover, it can be seen that with the increase of cement content and curing days the resilient modulus values also increase, especially it can be observed for the samples with 7% cement content. However, the estimated values of resilient modulus for the soil samples with 3% and 5% cement content have shown nonlinear soil behavior with the increase of freeze–thaw cycles, and there is a slight increase in resilient modulus with the increase of curing days from 3 to 14 days. Therefore, to deeply explain this behavior of the soil, it is necessary to carry out separate research work.

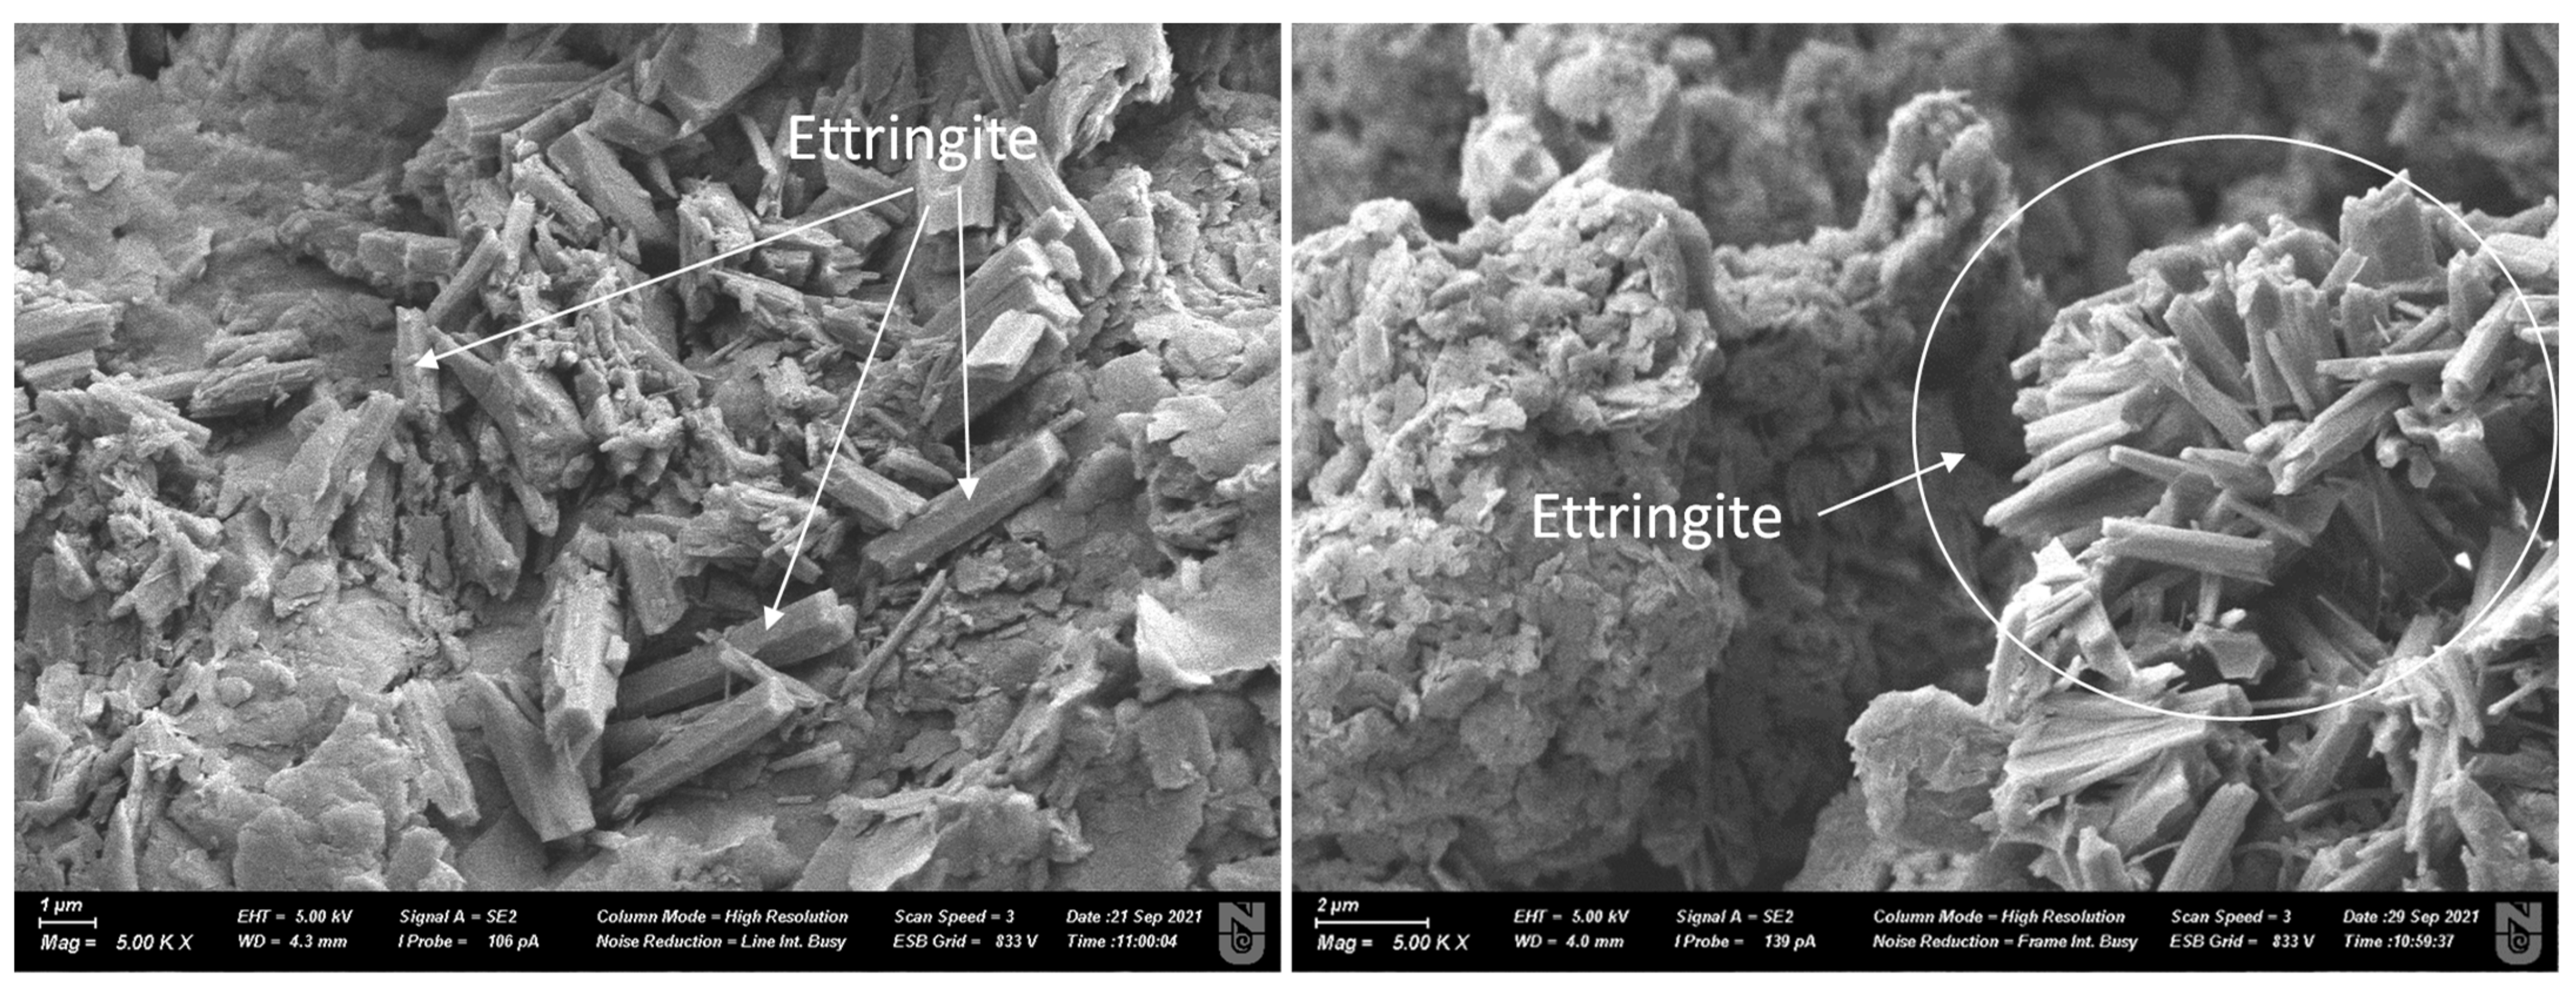
3.5. SEM Observation

Scanning Electronic Microscopic pictures were taken to analyze the microstructural characteristics of soil samples in order to explain changes in the mechanical behavior after F-T cycles. SEM pictures were taken for 14 days cured samples with 7% cement content. Figure 11 shows the SEM picture of soil samples that were not subjected to F-T cycles. From Figure 11 the needle-shaped structure can be seen, which are ettringite that is produced from the hydration of ye’elimite in CSA cement. The formation of ettringite mainly results from the initial high strength gain of CSA cement-treated soil [11].
Figure 12 shows SEM images obtained after F-T cycles, which clearly show the presence of pores and cracks formed after cyclic freezing and thawing. This can be explained by the formation of ice crystals during freezing and an increase in the total porosity of the soil, which subsequently leads to the formation of large pores.

4. Conclusions

The research work is conducted to assess the impact of cyclic freezing and thawing on the mechanical and physical properties of silty sand stabilized with CSA cement. For the evaluation of freeze–thaw cycles on CSA stabilized silty sand, UPV and UCS tests were performed. The exposure of cement treated silty sand to the cyclic freezing and thawing lead to the reduction of strength, and the effect varied depending on the cement type and curing period. Furthermore, after the 10th F-T cycle there was an insignificant reduction in strength in comparison with the results after 15th F-T, and it can be assumed that after 15th cycle changes there will not be considerable changes in mechanical and physical properties of stabilized soil.
Based on this study, in cold climates where soils are subjected to freeze–thaw cycles, CSA cement clinker is preferred for soil stabilization purposes. It is more supported due to environmental considerations and therefore the use of CSA cement for earthworks in cold regions should be encouraged. Thus, the results of this study would be useful in expanding the use of CSA cement for the design of subgrade layers. In order to understand the effectiveness of CSA cement treatment, further studies will be conducted with other types of additives for comparison, and long-term performance will also be tested.

Author Contributions

Conceptualization, methodology, investigation, N.S.; and S.-W.M.; data curation, visualization, N.S.; S.A.; writing—original draft preparation, N.S.; S.-W.M.; writing—review and editing, J.K.; A.S.; supervision, project administration, funding acquisition, S.-W.M. All authors have read and agreed to the published version of the manuscript.

Funding

This research was funded by the Nazarbayev University, Collaborative Research Project (CRP) Grant No. 11022021CRP1508. Any opinions, findings, and conclusions or recommendations expressed in this material are those of the author(s) and do not necessarily reflect the views of the Nazarbayev University.

Institutional Review Board Statement

Not applicable.

Informed Consent Statement

Not applicable.

Data Availability Statement

Data available on request.

Conflicts of Interest

The authors declare no conflict of interest.

References

  1. Aldaood, A.; Bouasker, M.; Al-Mukhtar, M. Impact of freeze–thaw cycles on mechanical behaviour of lime stabilized gypseous soils. Cold Reg. Sci. Technol. 2014, 99, 38–45. [Google Scholar] [CrossRef]
  2. Kamei, T.; Ahmed, A.; Shibi, T. Effect of freeze–thaw cycles on durability and strength of very soft clay soil stabilised with recycled Bassanite. Cold Reg. Sci. Technol. 2012, 82, 124–129. [Google Scholar] [CrossRef]
  3. Zhang, Y.; Johnson, A.E.; White, D.J. Laboratory freeze–thaw assessment of cement, fly ash, and fiber stabilized pavement foundation materials. Cold Reg. Sci. Technol. 2016, 122, 50–57. [Google Scholar] [CrossRef]
  4. Vinoth, G.; Moon, S.-W.; Moon, J.; Ku, T. Early strength development in cement-treated sand using low-carbon rapid-hardening cements. Soils Found. 2018, 58, 1200–1211. [Google Scholar] [CrossRef]
  5. Ghazavi, M.; Roustaie, M. The influence of freeze–thaw cycles on the unconfined compressive strength of fiber-reinforced clay. Cold Reg. Sci. Technol. 2010, 61, 125–131. [Google Scholar] [CrossRef]
  6. Arasan, S.; Nasirpur, O. The effects of polymers and fly ash on unconfined compressive strength and freeze-thaw behavior of loose saturated sand. Geomech. Eng. 2015, 8, 361–375. [Google Scholar] [CrossRef]
  7. Yilmaz, F.; Fidan, D. Influence of freeze-thaw on strength of clayey soil stabilized with lime and perlite. Geomech. Eng. 2018, 14, 301–306. [Google Scholar]
  8. Güllü, H.; Fedakar, H.I. Unconfined compressive strength and freeze-thaw resistance of sand modified with sludge ash and polypropylene fiber. Geomech. Eng. 2017, 13, 25–41. [Google Scholar]
  9. Swain, K. Stabilization of Soil Using Geopolymer and Biopolymer. Ph.D. Thesis, Department of Civil Engineering National Institute of Technology, Rourkela, India, 2015. [Google Scholar]
  10. Moon, S.-W.; Vinoth, G.; Subramanian, S.; Kim, J.; Ku, T. Effect of fine particles on strength and stiffness of cement treated sand. Granul. Matter 2020, 22, 9. [Google Scholar] [CrossRef] [Green Version]
  11. Subramanian, S.; Moon, S.-W.; Moon, J.; Ku, T. CSA-treated sand for geotechnical application: Microstructure analysis and rapid strength development. J. Mater. Civ. Eng. 2018, 30, 04018313. [Google Scholar] [CrossRef]
  12. Subramanian, S.; Moon, S.-W.; Ku, T. Effect of Gypsum on the strength of CSA treated sand. In Proceedings of the 16th Asian Regional Conference on Soil Mechanics and Geotechnical Engineering, Taipei, Taiwan, 14–18 October 2019. [Google Scholar]
  13. Bisserik, A.; Kim, J.; Satyanaga, A.; Moon, S.-W. Characterization of CSA cemented-treated sands via discrete element method. AIP Publ. LLC 2021, 2441, 030001. [Google Scholar]
  14. Jumassultan, A.; Sagidullina, N.; Kim, J.; Ku, T.; Moon, S.-W. Performance of cement-stabilized sand subjected to freeze-thaw cycles. Geomech. Eng. 2021, 25, 41–48. [Google Scholar]
  15. Güllü, H.; Khudir, A. Effect of freeze-thaw cycles on unconfined compressive strength of fine-grained soil treated with jute fiber, steel fiber and lime. Cold Reg. Sci. Technol. 2014, 106, 55–65. [Google Scholar] [CrossRef]
  16. Liu, J.; Chang, D.; Yu, Q. Influence of freeze-thaw cycles on mechanical properties of a silty sand. Eng. Geol. 2016, 210, 23–32. [Google Scholar] [CrossRef]
  17. Hazirbaba, K.; Gullu, H. California Bearing Ratio improvement and freeze—Thaw performance of fine-grained soils treated with geofiber and synthetic fluid. Cold Reg. Sci. Technol. 2010, 63, 50–60. [Google Scholar] [CrossRef]
  18. Hotineanu, A.; Bouasker, M.; Aldaood, A.; Al-Mukhtar, M. Effect of freeze–thaw cycling on the mechanical properties of lime-stabilized expansive clays. Cold Reg. Sci. Technol. 2015, 119, 151–157. [Google Scholar] [CrossRef]
  19. Kravchenko, E.; Liu, J.; Niu, W.; Zhang, S. Performance of clay soil reinforced with fibers subjected to freeze-thaw cycles. Cold Reg. Sci. Technol. 2018, 153, 18–24. [Google Scholar] [CrossRef]
  20. Lake, C.B.; Yousif, M.A.-M.; Jamshidi, R.J. Examining freeze/thaw effects on performance and morphology of a lightly cemented soil. Cold Reg. Sci. Technol. 2017, 134, 33–44. [Google Scholar] [CrossRef]
  21. Bozbey, I.; Kelesoglu, M.K.; Demir, B.; Komut, M.; Comez, S.; Ozturk, T.; Mert, A.; Ocal, K.; Oztoprak, S. Effects of soil pulverization level on resilient modulus and freeze and thaw resistance of a lime stabilized clay. Cold Reg. Sci. Technol. 2018, 151, 323–334. [Google Scholar] [CrossRef]
  22. Gartner, E. Industrially interesting approaches to “low-CO2” cements. Cem. Concr. Res. 2004, 34, 1489–1498. [Google Scholar] [CrossRef]
  23. ASTM/D698; Standard Test Methods for Laboratory Compaction Characteristics of Soil Using Standard Effort. American Society for Testing and Materials: Philadelphia, PA, USA, 2007.
  24. Askar, Z.; Zhanbolat, S. Experimental investigations of freezing soils at ground conditions of Astana, Kazakhstan. Sci. Cold Arid. Reg. 2015, 7, 399–406. [Google Scholar]
  25. Ding, M.; Zhang, F.; Ling, X.; Lin, B. Effects of freeze-thaw cycles on mechanical properties of polypropylene fiber and cement stabilized clay. Cold Reg. Sci. Technol. 2018, 154, 155–165. [Google Scholar] [CrossRef]
  26. ASTM/597-09; Standard Test Method for Pulse Velocity through Concrete. American Society for Testing and Materials: West Conshohocken, PA, USA, 2009.
  27. Moon, S.W.; Bainazarova, Z.; Khan, Q.; Ku, T. Discussion on “Dynamic Characterization of Sand Stabilized with Cement and RHA and Reinforced with Polypropylene Fiber” by Ali Ghorbani, and Maysam Salimzadehshooiili. J. Mater. Civ. Eng. 2020, 32, 07020006. [Google Scholar] [CrossRef]
  28. Moon, S.W.; Bainazarova, Z.; Khan, Q.; Ku, T. Discussion on “Shear wave velocity of zeolite-cement grouted sands”, by Afshin Kordnaeij, Reza Ziaie Moayed and Majid Soleimani. Soil Dyn. Earthq. Eng. 2020, 128, 105845. [Google Scholar] [CrossRef]
  29. Khan, Q.; Moon, S.W.; Ku, T. Idealized Sine Wave Approach to Determine Arrival Times of Shear Wave Signals Using Bender Elements. Geotech. Test. J. ASTM 2019, 43, 20170121. [Google Scholar] [CrossRef]
  30. ASTM/2166; Standard Test Method for Unconfined Compressive Strength of Cohesive Soil. American Society for Testing and Materials: Philadelphia, PA, USA, 2003.
Figure 1. (a) natural soil sourced from land excavation; and (b) grinded natural soil.
Sustainability 14 07000 g001
Figure 2. Particle size distribution curve for the sand used in this study.
Sustainability 14 07000 g002
Figure 3. Schematic of experimental setup.
Sustainability 14 07000 g003
Figure 4. UPV test results: (a) 3-day curing, (b) 7-day curing, and (c) 14-day curing.
Sustainability 14 07000 g004
Figure 5. Stress-strain response of 14-day cured soil samples treated with CSA cement for all freeze–thaw cycles: (a) 3%; (b) 5%; and (c) 7%.
Sustainability 14 07000 g005
Figure 6. UCS test results: (a) 3-day curing; (b) 7-day curing; and (c) 14-day curing.
Sustainability 14 07000 g006
Figure 7. Failure planes of soil samples treated with CSA cement.
Sustainability 14 07000 g007
Figure 8. UCS and UPV relationship.
Sustainability 14 07000 g008
Figure 9. Strength loss/gain: (a) 3-day curing; (b) 7-day curing; and (c) 14-day curing.
Sustainability 14 07000 g009
Figure 10. Resilient Modulus: (a) 3-day curing; (b) 7-day curing; and (c) 14-day curing.
Sustainability 14 07000 g010
Figure 11. SEM images of soil samples treated with 7% CSA cement cured 14 days at 0 F-T.
Sustainability 14 07000 g011
Figure 12. SEM images taken after F-T cycles: (a) 1 F-T; (b) 3 F-T; (c) 5 F-T; and (d) 10 F-T.
Sustainability 14 07000 g012
Table 1. Comparison of parameters used for the experimental work.
Curing TimeFreezing Time and Temp.Thawing Time and Temp.Freeze−Thaw CyclesReference
128 days−20 °C, 24 h+20 °C, 24 h0, 1Gullu and Hazirbaba [15]
228 days−15 °C, 12 h+5 °C, 12 h0, 1, 3, 6, 8, and 10Liu et al. [16]
328 days, soaking 96 h−20 °C, 24 h21 °C, 24 h-Hazirbaba and Gullu [17]
428 days−10 °C, 24 h24 h, room temp.0,1, 2, and 5Kamei et al. [2]
5-−20 °C, 6 h+25 °C, 6 h0, 1, 3, 5, and 10Ghazavi and Roustaie [5]
6No curing−18 °C, 24 h18 °C, 24 h1, 2 and 3Gullu and Khudir [15]
77 days−10 °C, 24 hat room temp., 24 h5Zhang et al. [3]
87 days−10 °C, 18 h23 ± 2 °C, 6 h0, 1, 5, and 10Hotineanu et al. [18]
97 days−15 °C, 12 h+20 °C, 12 h0, 2, 5, 8, 10, 15Kravchenco et al. [19]
1028 days−10 °C (±1 °C), 24 h22 °C (±1 °C), 24 h3Lake et al. [20]
117, 28, and 56 days−23 °C, 24 h23 °C, 23 h12Bozbey et al. [21]
Table 2. Physical properties of the soil used in this study.
PropertiesValueStandardTest Methods
(Instrument Models)
D10 (mm)0.11ASTM D1921Sieve Analysis
(ELE Sieve shaker)
D30 (mm)0.55ASTM D1921Sieve Analysis
(ELE Sieve shaker)
D60 (mm)1.8ASTM D1921Sieve Analysis
(ELE Sieve shaker
Coefficient of curvature1.53ASTM D1921Sieve Analysis
(ELE Sieve shaker)
Coefficient of uniformity16.36ASTM D1921Sieve Analysis
(ELE Sieve shaker)
USCS classificationSW-SMASTM D1921Sieve Analysis
(ELE Sieve shaker)
Optimum Moisture Content (%)16.5ASTM D698Standard Proctor Test
(ELE Automatic Soil Compactor)
Maximum dry density (kN/m3)1.75ASTM D698Standard Proctor Test
(ELE Automatic Soil Compactor)
Plastic Limit (%)40.35ASTM D4318 Atterberg limits Test
(ELE Liquid Limit Device)
Liquid Limit (%)44.31ASTM D4318 Atterberg limits Test
(ELE Liquid Limit Device)
Plasticity Index (%)3.96ASTM D4318 Atterberg limits Test
(ELE Liquid Limit Device)
Table 3. Standard Proctor Test results of CSA treated soil.
Cement ContentOptimum Moisture Content (%)Maximum Dry Density (kN/m3)
3%20.801.67
5%21.001.62
7%22.001.56
Publisher’s Note: MDPI stays neutral with regard to jurisdictional claims in published maps and institutional affiliations.

