Article

Impacts of Government Credit on Government Performance of Public-Private Partnership Project in China: A WSR System Theory Perspective

1
School of Civil Engineering and Architecture, Zhejiang Sci-Tech University, Hangzhou 310018, China
2
School of Civil Engineering and Architecture, North China Institute of Science and Technology, Langfang 065201, China
*
Author to whom correspondence should be addressed.
Sustainability 2022, 14(11), 6886; https://doi.org/10.3390/su14116886
Submission received: 15 April 2022 / Revised: 26 May 2022 / Accepted: 2 June 2022 / Published: 5 June 2022
(This article belongs to the Section Sustainable Management)

Abstract

:
To alleviate project financial pressure and improve performance, the public-private partnership (PPP) arrangement was introduced by the central government of China to facilitate the sustainable development of infrastructure. However, arising government credit crisis from the PPP project may damage both the private’s and public’s interests, and affect the government performance of PPP projects consequently. In order to understand the influence between government credit and performance, we constructed a government credit evaluation index system by using the Wuli-Shili-Renli system theory, and conducted a questionnaire survey among people related to PPP based on 359 valid questionnaires. The results firstly indicated that government credit and performance of PPP projects are optimistic in China. Secondly, the institutional environment, financial situation, management technology and internal and external communication of government credit all have a positive impact on the government performance of PPP. Thirdly, the government credit and performance of PPP projects can be increased by the improvement of regional economic and social development. These findings enrich the knowledge system of the relationship between government credit and performance of PPP projects and contribute to clarifying the influence of government credit and performance, thus provide the basis for the government to guide PPP practice effectively.

1. Introduction

Public-private partnership (PPP), first introduced in the UK in 1982, has been widely recognized and implemented as an effective financial instrument in the world driven by its fairness and efficiency [1], and has been recognized as an effective way to realize value for money of public infrastructure and services [2]. There is still no globally recognized definition of PPP, which varies among countries and international organizations [3], however, its essential feature in common is the long-term cooperation between public and private sectors, thus completing public tasks effectively [4]. In China, the vigorous promotion of the PPP arrangement by the central government since 2013 has also stimulated an increasingly gaining greater popularity, especially in the field of municipal facilities and transportation [1,5]. Statistics from the China PPP center manifested that as of March 2022, there were 10,250 projects in the national PPP comprehensive information platform project management database, with an investment of 16.21 trillion Chinese Yuan (CNY) (1 USD (United States dollar) = 6.33 CNY in March 2022).
Although the PPP arrangement has been adopted more extensively in China with a large number and high investment, there is still a problem of poor performance in practice [6], which is mainly characterized by low landing rate and low signing rate [7]. Previous research showed that credit between the government and the private sector has a significant impact on project performance [8], e.g., the absence of clear contractual arrangements [9], lack of well-established legal framework [10], public opposition [11], social inequalities perception [12,13], changes in policies and regulations [14], as well as corruption [15,16], and may bring about the distrust between the public sector and the private sector, which in turn leads to the cooperation failing to achieve the expected results, thus affecting the performance of the PPP projects, and even leading to the failure of the project eventually.
For instance, Rîșteiu et al. (2021) suggested that there have been some public-private complicities between local or central government actors who made inequal partnerships to open large mining sites and PPP projects that might contaminate the region, which has led to decades of disputes and struggles in Romania [16]. Similarly, waste-to-energy incineration PPP projects have been resisted worldwide due to their “not in my backyard (NIMBY)” attributes [17,18], which have made strong impacts, and even caused some projects to be shut down or shelved [19,20]. Therefore, government credit (GC) is of great importance in affecting government performance (GP). GC is a subjective evaluation or value judgment from social organizations and the public on the government’s ability and reputation, as well as a psychological reflection of the reputation and image of the government’s ability and behavior [21,22]. It includes not only the full affirmation from social organizations and the public of the government’s ability, but also their acknowledgements, feelings, attitudes, expectations, and beliefs about the overall image of the government [21,23].
However, there is only a limited number of literature dealing with whether and how the GC affects the GP of PPP projects. On the one hand, some studies have studied how to improve the GP of PPP projects from the perspective of the auditing mechanism [24,25]. Nevertheless, as the credit system construction of PPP projects is still in the primary stage of standardized development in China, the literature on the impact of the GC on the GP in PPP projects from the perspective of GC is far from enough. On the other hand, although partial research has studied the GC of certain types of PPP projects [15,22], a GC system that can be widely applied to various PPP projects has not been established.
To fill this research gap, the present study constructs the evaluation index system of GC in PPP projects based on WSR system theory, as well as focuses on whether and how the influence of GC on GP of PPP projects using a questionnaire survey of people closely related to PPP. Based on descriptive statistics, structural equation analysis, and a one-way ANOVA, the findings could be able to enrich the knowledge body of the relationship between GC and GP of PPP projects and contribute to clarifying the influencing mechanism of GC on GP in PPP projects, thus promoting the sustainable development of infrastructure, and providing the basis for the government to effectively guide PPP practice.

2. Theoretical Framework and Research Hypothesis

2.1. Wuli-Shili-Renli System Theory

Wuli-Shili-Renli (WSR), an oriental system methodology, holds that “Wu (objective existence), Shi (subjective modeling), and Ren (human relations) constitute a differentiated whole that conditions systems projects” [15,26], was developed by Chinese scholars in the 1990s [27]. WSR, which combines various methods of natural science, management science, and social science [28], as well as integrates development laws, management methods, and interpersonal relationships [27], has significant potential for practical application in China, and has achieved effective results in the process of observing and analyzing problems, especially complex systems [29]. By sorting and layering various methods, and changing intricacy into simplicity as well, WSR combines qualitative and quantitative analysis, which embodies its uniqueness and has the speculative nature of Chinese traditional philosophy [27,28,30].
The practice guidelines of WSR are “Knowing Wuli, Sensing Shili, Caring for Renli” [26]. Specifically, (1) “Wuli” expresses objective existence, including the physical environment and structural organization, which is the principle and rule when dealing with certain matters or problems in the real world [26]; (2) “Shili” refers to the way people interact with the “world”, which is an intervention mechanism when we face objective existence and its rules when dealing with certain things or problems [28]; (3) “Renli” emphasizes the inter-subjective relationship between all parties involved in systems engineering [29]. Correspondingly, when dealing with complex situations, we need to consider not only the “Wu” aspect of the object system (“Wuli”), but also how to make better use of these things (“Shili”) [26,31]. Meanwhile, we are inseparable from people’s understanding, management, and decision-making of things (“Renli”) [26,31].

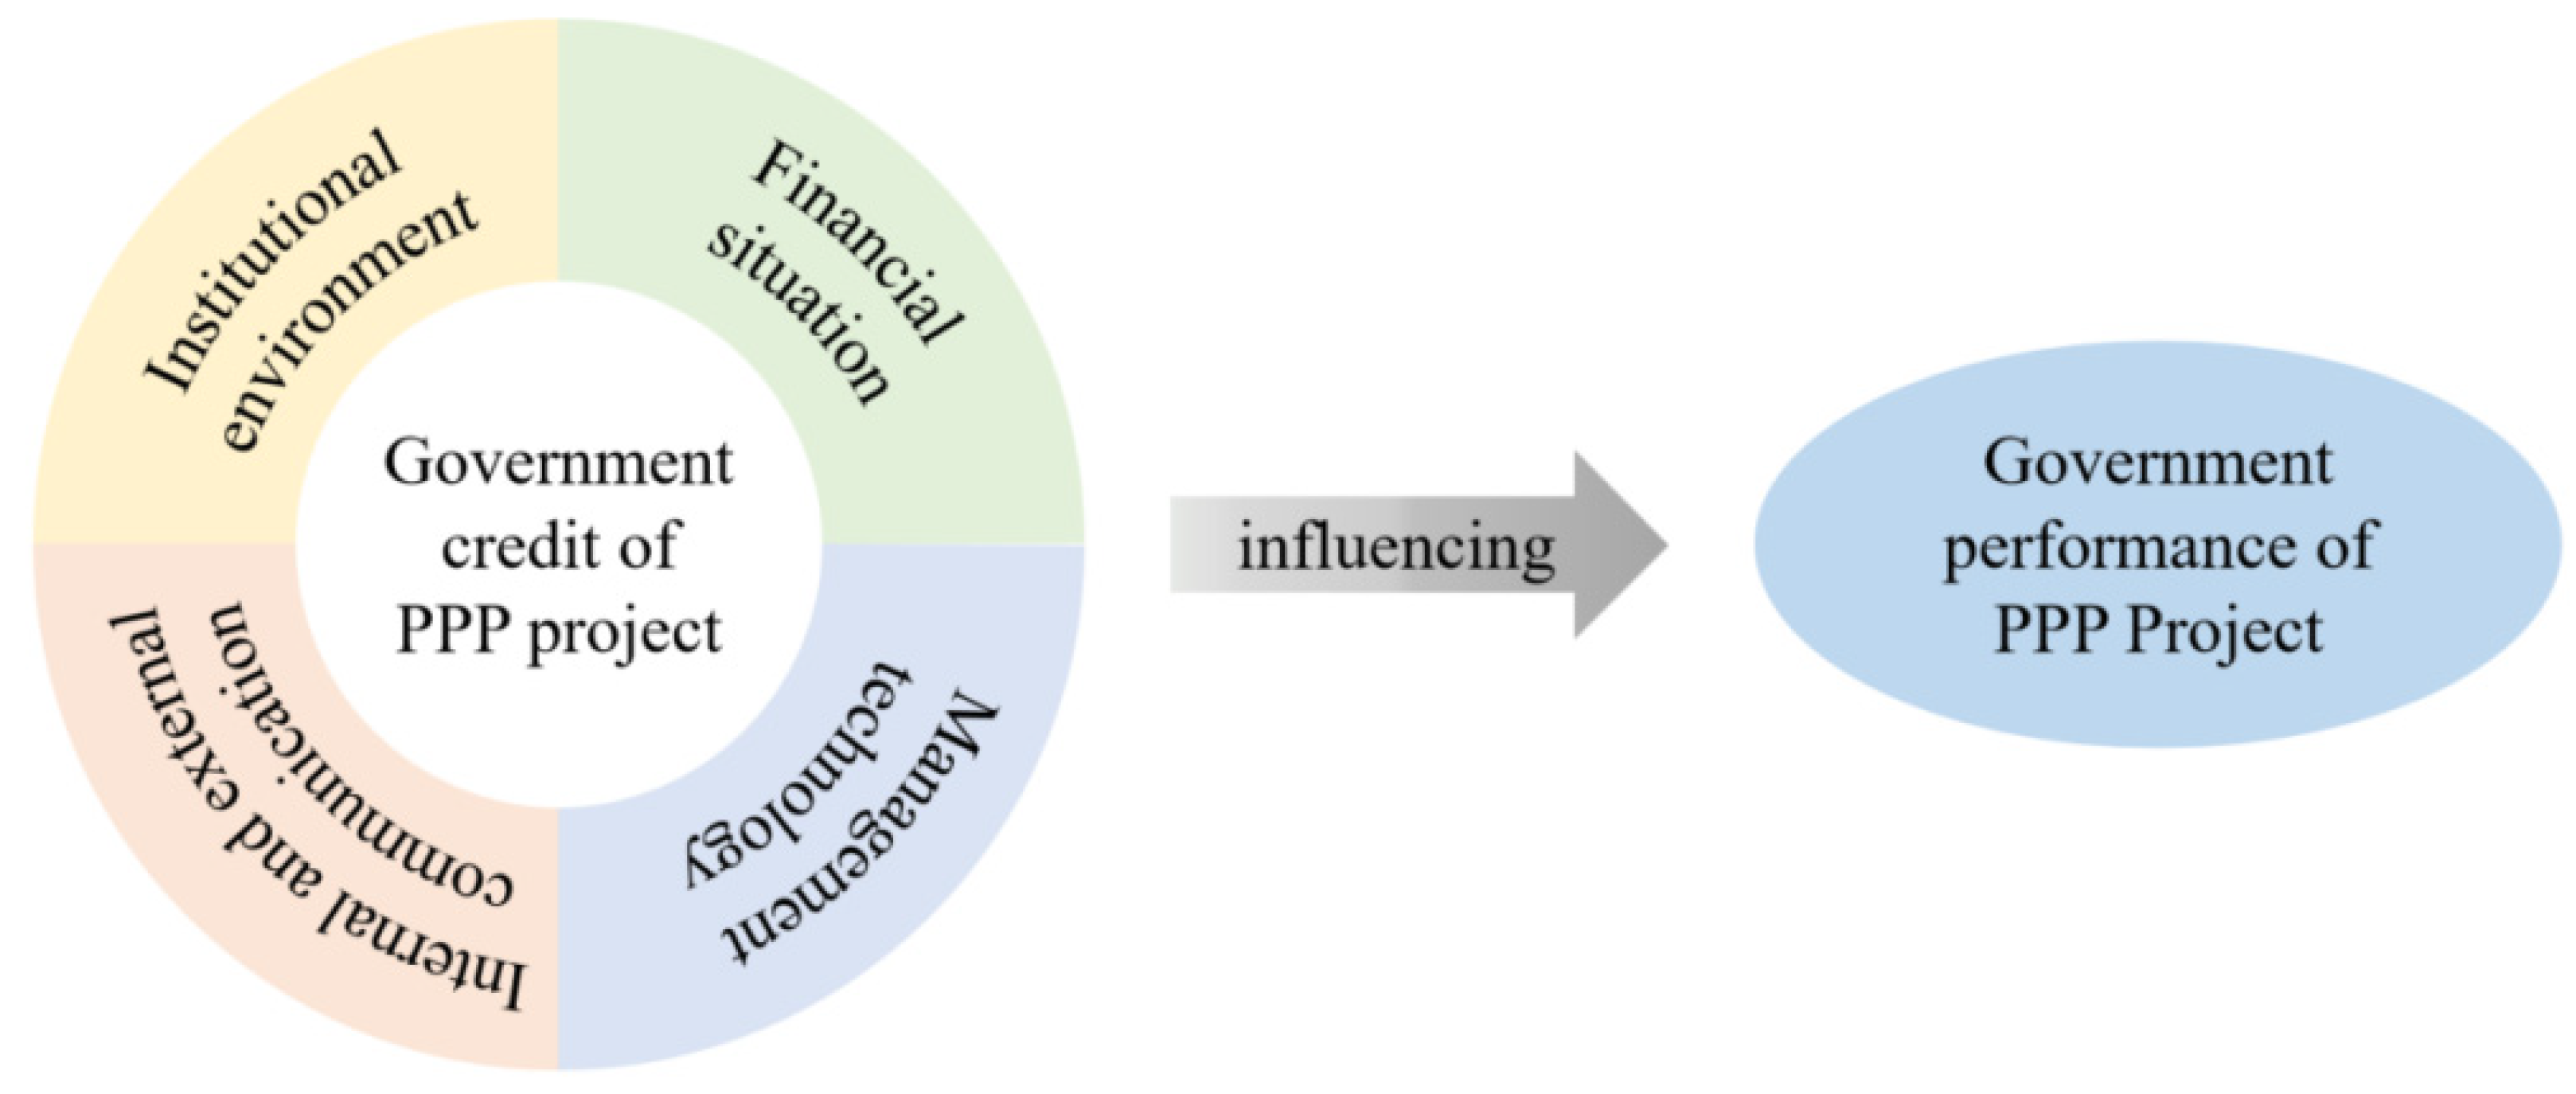
2.2. Theoretical Framework

This study attempts to adopt the WSR system theory to construct the GC evaluation index system for PPP projects in China from a philosophical perspective. Accordingly, in the GC evaluation of PPP projects, we expand the original connotation of the three dimensions of the WSR system theory according to the description of relevant literature and the characteristics of PPP projects (see Figure 1). Specifically, (1) the “Wuli” dimension represents the objective existence of the PPP projects, including the research on the legal rules, relevant policies, and financial situation that cause GC issues. (2) the “Shili” dimension refers to the principles of organization, system management and doing things, and it mainly discusses the management technology of the government in PPP projects. (3) the “Renli” dimension mainly researches the influence of internal and external thoughts and behaviors of government parties on the GC evaluation of PPP projects.
The GC evaluation index system in the current study is composed of three dimensions, four constructs, namely the institutional environment (IE) (“Wuli”), financial situation (FS) (“Wuli”), management technology (MT) (“Shili”), and internal and external communication (IEC) (“Renli”), respectively. Besides, Nie et al. (2019) indicated that credit between government and the private sector has a significant impact on project performance in practice [8]. More specifically, according to the indicators constructed by WSR approach, the IE of PPP project refers to the establishment of a reasonable administrative organization level, the formulation of a sound system of laws and regulations, and the promulgation by the government of a series of sustained, stable, and effective policies to ensure the smooth operation of PPP projects [32]. Second, the FS of PPP is a critical factor for project performance, which denotes the financial status, economic strength, and debt status of the local governments [33]. Meanwhile, The MT of government, an important component of government service level, refers to the managerial and technical behaviors made by the government during the implementation of PPP, including bidding, provision of infrastructure, supervision, disclosure of information, etc. [33], which will affect GP. Finally, the three most important elements of the organization mentioned in “Systematic organization theory”, proposed by Barnard, are, willingness to cooperate, common goals, and information exchange [34,35], in which information exchange plays an important role.
Therefore, following the WSR system theory framework and literature review above, the theoretical framework of the current study is established (see Figure 2).

2.3. Research Hypothesis

2.3.1. Institutional Environment and Government Performance

Previous studies have shown that the IE is the basic guarantee for the sustainable development of PPP, and a good IE is the critical success factor for PPP projects [36,37,38]. Meanwhile, stable laws, regulations, and policy support could be able to promote PPP and improve the quality of public service supply through project environmental factors, thus affecting GP [39]. It not only provides the basis and conditions for the establishment of government PPP organizations and the improvement of resource acquisition and allocation capabilities, but also provides access conditions and rules for the private sector to participate in the public domain, guarantee investment and financing, and maintain an equal trading environment [40]. Furthermore, Ng et al. (2007) and Kumaraswamy et al. (2015) also found that creating a good IE for PPP can promote the public to actively participate in PPP, express public opinions, demands, and evaluate and feedback on the quality of public services [41,42].
Therefore, based on the above literature, we propose
Hypothesis 1 (H1).
A good institutional environment has a significant positive impact on the government performance of PPP projects.

2.3.2. Financial Situation and Government Performance

Barney (1991, 2001); Conner and Prahalad (1996) pointed out that the foundation for an enterprise to obtain a competitive advantage is whether the resources it possesses (e.g., material capital, organizational capital and human capital resources) are valuable, scarce, inimitable and irreplaceable [43,44,45]. Accordingly, the resources invested in the enterprise are conducive to the normal operation of the enterprise and the smooth completion of various activities [46,47], which means the difference in performance shown by different companies is essentially the result of asset heterogeneity [48]. Specifically, if a local government organization possesses and utilizes a valuable resource, it will be far more competitive than a government that lacks it, and ultimately gain an advantage in the competition and achieve the improvement of GP [49]. Simultaneously, Arya and Lin (2007)’s research indicated that different resources play unique roles in different enterprises, while monetary funds are the most widely used among the many resources [50]. In other words, as special project participants, local governments vary in their financial status, economic strength and debt status, and if the government wants to encourage the healthy development of PPP through financial subsidies, tax support, etc., it needs to rely on its own financial situation [51,52]. In that, the government has sufficient financial resources, which can not only give sufficient financial support to PPP, ensure stable cash flow of projects, and achieve higher profit rate [53], but also gain the credit of the private sector, and guarantee the stable source of funds and reasonable financing cost, thus ensuring that the GP can meet the standard [39,54].
Therefore, based on the above literature, we propose
Hypothesis 2 (H2).
A stable financial situation has a significant positive impact on government performance of PPP projects.

2.3.3. Management Technology and Government Performance

Previous studies have shown that the level of government service (e.g., MT) will affect the cooperation between the two partners and further promote the smooth progress of the project, thus having a significant impact on the project performance [55,56]. As one of the aspects of MT, the bidding process of openness, fairness, and justice contributes to selecting a more competitive and capable private sector for the government [37], as well as clear and reasonable bidding documents and contracts conducted to ensure a reasonable construction period and concession period for PPP [11,57], and solve a series of problems such as substandard project design and insufficient preliminary work, so as to ensure that PPP has feasible technologies and further guarantee GP [37,58]. Second, provide reasonable supporting infrastructure in time, control the quality and progress of the PPP project, and assist the project company to ensure that the provided project services or facilities meet the needs of the public, thus ultimately improving GP [58]. Third, the supervision of government departments will directly affect the level of providing public services or facilities [39], and the safety supervision of government departments can effectively avoid illegal operations and the implementation of standardized construction schemes in the process of PPP construction [57,59]. Therefore, effective quality and safety supervision are conducive to the improvement of GP [39,56]. Moreover, the timely, accurate and comprehensive disclosure of project information is beneficial to the improvement of GP [60].
Therefore, based on the above literature, we propose
Hypothesis 3 (H3).
An excellent management technology has a significant positive impact on government performance of PPP projects.

2.3.4. Internal and External Communication and Government Performance

Information exchange is a means of connecting members of an organization to achieve common goals, which is the basis of all activities of the organization [61]. In terms of PPP, information exchange involves all participants of the project, and the participants need to make joint efforts to achieve the goals of PPP projects, so as to form a complete project system [39,54]. Therefore, effective communication has become the key to PPP project management technology [57]. Jamali (2007) and Kumaraswamy et al. (2015) showed that the public is the end-user of a public good or service, so the public’s demands and opinions on products/services play a pivotal role in providing reasonable public products/services through public resources for PPP, especially laying a solid foundation for project operation and public service provision [42,62]. Specifically, effective communication between government departments and the public can not only allow the public to better understand the policy support and behavior trends of higher-level departments, understand the dynamics of plans [63], and allow the public to indirectly participate in project decision-making, but also help the government to collect the latest effective information and understand the needs of the public, so that it can communicate and modify according to the actual situation [54]. In addition, it is necessary to maintain the integrity and ability of government officials and establish the role of “honest government” to gain trust and ensure accurate and complete information transmission [10]. That is, effective communication between the government and the public can avoid delays and mistakes caused by poor information flow in PPP, enhance mutual cooperation and understanding, and ensure the good performance of the government.
Therefore, based on the above literature, we propose
Hypothesis 4 (H4).
An effective internal and external communication has a significant positive impact on government performance of PPP projects.
Based on the above discussion and theoretical assumptions, the overall conceptual model of the influence of GC on GP in PPP projects can be obtained (see Figure 3).

3. Research Design

Conventional hypothesis testing method, combined with literature analysis, questionnaire survey, structural equation model (SEM) and one-way ANOVA, was used to test the influence of GC on the GP of PPP projects. Figure 4 shows the flow of the overall research framework, including four parts: creating a conceptual framework for research hypotheses based on an extensive literature review; completing the questionnaire design after variable measurement and pre-survey; and further collecting data and samples through a questionnaire survey; the obtained valid data were analyzed by statistical methods such as SEM and one-way ANOVA to empirically test the validity of the proposed link.

3.1. Questionnaire Design

The questionnaire is composed of two parts: Part 1 comprises the respondents’ socio-demographic characteristics (i.e., gender, education level, and employment). Part 2 assessed respondents’ evaluation of GC and GP of PPP projects, consisting of two measurement scales containing the PPP project GC evaluation scale and PPP projects GP evaluation scale (see Supplementary Material).

3.1.1. Government Credit of PPP Projects

As shown in Table 1, based on the model of GC in the PPP project from the perspective of WSR, we further constructed the GC evaluation scale for PPP, and this scale is divided into four parts with a total of 13 questions. It is worth emphasizing that the literature we select is mainly more applicable to the credit evaluation of PPP in China, so as to better reflect the characteristics of domestic PPP.

3.1.2. Government Performance of PPP Projects

Based on the key performance indicators system of PPP proposed by Yuan et al. (2012), the indicators of this scale are selected with the following standards [58]: (1) It is associated with project characteristics, stakeholder needs, and project progress; (2) It is related to government departments and can be used to evaluate GP of PPP projects; (3) The average t-value is >3.00, which belongs to the indicators of generally important and extremely important status. Finally, a total of nine questions were selected and compiled into a PPP project GP evaluation scale (see Table 2).
All questions were scored from a five-point Likert scale, ranging from 1 (extremely disagree) to 5 (extremely agree).

3.2. Samples and Data Collection

Considering a face-to-face questionnaire distribution was not doable due to the outbreak of COVID-19, the questionnaires for this study were mainly distributed through indirect contact methods (e.g., WeChat and Email). In order to effectively reduce the systematic errors in data collection and ensure the reliability and authenticity of the data, this study adopted academic and confidential statements at the beginning of the questionnaire, which conduce to dispel the respondents’ concerns and understand the real situation. Secondly, investigators explained to respondents the online way that the aim of questionnaire is to obtain different information and will be analyzed independently before they answer the questionnaire. Finally, El-Gohary et al. (2006) confirmed that stakeholders play a crucial role in determining whether a project succeeds or not [66], thus we choose the respondents from different occupations who are closely associated with PPP, mainly including government officials, staff of enterprises and institutions, personnel of PPP project design, executives, bidding units, and postgraduate students related to PPP.
Before undertaking the main survey, a pilot study was conducted with 100 members, and a total of 78 valid questionnaires were collected. The reliability and validity of the questionnaire were tested using Cronbach’s alpha and the exploratory factor analysis. As shown in Table 3, the result manifested that the questionnaire has sufficient reliability, structural validity, and internal consistency.
To avoid the risk of sample non-normality affecting the accuracy of measurement results, Bagozzi and Yi (2012) showed that the sample size is at least 100, and the results above 200 are more reliable [67]. Outlining appropriate sample sizes for questionnaire development and validation, Gunawan et al. (2021) summarized previous studies and found that the recommended sample size for factor analyses ranges from 50 to over 1000 samples, while the recommended item-to-response ratio varies from 1:3 to 1:20 and the estimated parameter-to-sample ratios are from 1:5 to 1:20 [68]. Therefore, considering the existence of invalid questionnaires, this study intends to recover 250–500 questionnaires. The selection of questionnaire samples adopts snowball sampling: (1) some government staff who meet the interview conditions are randomly selected through the network resources of research teams to issue the questionnaire, and then recommend the next survey objects by them; (2) the recommended survey objects are surveyed, and requested them to continue to recommend the next; (3) the snowball sampling survey will be terminated when the number of returned questionnaires for the survey needs.
The survey was conducted from 5 February to 31 April 2021. A total of 465 questionnaires were recovered, three criteria are used to identify invalid questionnaires: (1) respondents with an answer time of less than 40 s; (2) respondents who responded with apparent regularity; (3) respondents’ answers with focus on one of the answers. After eliminating the invalid questionnaires, 359 valid questionnaires were obtained, with an effective recovery rate of 77.20%. Although this overall response rate was broadly higher than conventional social investigations, the response rates in the studies by Cui et al. (2020) and Alu et al. (2019) had the same efficiency as similar studies [4,20].
Table 4 summarizes the details of the respondents’ socio-demographic characteristics, showing that the distribution of gender is relatively balanced. Equally, employment basically covers all types of social organizations and PPP project participants. Particularly, the respondents were mainly undergraduate education, accounting for 51.00%, and the total proportion of graduate students and above accounted for 38.40%, which shows that the overall education level of the respondents is relatively high, and thus they can better understand the meaning of the GC and GC indicators of PPP. Taken together, the survey samples are well represented and can fully reflect the understanding of different social groups and strata on the level of GC and GC of PPP in the region.

3.3. Data Analysis

The data analysis process adopted SPSS 26.0 and AMOS 25.0 was divided into four steps. First, non-response bias was examined using Chi-square test and t-test, and the potential threat of common method bias was examined using Harman’s single-factor test and confirmatory factor analysis (CFA) with method factors added. Second, a descriptive statistical analysis method was used to quantitatively evaluate the respondents’ evaluation of GC and GP in PPP projects. Then, SEM was used to analyze the 359 valid responses in this study to empirically test the hypothesized relationships between constructs. Finally, a one-way ANOVA was used to compare each construct within the eastern region, central region and western region.

4. Results

4.1. Non-Response Bias and Common Method Bias

Non-response bias refers to a situation that certain types of survey respondents are under-represented due to non-response, so the survey results could be biased when estimating demographic characteristics from the survey data samples [69,70]. Armstrong and Overton (1977) indicated that respondents later in the survey process are more likely to be non-responders than those earlier in the survey process [71]. Our non-response approach follows the procedure suggested by Armstrong and Overton (1977); Shiau et al. (2020) [69,71]. The current research addressed this issue by comparing the gender and age variables of early and late respondents. The Chi-square test and T-test are usually used to verify the existence of non-response bias. A total of 179 respondents who completed the survey earlier were considered early respondents, while the 180 who completed the survey in the later period were considered late respondents. Chi-square and T-tests of the early and late respondents showed no significant differences by gender or age (p > 0.05). Therefore, we rule out the possibility of non-response bias.
Common Method Bias (CMB) is considered a systematic error variance, which can arise when independent and correlated variables are captured by the same response method, has a negative impact on the validity of empirical results, leading to a misleading conclusion [72,73]. Model fit indices of the SEM model following the guidelines provided by Xiong et al. (2015) and Han et al. (2020) [74,75]. Accordingly, Harman’s single-factor test was used to check the common method bias of the five constructs from two scales, and the results (see Table 5) showed that the one-factor model fit poorly, while the five-factor model (CFA model) fit better. Similarly, the first-order method factors were further added to the five-factor model to form a six-factor model. Compared with the five-factor model, the fit of the model is not significantly improved, especially, the values of comparative fit index (CFI) and Tucker-Lewis index (TLI) decreased, and the values of RMSEA and SRMR increased [76]. Consequently, no serious common method bias in the current study.

4.2. Descriptive Statistics

The descriptive statistics of variables surveyed were firstly conducted (see Table 6). The mean of each item in IE, FS, MT, IEC, and GP all ranges from 3.51 to 4.13, which indicates that the overall level of GC and GP in PPP projects tends to be positive in China. Additionally, adopting the SEM method requires a normal distribution of data, which can be measured by skewness and kurtosis coefficient [77]. The result given in Table 6 shows that the coefficients of skewness and kurtosis of all variables are basically less than 2, and thus the collected survey data are basically in line with multivariate normality.

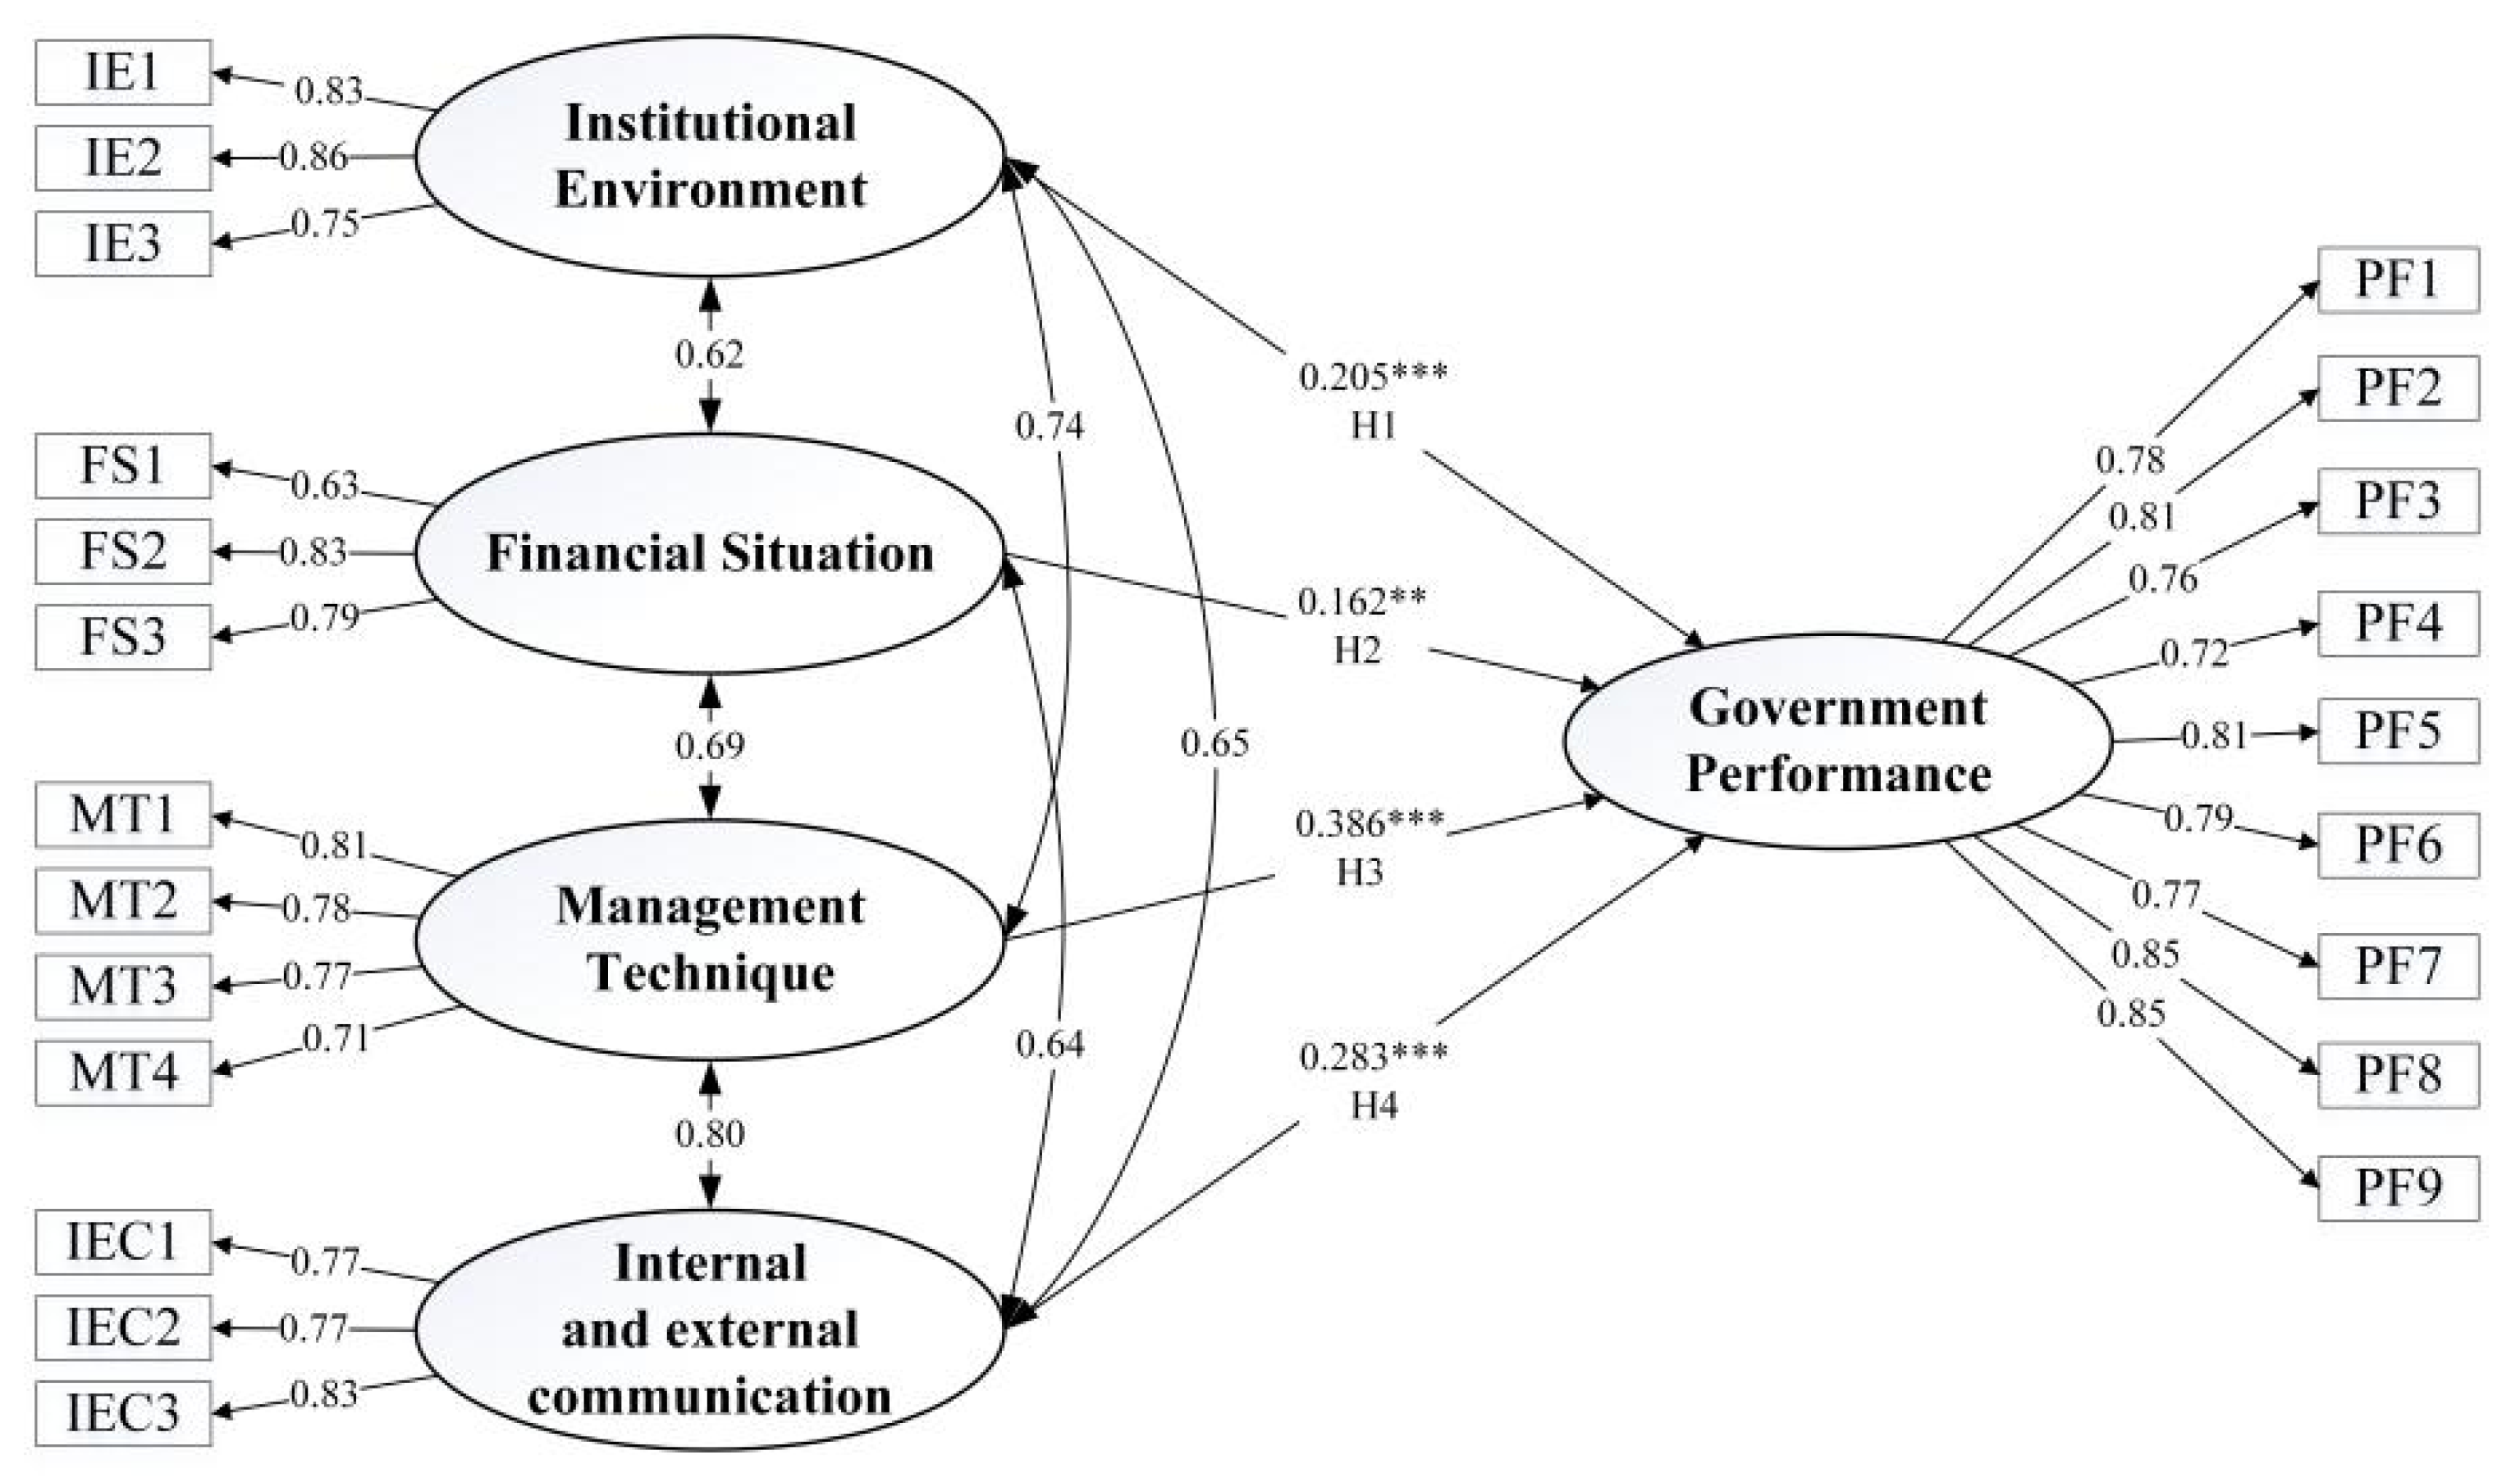
4.3. Structural Equation Analysis

The model fit indices of the SEM analysis obtained (see Table 5) indicate that all the approximate fit indices meet the accepted range. Chi-square/d.f. (2.200), NFI (0.922), CFI (0.956), and RMR (0.022) are all in the ideal range. Although GFI values 0.899 below the ideal range of 0.90 and RMSEA values 0.058 above the ideal range of 0.05, it is still within the satisfactory range, suggesting an adequate fit between the hypothesized model and the survey data.
The SEM model, its standardized path loadings, and significant levels are shown in Figure 5. All the hypothesized links between IE, FS, MT, IEC, and GP are supported at the significant level p < 0.05. Specifically, IE (0.180, p < 0.001), FS (0.200, p < 0.01), MT (0.350, p < 0.001), and IEC (0.220, p < 0.001) all have a positive influence on GP, which verifies H1 to H4.

4.4. Comparative Analysis of the GC and GP among Different Regions

Table 7 presents the results of the one-way ANOVA test, indicating that the differences in GC and GP among the five constructs across different regions (i.e., eastern region, central region, western region) are significant. SPSS post-hoc multiple comparisons show that all constructs were related to regions, that is, the GC and GP of PPP projects in the eastern region and the central region are significantly higher than those in the western region. However, except for the level of FS, all other constructs had no significant difference between the eastern and central regions.

5. Discussion

As shown in Table 6, the current research based on 359 valid samples shows that the overall GC (i.e., IE, FS, MT, IEC) and GP score of PPP projects in China tend to be positive, which is consistent with previous studies [8,78]. Nevertheless, except for the FS1 (“regional economic strength”), the scores of all other constructs did not reach 4, indicating that there is still great room for improvement of GC and GP in China. Moreover, it is worth highlighting that the score of the IEC3 was only 3.51, the lowest ranking of all items, which means corruption is still a critical factor affecting the GC in PPP. Rose-Ackerman and Palifka (2016); and Chan et al. (2011) all suggested corruption created economic inefficiencies and inequities [11,79], more specifically, corruption of local government officials prevented some projects from reaching their expected performance levels. Obviously, although the “anti-corruption” work has been advancing in China, it still needs to be further implemented.
The results of the SEM provide strong empirical support for the expected relationship between GC and GP of PPP projects, i.e., IE, FS, MT, IEC, which were all positively associated with GP. In terms of the influence level of IE, this finding also supports Zhang et al. (2015) and Wang et al. (2012)’s research that the performance of PPP is closely related to its IE [36,80], especially, a well-established legal framework and stable policy for PPP projects play an important role in the advancement, development, and performance of PPP [10,32,81]. Secondly, previous studies have shown that the FS plays an important role in the performance of PPP projects [82,83], which is consistent with our findings as well. Financial risk is considered to be one of the critical factors leading to the failure or poor performance of PPP projects [82,84]. For the sake of ensuring the financial viability and success of PPP, the Ministry of Finance was appointed as the supervision and management unit for the privatized development of public infrastructure in China [5], which guarantees the performance of the PPP projects to a certain extent.
Additionally, high investment amount, large scale, long cycle, complex technology, and uncertain environment are the characteristics of PPP projects [8,60], which means higher requirements for MT. Correspondingly, the path coefficient of MT in all constructs is also the highest, which indicates that its impact on the government performance of PPP projects is of great value. Equally important, the theory of government failure also points out that the “visible hand” of the government has the same problem as the market failure [85], which may appear as supervision failure, opaque government information, insufficient infrastructure investment in PPP projects, resulting in a great waste of social resources, inability to effectively meet social public needs, seriously damaging social welfare, and ultimately affecting the GP. Finally, numerous studies have shown that corruption, public opposition, etc. are the critical factors that cause poor performance or even failure of PPP projects [10,86]. Therefore, sufficient public participation, government support, and sufficient trust can effectively improve the GP of PPP projects, which is in line with our findings.
And moreover, there are differences in GC and GP of PPP projects in regions, which is expected in view of regional differences in public service level and economic development level in different regions of China [87,88]. On the one hand, the overall growth rate of the eastern region is the fastest among the three regions, and the development rate of the central region in recent years is also constantly increasing [89,90]. More abundant resources and social and economic development level, which means that it can adapt to the development of the PPP arrangement more quickly and effectively, so as to achieve a higher level of credit and performance of PPP projects [87]. In parallel, the lack of guidelines for PPP in the western region, as well as subject to the economic environment, ultimately leads to poor GC and GP levels of PPP projects [91]. On the other hand, the governments of the western region are implementing the PPP with practical actions to achieve the goal of breaking through the bottleneck of infrastructure restricting economic development [1]. According to the “2020 Semi-annual Report of the National PPP Integrated Information Platform Management Library Project”, the top four provinces in terms of cumulative investment in the library projects are Yunnan (1.3 trillion CNY), Guizhou (1.2 trillion CNY), Henan (1.0 trillion CNY), and Sichuan (1.0 trillion CNY), all of which are located in the central and western regions. Therefore, the GP and GC of PPP projects in the central and eastern regions converge, and the western region also achieved good results in terms of GP and GC of PPP projects, but there are still gaps derived from their own development constraints.

6. Conclusions

The primary objective of this paper was to explore the specific influence of GC on GP in PPP projects. Using a sample of 359 valid questionnaires from respondents who had experience/knowledge with PPP projects, the present study examined the relationship between GC and GP in PPP projects, of which GC consists of three dimensions (four constructs) based on the WSR system theory. The following conclusions were obtained: (1) Although the GC and GP levels of PPP projects in China are currently at a relatively optimistic level, there is still a great room for improvement; (2) It has a positive influence between GC and GP of PPP projects, that is, IE, FS, MT, and IEC are all positively associated with GP; (3) The GC and GP of PPP projects vary with the level of regional economic and social development, among which the eastern and central regions with higher economic and social development level has the higher GC and GP, while the western region is the lower.
This study contributes to the knowledge system of the relationship between credit and performance in PPP, and clarifies the influencing mechanism between GC and GP in PPP projects. First, compared with previous studies, this study established a new research framework, based on WSR system theory, comprehensively considered the GC of PPP projects from the aspects of IE, FS, MT, IEC, and verified the relationship between GC and GP of PPP projects through empirical research. Meanwhile, it is also conducive to the government’s in-depth understanding of the attitudes of practitioners and potential users of PPP projects, thus checking for leaks and filling vacancies and providing the basis for the government to effectively guide PPP practice, and further promoting the sustainable development of infrastructure.
Specifically, given the significant effect on GP through GC of PPP projects, GC is encouraged to get attention in various aspects so as to comprehensively improve GC of PPP projects, especially for items with low index scores, e.g., official corruption, information transparency, and public participation. Therefore, the government can adopt more targeted measures such as strengthening the punishment intensity of corruption and formulating incentive measures in PPP implementation, which could curb corrupt intentions and promote work enthusiasm to effectively improve project performance, as well as promoting the market competition of PPP projects and attracting more powerful private sectors to participate. Similarly, public participation is of great significance for promoting social development, and extensive public participation needs to be implemented thoroughly in the life cycle to improve the GP of PPP projects.
This study, however, is also subject to some limitations while opening avenues for future research. First, this study uses an online survey as the main method owing to the outbreak of the COVID-19 epidemic, which to a certain extent resulted in the number of questionnaires obtained in different regions being a little unbalanced, and it should be subject to a more comprehensive investigation in the next step. Additionally, owing to the lack of literature on the relationship between GC and GP in PPP projects, as well as some concepts that are difficult to operate in practice, the SEM constructed for this study is relatively simple, and no intermediate variables are added, which is also the focus of next research.

Supplementary Materials

The following supporting information can be downloaded at: https://www.mdpi.com/article/10.3390/su14116886/s1, File S1: Questionnaire.

Author Contributions

Conceptualization, Y.L.; methodology, Y.L. and C.C.; software, X.H. and Y.Z.; validation, C.C.; formal analysis, Q.Z.; investigation, Q.Z.; resources, Y.B.; data curation, X.H. and Y.Z.; writing—original draft preparation, Q.Z. and Y.B.; writing—review and editing, Q.Z. and Y.B.; visualization, Q.Z.; supervision, C.C.; project administration, Y.L.; funding acquisition, Y.L. All authors have read and agreed to the published version of the manuscript.

Funding

This work was supported by the National Natural Science Foundation of China (NSFC) (Grant Nos. 72072165, 71672180, and 72001079), the Soft Science Research Program of Zhejiang Province, China (Grant No. 2020C35055), and the Research Foundation of Education Bureau of Zhejiang Province, China (Grant No. Y202045460).

Institutional Review Board Statement

The study was conducted according to the research guidelines approved by the Research Committees of Authors Institutions.

Informed Consent Statement

Informed consent was obtained from all subjects involved in the study.

Data Availability Statement

The data presented in this study are available on request from the corresponding author.

Conflicts of Interest

The authors declare that they have no conflict of interest.

References

  1. Cai, J.; Lin, J.; Yang, Z.; Zhou, X.; Cheng, Z. Retro or Renewal: An Assessment of PPP Management and Policy in China Since 2014. Public Work. Manag. P 2021, 26, 359–380. [Google Scholar] [CrossRef]
  2. Ke, Y.; Wang, S.; Chan, A.P.; Cheung, E. Research trend of public-private partnership in construction journals. J. Constr. Eng. Manag. 2009, 135, 1076–1086. [Google Scholar] [CrossRef]
  3. Brogaard, L.; Petersen, O.H. Public-private partnerships (PPPs) in development policy: Exploring the concept and practice. Dev. Policy Rev. 2018, 36, O729–O747. [Google Scholar] [CrossRef] [Green Version]
  4. Alu, S.; Xiao, H. Effects of justice perceptions on private sector’s cooperative behavior in PPP project. In IOP Conference Series: Earth and Environmental Science, Kuala Lumpur, Malaysia, 12–14 April 2019; IOP Science: Bristol, UK, 2019. [Google Scholar] [CrossRef]
  5. Zhang, S.; Chan, A.P.; Feng, Y.; Duan, H.; Ke, Y. Critical review on PPP Research–A search from the Chinese and International Journals. Int. J. Proj. Manag. 2016, 34, 597–612. [Google Scholar] [CrossRef]
  6. Liu, H.J.; Love, P.E.; Smith, J.; Irani, Z.; Hajli, N.; Sing, M.C. From design to operations: A process management life-cycle performance measurement system for Public-Private Partnerships. Prod. Plan. Control. 2018, 29, 68–83. [Google Scholar] [CrossRef]
  7. Zheng, C.B.; Lu, Q.Q. Research on Performance Improvement Strategy for PPP Projects in Infrastructure Area Based on Evolutionary Game. Soft Science. 2022. Available online: http://kns.cnki.net/kcms/detail/51.1268.g3.20220228.2042.017.html (accessed on 3 March 2022). (In Chinese).
  8. Nie, X.; Feng, K.; Zhao, G.; Fan, T.; Wang, S. The Evolutionary Game of Trust in Public-Private Partnership Project Networks. Math. Probl. Eng. 2021, 2021, 5514708. [Google Scholar] [CrossRef]
  9. Xiong, W.; Chen, B.; Wang, H.; Zhu, D. Public–private partnerships as a governance response to sustainable urbanization: Lessons from China. Habitat Int. 2020, 95, 102095. [Google Scholar] [CrossRef]
  10. Chan, A.P.; Lam, P.T.; Chan, D.W.; Cheung, E.; Ke, Y. Potential obstacles to successful implementation of public-private partnerships in Beijing and the Hong Kong special administrative region. J. Manag. Eng. 2010, 26, 30–40. [Google Scholar] [CrossRef]
  11. Chan, A.P.; Yeung, J.F.; Yu, C.C.; Wang, S.Q.; Ke, Y. Empirical study of risk assessment and allocation of public-private partnership projects in China. J. Manag. Eng. 2011, 27, 136–148. [Google Scholar] [CrossRef] [Green Version]
  12. Creţan, R. Who owns the name? Fandom, social inequalities and the contested renaming of a football club in Timişoara, Romania. Urban Geogr. 2019, 40, 805–825. [Google Scholar] [CrossRef]
  13. Leifer, E. Making the Majors: The Transformation of Team Sports in America; Harvard University Press: Cambridge, MA, USA, 2009. [Google Scholar]
  14. Zhang, B.; Zhang, L.; Wu, J.; Wang, S. actors affecting local governments’ public–private partnership adoption in urban China. Sustainability. 2019, 11, 6831. [Google Scholar] [CrossRef] [Green Version]
  15. Chen, J.; Wang, D. Government credit risk assessment of non-profit public-private partnership projects in China based on the IVHFSs-IFAHP model. Sci. Iran. 2021, 28, 38–48. [Google Scholar] [CrossRef] [Green Version]
  16. Rîșteiu, N.T.; Creţan, R.; O’Brien, T. Contesting post-communist economic development: Gold extraction, local community, and rural decline in Romania. Eurasian Geogr. Econ. 2021, 1–23. [Google Scholar] [CrossRef]
  17. Baxter, J.; Ho, Y.; Rollins, Y.; Maclaren, V. Attitudes toward waste to energy facilities and impacts on diversion in Ontario, Canada. Waste Manag. 2016, 50, 75–85. [Google Scholar] [CrossRef]
  18. Sun, C.; Ouyang, X.; Meng, X. Public acceptance towards waste-to-energy power plants: A new quantified assessment based on “willingness to pay”. J. Environ. Plan. Manag. 2019, 62, 2459–2477. [Google Scholar] [CrossRef]
  19. Song, J.; Sun, Y.; Jin, L. PESTEL analysis of the development of the waste-to-energy incineration industry in China. Renew. Sust. Energ. Rev. 2017, 80, 276–289. [Google Scholar] [CrossRef]
  20. Cui, C.; Sun, C.; Liu, Y.; Jiang, X.; Chen, Q. Determining critical risk factors affecting public-private partnership waste-to-energy incineration projects in China. Energy Sci. Eng. 2020, 8, 1181–1193. [Google Scholar] [CrossRef]
  21. Xiao, L.J. On construction of government credit. Soci. Sci. Yunnan 2006, 5–9. Available online: https://kns.cnki.net/kcms/detail/detail.aspx?dbcode=CJFD&dbname=CJFD2006&filename=YSHX200604001&uniplatform=NZKPT&v=KLkEYhltqNIX95qk6POcaoQeXTWOy85IYhGPT191myCZe5Bvd2h5buO8nYP44WY3 (accessed on 14 April 2022). (In Chinese).
  22. Zhou, Y.; Liu, J. Influence of government credit risk on PPP projects in operation stage. Int. J. Strateg. Prop. M 2021, 25, 216–227. [Google Scholar] [CrossRef]
  23. Oh, H.; Hong, J.H. Citizens’ trust in government and their willingness-to-pay. Econ. Lett. 2012, 115, 345–347. [Google Scholar] [CrossRef]
  24. Cao, H.; Zhang, L.; Qi, Y.; Yang, Z.; Li, X. Government auditing and environmental governance: Evidence from China’s auditing system reform. Environ. Impact Asses. 2022, 93, 106705. [Google Scholar] [CrossRef]
  25. Funkhouser, M.; Pu, J.Y. Government performance auditing in the US and China: Lessons drawn from a comparative review. Chin. Pub. Adm. Rev. 2019, 10, 65–78. [Google Scholar] [CrossRef] [Green Version]
  26. Gu, J.; Zhu, Z. Knowing Wuli, sensing Shili, caring for Renli: Methodology of the WSR approach. Syst. Pract. Act. Res. 2000, 13, 11–20. [Google Scholar] [CrossRef]
  27. Lin, X.; Zhang, Q.; Han, X. Application of Wuli-Shili-Renli system methodology in knowledge management. Kybernetes 2009, 38, 346–353. [Google Scholar] [CrossRef]
  28. Ye, H.; He, R.; Chen, J. WSR and LSS based research on building and evaluation of quality management system for armored equipment maintenance. In Proceedings of the 2013 International Conference on Quality, Reliability, Risk, Maintenance, and Safety Engineering, Emeishan, China, 15–18 July 2013. [Google Scholar] [CrossRef]
  29. Tong, X.; Chen, S. Human resource development based on wuli-shili-renli systems approach. In Proceedings of the 2008 4th International Conference on Wireless Communications, Networking and Mobile Computing, Dalian, China, 12–17 October 2008. [Google Scholar] [CrossRef]
  30. Gu, J.F.; Tang, X.J. From ancient system thoughts to modern oriental systems methodology. Theory Pract. Syst. Eng. 2000, 1, 89–92. (In Chinese) [Google Scholar]
  31. Ji, B.; Liu, Y.; Jin, Z. An evaluation of the design and construction of energy management platform for public buildings based on WSR system approach. Kybernetes 2018, 47, 1549–1568. [Google Scholar] [CrossRef]
  32. Sachs, T.; Tiong, R.; Wang, S.Q. Analysis of political risks and opportunities in public private partnerships (PPP) in China and selected Asian countries: Survey results. Chin. Manag. Stud. 2007, 1, 126–148. [Google Scholar] [CrossRef]
  33. Bao, Y.H.; Wang, X.Y.; Xu, M.; Liu, Y. Research on the construction of government credit evaluation index system for PPP projects based on the perspective of WSR. Tech. J. Proj. Manag. 2021, 19, 17–23. (In Chinese) [Google Scholar]
  34. Ding, H. History of Western Administrative Theory; Wuhan University Press: Wuhan, China, 2005. [Google Scholar]
  35. Barnard, C.I. Organization and Management; Harvard University Press: Cambridge, MA, USA, 2014. [Google Scholar] [CrossRef]
  36. Zhang, S.; Gao, Y.; Feng, Z.; Sun, W. PPP application in infrastructure development in China: Institutional analysis and implications. Int. J. Proj. Manag. 2015, 33, 497–509. [Google Scholar] [CrossRef]
  37. Chan, A.P.; Lam, P.T.; Chan, D.W.; Cheung, E.; Ke, Y. Critical success factors for PPPs in infrastructure developments: Chinese perspective. J. Constr. Eng. Manag. 2010, 136, 484–494. [Google Scholar] [CrossRef]
  38. Zou, W.; Kumaraswamy, M.; Chung, J.; Wong, J. Identifying the critical success factors for relationship management in PPP projects. Int. J. Proj. Manag. 2014, 32, 265–274. [Google Scholar] [CrossRef] [Green Version]
  39. Sun, H.; Shen, K.K.; Fan, Z.Q. Analysis of Factors Influencing PPP Project Performance Based on SEM. J. Tianjin Univ. Soc. Sci. Ed. 2012, 14, 513–519. (In Chinese) [Google Scholar]
  40. Van Ham, H.; Koppenjan, J. Building public-private partnerships: Assessing and managing risks in port development. Public Manag. Rev. 2001, 3, 593–616. [Google Scholar] [CrossRef]
  41. Ng, A.; Loosemore, M. Risk allocation in the private provision of public infrastructure. Int. J. Proj. Manag. 2007, 25, 66–76. [Google Scholar] [CrossRef]
  42. Kumaraswamy, M.; Zou, W.; Zhang, J. Reinforcing relationships for resilience-by embedding end-user ’people’ in public-private partnerships. Civ. Eng. Environ. Syst. 2015, 32, 119–129. [Google Scholar] [CrossRef]
  43. Barney, J.B. Firm resources and sustained competitive advantage. J. Manag. 1991, 17, 99–120. [Google Scholar] [CrossRef]
  44. Barney, J.B. Resource-based theories of competitive advantage: A ten-year retrospective on the resource-based view. J. Manag. 2001, 27, 643–650. [Google Scholar] [CrossRef]
  45. Conner, K.R.; Prahalad, C.K. A resource-based theory of the firm: Knowledge versus opportunism. Organ. Sci. 1996, 7, 477–501. [Google Scholar] [CrossRef]
  46. Amit, R.; Schoemaker, P.J. Strategic assets and organizational rent. Strateg. Manag. J. 1993, 14, 33–46. [Google Scholar] [CrossRef]
  47. Black, J.A.; Boal, K.B. Strategic resources: Traits, configurations and paths to sustainable competitive advantage. Strateg. Manag. J. 1994, 15, 131–148. [Google Scholar] [CrossRef]
  48. Helfat, C.E.; Peteraf, M.A. The dynamic resource-based view: Capability lifecycles. Strateg. Manag. J. 2003, 24, 997–1010. [Google Scholar] [CrossRef]
  49. Feng, J.B.; Zhang, T. Effect of private capital in rival projects on public-private partnership adoption in China. Appl. Econ. Lett. 2021, 1990838. [Google Scholar] [CrossRef]
  50. Arya, B.; Lin, Z. Understanding collaboration outcomes from an extended resource-based view perspective: The roles of organizational characteristics, partner attributes, and network structures. J. Manag. 2007, 33, 697–723. [Google Scholar] [CrossRef] [Green Version]
  51. Zhang, L.; Sun, X.; Xue, H. Identifying critical risks in Sponge City PPP projects using DEMATEL method: A case study of China. J. Clean. Prod. 2019, 226, 949–958. [Google Scholar] [CrossRef]
  52. Yang, J.; Wang, Y. Will the central-local disparity in public policy perceptions disappear? Evidence from 19 major cities in China. Gov. Inform. Q. 2020, 37, 101525. [Google Scholar] [CrossRef]
  53. Rebeiz, K.S. Public-private partnership risk factors in emerging countries: BOOT illustrative case study. J. Manag. Eng. 2012, 28, 421–428. [Google Scholar] [CrossRef]
  54. Osei-Kyei, R.; Chan, A.P. Implementing public-private partnership (PPP) policy for public construction projects in Ghana: Critical success factors and policy implications. Int. J. Const. Manag. 2017, 17, 113–123. [Google Scholar] [CrossRef]
  55. Velotti, L.; Botti, A.; Vesci, M. Public-private partnerships and network governance: What Are the Challenges? Public Perform. Manag. 2012, 36, 340–365. [Google Scholar] [CrossRef]
  56. Wang, S.Q.; Zhang, B.; Chen, J.X.; Niu, Y.S. Study on the Influence of Government Behavior on PPP Performance. J. Soft Sci. 2020, 34, 1–5. (In Chinese) [Google Scholar] [CrossRef]
  57. Bloomfield, P. The challenging business of long-term public-private partnerships: Reflections on local experience. Public Admin. Rev. 2006, 66, 400–411. [Google Scholar] [CrossRef]
  58. Yuan, J.F.; Skibniewski, M.J.; Deng, X.P.; Ji, C.; Li, C. The identification of key performance indicators in public private partnership projects based on structural equation modeling. J. Chongqing Univ. Soc. Sci. Ed. 2012, 18, 56. (In Chinese) [Google Scholar]
  59. Jamali, D. Success and failure mechanisms of public private partnerships (PPPs) in developing countries: Insights from the Lebanese context. Int. J. Public Sect. Manag. 2004, 17, 414–430. [Google Scholar] [CrossRef]
  60. Jamali, D. A study of customer satisfaction in the context of a public private partnership. Int. J. Qual. Reliab. Manag. 2007, 24, 370–385. [Google Scholar] [CrossRef]
  61. Jiang, X.; Lu, K.; Xia, B.; Liu, Y.; Cui, C. Identifying significant risks and analyzing risk relationship for construction PPP projects in China using integrated FISM-MICMAC approach. Sustainability. 2019, 11, 5206. [Google Scholar] [CrossRef] [Green Version]
  62. Deimen, I.; Szalay, D. Information and communication in organizations. In AEA Papers and Proceedings, Atlanta, GA, USA, 4–6 January 2019; American Economic Association: Nashville, TN, USA, 2019. [Google Scholar] [CrossRef]
  63. Wang, W.X.; Li, Q.M.; Deng, X.P.; Li, J.H. Critical success factors of infrastructure projects under PPP model in China. In Proceedings of the International Conference on Wireless Communications, Networking and Mobile Computing, Shanghai, China, 21–25 September 2007. [Google Scholar]
  64. Qi, X.; Yi, C.; Li, J. The study on the barrier of implementation of PPP projects’ assessment system based on VFM in China. In Proceedings of the 2nd International Conference on Civil, Architectural and Hydraulic Engineering, Zhuhai, China, 27–28 July 2013. [Google Scholar] [CrossRef]
  65. Yan, M.; Gu, W.Y. Study on the Construction of Credit Risk Rating System of Local Government in China: The Framework and Methods. J. Cent. Univ. Financ. Econ. 2014, 58, 7–54. (In Chinese) [Google Scholar] [CrossRef]
  66. El-Gohary, N.M.; Osman, H.; El-Diraby, T.E. Stakeholder management for public private partnerships. Int. J. Proj. Manag. 2006, 24, 595–604. [Google Scholar] [CrossRef]
  67. Bagozzi, R.P.; Yi, Y. Specification, evaluation, and interpretation of structural equation models. J. Acad. Market. Sci. 2012, 40, 8–34. [Google Scholar] [CrossRef]
  68. Gunawan, J.; Marzilli, C.; Aungsuroch, Y. Establishing appropriate sample size for developing and validating a questionnaire in nursing research. Belitung Nurs. J. 2021, 7, 356–360. [Google Scholar] [CrossRef]
  69. Shiau, W.L.; Yuan, Y.; Pu, X.; Ray, S.; Chen, C.C. Understanding fintech continuance: Perspectives from self-efficacy and ECT-IS theories. Ind. Manag. Data Syst. 2020, 120, 1659–1689. [Google Scholar] [CrossRef]
  70. Cheung, K.L.; Peter, M.; Smit, C.; de Vries, H.; Pieterse, M.E. The impact of non-response bias due to sampling in public health studies: A comparison of voluntary versus mandatory recruitment in a Dutch national survey on adolescent health. BMC Public Health 2017, 17, 276. [Google Scholar] [CrossRef] [Green Version]
  71. Armstrong, J.S.; Overton, T.S. Estimating nonresponse bias in mail surveys. J. Mark. Res. 1977, 14, 396–402. [Google Scholar] [CrossRef] [Green Version]
  72. Kock, F.; Berbekova, A.; Assaf, A.G. Understanding and managing the threat of common method bias: Detection, prevention and control. Tour. Manag. 2021, 86. [Google Scholar] [CrossRef]
  73. Liu, Y.; Xu, M.; Ge, Y.; Cui, C.; Xia, B.; Skitmore, M. Influences of environmental impact assessment on public acceptance of waste-to-energy incineration projects. J. Clean. Prod. 2021, 304, 127062. [Google Scholar] [CrossRef]
  74. Xiong, B.; Skitmore, M.; Xia, B. A critical review of structural equation modeling applications in construction research. Automat. Constr. 2015, 49, 59–70. [Google Scholar] [CrossRef] [Green Version]
  75. Han, Y.; Li, J.; Cao, X.; Jin, R. Structural equation modeling approach to studying the relationships among safety investment, construction employees’ safety cognition, and behavioral performance. J. Constr. Eng. M 2020, 146, 04020065. [Google Scholar] [CrossRef]
  76. Podsakoff, P.M.; MacKenzie, S.B.; Lee, J.Y. Common method biases in behavioral research: A critical review of the literature and recommended remedies. J. Appl. Psychol. 2003, 88, 879. [Google Scholar] [CrossRef] [PubMed]
  77. Grace, J.B. Structural Equation Modeling and Natural Systems; Cambridge University Press: Cambridge, UK, 2006. [Google Scholar] [CrossRef]
  78. Yuan, J.; Zeng, A.Y.; Skibniewski, M.J.; Li, Q. Selection of performance objectives and key performance indicators in public–private partnership projects to achieve value for money. Constr. Manag. Econ. 2009, 27, 253–270. [Google Scholar] [CrossRef]
  79. Rose-Ackerman, S.; Palifka, B.J. Corruption and Government: Causes, Consequences, and Reform; Cambridge University Press: Cambridge, UK, 2016. [Google Scholar]
  80. Wang, S.; Ke, Y.; Xie, J. Taking stock of PPP and PFI around the world. In Public-Private Partnership Implementation in China; Certified Accountants Educational Trust; The University of Manchester Research: Manchester, UK, 2012; pp. 154–196. [Google Scholar]
  81. Chen, C.; Doloi, H. BOT application in China: Driving and impeding factors. Int. J. Proj. Manag. 2008, 26, 388–398. [Google Scholar] [CrossRef]
  82. Kalyani, K.A.; Pandey, K.K. Waste to energy status in India: A short review. Renew. Sust. Energ. Rev. 2014, 31, 113–120. [Google Scholar] [CrossRef]
  83. Schively, C. Understanding the NIMBY and LULU phenomena: Reassessing our knowledge base and informing future research. J. Plan. Lit. 2007, 21, 255–266. [Google Scholar] [CrossRef]
  84. Soumaré, I. An analysis of government loan guarantees and direct investment through public-private partnerships. Econ. Model. 2016, 59, 508–519. [Google Scholar] [CrossRef]
  85. Young, D.R. Government failure theory. In the Nature of the Nonprofit Sector, 4th ed.; Routledge: New York, NY, USA, 2021; pp. 235–237. [Google Scholar]
  86. Zhang, W.; Bai, Y. Risk allocation and dispute resolution mechanisms in Chinese public projects: An empirical study. In Proceedings of the 2013 International Conference on Construction and Real Estate Management, Karlsruhe, Germany, 10–11 October 2013. [Google Scholar] [CrossRef]
  87. Yang, T.; Li, X.; Xing, C. Factors that influence regional differences in the development of agricultural public private partnership projects in China. Transform. Bus. Econ. 2020, 19, 329–350. [Google Scholar]
  88. Chen, S.; Xiang, L.; Jin, L. Development characteristics of public-private partnership projects using fuzzy approach in China during 2016–2018. J. Intell. Fuzzy Syst. 2021, 40, 8317–8331. [Google Scholar] [CrossRef]
  89. Yao, X.N.; Zhang, D.L. Paradigm changing with sustainable economic development in China. In Proceedings of the 2009 International Conference on Machine Learning and Cybernetics, Baoding, China, 12–15 July 2009. [Google Scholar] [CrossRef]
  90. Garnaut, R.; Song, L.; Fang, C. China’s 40 Years of Reform and Development: 1978–2018; ANU Press: Canberra, ACT, Australia, 2018. [Google Scholar] [CrossRef]
  91. Ye, X.S.; Xiong, H.M. Key factors of PPP cooperation in the western region of China. J. Eng. Manag. 2013, 27, 81–86. (In Chinese) [Google Scholar]
Figure 1. WSR model of government credit of PPP project.
Sustainability 14 06886 g001
Figure 2. Theoretical framework.
Sustainability 14 06886 g002
Figure 3. The overall conceptual model.
Sustainability 14 06886 g003
Figure 4. Overall research framework.
Sustainability 14 06886 g004
Figure 5. Standardized estimates of the SEM model. Notes: *** p < 0.001, ** p < 0.01.
Sustainability 14 06886 g005
Table 1. PPP project government credit evaluation scale.
DimensionFirst LevelSecond LevelReferences
WuliInstitutional Environment
(IE)
IE1Laws and regulations[11,63,64]
IE2Policy Making[10,36,60,64]
IE3Institutional Settings[36,60,64]
Financial Situation
(FS)
FS1Regional economic strength[65]
FS2Government finances[65]
FS3Government debt situation[65]
ShiliManagement Technique
(MT)
MT1Bidding Environment[11,60]
MT2Infrastructure supply[10,11,36,60]
MT3Supervision[11,60,63,64]
MT4Information disclosure[60,64]
RenliInternal and external
communication
(IEC)
IEC1Official corruption[10,11,60]
IEC2Superior support[54,63]
IEC3Public acceptance[10,11,60]
Table 2. PPP project government performance evaluation scale.
ConstructItems
Government Performance Evaluation of PPP Projects
(GP)
GP1Mutual commitment and responsibility sharing between PPP project contractors and the government.
GP2PPP projects have reasonable risk allocation, sharing and transfer mechanisms.
GP3The government has a thorough understanding of the PPP arrangement and has the ability to control.
GP4The PPP project is technically feasible, the project can be constructed, and the completed project can be maintained.
GP5High satisfaction of government departments in PPP projects.
GP6Reasonable construction period and concession period for PPP projects.
GP7High public satisfaction with PPP projects.
GP8The government has good planning and strong supervision of PPP projects.
GP9Reasonable management of PPP project-related organizations and interfaces between stages.
Table 3. Questionnaire reliability and validity.
ConstructsCronbach’s αKMOBartlett’s Test of SphericityCR
IE0.8310.796x2 = 488.411
df = 3
Sig. = 0.000
0.815
FS0.7790.672x2 = 333.600
df = 3
Sig. = 0.000
0.774
MT0.7970.812x2 = 600.874
df = 6
Sig. = 0.000
0.842
IEC0.8080.712x2 = 417.183
df = 3
Sig. = 0.000
0.831
GP0.9240.939x2 = 2348.560
df = 36
Sig. = 0.000
0.909
Table 4. Respondents’ socio-demographic data (n = 359).
ProfileCategoryFrequency
Eastern RegionCentral RegionWestern RegionOverall
GenderMale97 (52.70%)56 (54.90%)36 (49.3%)189 (52.60%)
Female87 (47.30%)46 (45.10%)37 (50.7%)170 (47.40%)
Education levelJunior College22 (12.00%)9 (8.80%)7 (9.60%)38 (10.60%)
Undergraduate77 (41.80%)60 (58.80%)46 (63.00%)183 (51.00%)
Master80 (43.50%)31 (30.40%)18 (24.70%)129 (35.90%)
>Master5 (2.70%)2 (2.00%)2 (2.70%)9 (2.50%)
EmploymentGovernment agencies18 (9.80%)13 (12.70%)7 (9.60%)38 (10.60%)
Business unit60 (32.60%)30 (29.40%)31 (42.50%)121 (33.70%)
University/research institution82 (44.60%)46 (45.10%)17 (23.30%)145 (40.40%)
Social groups24 (13.00%)13 (12.70%)18 (24.7%)55 (15.30%)
Table 5. Model fit indices of the SEM model (n = 359).
IndicesAccepted RangeFive-Factor Model(CFA Model)Six-Factor ModelOne-Factor Model
SatisfactoryIdeal
Chi-square 437.775502.408908.281
d.f. 199188209
Chi-square/d.f.≤5.0≤3.02.2002.6724.346
GFI≥0.80≥0.900.8990.8900.804
AGFI≥0.80≥0.900.8710.8520.763
RMSEA≤0.08≤0.050.0580.0680.097
RMR≤0.08≤0.050.0220.1930.033
NFI≥0.90≥0.900.9220.9100.838
IFI≥0.90≥0.900.9560.9420.870
CFI≥0.90≥0.900.9560.9410.870
TLI≥0.90≥0.900.9480.9430.856
SRMR≤0.08≤0.050.0360.1220.053
Table 6. Statistical results of the descriptive variables.
FactorIndicatorSkewnessKurtosisMeanStd. dev
IEIE1−0.4480.4083.8400.598
IE2−0.4390.0023.8300.702
IE3−0.5320.5073.7800.680
FSFS1−0.5640.1874.1300.524
FS2−0.3970.2353.8800.564
FS3−0.2960.5293.8000.451
MTMT1−0.4700.4563.7400.669
MT2−0.6331.0733.7800.595
MT3−0.3660.3493.6200.649
MT4−0.4660.3713.6500.576
IECIEC1−0.4060.1453.5100.820
IEC2−0.322−0.3953.9200.630
IEC3−0.4370.2633.6400.723
GPGP1−0.6080.9433.9500.514
GP2−0.5810.5723.9300.612
GP3−0.196−0.0263.5700.677
GP4−0.5720.5983.9800.511
GP5−0.7031.2833.8800.597
GP6−0.4500.1843.8500.607
GP7−0.3570.5633.5700.659
GP8−0.5190.2853.7900.696
GP9−0.6800.7563.7500.723
Table 7. Comparison of region difference analysis results of each construct.
ConstructRegionMeanStandard DeviationFsigMultiple Comparisons
IEEastern region3.910.707.4340.0011–2 > 3
Central region3.850.70
Western region3.540.71
FSEastern region4.090.5218.8390.0001 > 2 > 3
Central region3.900.62
Western region3.610.63
MTEastern region3.790.647.5350.0011–2 > 3
Central region3.710.64
Western region3.450.67
IECEastern region3.760.715.8090.0031–2 > 3
Central region3.740.72
Western region3.430.77
GPEastern region3.910.638.6440.0001–2 > 3
Central region3.800.61
Western region3.550.66
Note: in Multiple Comparisons: 1 represents the eastern region, 2 represents the central region, 3 represents the western region; “>” indicates that when the confidence interval is 95%, the difference between the data on both sides of the symbol is statistically significant, the value on the left is significantly greater than the right; “-” indicates that when the confidence interval is 95%, the difference between the values on both sides of the symbol is not statistically significant.
Publisher’s Note: MDPI stays neutral with regard to jurisdictional claims in published maps and institutional affiliations.

