1. Introduction
The COVID-19 pandemic is unprecedented in our lifetime, impacting all economies. The Blue economy accounts for about 3.5 to 7 per cent of global GDP. Blue economic sectors, such as travel, tourism, maritime transport, fisheries, and seafood production, are heavily impacted [
1]. Due to the COVID-19 pandemic, the isolation, entry restrictions, and travel bans have greatly affected the sustainable development of the global cruise tourism industry and economy. The total economic contribution of the worldwide cruise tourism industry had decreased 91.1 billion (59%) from 154.5 billion in 2019 to 63.4 billion in 2020. Cruise—supported jobs were reduced by 590,000 (50.6%) from 1.166 million in 2019 to 576,000 in 2020 [
2].
The purpose of this study is to analyze the financial performance of the global cruise tourism industry. In addition, the study organizes and summarizes the severe impact of the COVID-19 pandemic on the financial performance of the worldwide cruise tourism industry development.
The study evaluates the financial performance of the world’s top three cruise companies that account for 74.6% of the global cruise market, explores the economic development trend of the worldwide cruise tourism industry.
Since 1960, the international cruise tourism industry has diversified its operations, no longer limited to European and American countries. In 1993, Star Cruises began to operate and sail in Asia. Its launch marked a watershed moment in the history of the global cruise tourism industry, which was now expanding to the Asia-Pacific region. In recent years, the global cruise tourism industry has shown a trend of vigorous development.
The cruise tourism industry has brought abundant economic output and employment opportunities to all countries and contributed to local prosperity and progress. It shows that the development prospects of the global cruise industry have been promising in recent years. International cruise passengers have increased by 7.333 million from 22.34 million in 2014 to 29.673 million in 2019. From 2014 to 2019, the growth rate of arrivals exceeded 32%, and the return rate of cruise passengers exceeded 80% [
3].
The COVID-19 pandemic began at the end of 2019. Many countries have announced bans on the entry of cruise ships, and the policy has seriously influenced the development of the international cruise tourism industry since March 2020. The isolation, entry restrictions, and travel bans have greatly affected the sustainable development of the global cruise tourism industry and the global economy for over two years [
4,
5].
The impact and challenges of the COVID-19 pandemic on the global cruise tourism industry’s sustainable development are profound. Since mid-March 2020, the temporary suspension of navigation has resulted in operating losses of US
$10.236 billion and US
$9.501 billion for Carnival Cruises, US
$5.8 billion and US
$5.26 billion for Royal Caribbean Cruises, and US
$4.012 billion and US
$4.507 billion for Norwegian Holiday Cruises in 2020 and 2021 [
6,
7,
8,
9,
10,
11].
2. Literature Review
The COVID-19 pandemic began at the end of 2019. There were 520,912,257 cases relating to the COVID-19 pandemic on 20 May 2022. Of confirmed cases, 6,272,408 people died [
12]. The authorized number of confirmed cases is still increasing. Many countries still have entry bans on citizens or tourists from COVID-19 pandemic areas.
Financial empirical research on cruise shipping remains surprisingly thin [
13]. Few earlier studies investigate, selectively, topics such as the translational partnership organization of the industry [
14]; cruise itinerary-schedule design in Northeast Asia [
15]; cruise impact on and implications for regional and local market development [
16]; cruise market globalization trends [
17]; cruise strategic capacity investments [
18]; the revenue management of cruise lines [
19]; cruise line supply chains and logistics [
20,
21]; regional cruise lines in Japan [
22]; the willingness to pay for cruise tickets in Asia [
23]; the markets of the cruise industry [
24]; and fundraising approaches to building new cruise ships [
25].
The cruise ship industry was one of the fastest growing subsectors of the tourism industry before the advent of COVID-19 [
26]. It is important to consider the consequences the crisis had on the cruise companies’ supply and value chains [
27]. This industry is capital intensive, has an enormous dependent supply chain, serves to improve many ports-of-call economies, hires an immense quantity of people worldwide, and provides leisure and entertainment. As a consequence of the cruise industry’s importance, there are collective initiatives, such as the Healthy Sail Panel, the WHO’s guidance, and the CDC framework [
28]. The industry exhibited high levels of customer loyalty and resilience to the COVID-19-induced downturn. The industry also adopted additional protocols to improve public health on board and protect the health and safety of customers, crews, and visited communities. The rebuilding process after the pandemic provides an opportunity for the cruise industry to reinvent itself. One way the industry can achieve this is by doubling down on its green credentials and its observance of environmental regulations, and not simply by cost reductions and increasing ship size [
29]. Most cruise ships have developed a brand-specific outbreak prevention plan based on CDC guidelines and industry best practice. It is also essential for transparent and clear messaging, as this will reduce risk perceptions and encourage consumer confidence [
30]. COVID-19 has disrupted what had been an unending tale of growth and success for the cruising sector. Whether this disruption is permanent or will eventually be considered a temporary blip in the industry’s performance will depend on the extent to which the sector can convince passengers and governments that cruising is safe—at least in terms of physical health. The industry will need to persuade consumers, particularly repeat cruisers, that the value of cruise ship travel to them outweighs the perceived risks of cruising [
31].
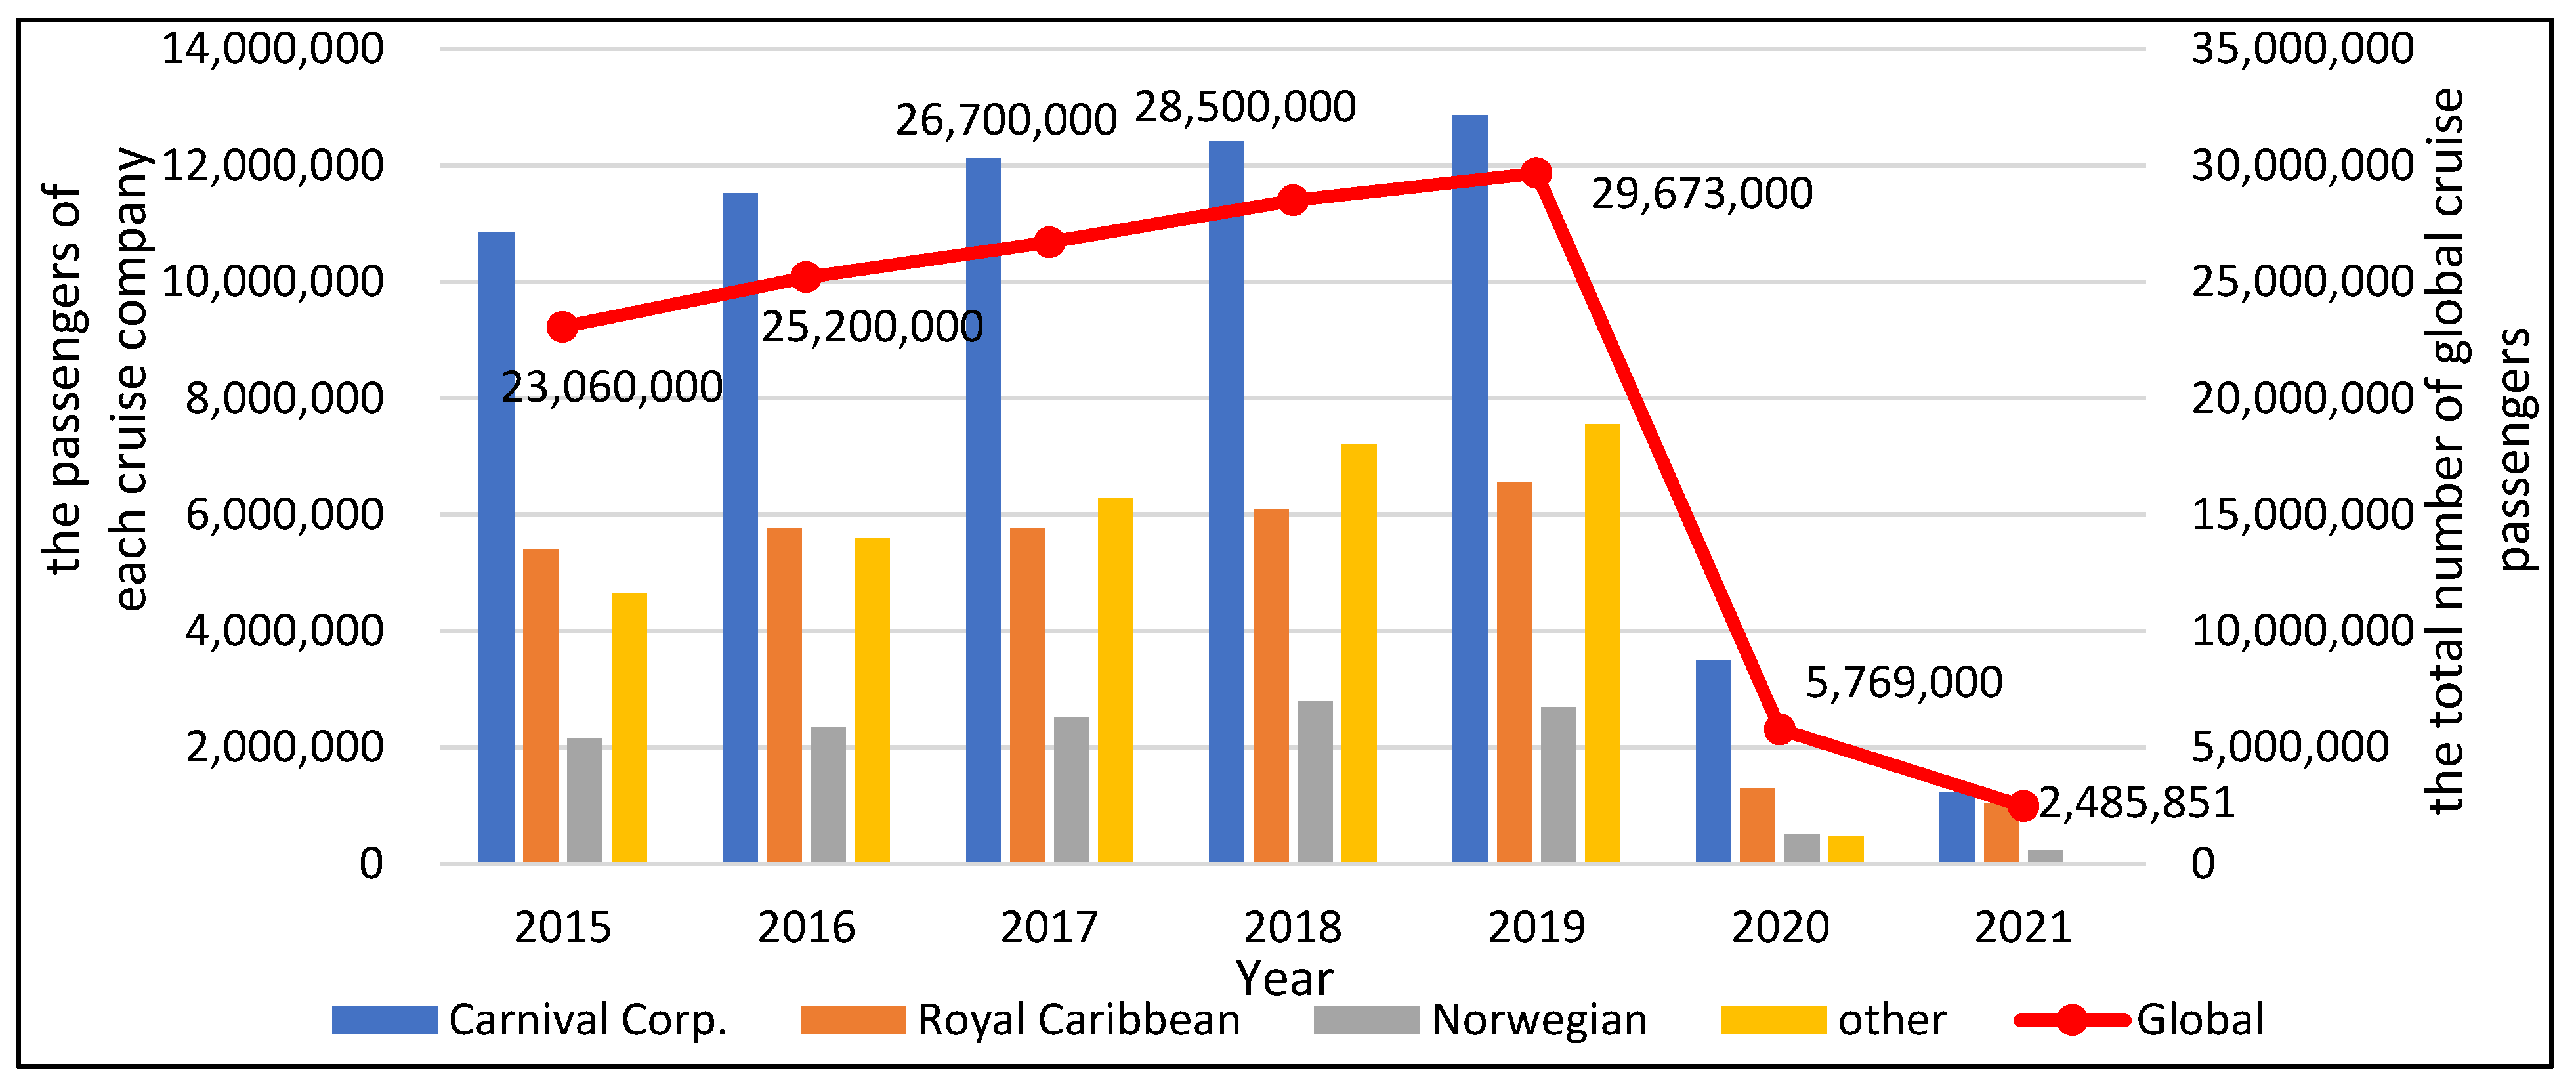
Global cruise passenger numbers are shown in
Figure 1 and
Table 1, which were 23.06 million in 2015, and had increased by 6.613 million (28.7%) to 29.673 million in 2019. Due to the impact of the COVID-19 pandemic on cruise tourism, the global cruise passenger numbers decreased by 23.904 million (−80.6%) to 5.769 million in 2020 [
2,
3].
Carnival Cruises passenger numbers had increased by 2.026 million (18.7%) from 10.84 million in 2015 to 12.866 million in 2019. The passenger numbers global market share of Carnival Cruises was 47% in 2015 and fell 3.6% to 43.4% in 2019 [
32,
33,
34,
35,
36]. Royal Caribbean Cruises passenger numbers had increased by 1.15 million (21.3%) from 5.4 million in 2015 to 6.55 million in 2019. Based on these passenger numbers, the global market share of Royal Caribbean Cruises was 23.4% in 2015 and fell 1.3% to 22.1% in 2019 [
37,
38,
39,
40,
41]. They had decreased to 1.295 million in 2020 and 1.030 million in 2021. The passenger numbers of Royal Caribbean Cruises for 2021 were less than a sixth of 2019′s numbers [
8,
9]. Norwegian Holiday Cruises passenger numbers had increased by 0.53 million (24.5%) from 2.16 million in 2015 to 2.69 million in 2019. Based on these passenger numbers, the global market share of Norwegian Holiday Cruises was 9.4% in 2015 and fell 0.3% to 9.1% in 2019 [
42,
43,
44,
45,
46]. They had decreased to 0.500 million in 2020 and 0.232 million in 2021. The passenger numbers of Norwegian Holiday Cruises for 2021 were less than a tenth of 2019′s numbers [
10,
11].
From 2015 to 2019, the global cruise tourism industry has thrived, and the number of international cruise passengers has grown steadily year by year. It shows that cruise tourism has become one of the world’s most important marine leisure activities in recent years. The number of passengers of the world’s top three cruise companies has also shown a growing trend. Still, their market share has shown a downward trend. Other cruise companies are gradually rising, competing for a secure place within the cruise tourism market and providing cruise passengers with more diversified choices.
The impact and challenges of the COVID-19 pandemic on the global cruise tourism industry development are profound. Since mid-March 2020, the temporary suspension of navigation has resulted in a decrease in passenger numbers. International Cruises passenger numbers decreased by 23.904 million (80.56%) from 29.673 million in 2019 to 5.769 million in 2020.
The top three cruise companies, according to the fleet size in 2019, are Carnival Corporation & plc with nine operating brands, 104 cruise ships (85 cruise ships in 2020), and 249,000 berths (216,630 berths in 2020); Royal Caribbean Cruises with 6 operating brands, 61 cruise ships, and 141,570 berths (137,930 berths in 2020); and Norwegian Holiday Cruises with 3 operating brands, 28 cruise ships, and 59,150 berths. Carnival Corporation & plc sold 19 ships from its fleet amid the COVID-19 pandemic in 2020. In total, the sale of 19 ships marks a decrease of 13% in the current capacity. The market share of the top three cruise companies, as shown in
Table 2, is 74.6%.
After the outbreak of COVID-19 from February to mid-March 2020, international cruise ships continued to operate in various oceans worldwide, resulting in many cases of global cruise infections. As a result, the governments of many countries have held cautious attitudes about the resumption of cruise ships at the ports of call. The more well-known conditions are shown in
Table 3, including the Diamond Princess Cruise in Yokohama, the Ruby Princess Cruise in Sydney, the Grand Princess Cruise in San Francisco, the Coral Princess Cruise in Miami, the Greg Mortimer Cruise in Uruguay, and the Costa Atlantic Cruise in Japan.
3. Materials and Methods
3.1. Research Purpose
The Blue economy accounts for about 3.5 to 7 per cent of global GDP. The safety measures deployed in response to the COVID-19 pandemic, such as mandatory isolation, entry restrictions, and travel bans, have greatly affected the sustainable development of the global cruise tourism industry and economy.
The purpose of this study is to analyze the financial performance of the global cruise tourism industry. In addition, the study organizes and summarizes the severe impact of the COVID-19 pandemic on the financial performance of the worldwide cruise tourism industry development.
To understand the severe impact of the COVID-19 pandemic on the development of the global cruise industry, a financial analysis of the cruise industry was conducted. Based on the research findings, we made some suggestions to reduce the impact of future epidemics on the operation of the cruise industry.
3.2. Research Questions
The research questions were formulated in order to study the COVID-19 pandemic, the complete suspension of global cruise ships from March 2020 to July 2021, and the degree of operational and financial impacts on the worldwide cruise industry during this suspension period. After the economic situation deteriorated, the consequential effect on the sustainable development of the cruise industry became a subject demanding scrutiny.
3.3. Research Hypothesis
This research aims to understand that the COVID-19 pandemic has led to the suspension of cruise ships around the world. The suspension has led to a sharp drop in the number of cruise passengers and a reduction in the number of cruise passengers, resulting in the deterioration of the operating finances of cruise companies, which affects the sustainable development of the global cruise industry. The following research hypotheses are put forward:
Research hypothesis: The reduction in the number of cruise passengers caused by the COVID-19 epidemic will affect various financial indicators such as the financial structure, solvency, operating capacity, and profitability of cruise companies, which will affect the sustainable operation of cruise companies and the sustainable development of the cruise industry.
3.4. Research Process
The study collected the annual reports and financial data of the Cruise Lines International Association and of the top three cruise companies in the world, which include Carnival Corporation & plc, Royal Caribbean International, and Norwegian Cruise Line Holdings Ltd. The study also collected statistics and analysis on trends in cruise passenger numbers, market share, operating capacity, and profitability.
By analyzing the financial data of the top three cruise companies in the world in the five years before the occurrence of COVID-19 in 2019, we can understand the development trend of the cruise industry in recent years. At the same time, by analyzing the economic changes of the cruise companies from 2020 to 2021, we can understand the epidemic situation of severe COVID-19 impact on the sustainable development of the cruise industry.
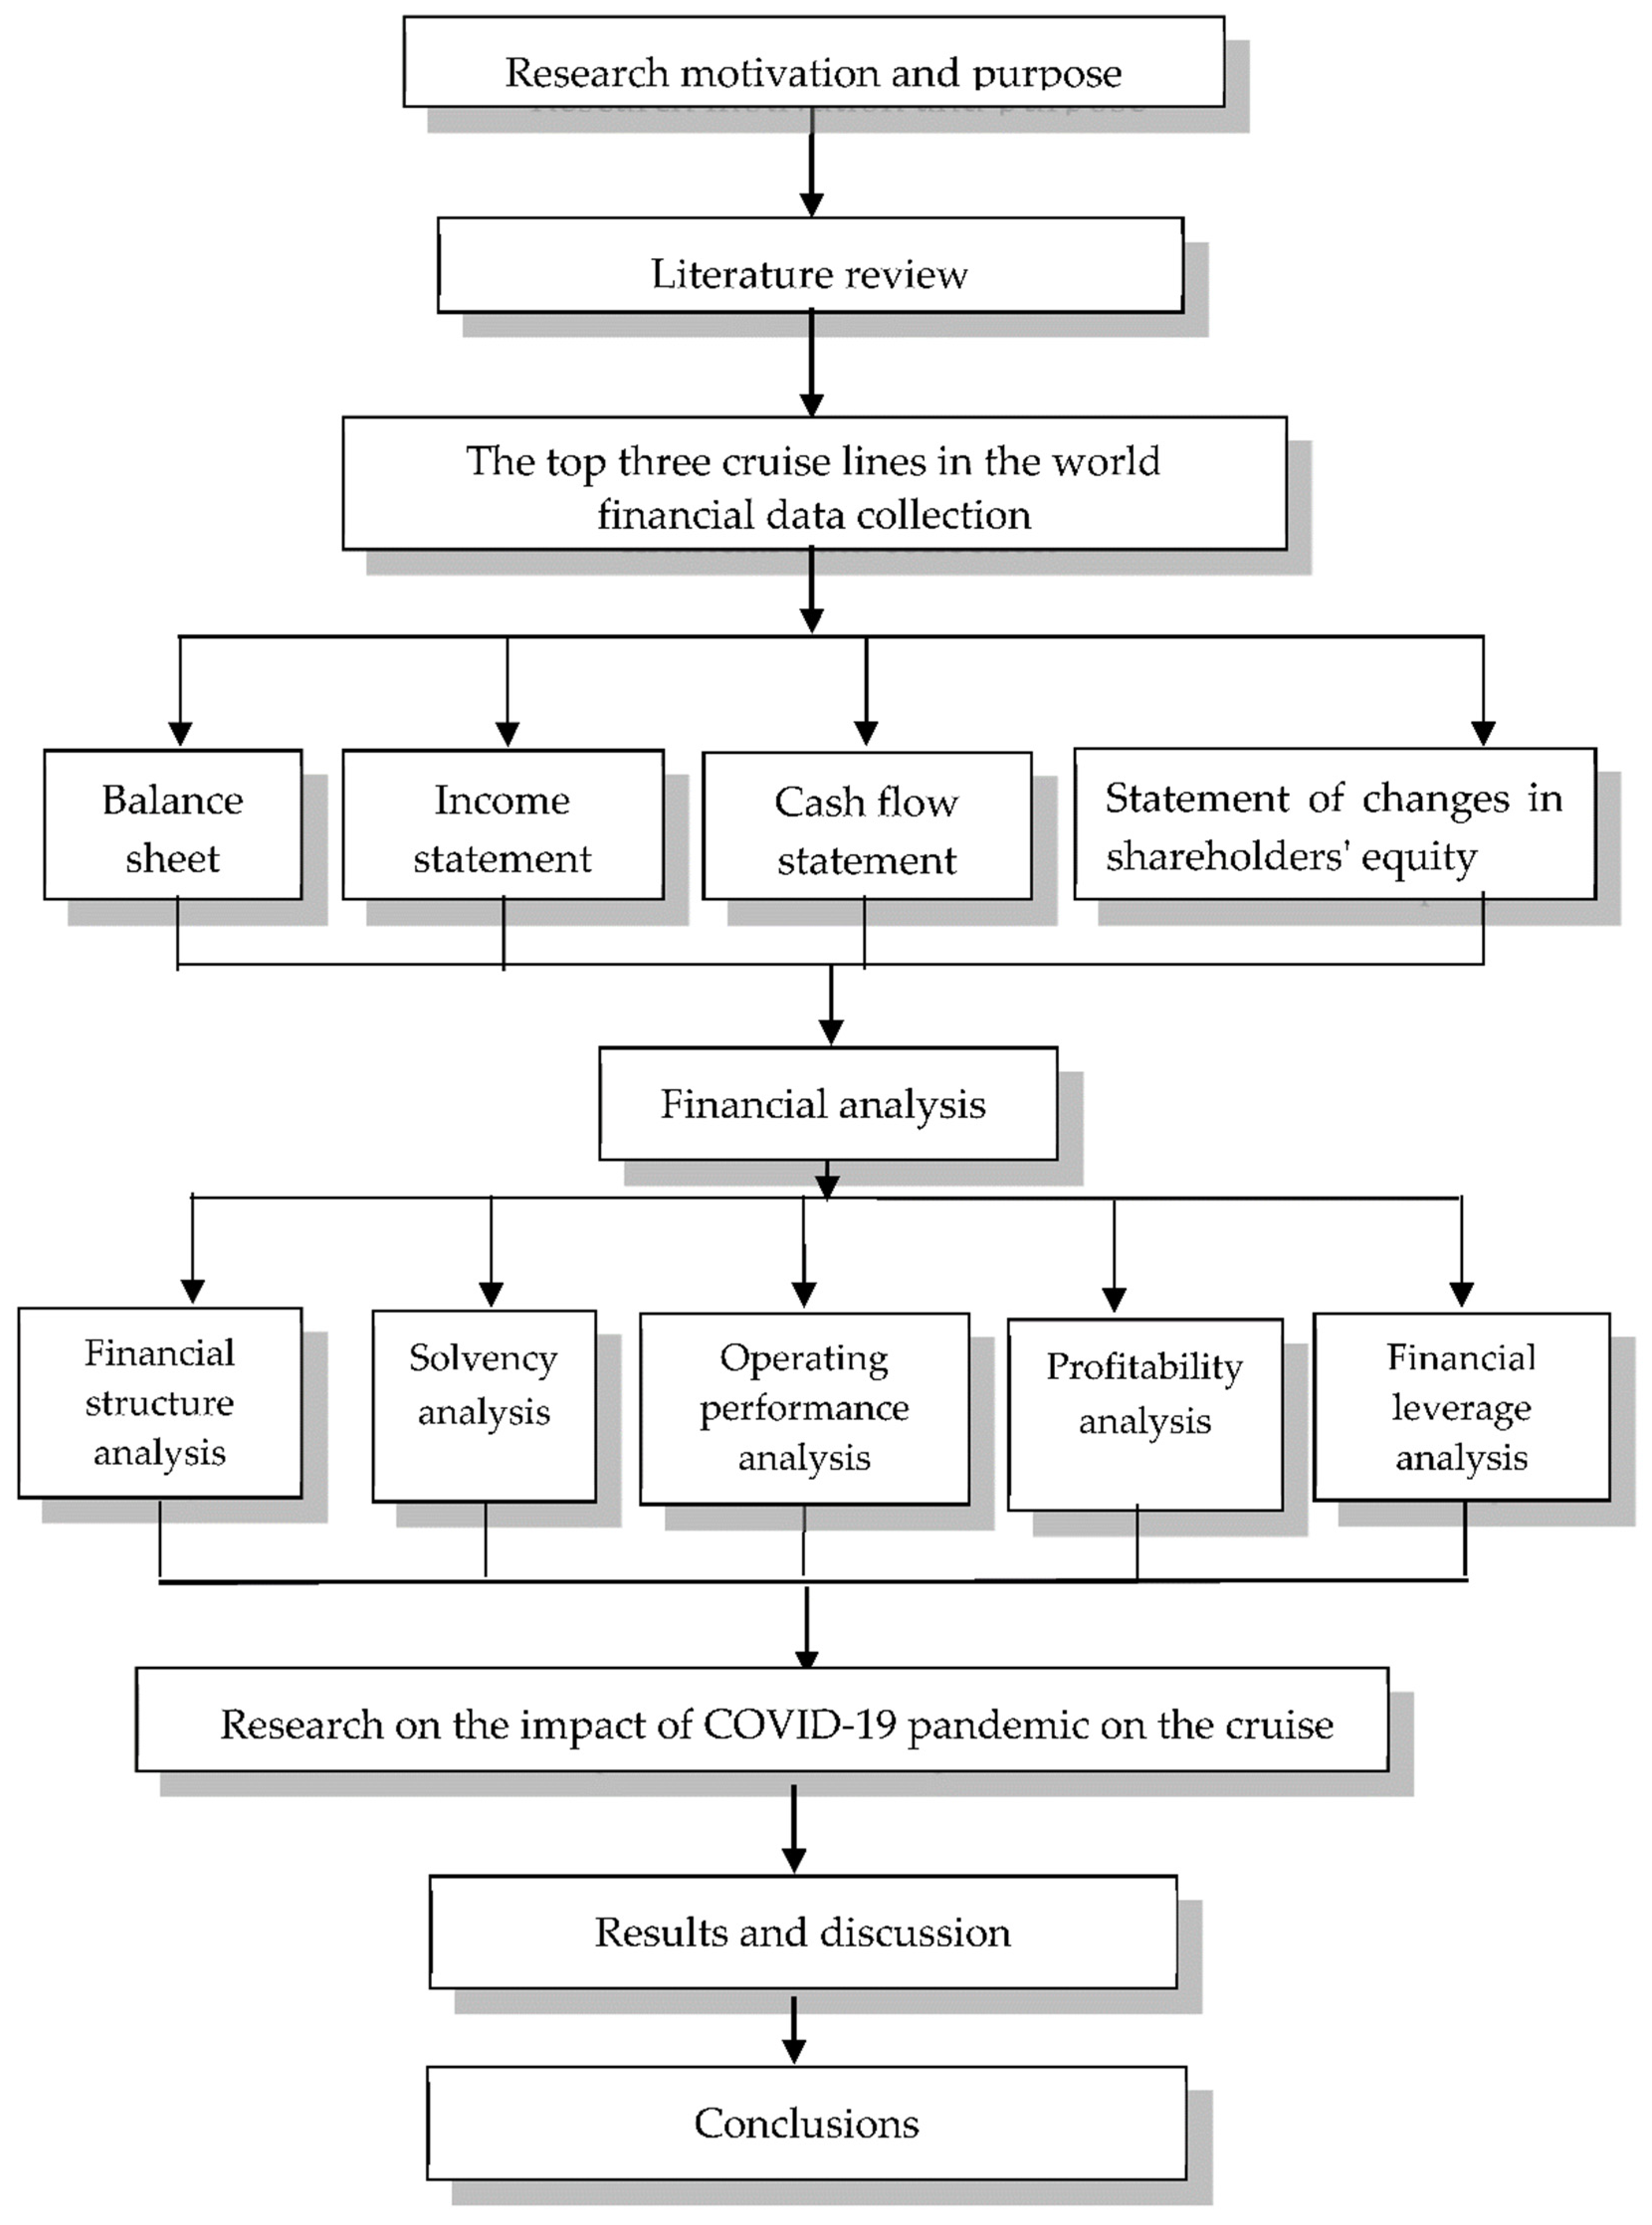
This research conducted a financial analysis of the operational data of the top three cruise companies in the world from 2015 to 2021, including economic structure, solvency, operating ability, profitability, and financial leverage. The analysis and research process are shown in
Figure 2, and the calculation formulas of each item are shown in
Table 4.
3.5. Research Methods
3.5.1. Financial Management Analysis
The research evaluated the financial performance, including financial structure analysis, solvency analysis, operating performance analysis, profitability analysis, and financial leverage analysis, and it compared the upward trend and downward trend of economic indicators of the world’s top three cruise companies in order to promote the sustainable development of cruise tourism.
The calculation formulas of financial management analysis are shown as follows in
Table 4.
3.5.2. Regression Analysis
Correlation analysis is used to compare the direction and strength of the relationship between the factors and variables. Correlation analysis is used to analyze the degree of correlation between two or more variables and calculate the correlation coefficient between two or more variables [
47].
3.5.3. Regression Analysis
Regression Analysis is used to carry out the quantitative relationship between the independent variables and the dependent variables to understand the number or level of the dependent variable response when the independent variables are at a certain level or quantity. In statistical modeling, regression analysis is a set of statistical processes for estimating the relationships between a dependent variable and more independent variables.
The regression model is as follow [
48]:
is the dependent variable, α is intercept, , , are the regression coefficients of the independent variables, , , are the independent variables.
The following tests were performed to test the explanatory power and significance of the model.
F-test: to test whether
,
,…,
has a significant effect on Y if there is a meaningful linear relationship between
,
,…,
and Y, then this model is applied to predict effectively [
49].
Goodness of Fix:
The added independent variables may not effectively explain the dependent variable, so we use the modified coefficient of determination (Adj-r2) as the criterion for judging the appropriateness.
T-test: to test whether individual independent variables are significant, a t-test can be used to determine whether there is a meaningful linear relationship between the dependent variable Y and each independent variable.
3.5.4. Z-Score Model Analysis
In 1968, Altman selected sample companies with similar conditions according to industry characteristics and operating size and set a total of 66 companies, of which 33 companies had financial crises. Altman amended the research method and found the Z-Score Model in 1977 [
50]. This model analysis can correctly distinguish 31 of the 33 bankrupt companies with higher financial management risks in the year before the company’s economic crisis.
Z-Score Model calculation formula is as follow:
X1: working capital/total assets, : retained earnings/total assets, : earnings before interest and taxes/ total assets, : market value equity/book value of total liabilities, : sales/total assets Z: overall index.
The Z value 2.675 is used as the demarcation point. Those higher than 2.675 indicate that the financial risk of the companies is low, and the probability of bankruptcy is not high. If the Z value is between 1.8–2.675, then it means that the financial status of the companies is unclear. If the Z value is below 1.8, then it means that the financial risk of the companies is much higher.
4. Results and Discussion
4.1. Correlation Analysis of World Top Three Cruise Companies
We used correlation analysis to compare the direction and strength of the relationship between the number of cruise passengers and the index variables of financial structure, solvency, operating ability, and profitability of cruise companies.
The scientific empirical results are shown in the
Table 5. The number of cruise passengers has a significant positive correlation with the operating income, net operating profit, rate earned on total assets, rate earned on total equity, and earnings per share of cruise companies. The test reaches a significant level with the two-tailed test; the number of cruise passengers has a significant negative correlation with the debt-to-assets ratio, working capital, and leverage ratio, and has also reached a significant level with a two-tailed test.
According to scientific empirical research results, the increase in the number of cruise passengers will increase the operating income, net operating profit, rate earned on total assets, rate earned on total equity, and earnings per share of cruise companies; at the same time, it will reduce the debt-to-assets ratio, working capital, and leverage ratio.
Conversely, suppose the number of cruise passengers decreases. In that case, it will reduce the operating income, net operating profit, rate earned on total assets, rate earned on total equity, and earnings per share of cruise companies, and it will increase the debt-to-assets ratio, working capital, and leverage ratio.
From the above scientific empirical results, it is understood that the COVID-19 epidemic has caused the suspension of cruise ships around the world. The suspension has led to a sharp drop in the number of cruise passengers, resulting in a significant decrease in operating income and profits of cruise companies, and the debt-to-assets ratio and leverage ratio have increased significantly. The excessive debt ratio will affect the sustainable operation of cruise companies and the sustainable development of the cruise industry.
4.2. Regression Analysis of World Top Three Cruise Companies
4.2.1. Return on Assets Regression Analysis
The regression model of return on assets is shown in
Table 6. The main selected variables are 1. working capital and 2. total liabilities.
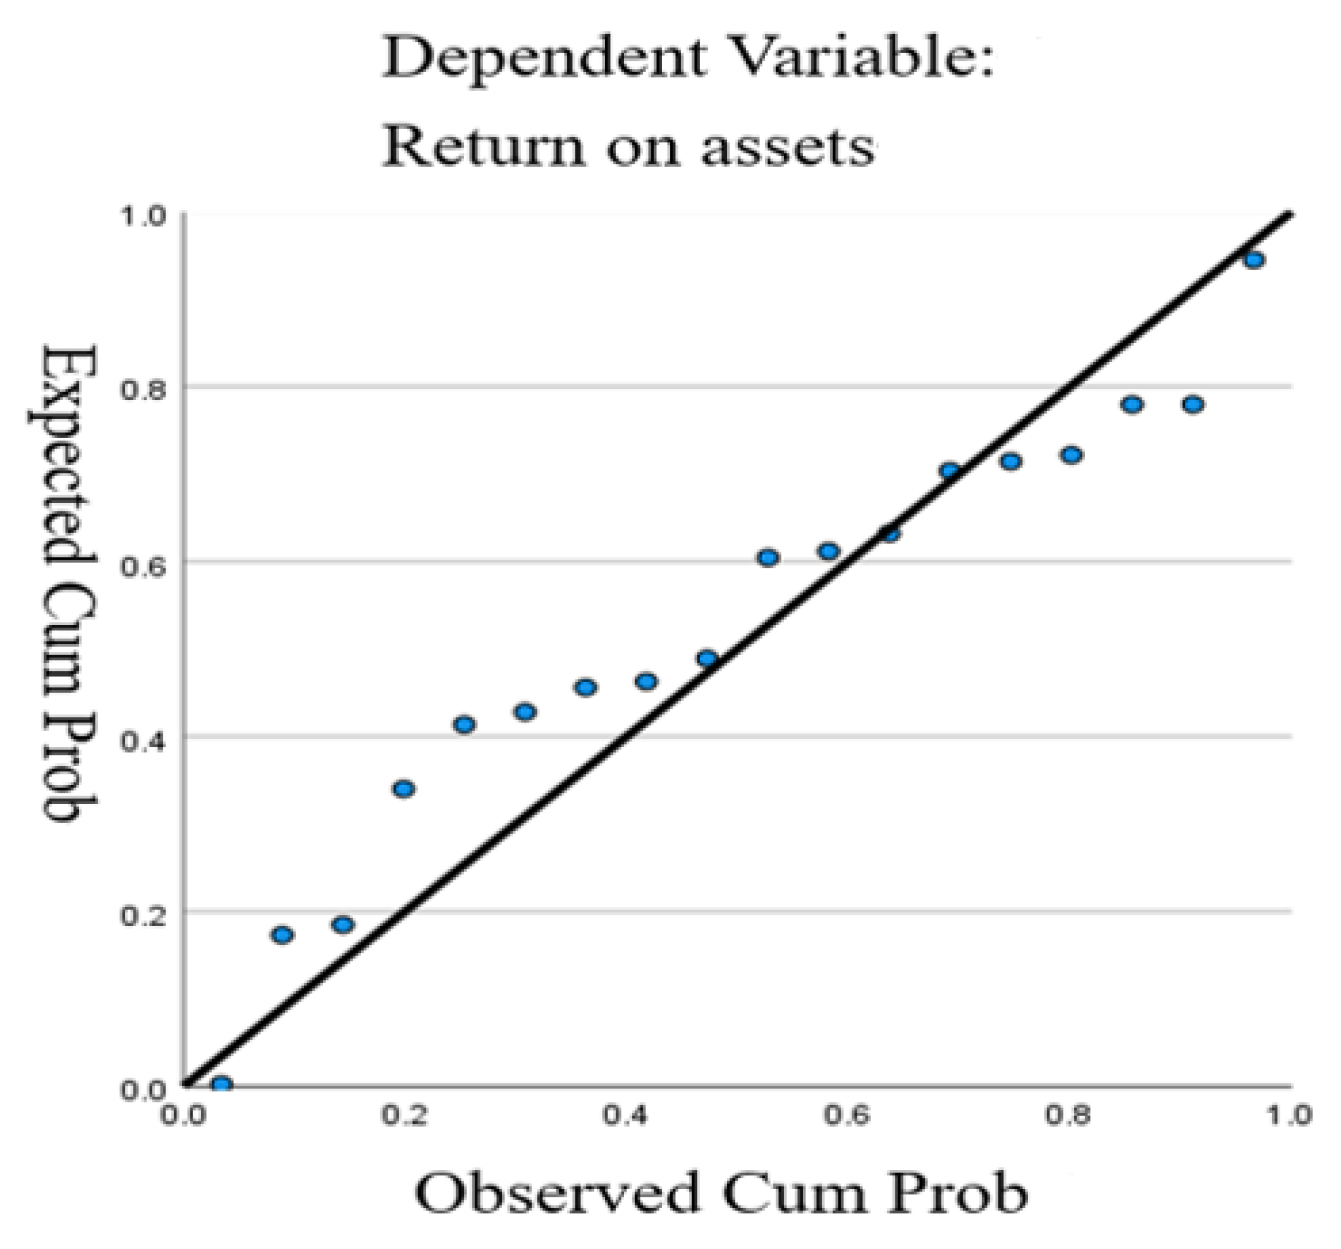
The F-value of this model is 48.89, reaching a significant level, and the coefficient of determination (Adj r2) is 0.849, which means that the regression model has an explanation rate of 84% or more for the return on assets of the cruise industry.
The regression standardized residual P-P diagram of the cruise industry return-on-assets regression model is shown in
Figure 3.
As shown in
Table 6, the independent variables “working capital” and “total liabilities” both have a significant linear relationship with the dependent variable “return on assets.”
The regression equation is Return on Assets = 0.042 − 0.00000002735 × Working Capital − 0.00000000802 × Total Liabilities.
From the perspective of the standardized regression coefficient (β-value), an increase in “working capital” by one standard unit reduces the “return on assets of the cruise industry” by 0.741 standard units; an increase in “total liabilities” by one standard unit reduces the “return on assets of the cruise industry” by 0.479 standard units.
4.2.2. Return on Equity Regression Analysis
The regression model of return on equity is shown in
Table 7. The main selected variables are 1. debt ratio, 2. long-term funds to fixed assets ratio, and 3. net operating profit.
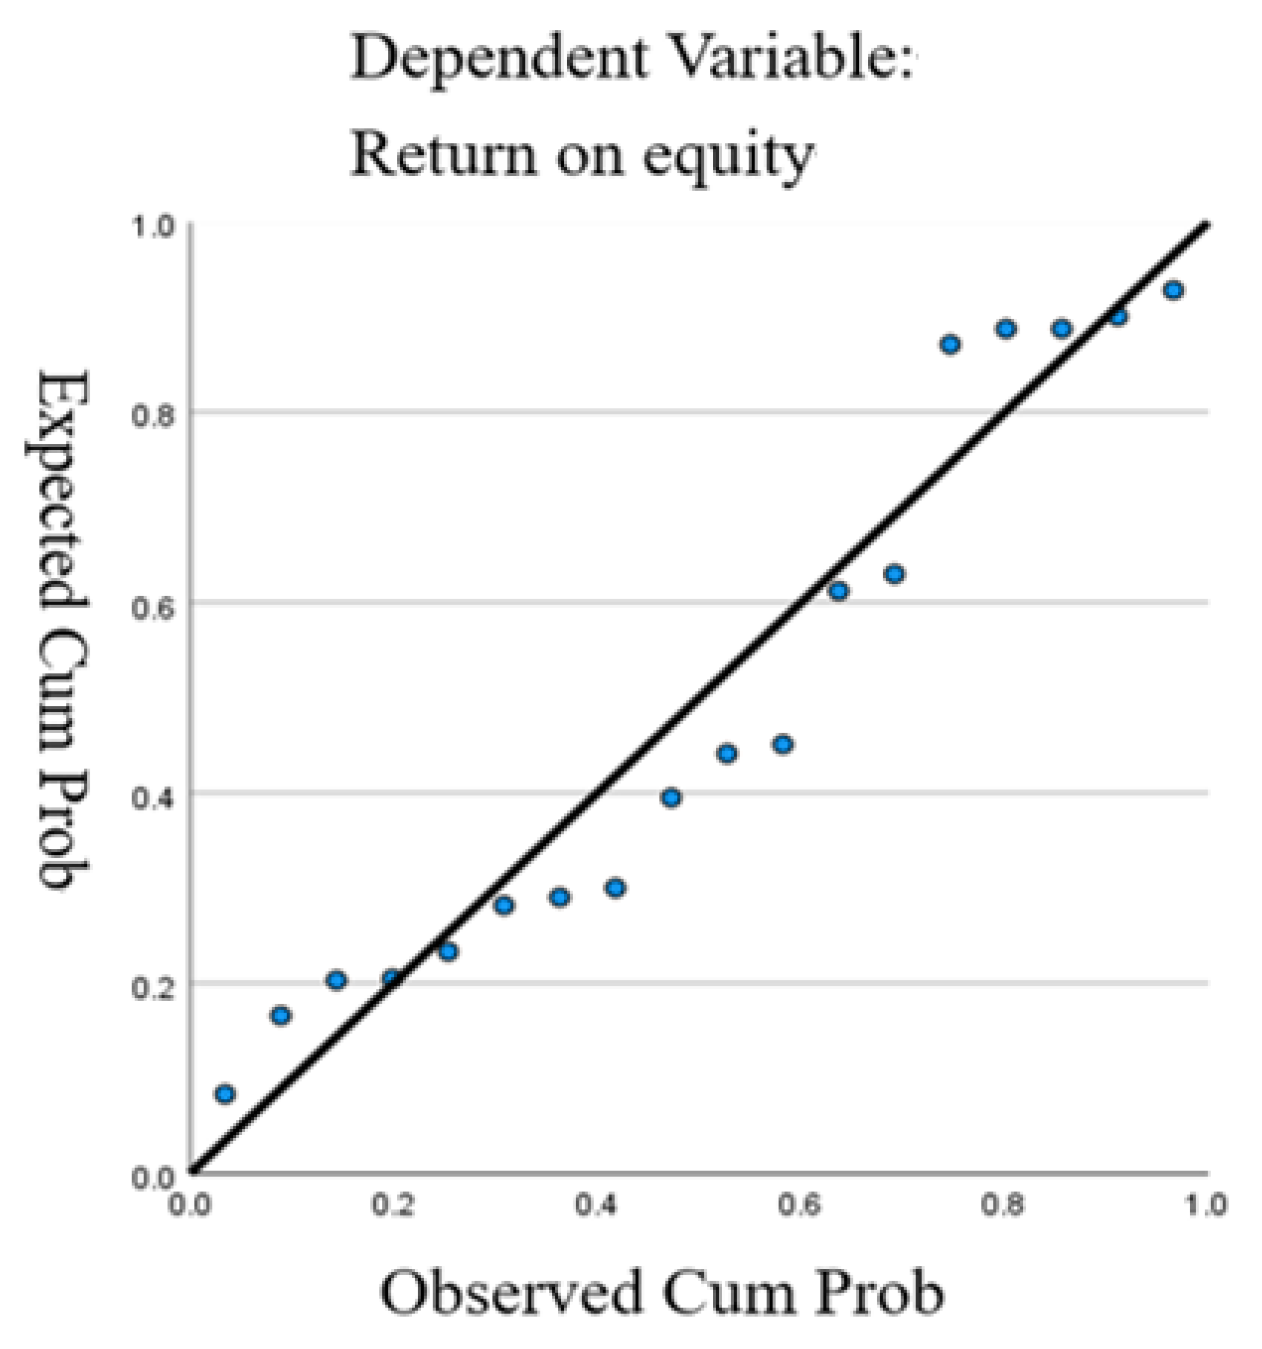
The F-value of this model is 803.313, reaching a significant level, and the coefficient of determination (Adj r2) is 0.993, which means that the regression model has an explanation rate of 99% or more for the return on equity of the cruise industry.
The regression standardized residual P-P diagram of the cruise industry return-on-equity regression model is shown in
Figure 4.
The regression equation is shown in
Table 7: Return on equity = 0.066 − 0.391 ∗ Debt Ratio + 0.088 ∗ Long-term funds to fixed assets ratio + 0.00000005275 ∗ net operating profit.
From the perspective of the standardized regression coefficient (β-value), an increase in “debt ratio” by one standard unit reduces the “return on equity of the cruise industry” by 0.585 standard units; an increase in “Long-term funds to fixed assets ratio” by one standard unit increases the “return on equity of the cruise industry” by 0.161 standard units; an increase in “net operating profit” by one standard unit increases the “return on equity of the cruise industry” by 0.655 standard units.
4.3. Financial Performance Evaluation of World Top Three Cruise Companies
4.3.1. Financial Structure Analysis of the World Top Three Cruise Companies
Analysis of Operating Income of the Top Three Cruise Lines in the World
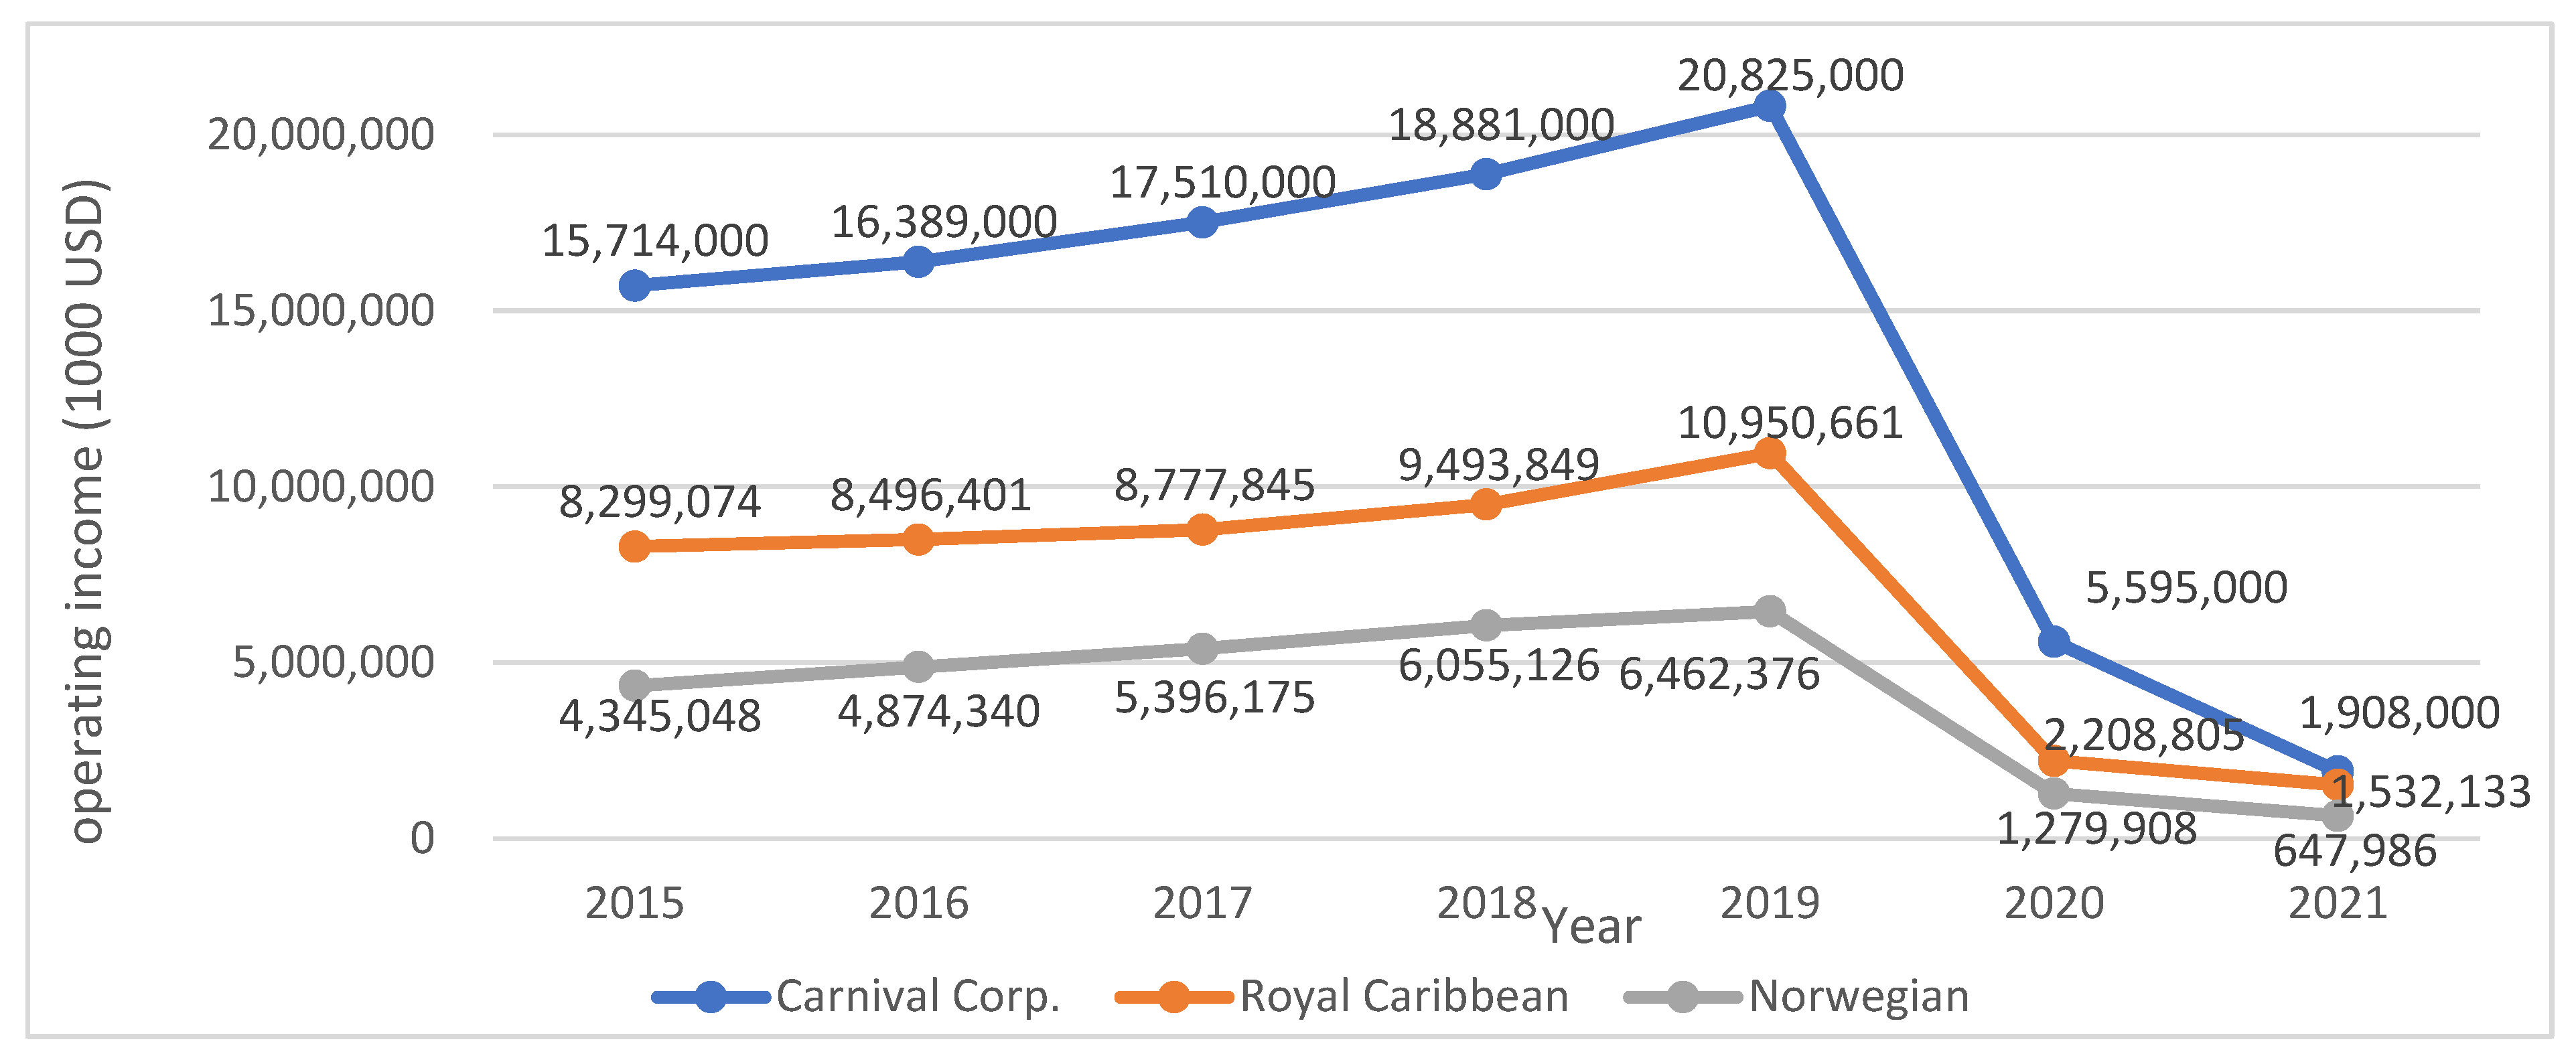
The operating income of the top three cruise companies in the world from 2015 to 2021 is shown in
Figure 5. The operating incomes of the top three cruise companies in the world from 2015 to 2019 were US
$15.714 billion to US
$20.825 billion, US
$8.299 billion to US
$10.951 billion, and US
$4.345 billion to US
$6.462 billion, with a growth rate of 32.53%, 31.95%, and 48.73%. The operating incomes of the top three cruise companies in the world showed a steady increase year by year before the outbreak of the global COVID-19 pandemic at the end of 2019.
The COVID-19 pandemic began at the end of 2019; it led to such safety measures as the isolation, entry restrictions, and travel ban of cruise ships worldwide from March 2020 until July 2021. The suspension of cruise ships led to a decrease in the operating incomes of cruise companies.
The number of cruise passengers of Carnival Corporation in 2020 and 2021 is shown in
Table 1, which were 3.499 million and 1.223 million, respectively, which were only 27.2% and 9.5% of the 12.866 million in 2019. The cruise passengers of Royal Caribbean in 2020 and 2021 were 1.295 million and 1.030 million, respectively, which were only 19.8% and 15.7% of the 6.554 million in 2019. The number of cruise passengers on Norwegian holidays in 2020 and 2021 were 0.50 million and 0.232 million, respectively, which were only 18.5% and 8.6% of the 2.696 million in 2019. The rate of reduction in the number of passengers of various cruise companies was also fully reflected in the operating income of the cruise companies each year.
The COVID-19 pandemic has wholly changed the revenue and economic growth of the top three cruise companies globally. The operating income of Carnival Corporation was US$5.595 billion and US$1.908 billion in 2020 and 2021, respectively, which was only 26.9% and 9% of the operating income in 2019. The operating income decline rate from 2019 to 2021 was 90.8%. The operating income of Royal Caribbean was US$2.209 billion and US$1.532 billion in 2020 and 2021, respectively, which was only 20.2% and 14% of the operating income in 2019. The operating income decline rate from 2019 to 2021 was 86%. The operating income for Norwegian holidays was US$1.280 billion and US$648 million in 2020 and 2021, respectively, which was only 19.8% and 10% of the operating income in 2019. The operating income decline rate from 2019 to 2021 was 90%.
The COVID-19 pandemic entirely changed cruise companies’ previously high operating income situations.
Analysis of Total Liabilities of the Top Three Cruise Lines in the World
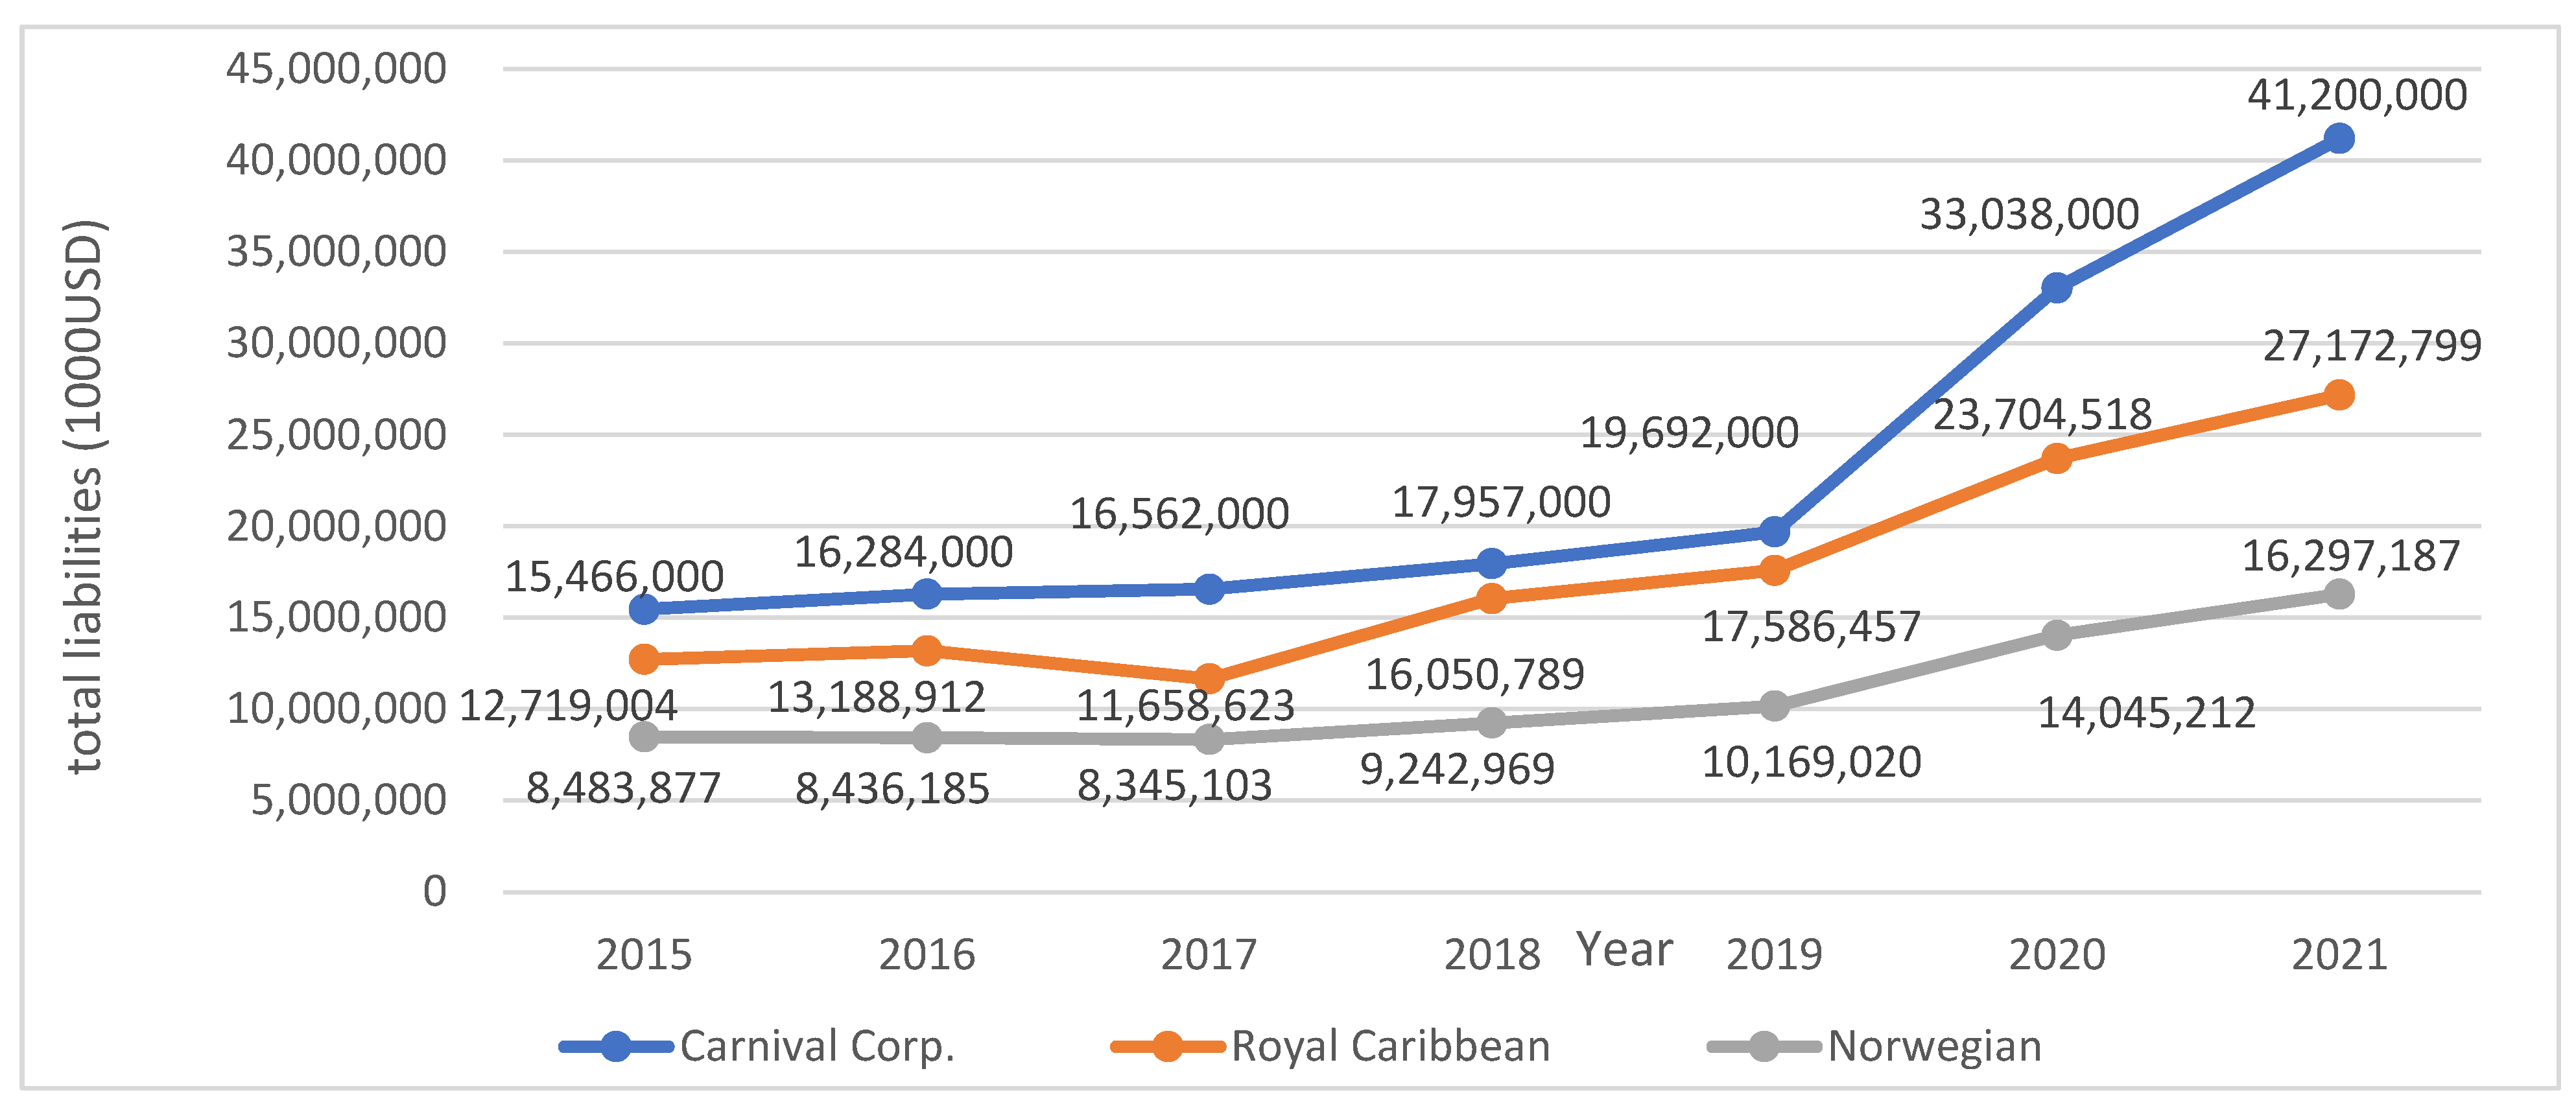
The total liabilities of the top three cruise companies in the world from 2015 to 2021 are shown in
Figure 6. The total liabilities of the top three cruise companies in the world from 2015 to 2019 were US
$15.466 billion to US
$19.692 billion, US
$11.659 billion to US
$17.586 billion, and US
$8.345 billion to US
$10.169 billion, with a growth rate of 27.3%, 38.3%, and 19.9%. The total liabilities of the top three cruise companies in the world showed a gradual increase year by year due to business growth and expansion of business scale before the outbreak of the global COVID-19 pandemic at the end of 2019.
The COVID-19 pandemic has led to the isolation, entry restrictions, and travel bans of cruise ships worldwide from March 2020 until July 2021. The suspension of cruise ships led to an increase in the total liabilities of cruise companies. During the suspension period, the cruise companies borrowed a lot of debt to survive the operational crisis, which led to a surge in debt in a short period.
The total liabilities of the top three cruise companies in the world were US$33.038 billion, US$23.705 billion, and US$14.045 billion, respectively, in 2020; and US$41.2 billion, US$27.173 billion, US$16.297 billion, respectively, in 2021, with a respective growth rate of 109.2%, 54.5%, and 60.3% from 2019 to 2021. To overcome the financial crisis of the global suspension of sailings, the top three cruise companies in the world have borrowed a lot of debt and issued corporate bonds to operate, which will lead to an increased financial burden on the companies’ interest expenses and loan repayment when they resume normal operations in the future.
Analysis of Debt-to-Assets Ratio of the Top Three Cruise Lines in the World
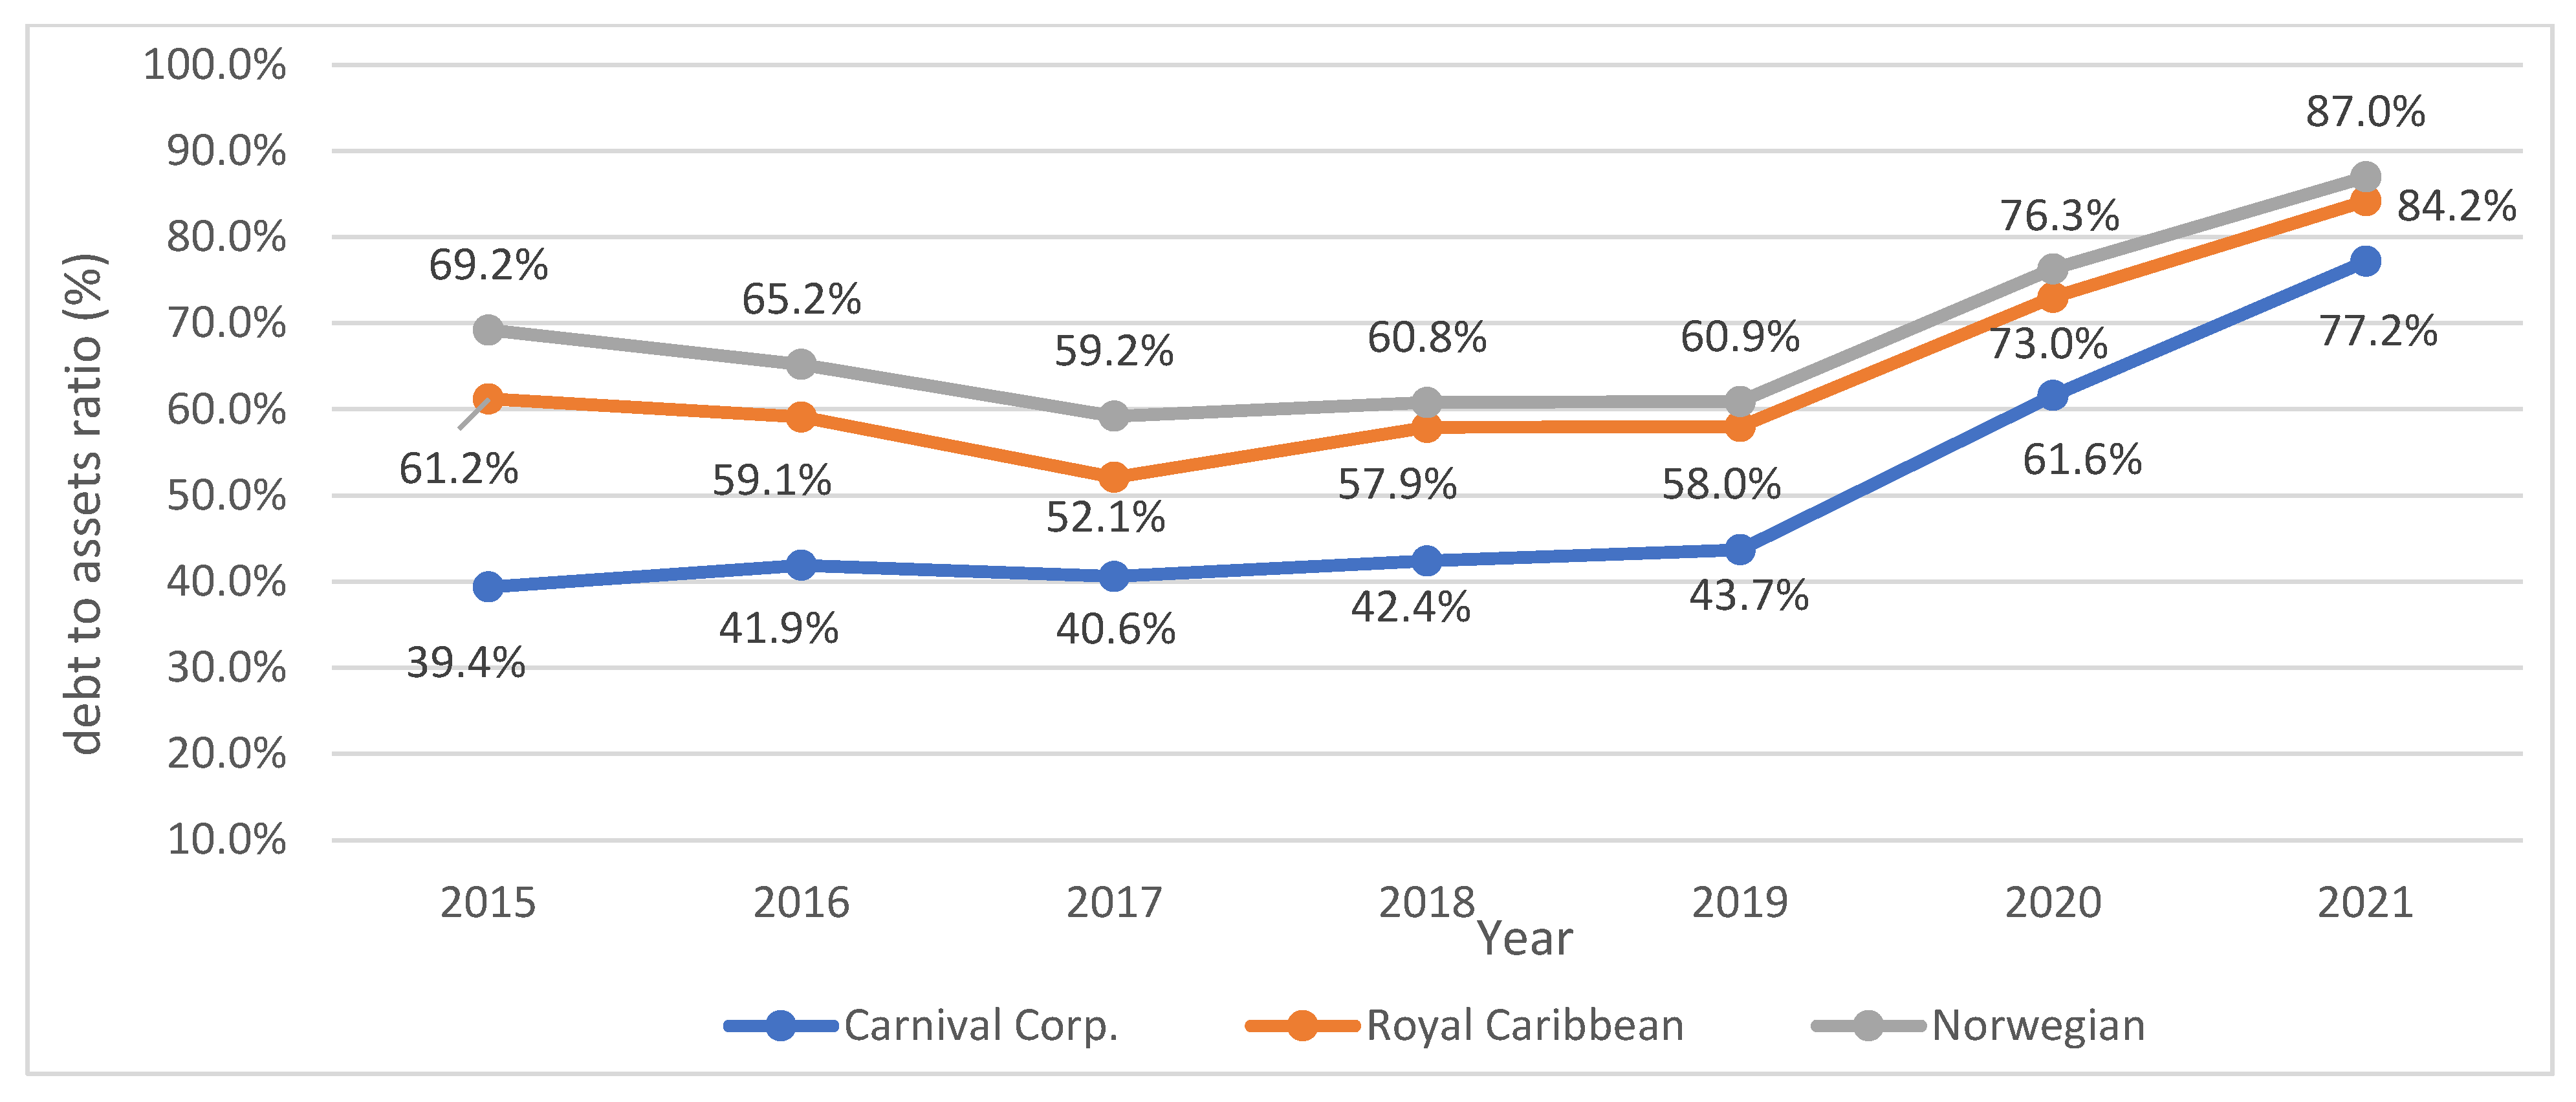
The debt-to-assets ratio means that the higher the ratio is, the less the company has of its own funds, which weakens its ability to protect creditors as well as raises the overall financial risk.
The debt-to-assets ratio of the top three cruise companies in the world from 2015 to 2021 is shown in
Figure 7. The debt to assets ratio of the top three cruise companies from 2015 to 2019 was between 39.4–43.7%, 52.1–61.2%, and 59.2–69.2%, respectively. Carnival Corporation had the lowest debt-to-assets ratio among the three cruise companies, followed by Royal Caribbean and Norwegian Holidays. The percentage of Carnival Corporation showed a slight upward trend, and Royal Caribbean and Norwegian Vacations showed a downward trend from 2015 to 2019.
The debt-to-assets ratio of the top three cruise companies in the world were 61.6%, 73%, and 76.3%, respectively, in 2020; and 77.2%, 84.2%, and 87%, respectively, in 2021, with a 33.5%, 26.2%, and 26.1% increase from 2019 to 2021, respectively. It showed that the top three cruise companies borrowed a lot of debt and issued corporate bonds to overcome the financial crisis of the global suspension of cruises.
Analysis of Working Capital of the Top Three Cruise Lines in the World
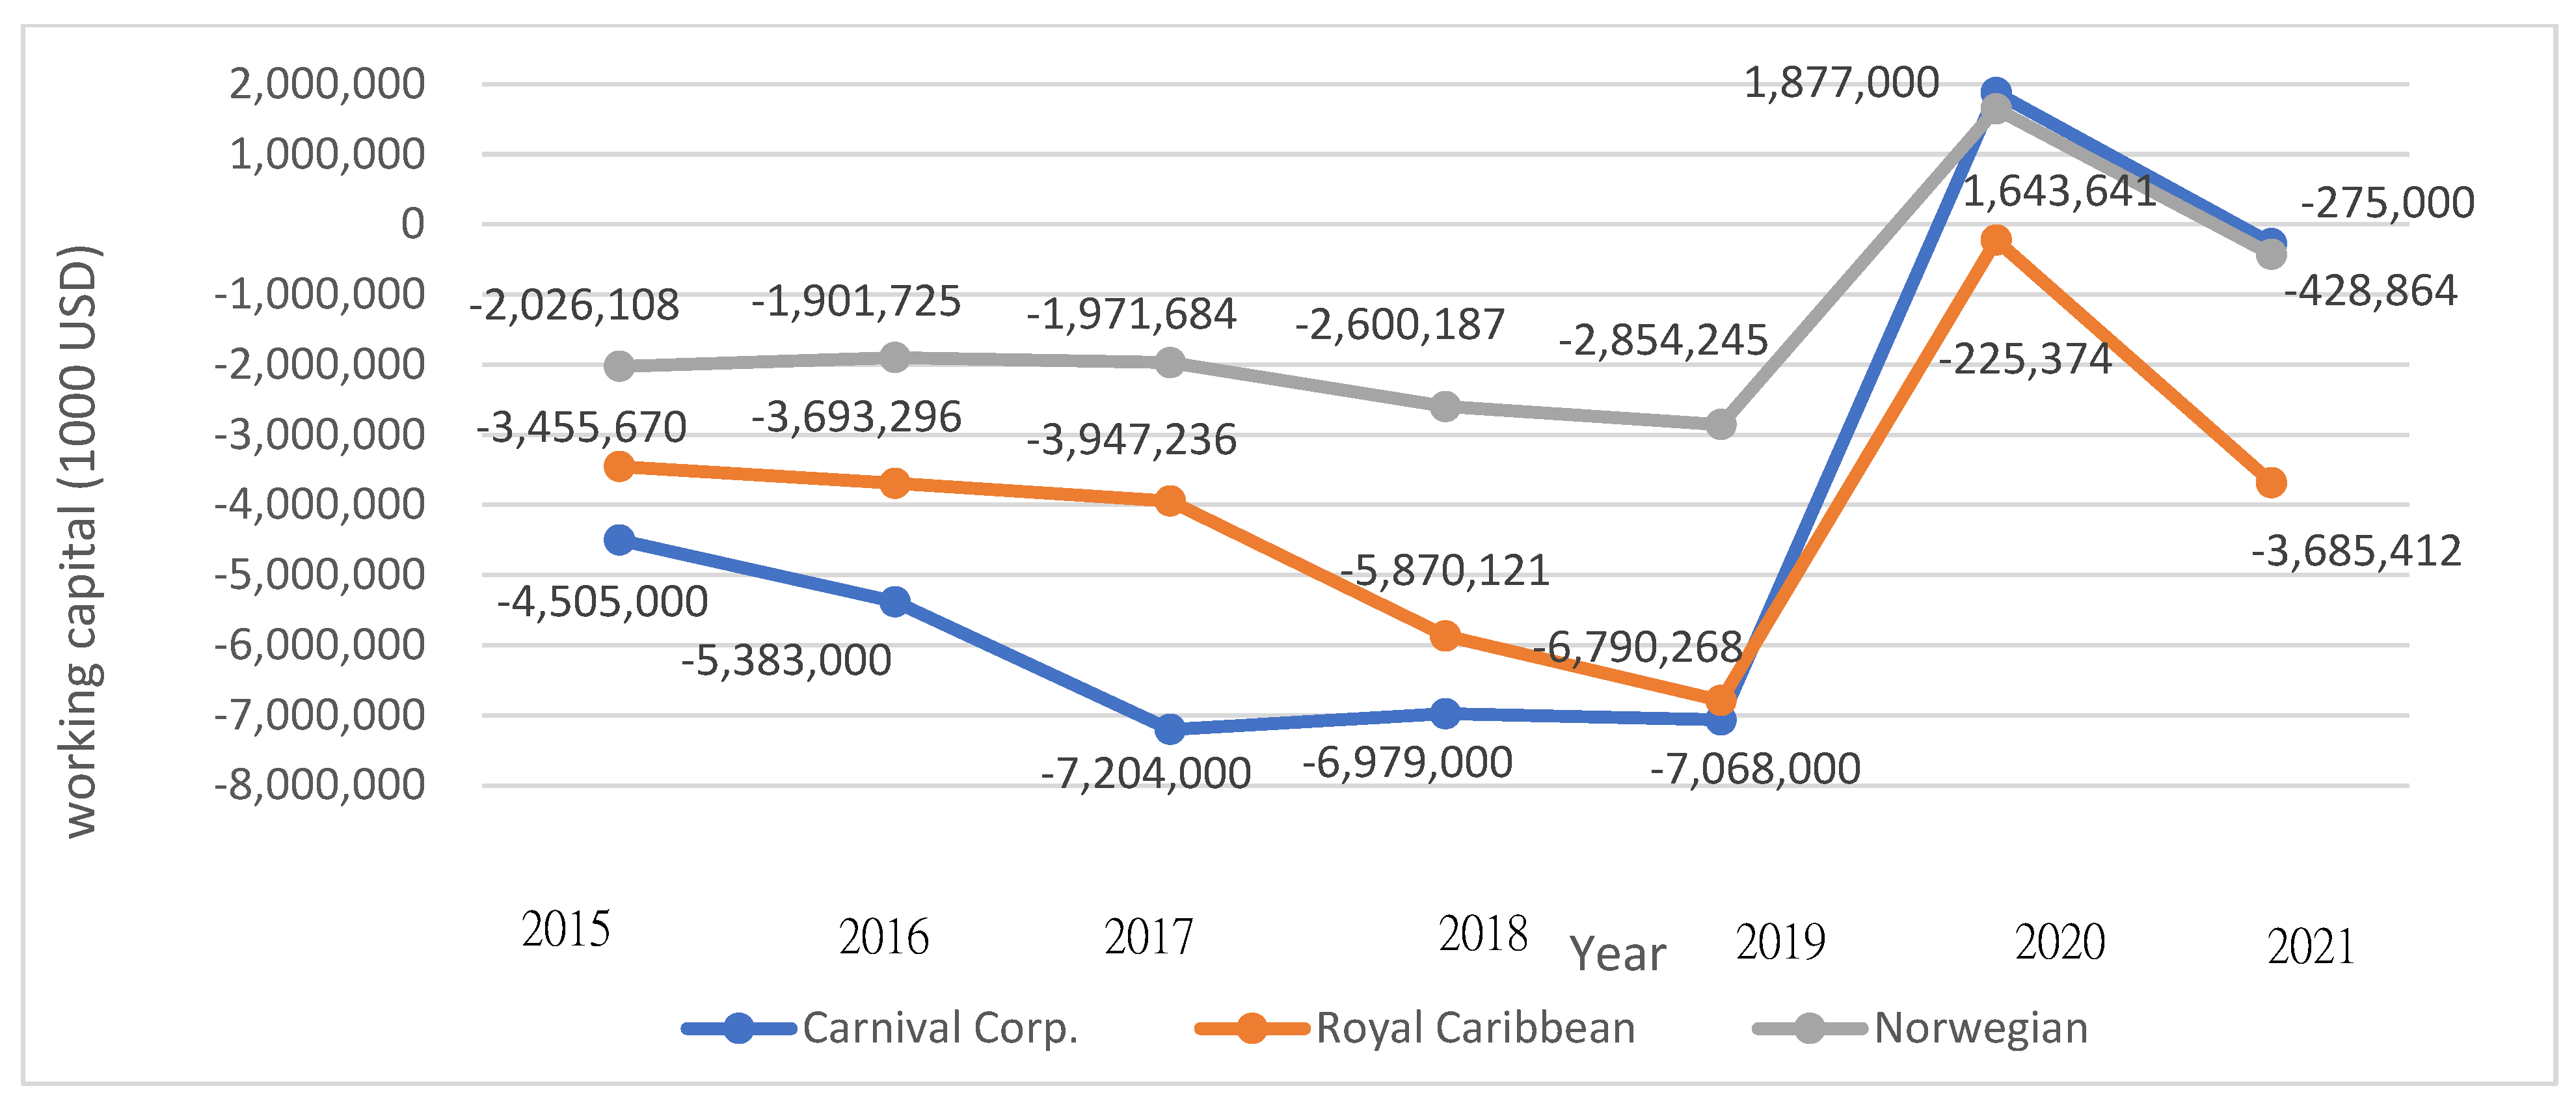
We calculate working capital by subtracting current liabilities from current assets. We used working capital to evaluate a company’s short-term solvency. The more working capital a company has, the better the company’s short-term solvency. If the working capital is negative, it means that the company’s short-term turnover may be worse.
The working capital of the top three cruise companies in the world from 2015 to 2021 is shown in
Figure 8. The working capital of the top three cruise companies from 2015 to 2019 was between US
$4.505 billion–US
$7.204 billion, US
$3.456 billion–US
$6.79 billion, and US
$2.026 billion–US
$2.854 billion.
The working capital of the top three cruise companies was negative from 2015 to 2019, and they all showed a downward trend, which indicated that the three cruise companies had weaker short-term solvency.
The working capital of Carnival Corporation increased from US$7.068 billion in 2019 to US$1.877 billion in 2020, a substantial increase of US$8.945 billion, and decreased to $275 million in 2021. The working capital of Royal Caribbean increased from US$6.790 billion in 2019 to US$225 million in 2020, a substantial increase of US$6.565 billion, and decreased to US$3.685 billion in 2021. The working capital of Norwegian Holidays increased from US$2.854 billion in 2019 to US$1.644 billion in 2020, a substantial increase of US$4.498 billion, and decreased to US$429 million in 2021.
The working capital of the top three cruise companies increased by US$8.945 billion, US$6.565 billion, and US$4.498 billion, respectively, in 2020, which indicated that they actively raised the amount of working capital in 2020 to overcome the short-term suspension crisis.
4.3.2. Solvency Analysis of the World Top Three Cruise Companies
Analysis of Current Ratio of the Top Three Cruise Lines in the World
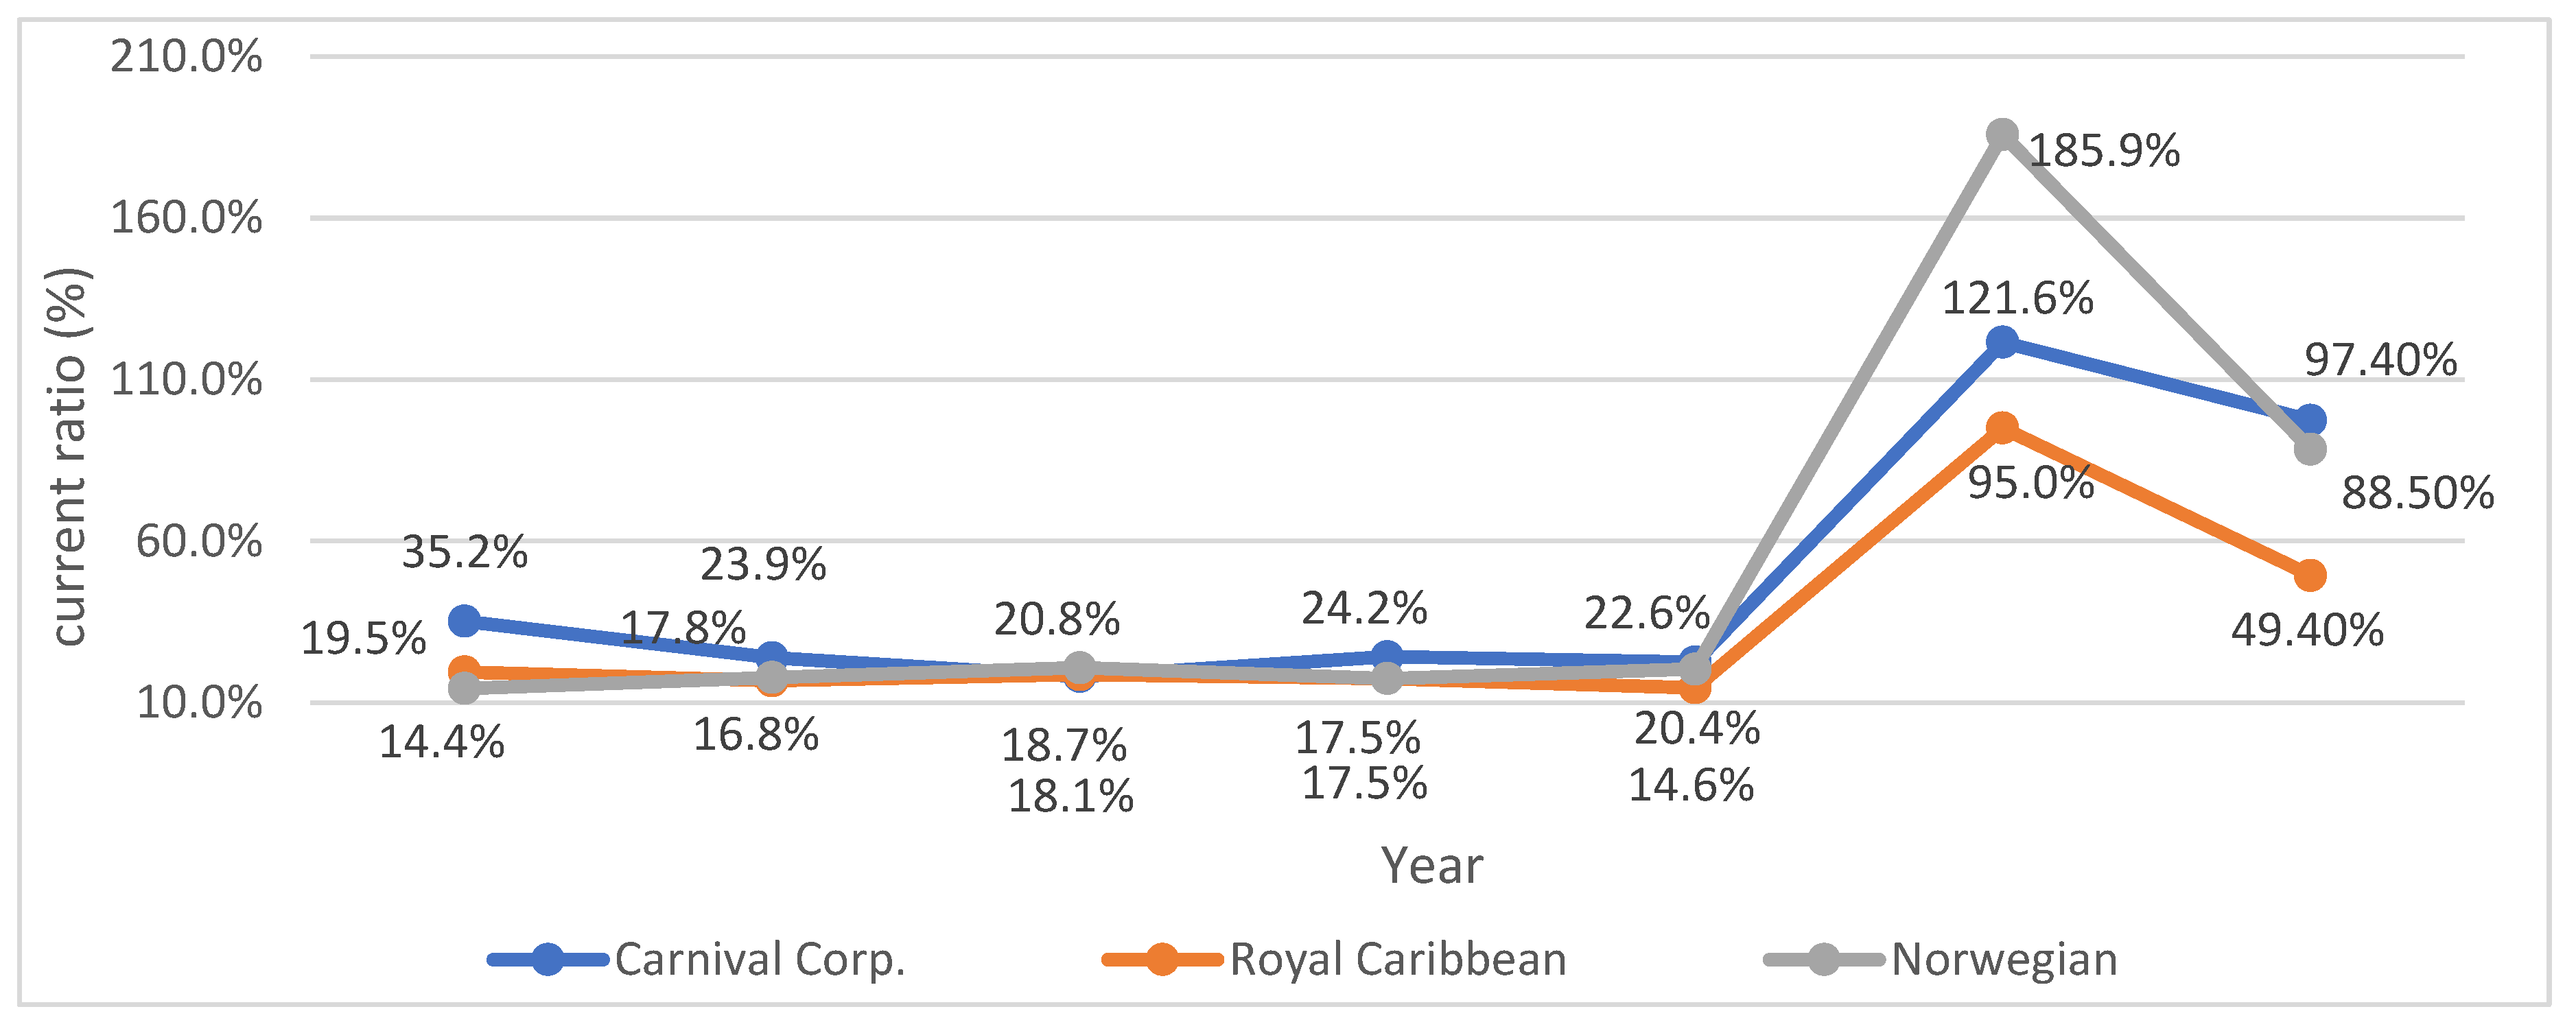
The solvency analysis analyzes the current ratio and quick ratio of the company. The current ratio is a liquidity ratio that measures the ability of the company to pay short-term obligations within one year. If the current ratio is too high, the company has more funds left in its current assets.
The current ratio of the top three cruise companies in the world from 2015 to 2021 is shown in
Table 8 and
Figure 9. The current ratio of the top three cruise companies from 2015 to 2019 was between 18.1–35.2%, 14.6–19.5%, and 14.4–20.8%, respectively. Carnival Corporation and Royal Caribbean showed a downward trend. In contrast, Norwegian Holidays showed an upward trend year by year. The current ratio of Carnival Corporation was relatively high, which indicated that the solvency of Carnival Corporation was relatively high from 2015 to 2019.
The current ratio of Carnival Corporation increased by 99%, from 22.6% in 2019 to 121.6% in 2020, and was 97.4% in 2021. The current ratio of Royal Caribbean increased by 80.4%, from 14.6% in 2019 to 95.0% in 2020, and was 49.4% in 2021. The current ratio of Norwegian Holiday increased by 165.5%, from 20.4% in 2019 to 185.9% in 2020, and was 88.5% in 2021.
The current ratios of the top three cruise companies increased by 99%, 80.4%, and 165.5%, respectively, in 2020, which indicated that the solvency of the top three cruise companies increased significantly in 2020. The reason was that the top three cruise companies tried to borrow a lot of debt, issued corporate bonds, and got working capital to overcome the financial crisis of the global suspension of sailings.
However, a substantial increase in debt still shall pay loan interests and repay the principal in the future, which will erode the profits and earnings of the companies. It will have a very negative impact on the sustainable development of the cruise industry.
Analysis of Quick Ratio of the Top Three Cruise Lines in the World
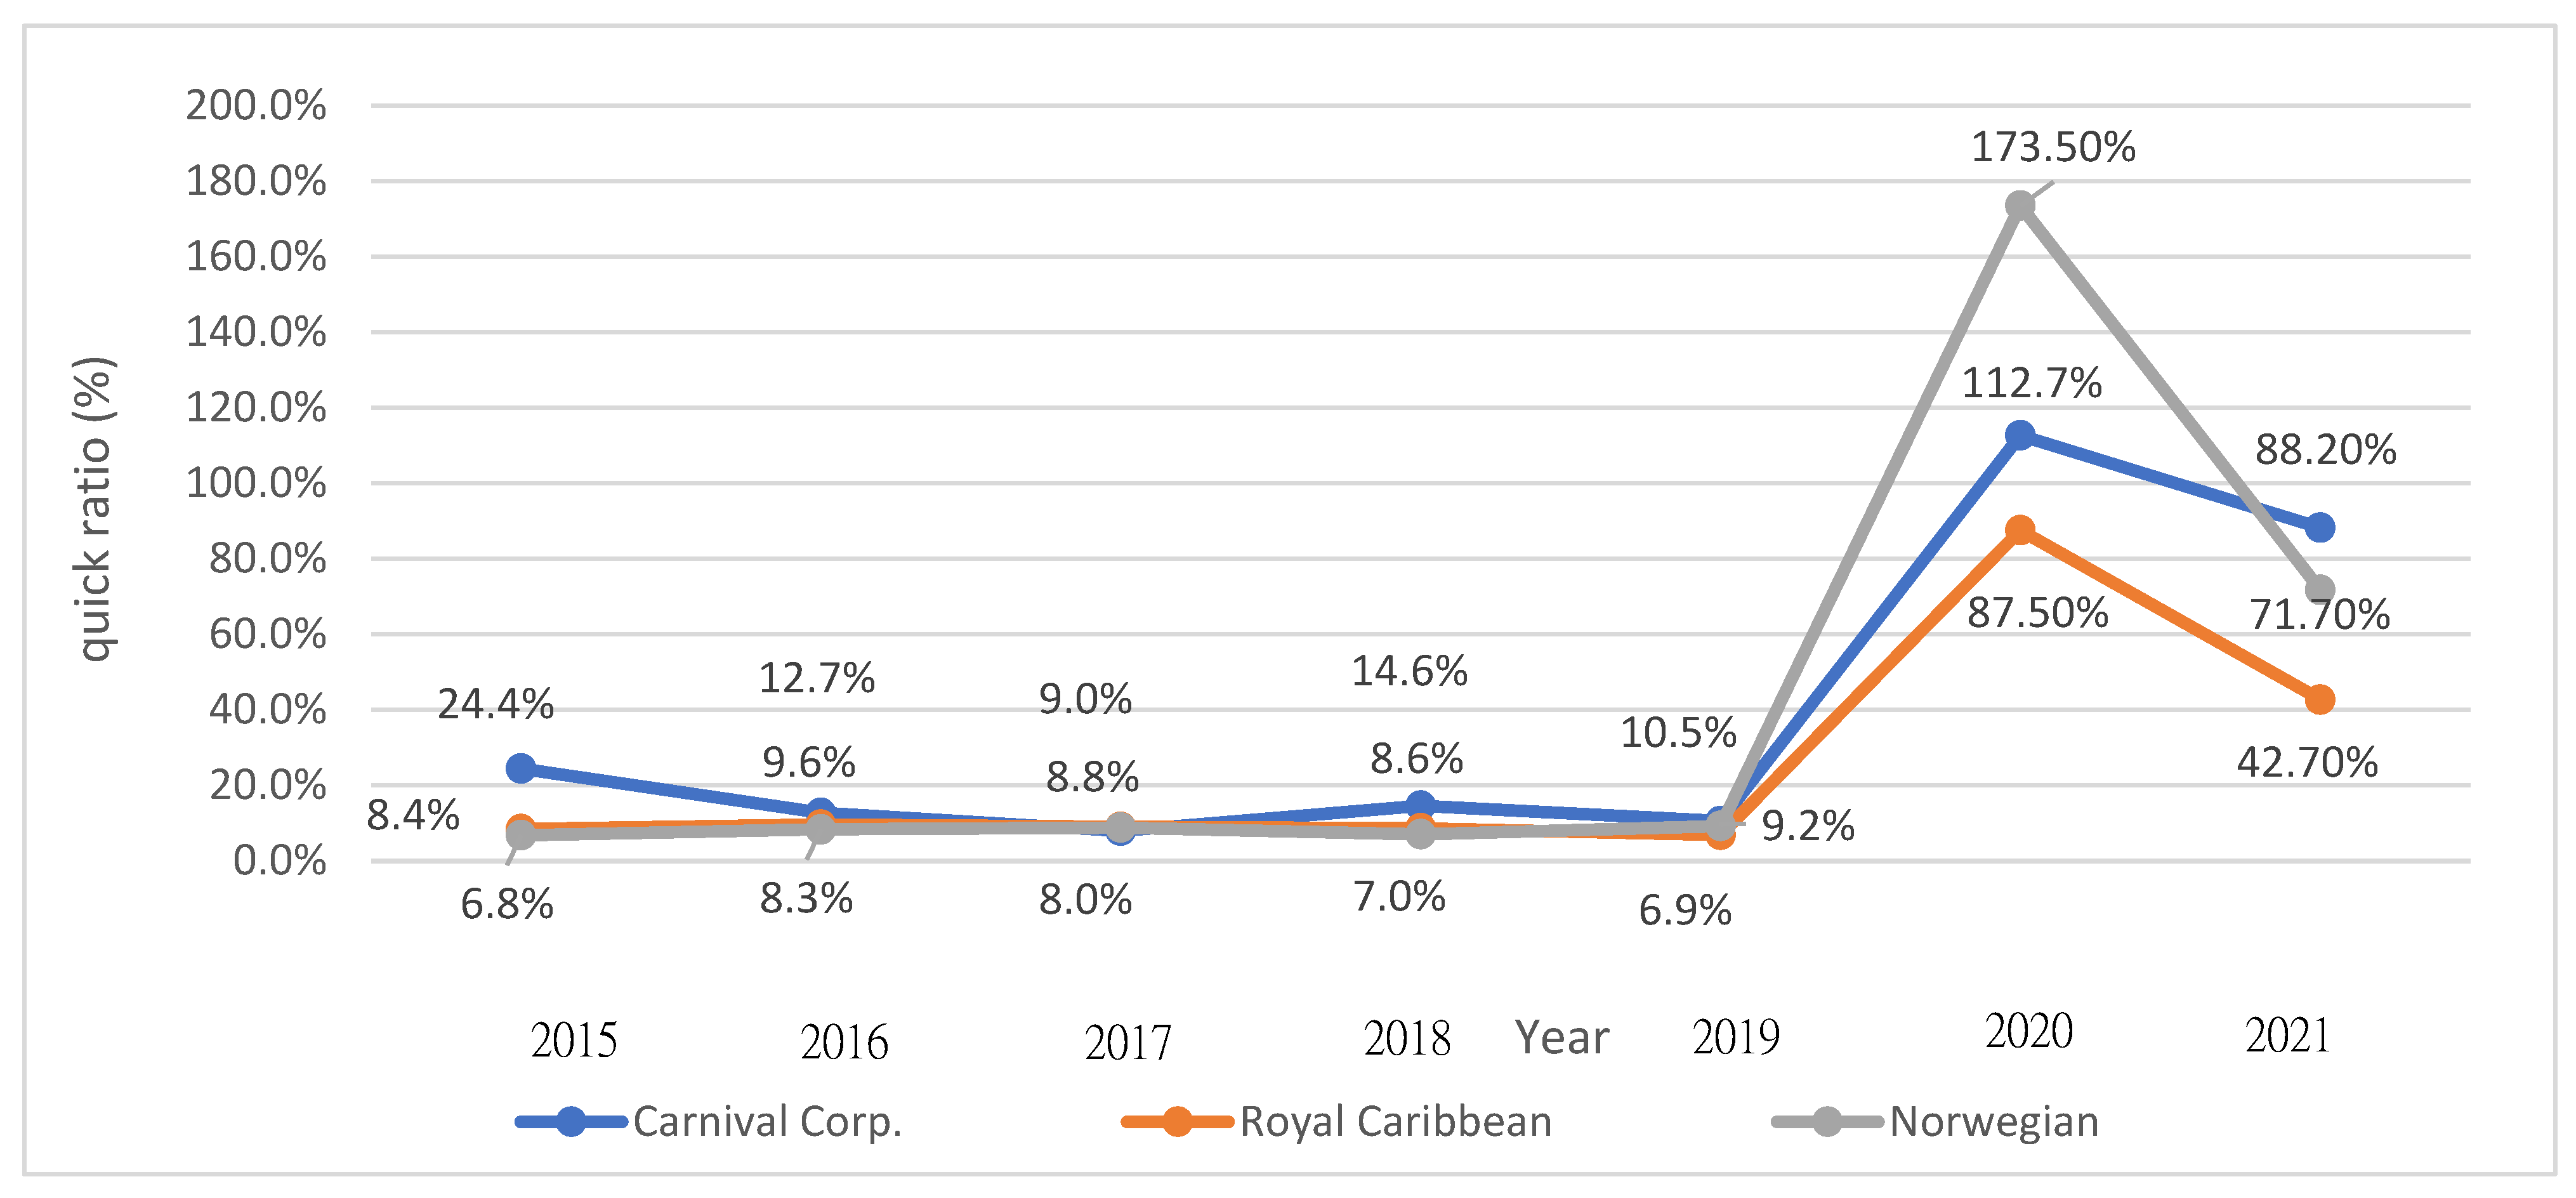
The quick ratio measures the ability of a company to use its immediate cash or quick assets to retire its current liabilities immediately. The higher the quick ratio is, the higher the emergency solvency of the company.
The quick ratio of the top three cruise companies in the world from 2015 to 2021 is shown in
Table 8 and
Figure 10. The quick ratio of the top three cruise companies from 2015 to 2019 was between 8–24.4%, 6.9–9.6%, and 6.89.2%, respectively.
Although Carnival Corporation and Royal Caribbean showed a downward trend, and Norwegian Holidays showed an increasing trend, the quick ratio of Carnival Corporation was still relatively high, which indicated that the emergency solvency of Carnival Corporation was better. In contrast, the emergency solvency of Norwegian Vacations showed a positive trend towards growth.
The quick ratio of Carnival Corporation increased by 102.2%, from 10.5% in 2019 to 112.7% in 2020, and was 88.2% in 2021. The quick ratio of Royal Caribbean increased by 80.6%, from 6.9% in 2019 to 87.5% in 2020, and was 42.7% in 2021. The quick ratio of Norwegian Holiday increased by 164.3%, from 9.2% in 2019 to 173.5% in 2020, and was 71.7% in 2021.
The quick ratios of the top three cruise companies increased by 102.2%, 80.6%, 164.3%, respectively, in 2020, which indicated that the emergency solvency of the top three cruise companies increased significantly in 2020.
On the surface, it appeared to be a substantial increase in emergency solvency of the cruise companies. However, this would impose a burden on the future operations of the cruise companies. And in essence, the top three cruise companies tried to borrow a lot of debt, issued corporate bonds, and got working capital to overcome the financial crisis of the global suspension of cruises.
4.3.3. Operating Performance Analysis of the World Top Three Cruise Companies
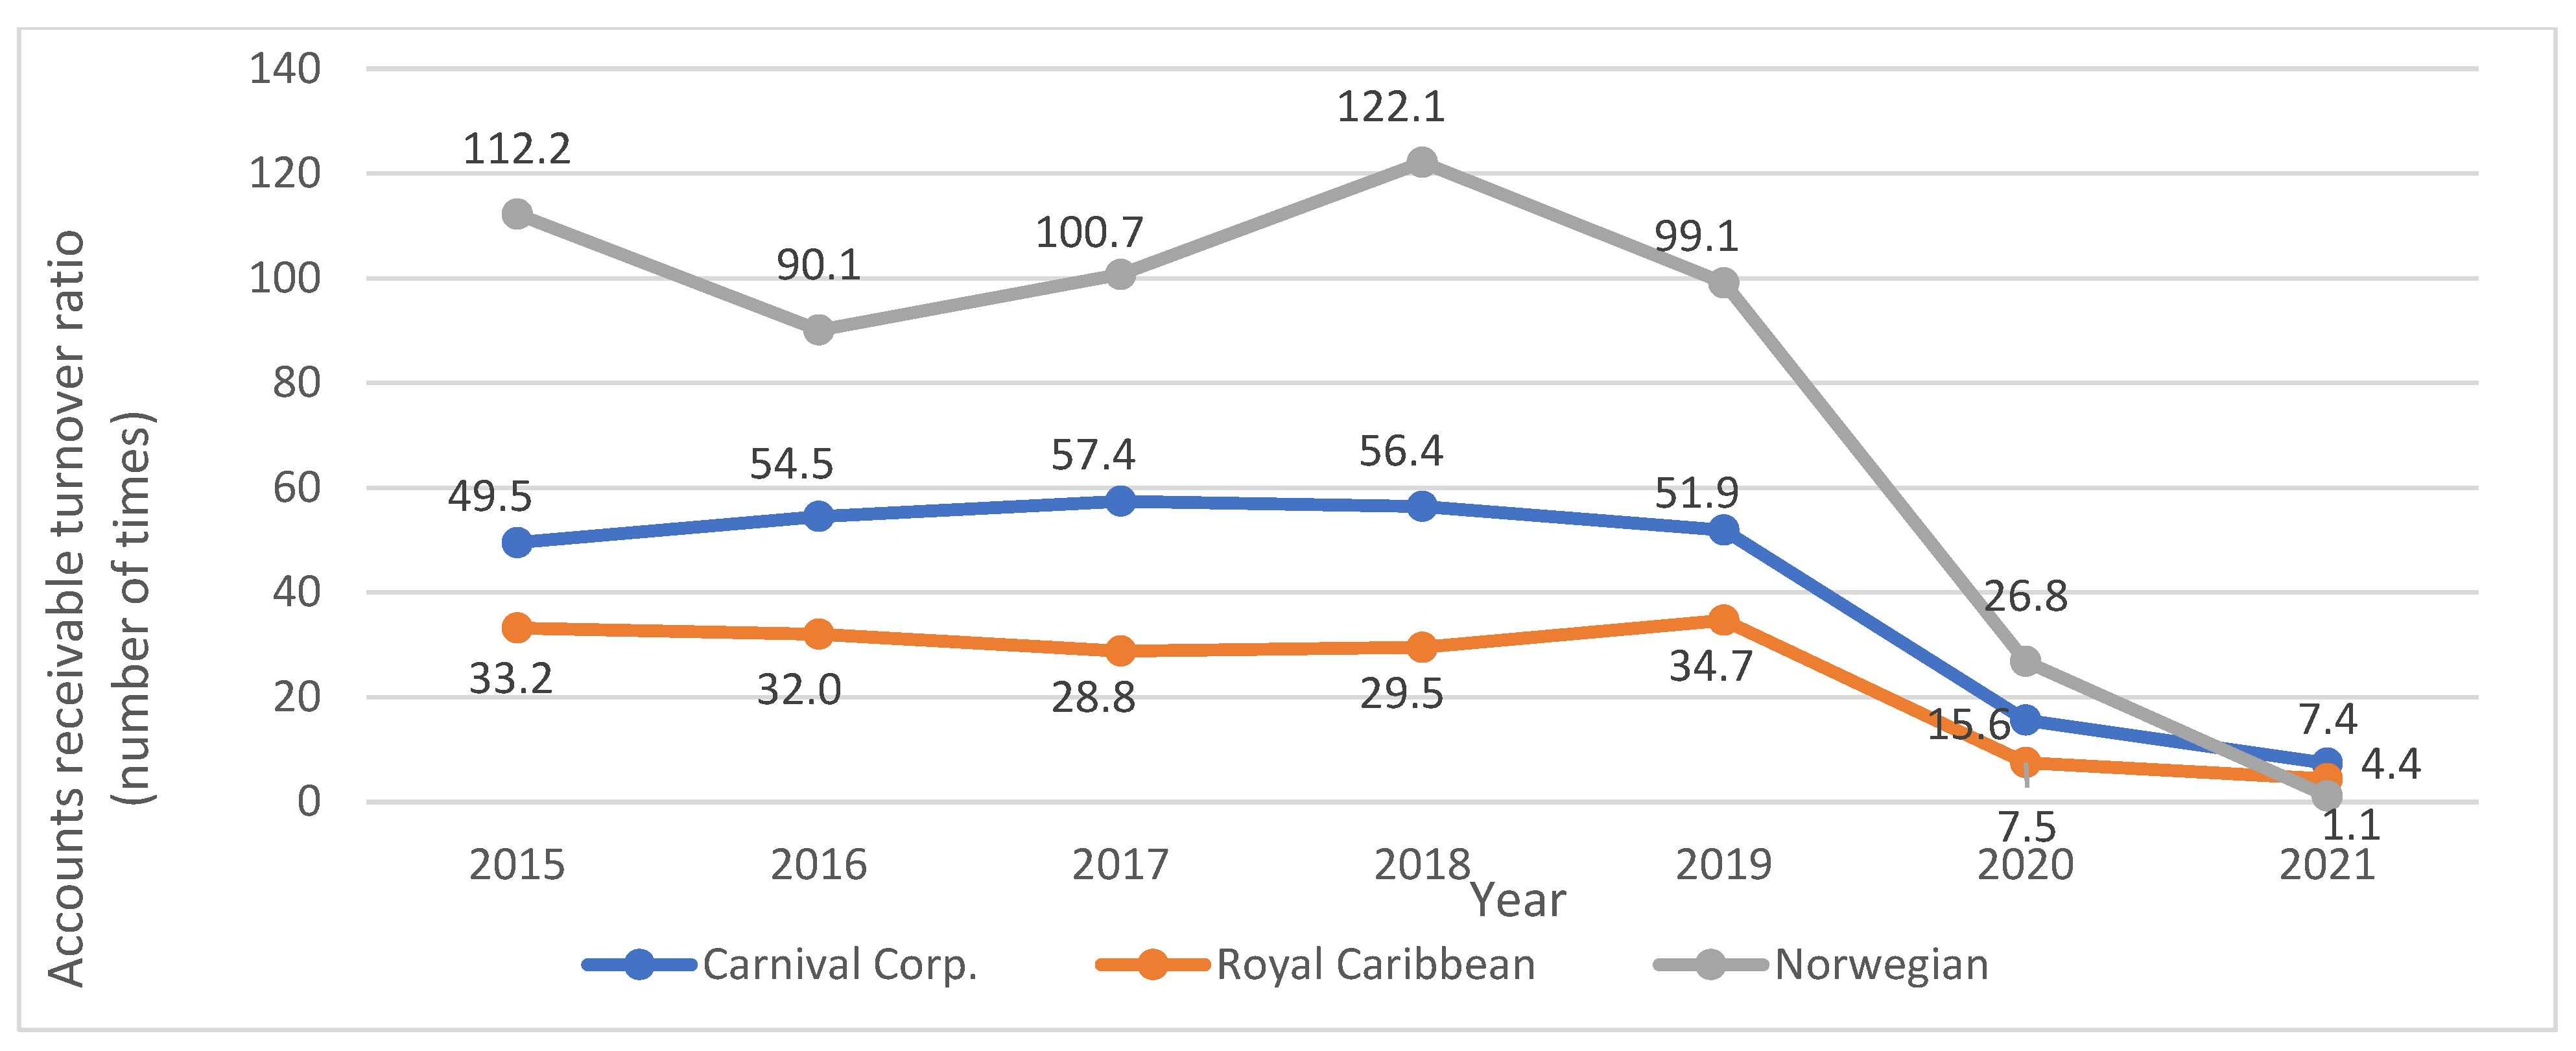
Analysis of Accounts Receivable Turnover Ratio of the Top Three Cruise Lines in the World
The operating capability mainly analyzes the company’s accounts-receivable turnover ratio and inventory turnover ratio. The accounts-receivable turnover ratio refers to the company’s ability to collect accounts receivable. Most cruise companies sell tickets through travel agencies, and passengers pay for tickets before departure; and passengers also spend a lot of money on cruise ships and pay immediately. Therefore, the accounts receivable turnover ratio of the cruise industry is usually higher than that of other industries, and the turnover days are shorter.
The accounts receivable turnover ratio of the top three cruise companies in the world from 2015 to 2021 is shown in
Figure 11. The accounts-receivable turnover ratio of the top three cruise companies from 2015 to 2019 was between 49.5 times–57.4 times, 28.8 times–34.7 times, and 90.1 times–122.1 times. Royal Caribbean Corporation had the lowest accounts-receivable turnover ratio, followed by Carnival Corporation, and Norwegian Holiday Corporation had the highest accounts receivable turnover ratio.
The accounts-receivable turnover ratio of Carnival Corporation decreased from 51.9 times in 2019 to 15.6 times in 2020 and was 7.4 times in 2021. The accounts-receivable turnover ratio of Royal Caribbean decreased from 34.7 times in 2019 to 7.5 times in 2020 and was 4.4 times in 2021. Norwegian Holiday’s accounts-receivable turnover ratio decreased from 99.1 times in 2019 to 26.8 times in 2020 and was 1.1 times in 2021. The accounts-receivable turnover ratio of the top three cruise companies had been significantly reduced due to the impact of the COVID-19 pandemic.
Analysis of Inventory Turnover Rate of the Top Three Cruise Lines in the World
We use inventory turnover to measure the number of times inventory is sold in a year. It is calculated to know if a business has an excessive inventory compared to its sales level.
The higher the inventory turnover rate, the lower the pressure on the company’s inventory and the higher the efficiency of the company’s capital use. However, when the inventory turnover rate is too high, it may also be due to insufficient inventory and missed opportunities for sales.
The companies in the cruise industry usually have high inventory turnover.
The inventory turnover of the top three cruise companies in the world from 2015 to 2021 is shown in
Figure 12. The inventory turnover of the top three cruise companies in the world from 2015 to 2019 was between 32.3 times–36.2 times, 48.2 times–54.0 times, and 49.6 times–56.5 times. Carnival Corporation had the lowest inventory turnover rate, followed by Royal Caribbean Corporation, and Norwegian Holiday Corporation had the highest inventory turnover rate.
The inventory turnover rate of Carnival Corporation increased from 35.1 times in 2019 to 38 times in 2020 and was 26 times in 2021. The inventory turnover rate of Royal Caribbean decreased from 48.2 times in 2019 to 28.2 times in 2020 and was 30 times in 2021. The inventory turnover rate of Norwegian Holiday decreased from 50.5 times in 2019 to 27.4 times in 2020 and was 24.9 times in 2021. The inventory turnover of the top three cruise companies had been significantly reduced due to the impact of the COVID-19 pandemic.
4.3.4. Profitability Analysis of the World Top Three Cruise Companies
Analysis of Net Operating Profit of the World Top Three Cruise Companies
The net operating profit of the top three cruise companies in the world from 2015 to 2021 is shown in
Figure 13. The net operating profit of the top three cruise companies in the world from 2015 to 2019 was US
$1.757 billion to US
$3.152 billion, US
$0.666 billion to US
$1.908 billion, and US
$0.427 billion to US
$0.955 billion, respectively, with a corresponding growth rate of 70.2%, 186.5%, and 117.8%. The net operating profit of the top three cruise companies in the world showed a steady increase year by year before the outbreak of the global COVID-19 pandemic at the end of 2019.
The growth rates of net operating profit of the top three cruise companies in the world far exceeded operating income from 2015 to 2019. It showed that the cruise industry was profitable in standard years.
Due to the suspension of cruise ships, the top three cruise companies lost US$10.236 billion, US$5.797 billion, US$4.013 billion, respectively, in 2020; US$9.501 billion, US$5.26 billion, and US$4.507 billion, respectively, in 2021. The top three cruise companies worldwide suffered heavy losses from the suspension of cruise ships due to the COVID-19 pandemic.
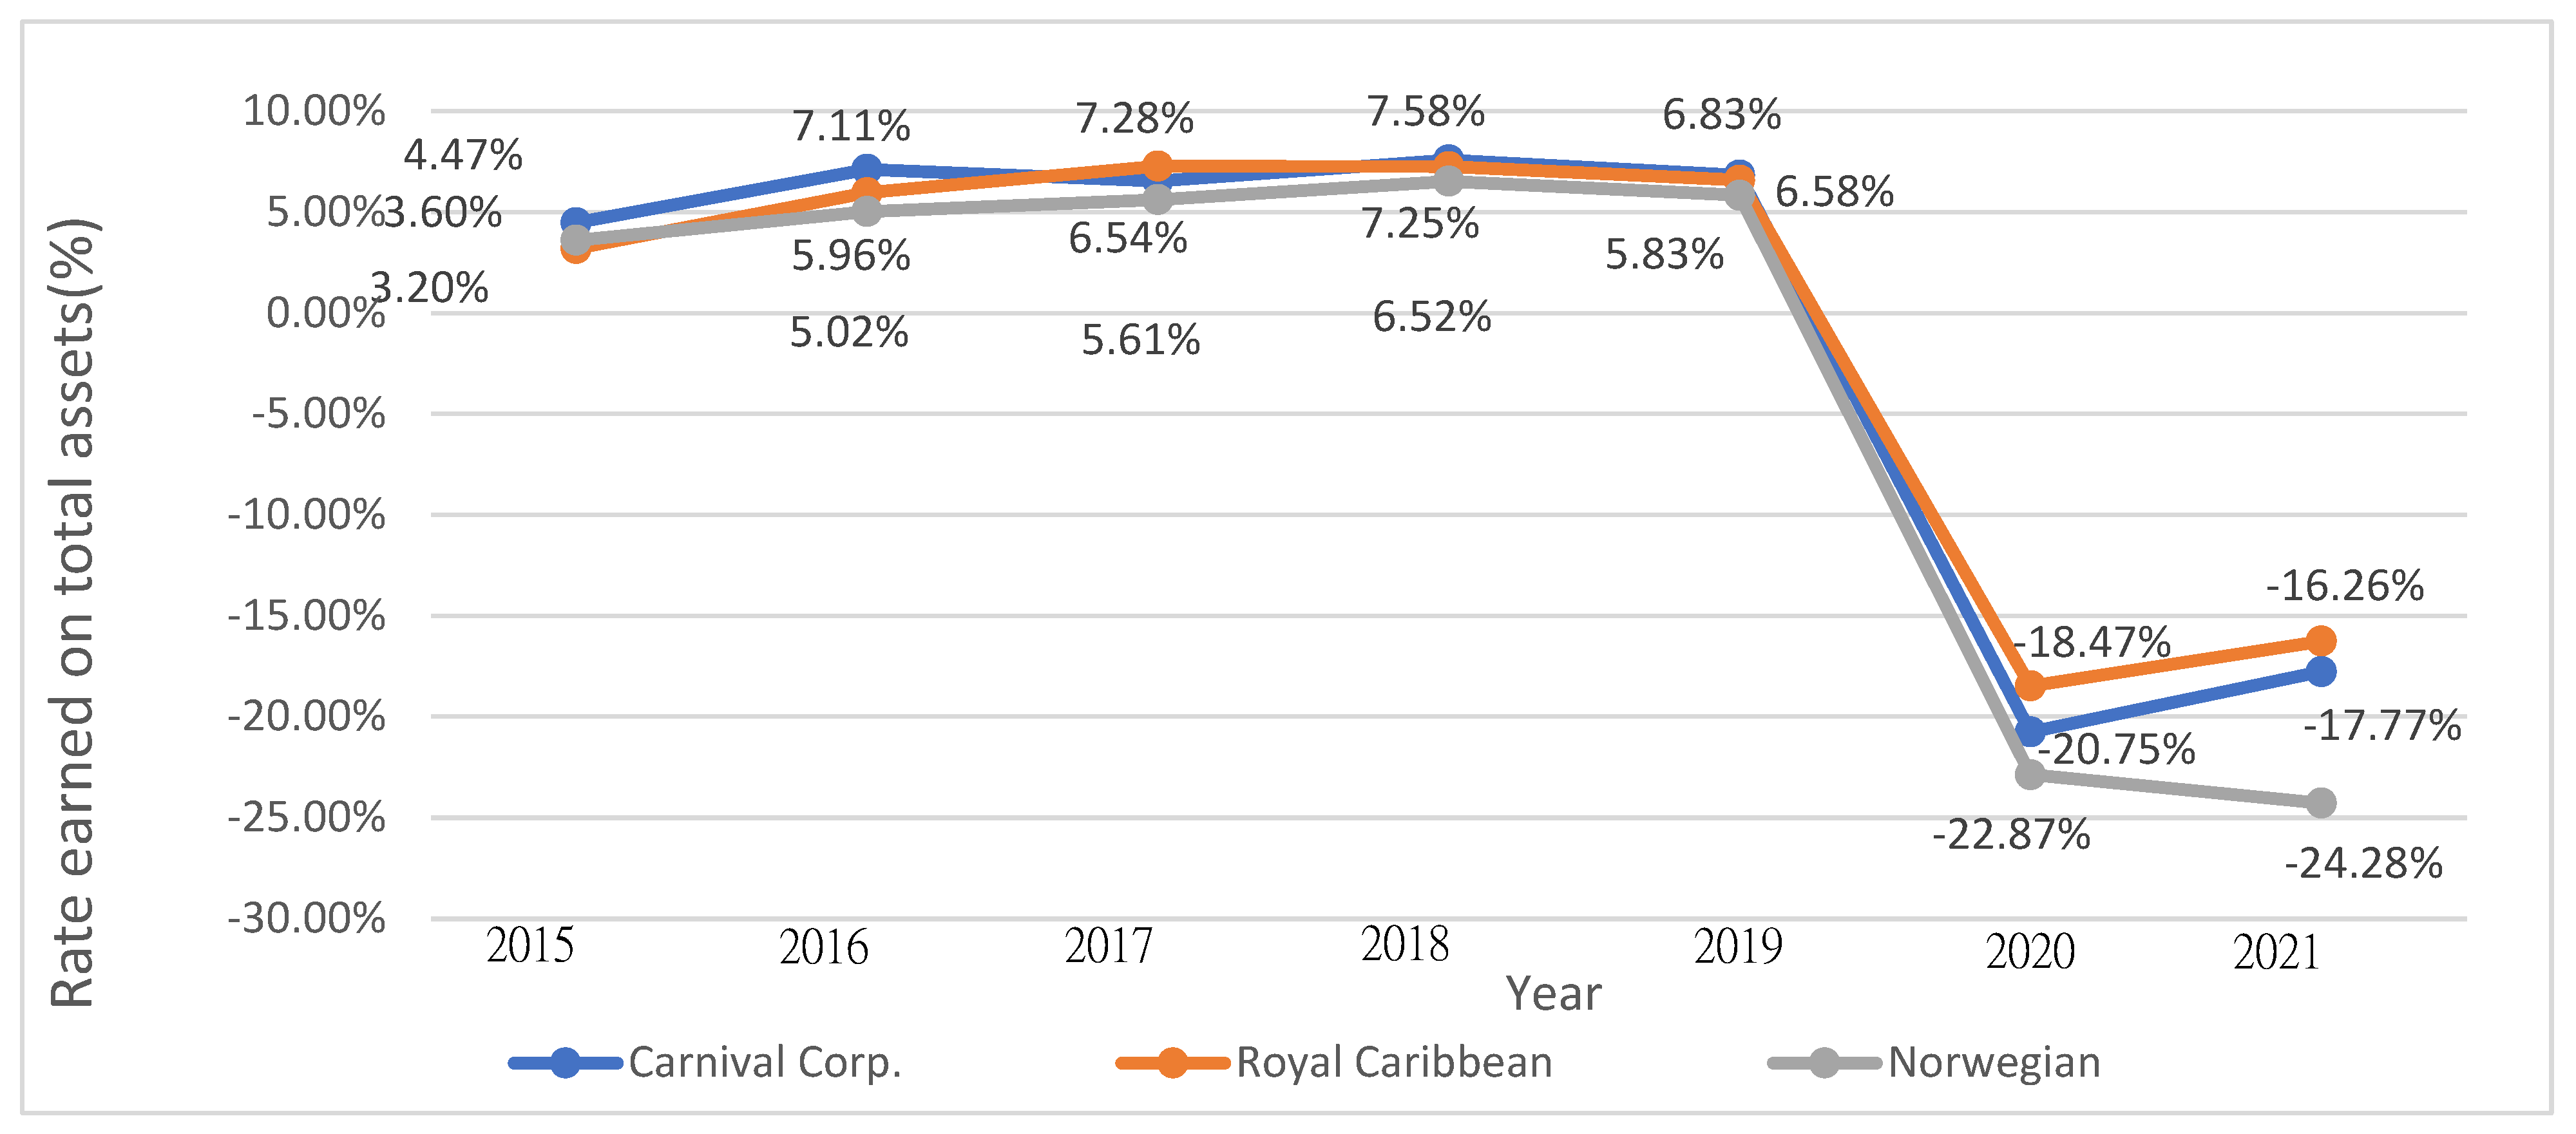
Analysis of Rate Earned on Total Assets of the World Top Three Cruise Companies
The rate earned on total assets of Carnival cruises, Royal Caribbean Cruises, and Norwegian Holiday Cruises is shown in
Figure 14 and
Table 8. The respective rates were between 4.47–7.58%, 3.20–7.28%, and 3.60–6.52%, and four-year growth rates were 52.8%, 142.1%, and 61.9%, respectively, from 2015 to 2019. From highest to lowest, the first was Carnival cruises, the second was Royal Caribbean Cruises, and the third was Norwegian Holiday Cruises. Most of the cruise companies’ assets (70~80%) are cruise ships. And the cost of cruise ships is expensive. Therefore, the rate earned on the total assets of the world’s top three cruise companies is relatively low.
Since mid-March 2020, the temporary suspension of navigation has resulted in operating losses. The respective rate earned on total assets of Carnival cruises, Royal Caribbean Cruises, and Norwegian Holiday Cruises has decreased from 6.83%, 6.58%, and 5.83% in 2019 to −20.75%, −18.47%, and −22.87% in 2020 and −17.77%, −16.26%, and −24.28% in 2021. However, the impact and challenges of the COVID-19 pandemic on the rate earned on the total assets of global cruise companies are profound.
Analysis of Rate Earned on Total Equity of the World Top three Cruise Companies
The rate earned on total equity of Carnival cruises, Royal Caribbean Cruises, and Norwegian Holiday Cruises is shown in
Figure 15 and
Table 8. The respective rates were between 7.32–12.96%, 8.10–16.65% and 11.7–16.3%, and the 4-year growth rates were 64.1%, 102.5% and 27.4%, respectively, from 2015 to 2019.
In 2020 the temporary suspension of navigation had resulted in operating losses. The respective rate earned on total equity of Carnival cruises, Royal Caribbean Cruises, and Norwegian Holiday Cruises has decreased from 12.01%, 16.4%, and 14.91% in 2019 to −44.58%, −55.41%, and −73.83% in 2020 and −58.11%, −75.98%, and −132.81% in 2021. The impact of the Coronavirus (COVID-19) pandemic on the rate earned on total equity of global cruise companies is also severe.
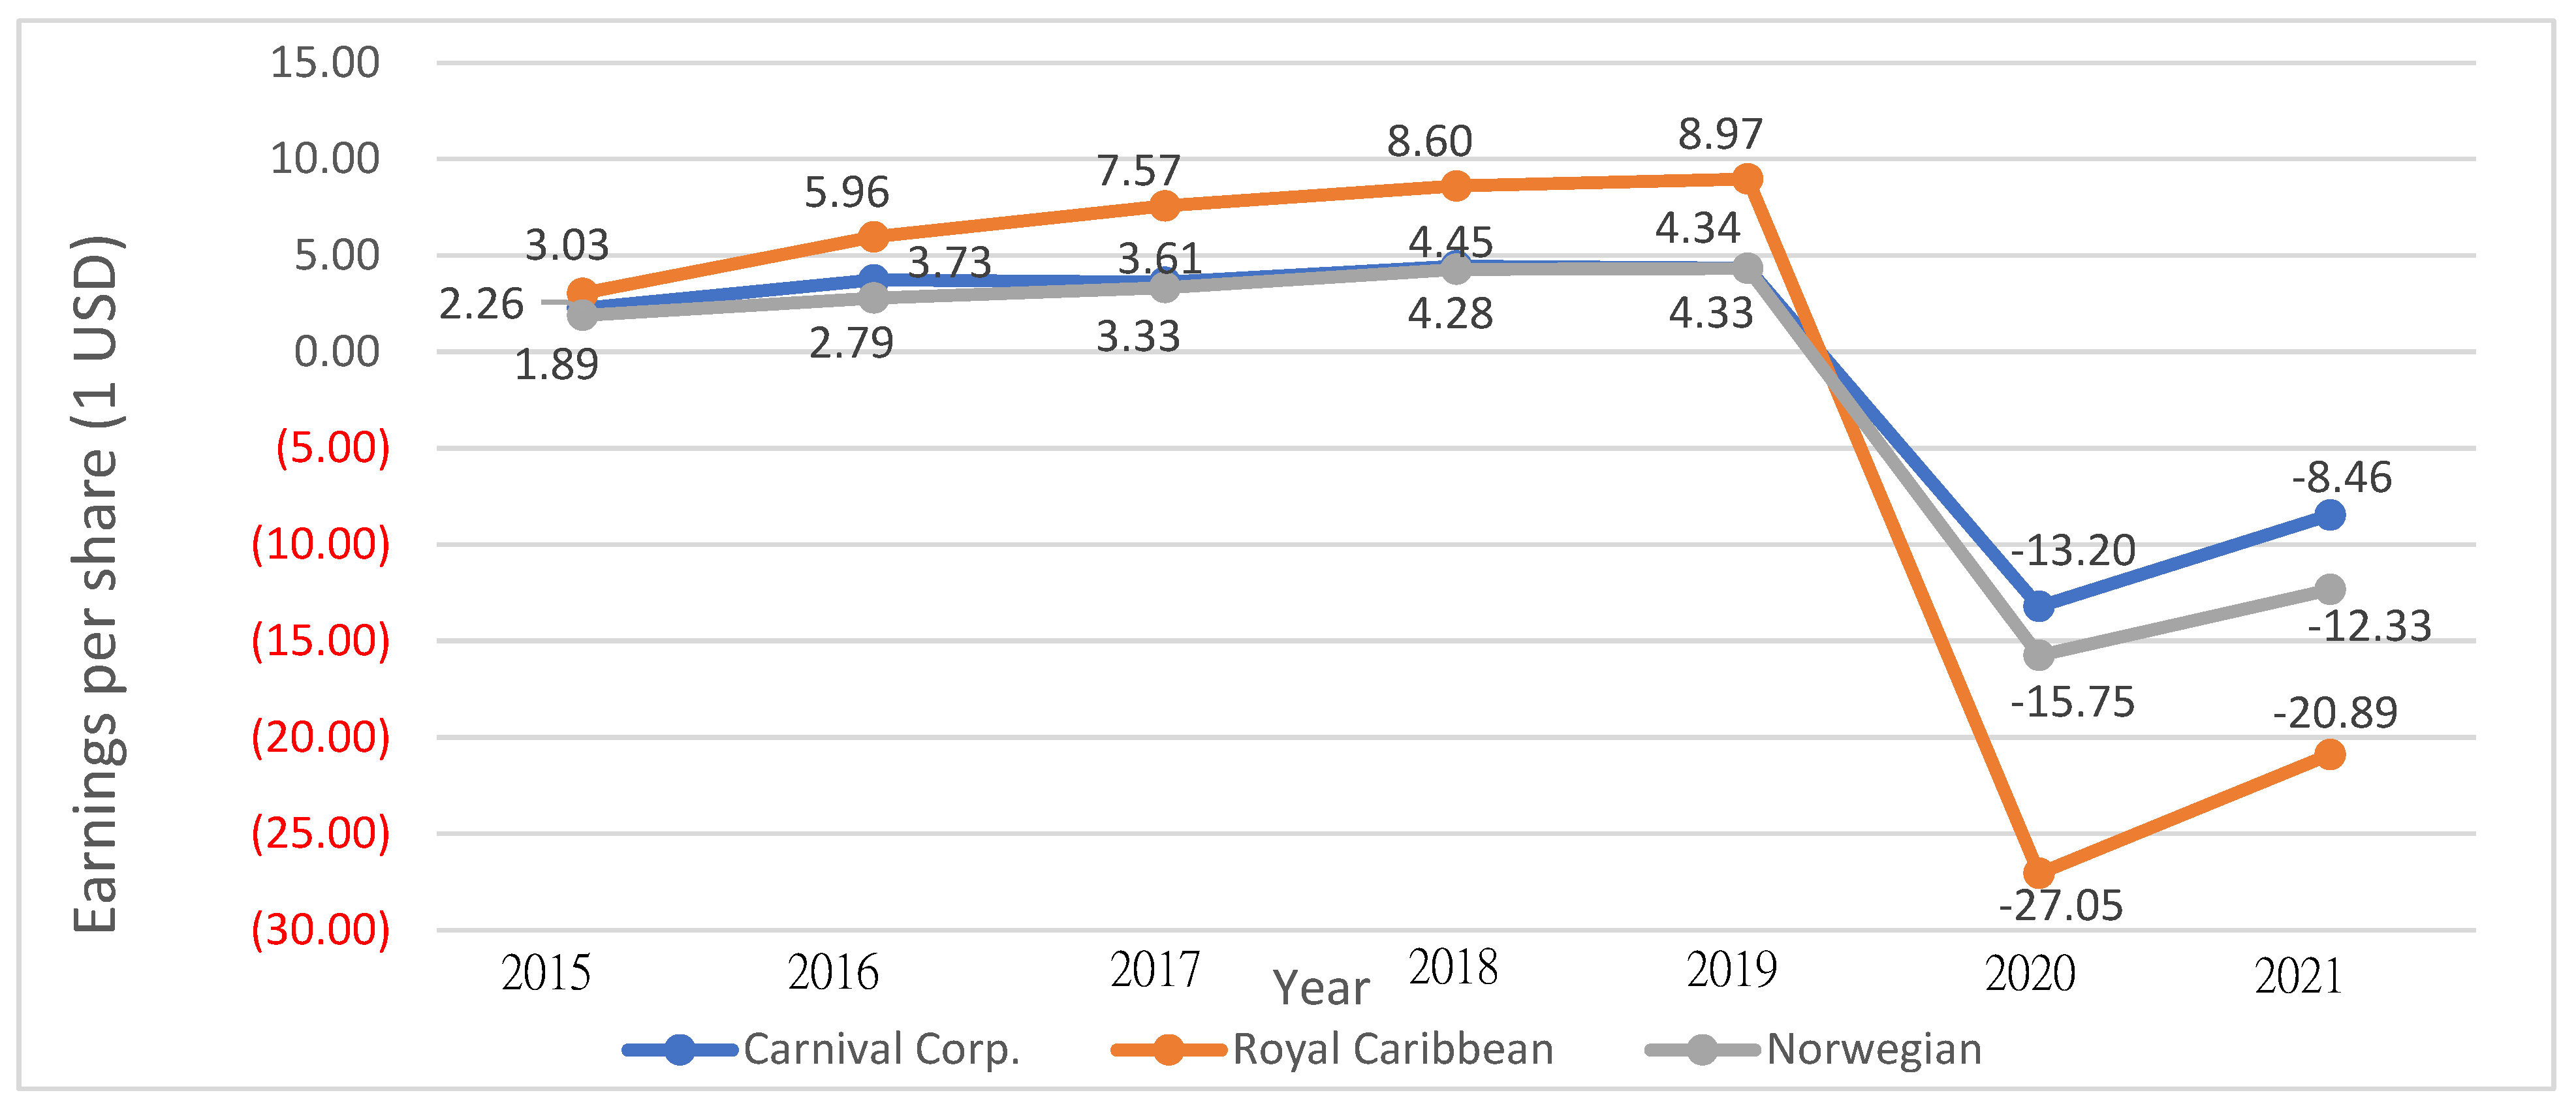
Analysis of Earnings per Share of the World Top Three Cruise Companies
The EPS of Carnival cruises, Royal Caribbean Cruises, and Norwegian Holiday Cruises are shown in
Figure 16 and
Table 8. They were between
$2.26–4.45,
$3.03–8.97 and
$1.89−4.33, respectively, and the 4-year growth rates were 92.0%, 196.0%, and 129.1%, respectively, from 2015 to 2019.
The impact of the Coronavirus (COVID-19) pandemic on the earnings per share of global cruise companies was severe in 2020. It shows that from 2015 to 2019, the top three cruise companies have a positive outlook for the cruise industry, and their earnings per share are increasing year by year. But in 2020, the respective earnings per share of Carnival cruises, Royal Caribbean Cruises, and Norwegian Holiday Cruises have decreased from $4.34, $8.97, and $4.33 in 2019 to $−13.20, $-27.05, and $−15.75 in 2020 and $−8.46, $−20.89, and $-12.33 in 2021.
Analysis of Price-Earnings (P/E) Ratio of the World Top three CRUISE companies
The price-earnings (P/E) ratio of Carnival cruises, Royal Caribbean Cruises, and Norwegian Holiday Cruises are shown in
Figure 17 and
Table 8. They are between 11.1–24.1, 15.0–41.2, and 9.9–31.0, respectively, from 2015 to 2019. The P/E ratios of the world’s top three cruise companies have all fallen below 20, with a downward trend from 2016 to 2019.
The respective price-earnings (P/E) ratios of Carnival cruises, Royal Caribbean Cruises, and Norwegian Holiday Cruises have decreased from 11.7, 20.06, and 13.5 in 2019 to −1.64, −2.76, and −1.61 in 2020 and −2.19, −3.68, and −1.68 in 2021. The price-earnings (P/E) ratio of global cruise companies has been significantly reduced due to the COVID-19 pandemic.
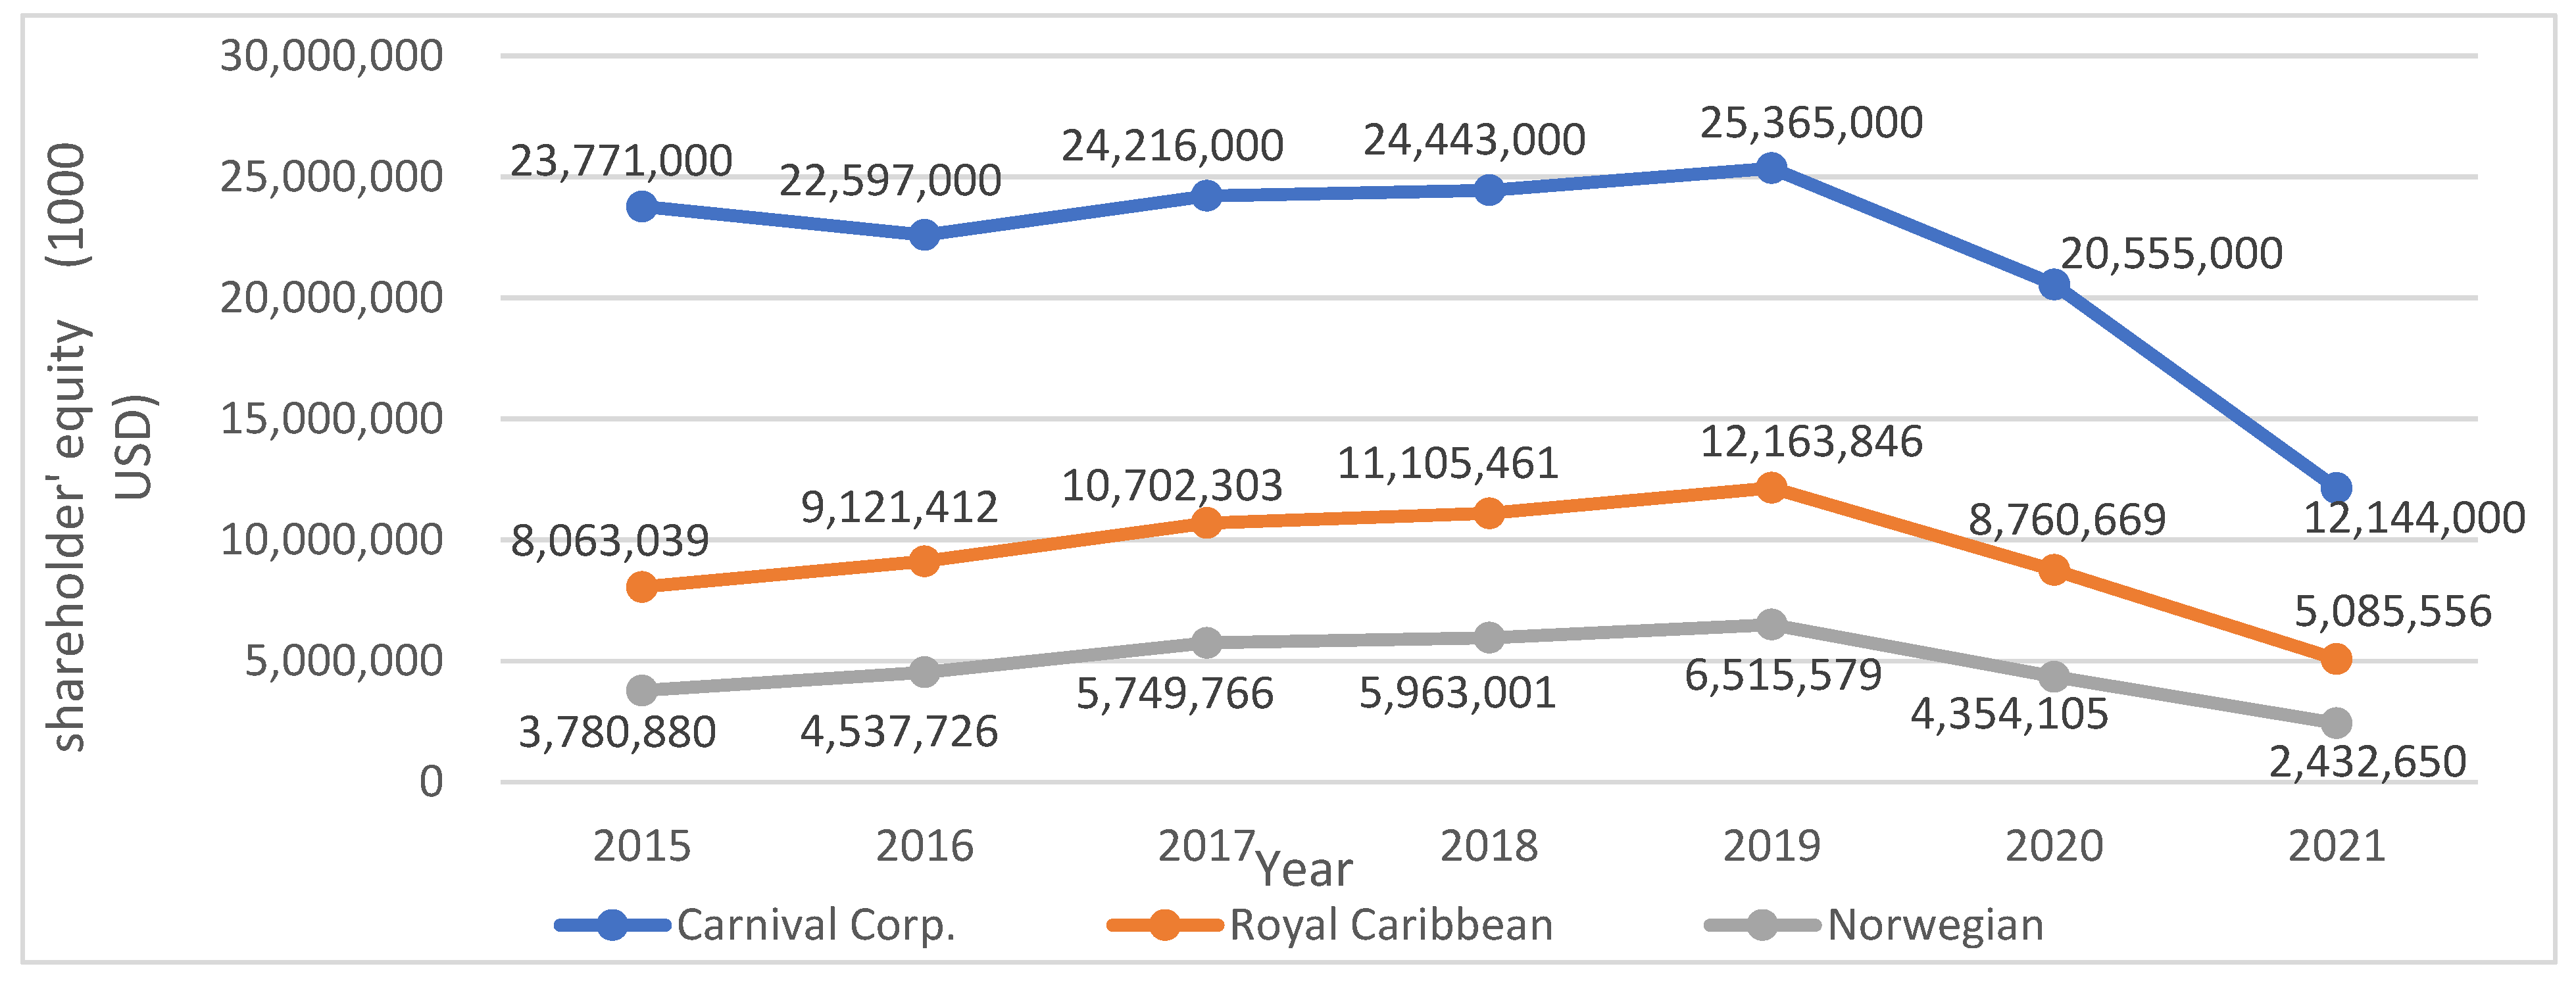
4.3.5. Analysis of Shareholder’ Equity of the World Top Three Cruise Companies
The shareholder’ equity of Carnival cruises, Royal Caribbean Cruises, and Norwegian Holiday Cruises are shown in
Figure 18. There were between
$22.597 billion–25.365 billion,
$8.063 billion~–12.164 billion, and
$3.781 billion–6.516 billion, respectively, and have all shown an upward trend from 2015 to 2019.
The impact of the Coronavirus (COVID-19) pandemic on the cruise tourism industry was severe in 2020 and 2021. The global top three cruise companies suffered significant operating losses in 2020 and even more seriously in 2021, resulting in reduced shareholder equity. The respective shareholders’ equity of Carnival cruises, Royal Caribbean Cruises, and Norwegian Holiday Cruises has decreased from $25.365 billion, $12.164 billion, and $6.516 billion in 2019 to $20.555 billion, $8.761 billion, and $4.354 billion in 2020 and $12.144 billion, $5.086 billion, and $2.433 billion in 2021.
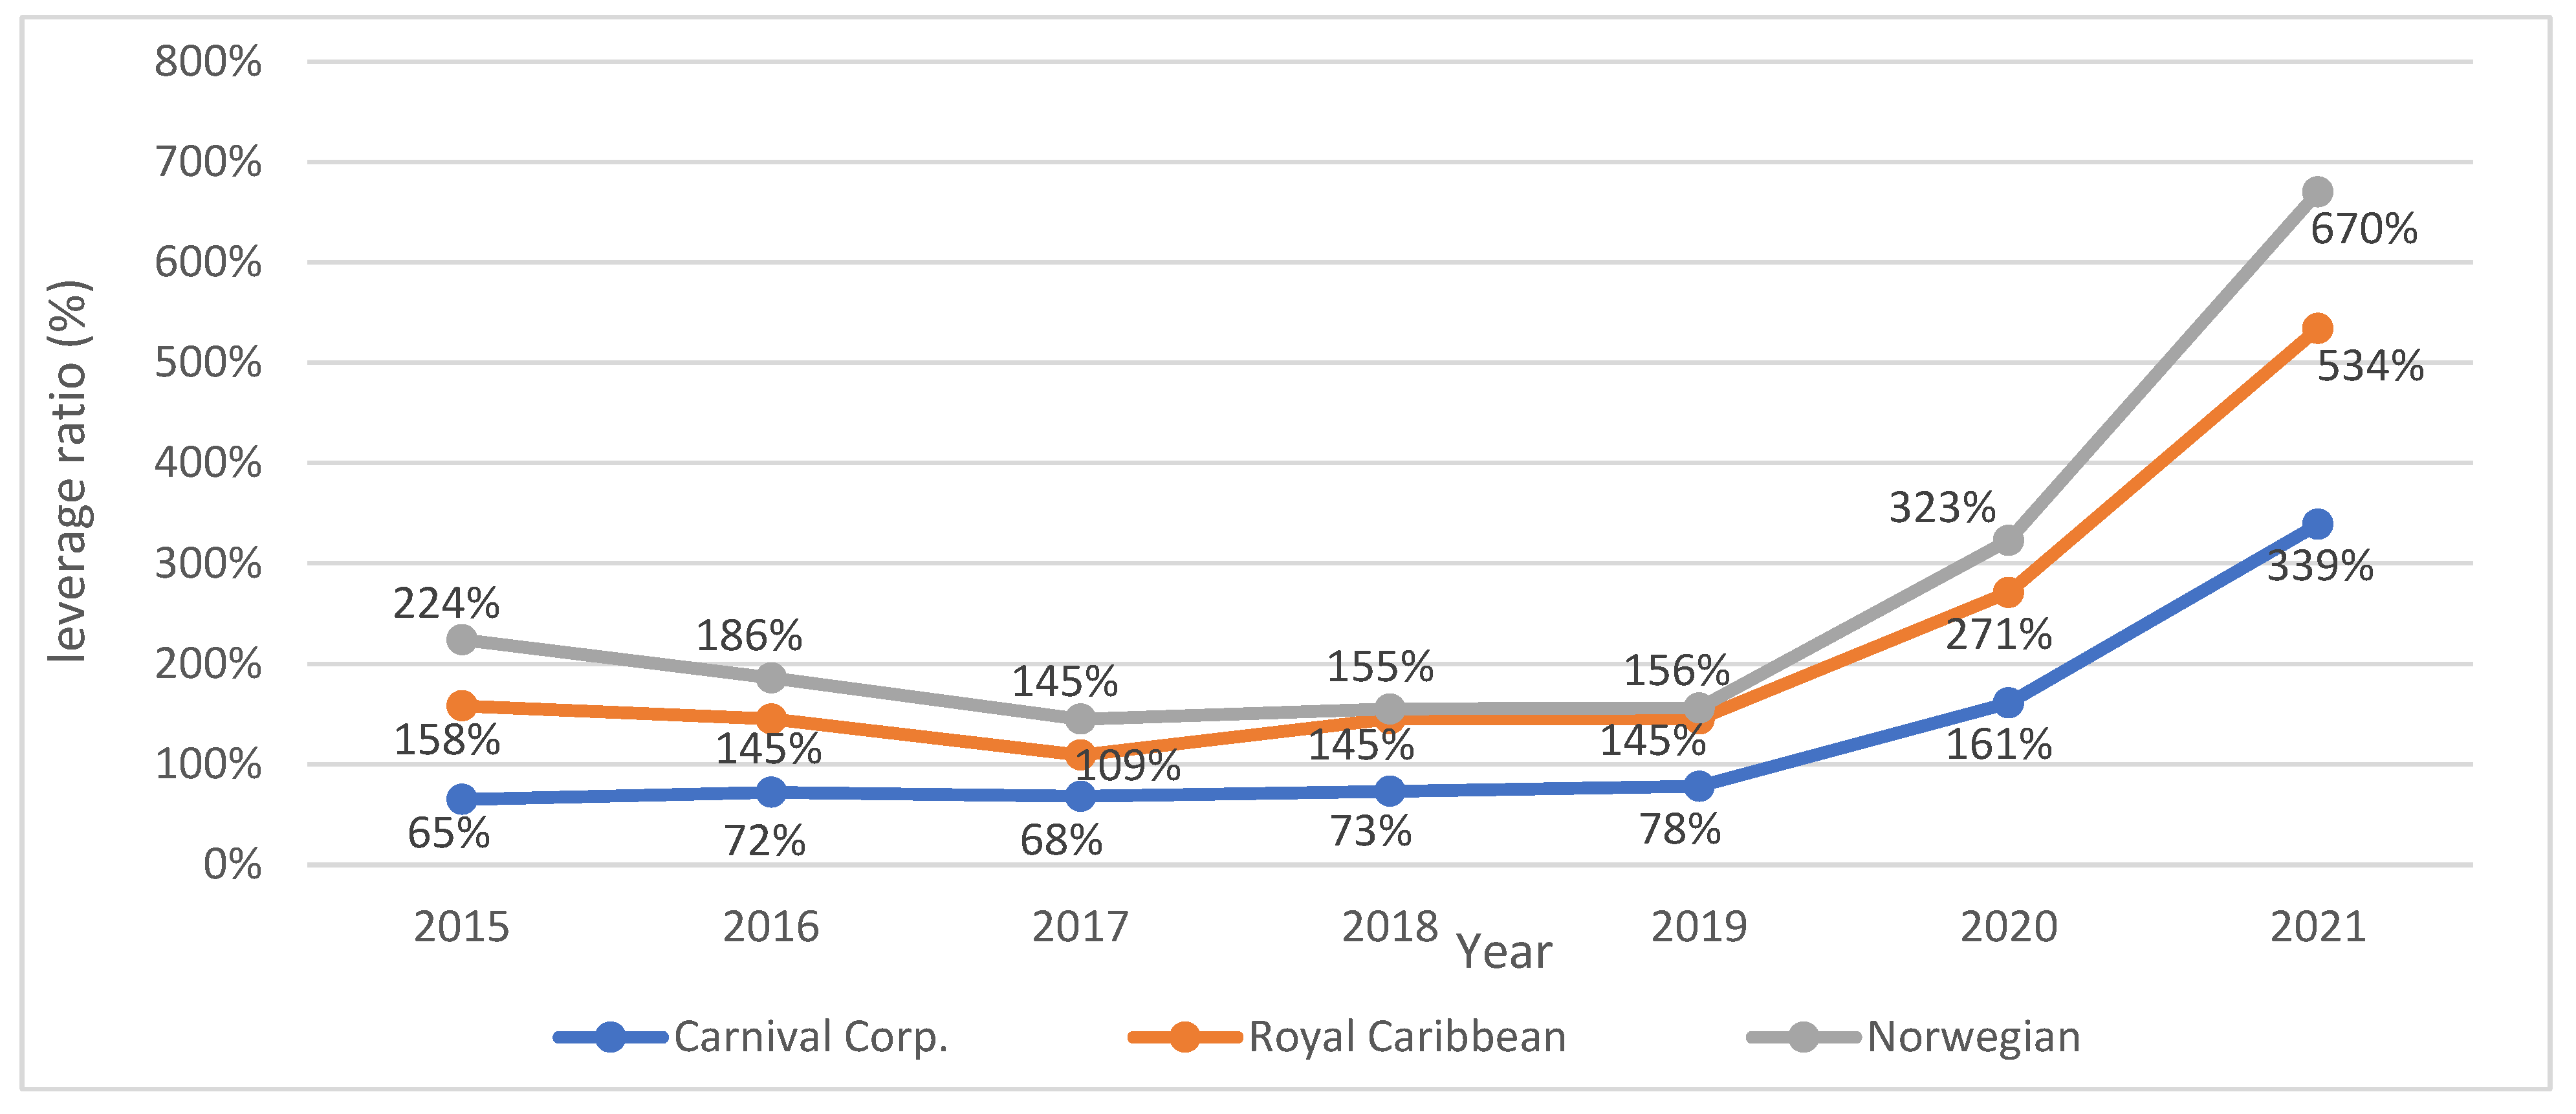
4.3.6. Financial Leverage Analysis of the World Top three Cruise Companies
Leverage Analysis of the World Top three Cruise Companies
The leverage ratio of the top three cruise companies in the world from 2015 to 2021 is shown in
Figure 19. The leverage ratio of the top three cruise companies in the world from 2015 to 2019 was between 65%–78%, 109%–158%, and 145%–224%, with a growth rate of 20% and a downward rate of 8.2% and 30.4%. Among them, the leverage ratio of Carnival Corporation was the lowest, followed by Royal Caribbean Corporation, and Norwegian Holiday Corporation was the highest from 2015 to 2019.
In 2020 and 2021, due to the COVID-19 pandemic and the temporary suspension of sailings, all the top three cruise companies operated at a considerable loss.
The leverage ratio of Carnival Corporation increased from 78% in 2019 to 161% in 2020 and was 339% in 2021, with a growth rate of 261% from 2019 to 2021. The leverage ratio of Royal Caribbean increased from 145% in 2019 to 271% in 2020 and was 534% in 2021, with a growth rate of 389% from 2019 to 2021. The leverage ratio of Norwegian Holiday increased from 156% in 2019 to 323% in 2020 and was 670% in 2021, with a growth rate of 514% from 2019 to 2021.
During the COVID-19 temporary short-term suspension period, the top three cruise companies significantly increased the number of liabilities to maintain their operations and to overcome the financial crisis, resulting in a substantial increase in the leverage ratio in 2020 and 2021. A sharply increased leverage ratio in a short time will create financial risks for the companies’ operations in the future. Therefore, these cruise companies should find ways to improve and adjust their financial structure after the pandemic to facilitate the sustainable operation of the companies.
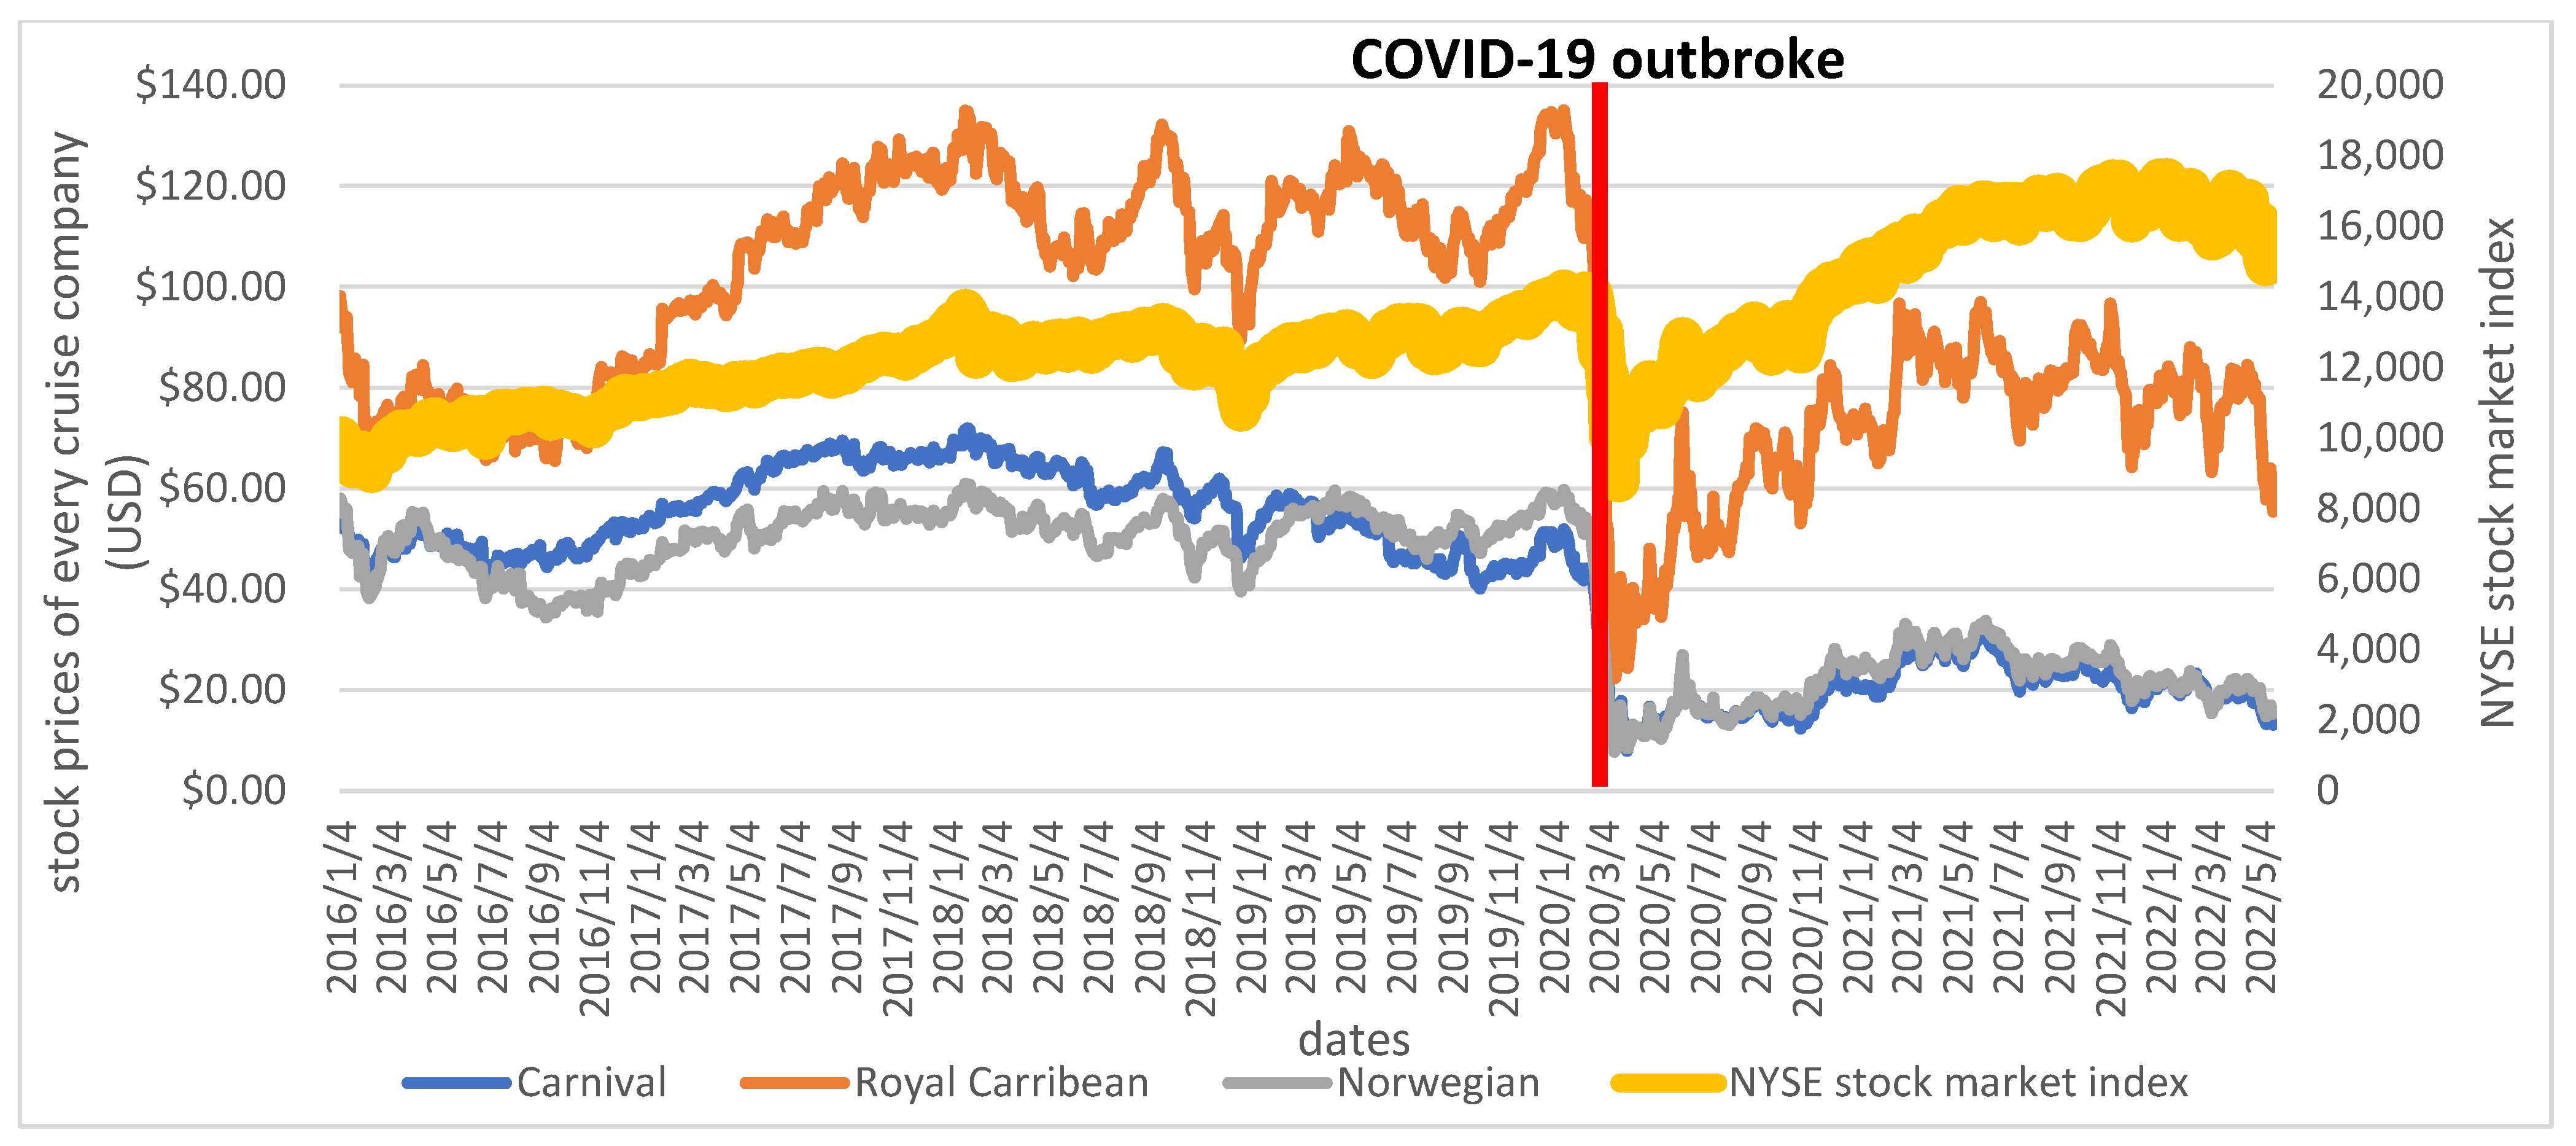
4.4. Stock Prices Trend Analysis of World’s Top Three Cruise Companies
Stock prices relate to operation, profitability, industry perspective, and markets supply and demand. According to analysis, the stock prices of Carnival Corporation & plc were shown in
Figure 20 to lie between
$40.13–
$71.94 from 2015–2019. Royal Caribbean International and Norwegian Cruise Line Holdings LTD. stock prices were
$65.48-
$134.98 and
$34.40–
$63.76, respectively. Among them, the stock prices of Royal Caribbean International were higher than the stock prices of Carnival Corporation & plc and Norwegian Cruise Line Holdings LTD.
The respective stock prices of the global top three cruise companies in the world, Carnival Corporation & plc, Royal Caribbean International, and Norwegian Cruise Line Holdings LTD., were $50.83, $179.92, and $58.41 on 31 December 2019, lost 74.1%, 82.1%, and 81.2%, and had closing prices of $13.17, $32.17 and $10.96 on 31 March 2020. These figures mean that, due to the impact of the COVID-19 pandemic, the market investors’ confidence in the cruise industry is shaken.
The respective stock prices of the global top three cruise companies in the world, Carnival Corporation & plc, Royal Caribbean International, and Norwegian Cruise Line Holdings LTD., were $13.17, $32.17, and $10.96 on 31 March 2020, increased by 40.4%, 139%, and 89.2%, and had closing prices of $18.49, $76.90, and $20.74 on 31 December 2021. These figures mean that with the coverage rate of vaccines in countries around the world has increased, investors’ confidence in the cruise tourism industry has gradually recovered.
The broader market index of the New York Stock Exchange was 13,010 points on 4 March 2020. Since then, due to the impact of the COVID-19 pandemic, it has continued to decline until 5 August 2020. After that, the market index was restored to the level before the COVID-19 pandemic outbreak. It raised to 13,000 points and continued to rise, and it has increased from 13,010 on 4 March 2020 to over 15,000 points in May 2022, a rise of over 15%.
In contrast, the closing stock prices of the global top three cruise companies in the world on 20 May 2022 were $13.13, $55.41, and $15.30, respectively; they were 40.4%, 69.8%, and 46.4% of the closing prices of $32.46, $79.36, and $33.0 on 4 March 2020, when the COVID-19 pandemic began.
It has been more than two years since the outbreak of the COVID-19 pandemic at the end of 2019. The economic and social life of countries in the world has gradually returned to normal after vaccine research, development, testing, and vaccination. The New York Stock Exchange’s broad market index returned to its pre-pandemic level on 5 August 2020, and after that, it continued to rise. The COVID-19 pandemic has severely impacted the operation of the world’s top three cruise companies. After two years, the stock price has not been able to return to the level before the COVID-19 outbreak. The cruise industry was one of the hardest-hit industries by the COVID-19 pandemic, and it still could not recover from the COVID-19 pandemic after two years.
4.5. Financial Management Risk Z-Score Model Analysis
According to Z-Score Model analysis, The Z-Score value of Carnival cruises, Royal Caribbean Cruises, and Norwegian Holiday Cruises are shown in
Table 9. There were all higher than 2.675 from 2015 to 2019, so the financial risk was low, and there is no possibility of bankruptcy from 2015 to 2019. But the Z-Score value of Carnival cruises was 1.663483 in 2020 and 1.099956 in 2021, and the company will likely pay much more attention to reducing financial risk.
4.6. Discussion on Various Aspects of the Impact of COVID-19 on the Cruise Industry
In addition to understanding the impact of the COVID-19 pandemic on the cruise industry from the perspective of financial analysis, there have been many discussions on various aspects of the sustainable development of the global cruise industry in the last two years, including:
Social activities for the safeguarding of Venice have pointed out the many negative impacts of cruise tourism, including water contamination, air pollution, underwater noise, and the ‘touristification’ of the city space and local identity. After the COVID-19 pandemic, forced resistance against cruises has gone global, and strong social movements have emerged in Mexico, the United States, Canada, The Bahamas, and Spain [
51].
The luxury yacht industry responded well to its market at the outset of the pandemic and will continue on this path in both luxury and sporting yacht categories. The present outlook for cruising is not good, so a new approach and strategy must be put in place to develop new products [
52].
The age of globalization is the age of universal contagion [
53]. The public-health risk of cruise ships has become the core problem in developing the cruise economy. The records of the Vessel Sanitation Program (VSP) of the Centers for Disease Control and Prevention (CDC) show that cruise public-health and safety events are a yearly occurrence [
54].
Solving global public-health problems in different periods requires different governance models and an international health legal system matching the governance models. In the context of globalization, pandemic-prevention work can no longer be regarded as the responsibility of a single country. The improvement of core capacities can be carried out through surveillance of cruise ships and risk assessment, medical examinations on cruise travelers, cruise design, and cruise tourism management [
55].
As required by Article 13 (1) of the IHR, all State parties shall develop, strengthen and maintain their capacity to respond promptly and effectively to public health risks and emergencies of international concern (PHEIC). According to the above requirements, coastal States shall make pandemic response plans for cruise ships in advance [
56].
Cruise ships have limited space, and many passenger cabins are even without openable windows. Most of the current air conditioning and ventilation systems cannot prevent virus transmission onboard. Therefore, cruise ship design plays an important role and can be used to help reduce the spread of diseases. To achieve this goal, fewer and larger cabins should be created, and more independent dining spaces and fewer seats should be designed to increase personal space [
57].
Cruise tourism management is another aspect that can be improved to control and reduce the spread of infectious diseases. Cruise lines shall formulate emergency management plans for cruise ships’ public-health emergencies and strengthen cruise ships’ health supervision and disease-prevention management [
58].
Infectious disease outbreaks in large cruise ships may lead to a surge in the number of infected people onboard in the short term. The treatment of confirmed cases and response to severe outbreaks rely on the port-state government, and massive port transfer and treatment facilities are required. Communication and coordinated response with port supervision departments should be strengthened [
59].
Customers’ trust in pandemic management will also affect their intention to use cruise services after the COVID-19 pandemic. Passengers can put more effort into financial- and health-management strategies because they have a more significant influence than other relational-bonding strategies. Cruise operators should implement strict and adequate precautions before, during, and even after cruise trips to ease customers’ worries [
60].
From a managerial point of view, it is evident that cruise companies will have higher costs derived from the new requirements of COVID-19 [
61]. In all cases, the image of cruise companies [
62] and the way they communicate after a crisis [
63] will play a vital role in the recovery of the cruise industry.
5. Conclusions
Although many articles describe the impact on the tourism industry by the COVID-19 pandemic, this paper analyzes the considerable influence and damage caused by the COVID-19 pandemic on the cruise tourism industry in the past two years since the outbreak of the COVID-19 pandemic. The study analyzes the statistical data of the top three cruise companies that account for nearly 74.6%–91.8% of the worldwide cruise tourism for 2015–2021.
The financial analysis includes economic structure, solvency, operating ability, profitability, and financial leverage. We also analyze the economic indicators of the top three cruise companies with frequency analysis, correlation analysis, regression analysis, and the financial management risks of the top three cruise companies using the Z-Score Model.
This paper is very important and has made a significant contribution to the sustainable development of the cruise industry. Through the research and analysis of this paper, people can understand the reduction in the number of cruise passengers caused by the suspension of cruise sailings due to the COVID-19 pandemic and the level of enormous impact and damage on cruise tourism.
The COVID-19 pandemic began at the end of 2019. Many countries have entry bans on citizens or tourists from COVID-19 pandemic areas. They announced bans on the entry of cruise ships, and the policy has had a severe influence on the development of the cruise industry from March 2020 until July 2021. The isolation, entry restrictions, and travel bans have greatly affected the global cruise tourism industry and the global economy for over two years. The conclusions are as follows:
1. The world’s top three cruise companies are Carnival Cruises, Royal Caribbean Cruises, and Norwegian Holiday Cruises. Based on these companies’ respective passenger numbers, their global market share is 43.4%, 22.1%, and 9.1%, a total of 74.6% in 2019, and 60.6%, 22.6%, and 8.7%, a total of 91.8% in 2020. Their operations cover nearly three quarters and over ninety percent of cruise tourists worldwide. The impact and challenges of the COVID-19 pandemic on the global cruise tourism industry development are profound. From mid-March 2020 to July 2021, the temporary suspension of navigation has resulted in a decrease in passenger numbers. International Cruises passenger numbers decreased by 23.904 million (80.56%) from 29.673 million in 2019 to 5.769 million in 2020.
2. The temporary suspension of navigation has resulted in operating losses and in operating losses of US$10.236 billion, US$9.501 billion for Carnival Cruises; US$5.8 billion, US$5.26 billion for Royal Caribbean Cruises; and US$4.012 billion, US$4.507 billion for Norwegian Holiday Cruises in 2020 and 2021, respectively.
3. The respective EPS of Carnival cruises, Royal Caribbean Cruises, and Norwegian Holiday Cruises have decreased from US$4.34, US$8.97, and US$4.33 in 2019 to US$(13.20), US$(27.05), and US$(15.75) in 2020; and US$(8.46), US$(20.89), and US$(12.33) in 2021.
4. According to the Z-Score Model analysis, the financial risk of the top three cruise companies was low; they were all higher than 2.675, and there was no possibility of bankruptcy from 2015 to 2019. But after the COVID-19 pandemic, the Z-Score value of Carnival cruises was 1.663483 and 1.099956 in 2020 and 2021, respectively, and the company will likely pay much more attention to improving the financial structure in order to reduce financial risk.
5. From 31 December 2019 to 31 March 2020, the stock prices of the top three cruise companies lost 74.1%, 82.1%, and 81.2%, respectively. These figures mean that, due to the outbreak of the COVID-19 pandemic, the market investors’ confidence in the cruise industry is shaken.
After a significant drop, the New York Stock Exchange’s broad market index returned to its pre-pandemic level on 5 August 2020, and after that, it continued to rise. The COVID-19 epidemic has severely impacted the operation of the world’s global top three cruise companies. After two years, the stock price has not been able to return to the level it was at before the COVID-19 pandemic. The cruise industry was one of the hardest-hit industries by the COVID-19 pandemic, and it still could not recover from the COVID-19 pandemic after two years.
6. According to scientific empirical research results, the decrease in the number of cruise passengers will reduce the operating income, net operating profit, rate earned on total assets, rate earned on total equity, and earnings per share of cruise companies. And it will increase the debt-to-assets ratio, working capital, and leverage ratio.
Although reducing operating costs and expenses will help reduce the company’s debt ratio, the key to improving the deteriorating financial situation of the cruise industry is the increase in the number of cruise passengers. A more positive action for the cruise industry to recover from COVID-19 is to improve cruise tourism’s environmental hygiene and pandemic-prevention strategy and find ways to bring back nearly 30 million cruise passengers to consume and experience cruise travel once again.
7. Because of the enormous impact and damage caused to the cruise industry by the COVID-19 pandemic, we must learn lessons from it. It is suggested that the cruise industry should take effective preventive strategies against highly infectious diseases, deploy these strategies ahead of time, and strengthen the resilience and epidemic prevention ability of the cruise industry in order to achieve the goal of sustainably developing the cruise industry.
8. The global cruise industry is an essential part of the blue economy. How the cruise industry recovers from the severe impact of COVID-19 involves a wide range of aspects. Steady financial development is the cornerstone of the sustainable development of the cruise industry.
Further studies should address the following issues: how to improve the core governance capabilities of epidemic disasters in various countries, especially coastal islands; how to strengthen the safety measures for epidemic prevention in the cruise industry; how to strengthen cruise health supervision and disease prevention management, cruise tourism management and governance, and environmental protection measures; how to formulate post-epidemic era marketing strategies, design attractive new products, regain the confidence of tourists, and attract consumers to return to consumption. These need more experts and scholars involved in relevant research to provide more suggestions to the governments, cruise companies, cruise industry, and stakeholders related to the cruise industry supply chain.


