
Prioritizing Cleaner Production Actions towards Circularity: Combining LCA and Emergy in the PET Production Chain

 ,
,  and
and
Abstract
:1. Introduction
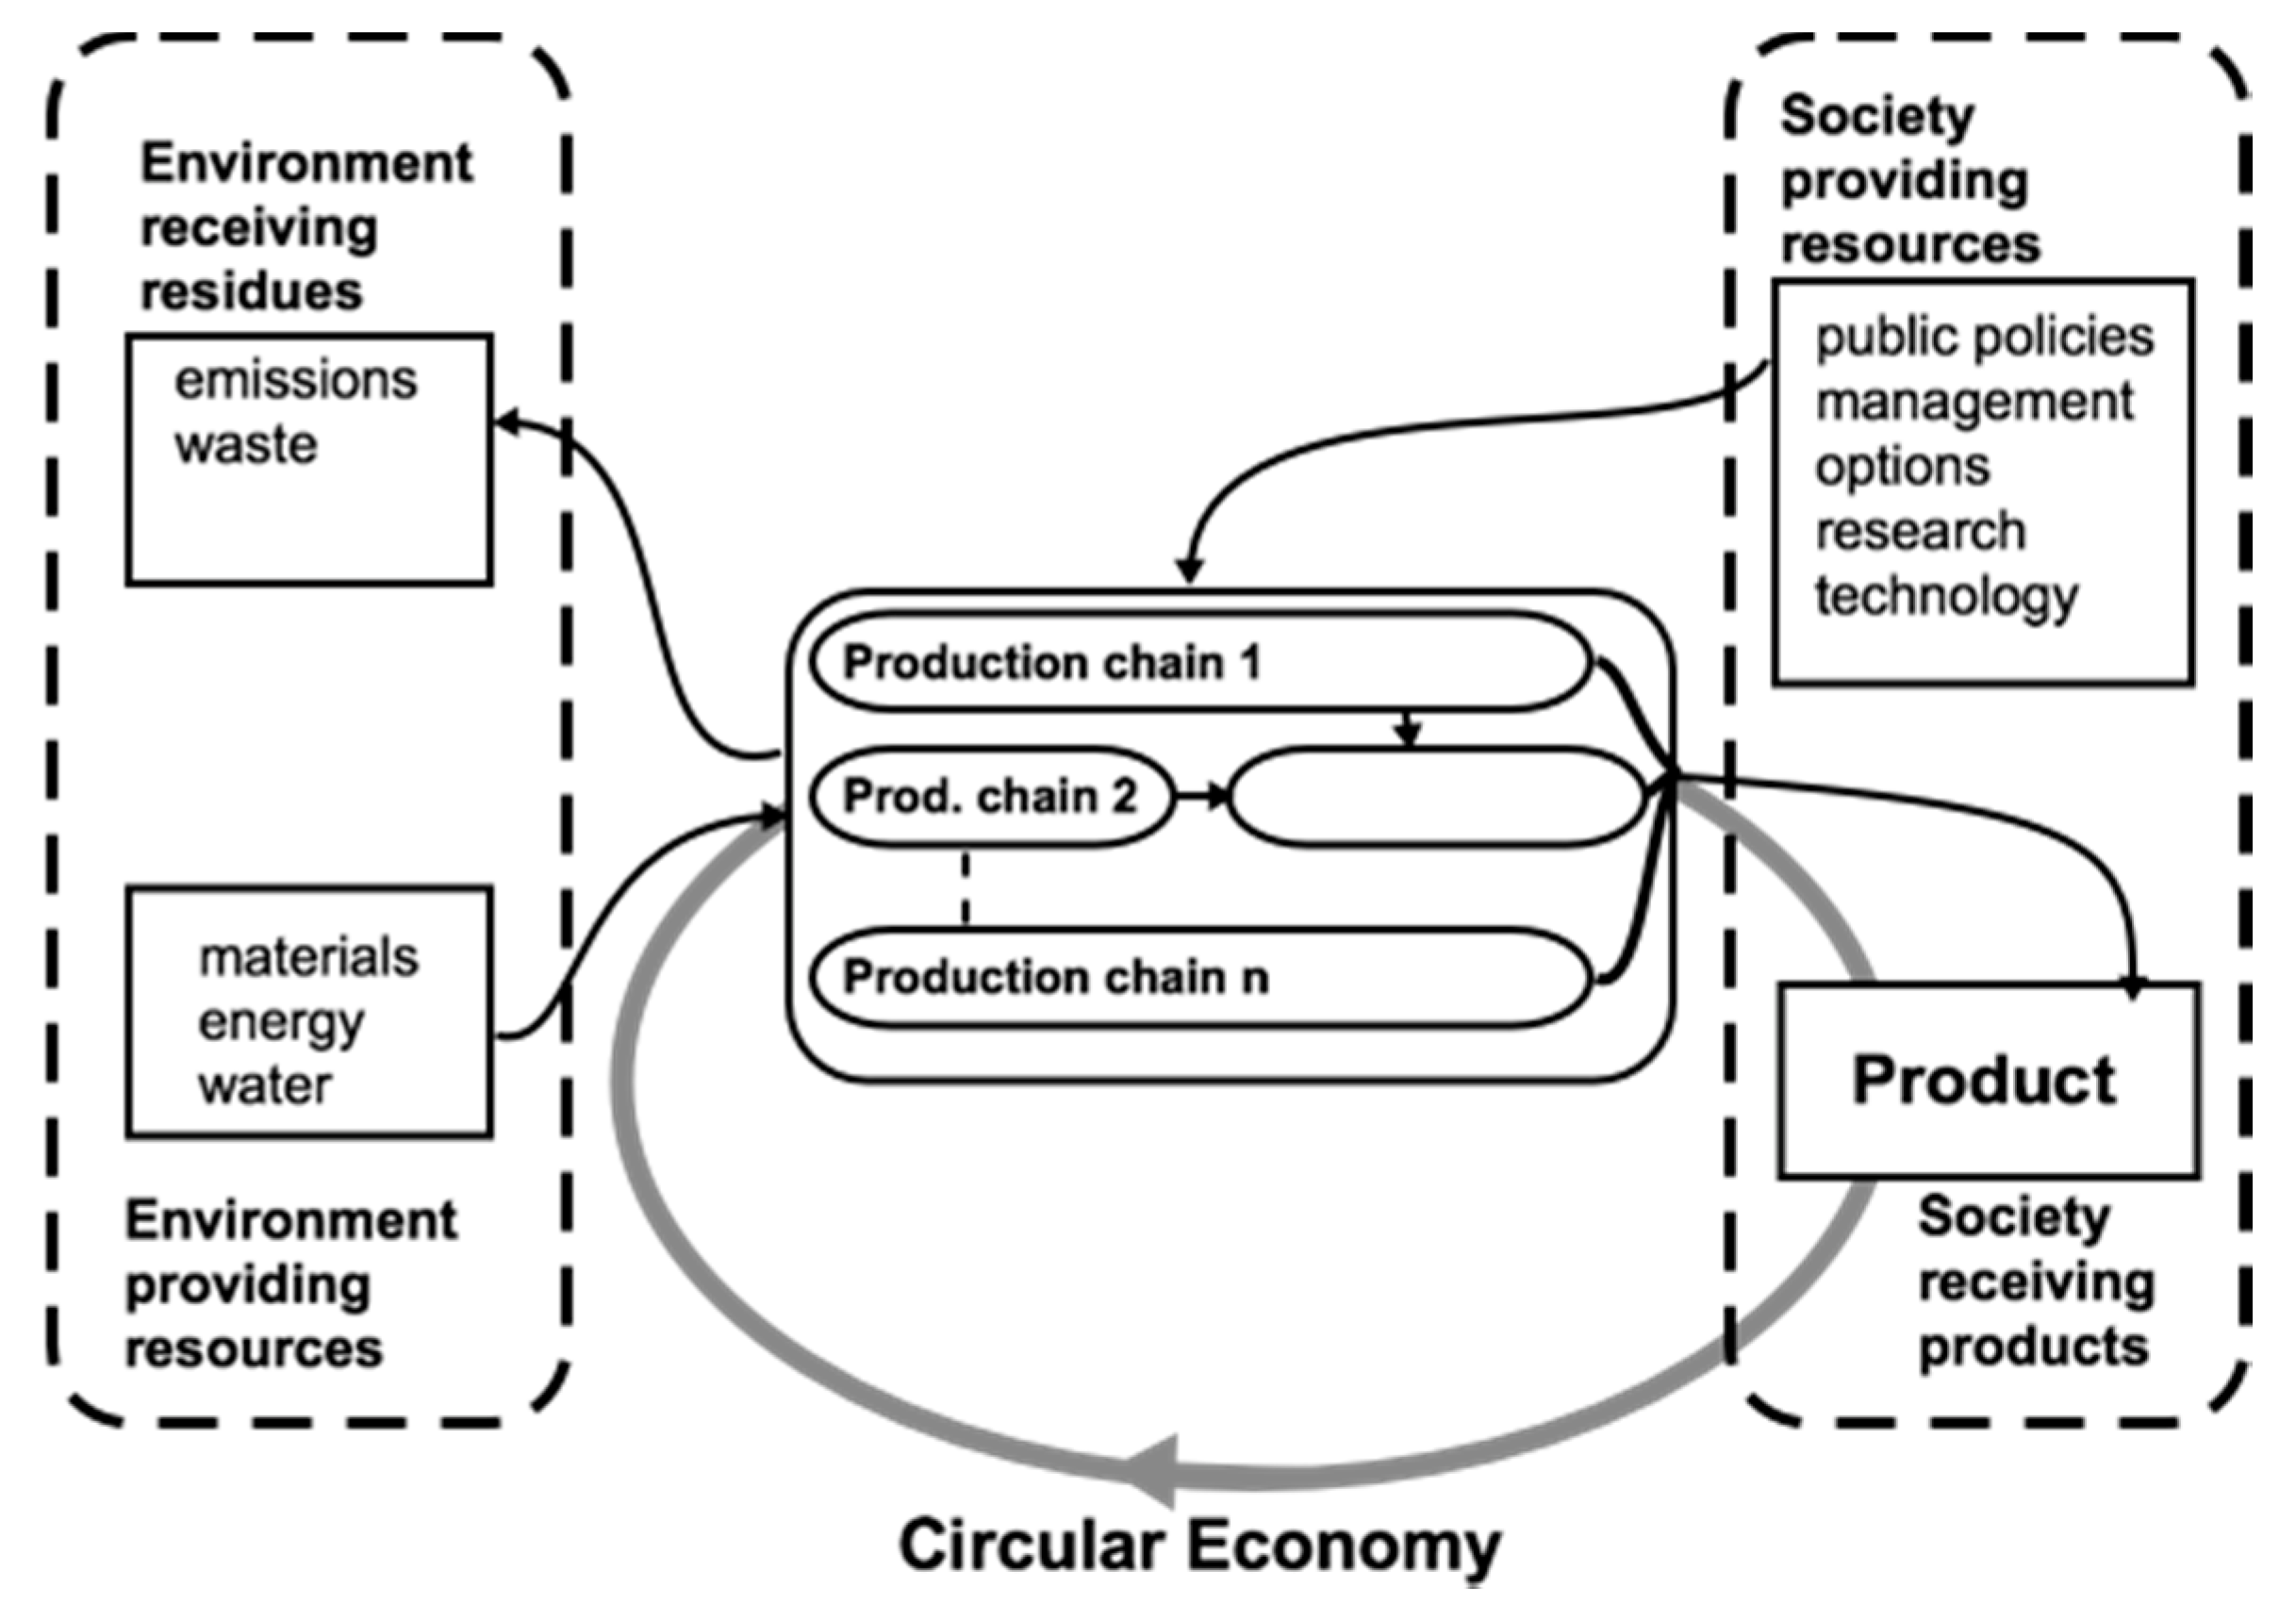
2. Methods
Calculating UEVs from LCIs of the Explored Petrochemicals
3. Results
3.1. Calculations and Analysis of the LCI-Based UEVs
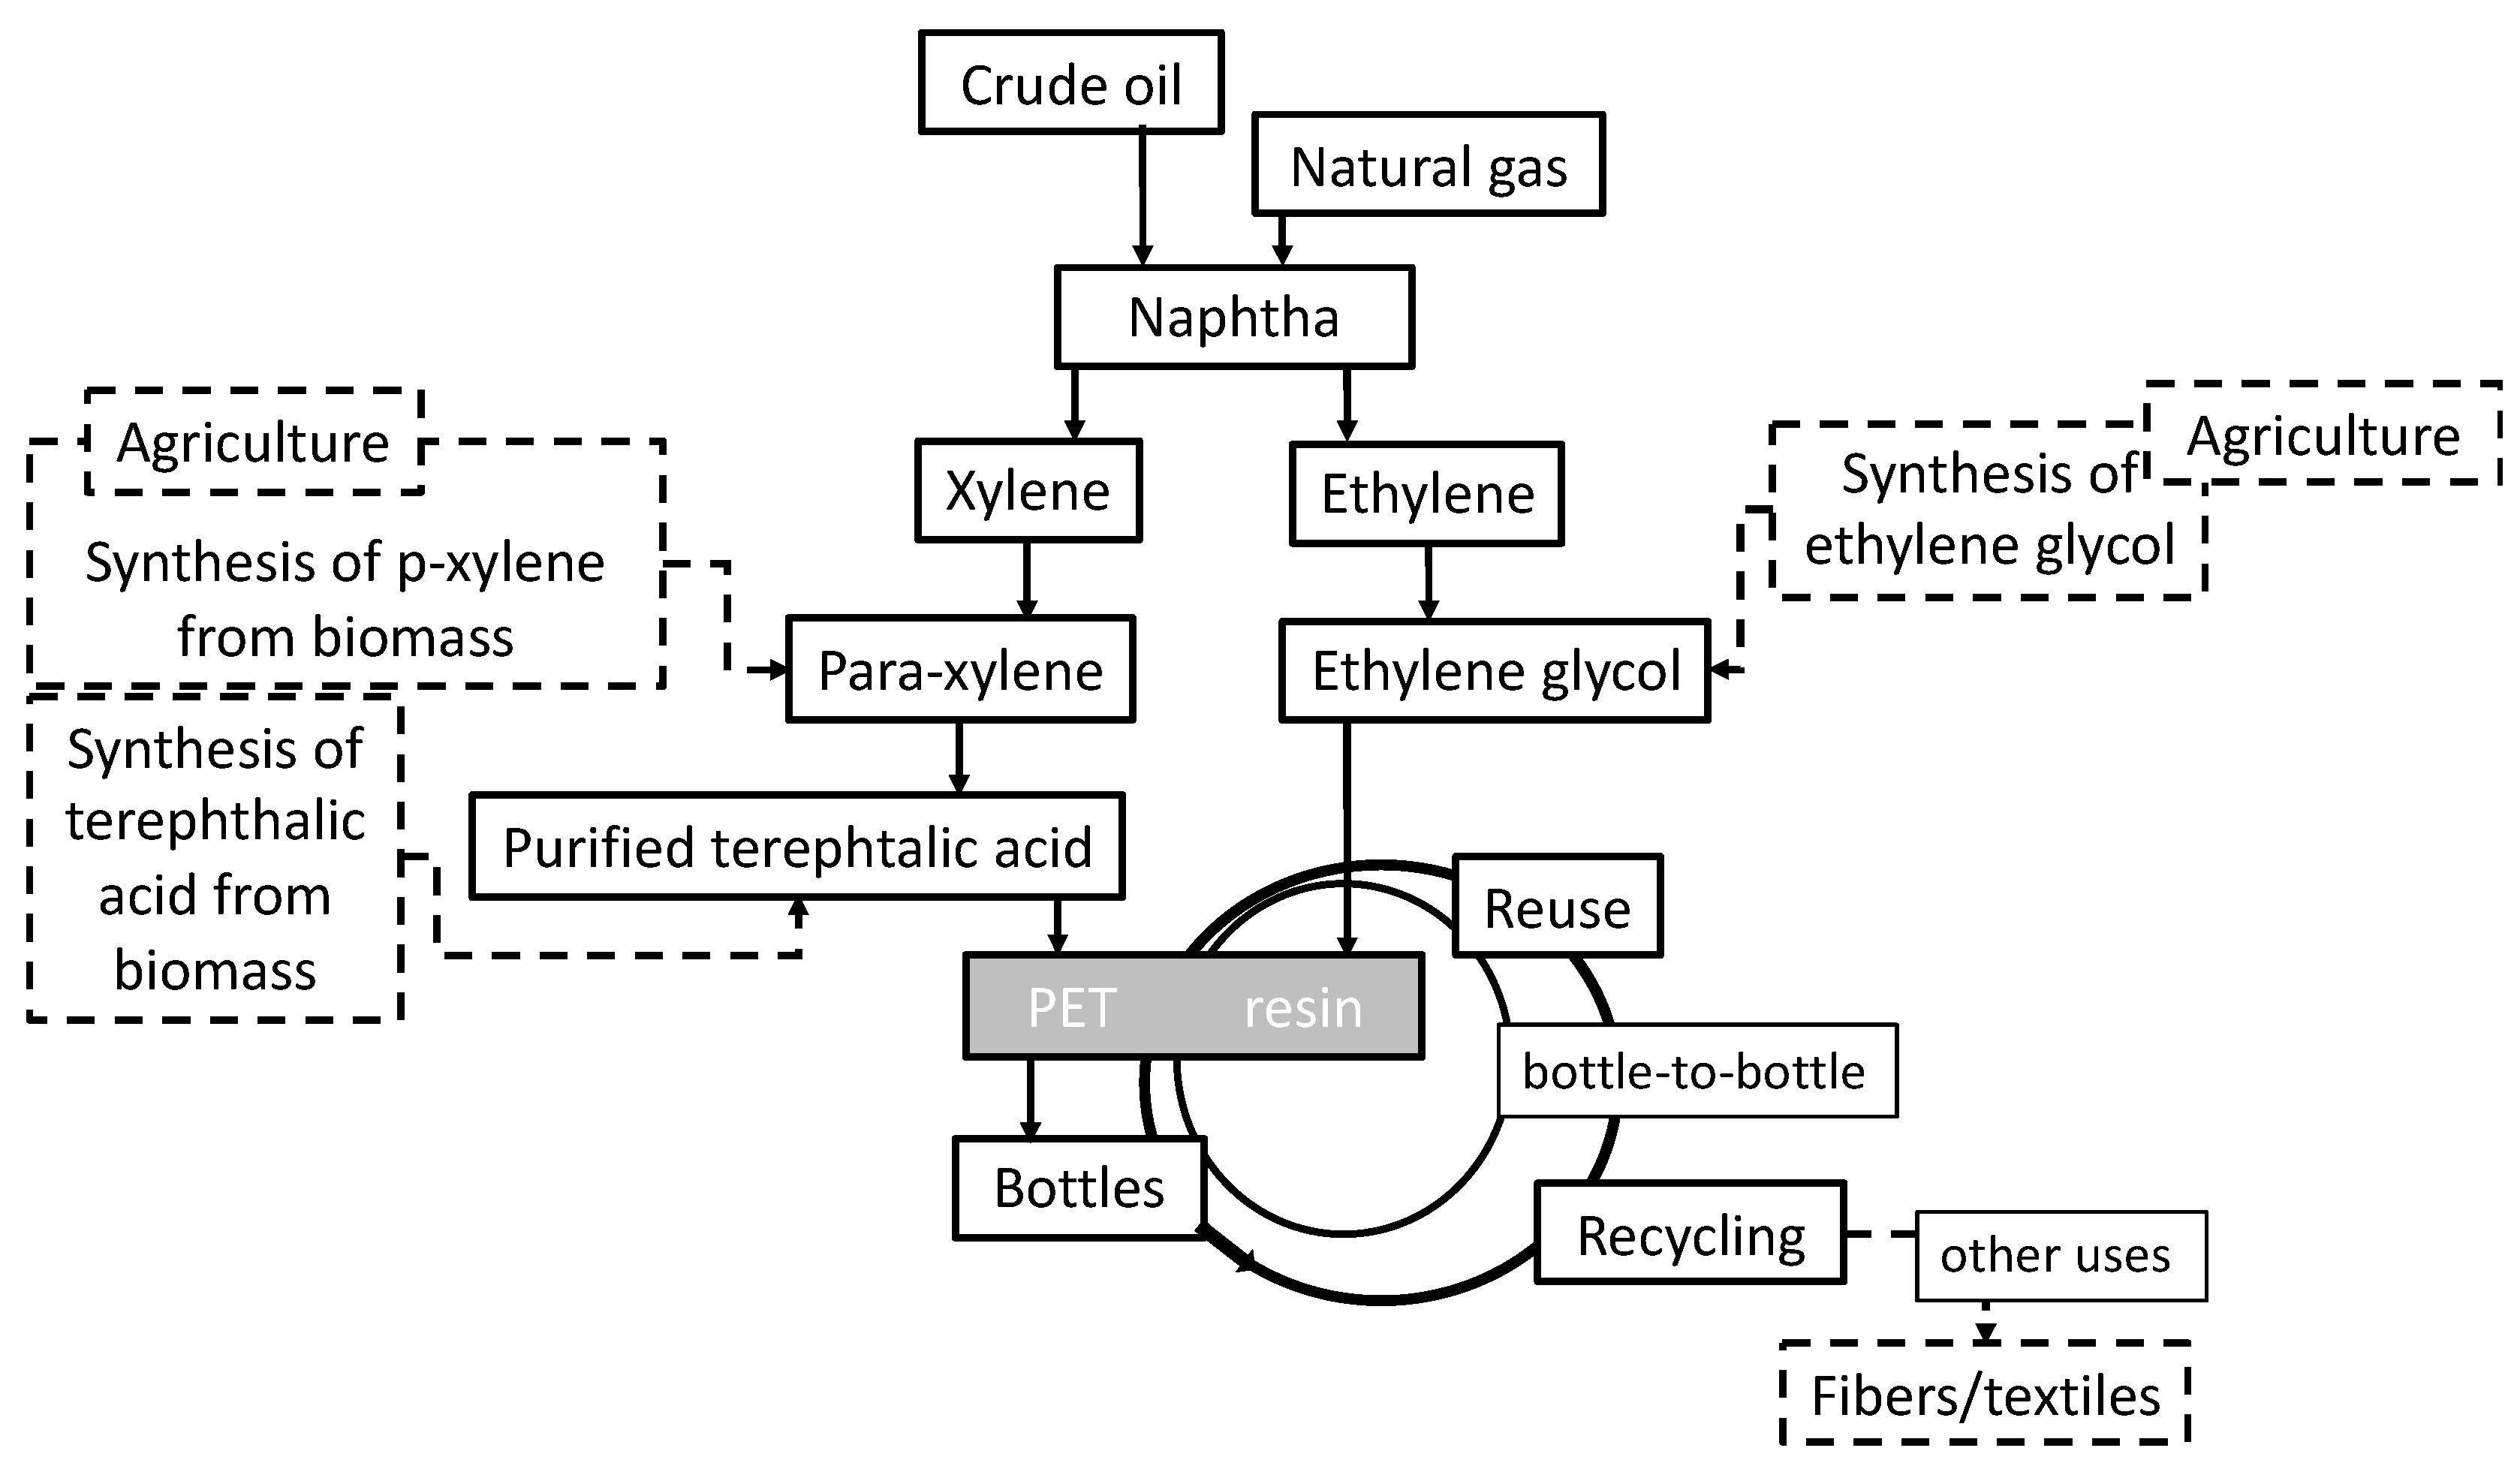
3.2. The Potential Use of UEVs to Support CP Actions toward a Circular Economy
4. Discussion
4.1. The Importance of Accurate and Easy to Calculate UEVs
4.2. How UEVs May Help to Improve the Circularity in the PET Production Chain
5. Limitations of This Study and Suggestions for Future Research
6. Conclusions
Supplementary Materials
Author Contributions
Funding
Acknowledgments
Conflicts of Interest
References
- Gbededo, M.A.; Liyanage, K.; Garza-Reyes, J.A. Towards a Life Cycle Sustainability Analysis: A systematic review of approaches to sustainable manufacturing. J. Clean. Prod. 2018, 184, 1002–1015. [Google Scholar] [CrossRef] [Green Version]
- Korhonen, J.; Honkasalo, A.; Seppälä, J. Circular economy: The concept and its limitations. Ecol. Econ. 2018, 143, 37–46. [Google Scholar] [CrossRef]
- Keijer, T.; Bakker, V.; Slootweg, J.C. Circular chemistry to enable a circular economy. Nat. Chem. 2019, 11, 190–195. [Google Scholar] [CrossRef] [PubMed]
- Ingrao, C.; Faccilongo, N.; Di Gioia, L.; Messineo, A. Food waste recovery into energy in a circular economy perspective: A comprehensive review of plant operation and environmental assessment asp. J. Clean. Prod. 2018, 184, 869–892. [Google Scholar] [CrossRef]
- Arbolino, R.; Carlucci, F.; De Simone, L.; Ioppolo, G.; Yigitcanlar, T. The policy diffusion of environmental performance in the European Countries. Ecol. Indic. 2018, 89, 130–138. [Google Scholar] [CrossRef]
- Geissdoerfer, M.; Savaget, P.; Bocken, N.M.; Hultink, E.J. The Circular Economy—A new sustainability paradigm? J. Clean. Prod. 2017, 143, 757–768. [Google Scholar] [CrossRef] [Green Version]
- Moraga, G.; Huysveld, S.; Mathieux, F.; Blengini, G.A.; Alaerts, L.; Acker, K.; Meester, S.; Dewulf, J. Circular economy indicators: What do they measure? Resour. Conserv. Recycl. 2019, 146, 452–461. [Google Scholar] [CrossRef]
- Hysa, E.; Kruja, A.; Rehman, N.U.; Laurenti, R. Circular economy innovation and environmental sustainability impact on economic growth: An integrated model for sustainable development. Sustainability 2020, 12, 4831. [Google Scholar] [CrossRef]
- Ingrao, C.; Failla, S.; Arcidiacono, C. A comprehensive review of environmental and operational issues of constructed wetland systems. Curr. Opin. Environ. Sci. Health 2020, 13, 35–45. [Google Scholar] [CrossRef]
- CE Action Plan. 2020. Available online: https://ec.europa.eu/environment/circular-economy/pdf/new_circular_economy_action_plan.pdf (accessed on 12 March 2021).
- EU. 2019. Available online: https://ec.europa.eu/environment/circular-economy/pdf/sustainable_products_circular_economy.pdf (accessed on 12 March 2021).
- Chemical Substances, Chemicals and our Environment. 2011. Available online: http://www.chemicalsubstanceschimiques.gc.ca/fact-fait/chem-chim_environ-eng.php (accessed on 8 December 2019).
- Bargali, K.; Manral, V.; Padalia, K.; Bargali, S.S.; Upadhyay, V.P. Effect of vegetation type and season on microbial biomass carbon in Central Himalayan forest soils. India Catena 2018, 171, 125–135. [Google Scholar] [CrossRef]
- Bargali, S.S.; Padalia, K.; Bargali, K. Effects of tree fostering on soil health and microbial biomass under different land use systems in central Himalaya. Land Degrad. Dev. 2019, 30, 1984–1998. [Google Scholar] [CrossRef]
- Manral, V.; Bargali, K.; Bargali, S.S.; Jhariya, M.K.; Padalia, K. Relationships between soil and microbial biomass properties and annual flux of nutrients in Central Himalayan forests, India. Land Degrad. Dev. 2022, 1–12. [Google Scholar] [CrossRef]
- Bargali, S.S. Weight loss and nitrogen release in decomposing wood litter in an age series of eucalypt plantation. Soil Biol. Biochem. 1996, 28, 699–702. [Google Scholar] [CrossRef]
- Bargali, S.S.; Singh, S.P.; Singh, R.P. Pattern of weight loss and nutrient release in decomposing leaf litter in an age series of eucalypt plantations. Soil Biol. Biochem. 1993, 25, 1731–1738. [Google Scholar] [CrossRef]
- Bargali, S.S.; Shukla, K.; Singh, L.; Ghosh, L.; Lakhera, M.L. Leaf litter decomposition and nutrient dynamics in four tree species of Dry Deciduous Forest. Trop. Ecol. 2015, 56, 57–66. [Google Scholar]
- Karki, H.; Bargali, K.; Bargali, S.S. Spatial and Temporal Trends in Soil N-Mineralization Rates under the Agroforestry Systems in Bhabhar belt of Kumaun Himalaya, India. Agrofor. Syst. 2021, 95, 1603–1617. [Google Scholar] [CrossRef]
- PlasticsEurope. 2020. Available online: https://www.plasticseurope.org/en (accessed on 10 January 2021).
- Tournier, V.; Topham, C.M.; Gilles, A.; David, B.; Folgoas, C.; Moya-Leclair, E.; Kamionka, E.; Desrousseaux, M.-L.; Texier, H.; Gavalda, S.; et al. An engineered PET depolymerase to break down and recycle plastic bottles. Nature 2020, 580, 216–219. [Google Scholar] [CrossRef]
- Al-Salem, S.; Lettieri, P.; Baeyens, J. Recycling and recovery routes of plastic solid waste (PSW): A review. Waste Manag. 2009, 29, 2625–2643. [Google Scholar] [CrossRef]
- Zhang, X.; Zhang, W.; Xie, J.; Zhang, C.; Fu, J.; Zhao, P. Automatic magnetic projection for one-step separation of mixed plastics using ring magnets. Sci. Total Environ. 2021, 786, 147217. [Google Scholar] [CrossRef]
- Scheirs, J. Polymer Recycling: Science, Technology, and Applications; Wiley Series in Polymer Science; Wiley: Hoboken, NJ, USA, 1998. [Google Scholar]
- George, N.; Kurian, T. Recent developments in the chemical recycling of postconsumer poly (ethylene terephthalate) waste. Ind. Eng. Chem. Res. 2014, 53, 14185–14198. [Google Scholar] [CrossRef]
- Barnard, E.; Rubio Arias, J.J.; Thielemans, W. Chemolytic depolymerisation of PET: A review. Green Chem. 2021, 23, 3765–3789. [Google Scholar] [CrossRef]
- Goto, M. Chemical recycling of plastics using sub- and supercritical fluids. J. Supercrit. Fluids 2009, 47, 500–507. [Google Scholar] [CrossRef]
- Oliveux, G.; Bailleul, J.L.; La Salle, E.L. Chemical recycling of glass fibre reinforced composites using subcritical water. Compos. Part A—Appl. Sci. 2012, 43, 1809–1818. [Google Scholar] [CrossRef]
- Sagong, H.-Y.; Son, H.F.; Seo, H.; Hong, H.; Lee, D.; Kim, K.-J. Implications for the PET decomposition mechanism through similarity and dissimilarity between PETases from Rhizobacter gummiphilus and Ideonella sakaiensis. J. Hazard. Mater. 2021, 416, 126075. [Google Scholar] [CrossRef] [PubMed]
- Ingrao, C.; Lo Giudice, A.; Tricase, C.; Rana, R.; Mbohwa, C.; Siracusa, V. Recycled-PET fibre based panels for building thermal insulation: Environmental impact and improvement potential assessment for a greener production. Sci. Total Environ. 2014, 493, 914–929. [Google Scholar] [CrossRef] [PubMed]
- da Silva, T.R.; de Azevedo, A.R.G.; Cecchin, D.; Marvila, M.T.; Amran, M.; Fediuk, R.; Vatin, N.; Karelina, M.; Klyuev, S.; Szelag, M. Application of plastic wastes in construction materials: A review using the concept of life-cycle assessment in the context of recent research for future perspectives. Materials 2021, 14, 3549. [Google Scholar] [CrossRef]
- Ali, S.S.; Elsamahy, T.; Koutra, E.; Zhu, D.; Sun, J. Degradation of conventional plastic wastes in the environment: A review on current status of knowledge and future perspectives of disposal. Sci. Total Environ. 2021, 771, 144719. [Google Scholar] [CrossRef]
- Basuhi, R.; Moore, E.; Gregory, J.; Gesing, A.; Olivetti, E.A. Environmental and economic implications of U.S. postconsumer plastic waste management. Resour. Conserv. Recycl. 2021, 167, 105391. [Google Scholar] [CrossRef]
- Yao, D.; Yang, H.; Hu, Q.; Chen, Y.; Chen, H.; Williams, P.T. Carbon nanotubes from post-consumer waste plastics: Investigations into catalyst metal and support material characteristics. Appl. Catal. B Environ. 2021, 280, 119413. [Google Scholar] [CrossRef]
- Falcone, P.M.; Imbert, E. Tackling Uncertainty in the Bio-Based Economy. Int. J. Stand. Res. 2019, 17, 74–84. [Google Scholar] [CrossRef]
- Majer, S.; Wurster, S.; Moosmann, D.; Ladu, L.; Sumfleth, B.; Thrän, D. Gaps and Research Demand for Sustainability Certification and Standardisation in a Sustainable Bio-Based Economy in the EU. Sustainability 2018, 10, 2455. [Google Scholar] [CrossRef] [Green Version]
- Bishop, G.; Styles, D.; Lens, P.N.L. Environmental performance comparison of bioplastics and petrochemical plastics: A review of life cycle assessment (LCA) methodological decisions. Resour. Conserv. Recycl. 2021, 168, 105451. [Google Scholar] [CrossRef]
- Schwarz, A.E.; Ligthart, T.N.; Godoi Bizarro, D.; Vreugdenhil, B.; van Harmelen, T. Plastic recycling in a circular economy; determining environmental performance through an LCA matrix model approach. Waste Manag. 2021, 121, 331–342. [Google Scholar] [CrossRef] [PubMed]
- Plastics-Recyclers-Europe. 2020. Available online: https://plastics-recyclers-europe.prezly.com/closing-the-loop-with-pet-bottle-to-bottle-recycling-projected-to-grow (accessed on 8 December 2019).
- PlasticsEurope. Eco-Profiles and Environmental Product Declarations of the European Plastics Manufacturers–Polyethylene Terephthalate (PET) Bottle-Grade; PlasticsEurope: Brussels, Belgium, 2019. [Google Scholar]
- González-Castaño, A.; Bandoni, J.A.; Diaz, M.S. Multi-Objective Optimisation in a Petrochemical Complex with LCA considerations. Comput. Aided Chem. Eng. 2016, 38, 1497–1502. [Google Scholar]
- Zandkarimkhani, S.; Nasiri, M.M.; Heydari, J. Sustainable open-loop supply chain network design considering location routing problem: A hybrid approach based on FAHP, FTOPSIS, and mathematical programming. Int. J. Logist. Syst. Manag. 2020, 36, 92–123. [Google Scholar]
- Winans, K.S.; Macadam-Somer, I.; Kendall, A.; Geyer, R.; Marvinney, E. Life cycle assessment of California unsweetened almond milk. Int. J. Life Cycle Assess. 2020, 25, 577–587. [Google Scholar] [CrossRef] [Green Version]
- Błażejewski, T.; Walker, S.R.; Muazu, R.I.; Rothman, R.H. Reimagining the milk supply chain: Reusable vessels for bulk delivery. Sustain. Prod. Consum. 2021, 27, 1030–1046. [Google Scholar] [CrossRef]
- Odum, H.T. Environmental Accounting: Emergy and Environmental Decision Making; John Wiley & Sons: New York, NY, USA, 1996. [Google Scholar]
- Pulselli, F.M.; Patrizi, N.; Focardi, S. Calculation of the unit emergy value of water in an Italian watershed. Ecol. Model. 2011, 222, 2929–2938. [Google Scholar] [CrossRef]
- Bastianoni, S.; Campbell, D.; Susani, L.; Tiezzi, E. The Solar Transformity of Oil and Petroleum Natural Gas. Ecol. Model. 2005, 86, 212–220. [Google Scholar] [CrossRef]
- Bastianoni, S.; Campbell, D.E.; Ridolfi, R.; Pulselli, F.M. The Solar Transformity of Petroleum Fuels. Ecol. Model. 2009, 220, 40–50. [Google Scholar] [CrossRef] [Green Version]
- Sha, S.; Melin, K.; de Kokkonen, D.V.; Hurme, M. Solar Energy Footprint of Ethylene Processes. Ecol. Eng. 2015, 82, 15–25. [Google Scholar] [CrossRef]
- Brown, M.T.; Protano, G.; Ulgiati, S. Assessing geobiosphere work of generating global reserves of coal, crude oil, and natural gas. Ecol. Model. 2011, 222, 879–887. [Google Scholar] [CrossRef]
- Bakshi, B.R. A thermodynamic framework for ecologically conscious process systems engineering. Comput. Chem. Eng. 2000, 24, 1767–1773. [Google Scholar] [CrossRef]
- Marvuglia, A.; Santagata, R.; Rugani, B.; Benetto, E.; Ulgiati, S. Emergy-based indicators to measure circularity: Promises and problems. Polityka Energetyczna 2018, 21, 179–196. [Google Scholar] [CrossRef]
- Marvuglia, A.; Benetto, E.; Rios, G.; Rugani, B. SCALE: Software for CALculating Emergy based on life cycle inventories. Ecol. Model. 2013, 248, 80–91. [Google Scholar] [CrossRef]
- Arbault, D.; Rugani, B.; Marvuglia, A.; Benetto, E.; Tiruta-Barna, L. Emergy evaluation using the calculation software SCALE: Case study, added value and potential improvements. Sci. Total Environ. 2014, 472, 608–619. [Google Scholar] [CrossRef]
- Raugei, M.; Rugani, B.; Benetto, E.; Ingwersen, W.W. Integrating emergy into LCA: Potential added value and lingering obstacles. Ecol. Model. 2014, 271, 4–9. [Google Scholar] [CrossRef]
- Hau, J.L.; Bakshi, B.R. Promise and problems of emergy analysis. Ecol. Model. 2004, 178, 215–225. [Google Scholar] [CrossRef]
- Santagata, R.; Zucaro, A.; Fiorentino, G.; Lucagnano, E.; Ulgiati, S. Developing a procedure for the integration of life cycle assessment and emergy accounting approaches. The Amalfi paper case study. Ecol. Indic. 2020, 117, 106676. [Google Scholar] [CrossRef]
- Whitesides, G.M. Reinventing chemistry. Angew. Chem.-Int. Ed. 2015, 54, 3196–3209. [Google Scholar] [CrossRef]
- Almeida, C.M.V.B.; Rodrigues, A.; Bonilla, S.; Giannetti, B.F. Emergy as a Tool for Ecodesign: Evaluating Materials Selection for Beverage Packages in Brazil. J. Clean. Prod. 2010, 18, 32–43. [Google Scholar] [CrossRef]
- Almeida, C.M.V.B.; Rodrigues, A.J.M.; Agostinho, F.; Giannetti, B.F. Material selection for environmental responsibility: The case of soft drinks packaging in Brazil. J. Clean. Prod. 2017, 142, 173–179. [Google Scholar] [CrossRef]
- Bustamante, G.; Giannetti, B.F.; Agostinho, F.; de Silva, M.T.; Almeida, C.M.V.B. IFIP Advances in Information and Communication Technology; Springer: Berlin/Heidelberg, Germany, 2016; Volume 488, pp. 812–827. [Google Scholar]
- ISO 14040; Environmental Management-Life Cycle Assessment-Principles and Framework. ISO: Geneva, Switzerland, 2006. Available online: https://www.iso.org/standard/37456.html (accessed on 13 June 2020).
- ISO 14044; Environmental Management-Life Cycle Assessment-Requirements and Guidelines. ISO: Geneva, Switzerland, 2006. Available online: https://www.iso.org/standard/38498.html (accessed on 13 June 2020).
- PlasticsEurope. Plastics—The Facts 2019. An Analysis of European Plastics Production, Demand and Waste Data. 2019. Available online: https://www.plasticseurope.org/application/files/1115/7236/4388/FINAL_web_version_Plastics_the_facts2019_14102019.pdf (accessed on 10 January 2021).
- Brown, M.T.; Herendeen, R.A. Embodied energy analysis and EMERGY analysis: A comparative view. Ecol. Econ. 1996, 19, 219–235. [Google Scholar] [CrossRef]
- Herendeen, R. Embodied energy, embodied everything… Now what. Advances in energy studies. Energy Flows Ecol. Econ. 1998, 22, 13–48. [Google Scholar]
- Slesser, M. Energy Analysis Workshop on Methodology and Conventions; IFIAS: Stockholm, Sweden, 1974; Volume 89. [Google Scholar]
- Brown, M.T.; Campbell, D.E.; De Vilbiss, C.; Ulgiati, S. The geobiosphere emergy baseline: A synthesis. Ecol. Model. 2016, 339, 92–95. [Google Scholar] [CrossRef]
- Li-Na, J. Study on preparation process and properties of polyethylene terephthalate (PET). Appl. Mech. Mater. 2013, 312, 406–410. [Google Scholar]
- Yue, H.; Zhao, Y.; Ma, X.; Gong, J. Ethylene glycol: Properties, synthesis, and applications. Chem. Soc. Rev. 2012, 41, 4218–4244. [Google Scholar] [CrossRef]
- Lyu, Y.; Raugei, M.; Zhang, X.; Mellino, S.; Ulgiati, S. Environmental cost and impacts of chemicals used in agriculture: An integration of emergy and Life Cycle Assessment. Renew. Sustain. Energy Rev. 2021, 151, 111604. [Google Scholar] [CrossRef]
- Ulgiati, S.; Brown, M.T. Labor and services as information carriers in Emergy-LCA accounting. J. Environ. Account. Manag. 2014, 2, 163–170. [Google Scholar] [CrossRef]
- Giannetti, B.F.; Marcilio, M.F.D.F.B.; Coscieme, L.; Agostinho, F.; Liu, G.; Almeida, C.M.V.B. Howard Odum’s “Self-organization, transformity and information”: Three decades of empirical evidence. Ecol. Model. 2019, 407, 108717. [Google Scholar] [CrossRef]
- Laville, S.; Taylor, M. A million bottles a minute: World’s plastic binge ’as dangerous as climate change. Guard 2017, 28, 2017. [Google Scholar]
- Cleary, J. Life cycle assessments of wine and spirit packaging at the product and the municipal scale: A Toronto, Canada case study. J. Clean. Prod. 2013, 44, 143–151. [Google Scholar] [CrossRef]
- Santos, R.; Silva, É.F.M.; Dantas, E.J.M.; Garcia, R.R.P.; Almeida, L.C. Potential Reuse of PET Waste Bottles as a Green Substrate/Adsorbent for Reactive Black 5 Dye Removal. Water Air Soil Pollut. 2020, 231, 533. [Google Scholar] [CrossRef]
- Giannetti, B.F.; Bonilla, S.H.; Almeida, C.M.V.B. Developing eco-technologies, a possibility to minimize environmental impact in Southern Brazil. Clean. Prod. 2004, 12, 361–368. [Google Scholar] [CrossRef]
- Xu, X.; Zhou, Z.; Lei, K.; LeBlanc, G.A.; Na, L. Phthalate Esters and Their Potential Risk in PET Bottled Water Stored under Common Conditions. Int. J. Environ. Res. Public Health 2019, 17, 141. [Google Scholar] [CrossRef] [Green Version]
- Pang, J.; Zheng, M.; Sun, R.; Wang, A.; Wang, X.; Zhang, T. Synthesis of ethylene glycol and terephthalic acid from biomass for producing PET. Green Chem. 2016, 18, 342–359. [Google Scholar] [CrossRef]
- Dutta, S.; Bhat, N.S. Catalytic synthesis of renewable p-xylene from biomass-derived 2,5-dimethylfuran: A mini review. Biomass Convers. Biorefinery 2020. [Google Scholar] [CrossRef]
- Coca-Cola. 2009. Available online: https://www.coca-colacompany.com/faqs/what-is-plantbottle-packaging (accessed on 10 January 2021).
- BBC. 2021. Available online: https://www.bbc.com/news/technology-56023723?fbclid=IwAR1wo7ef9q5HeI0KEZ5CJtW4Jbv0fX_ILpXwBmGBtCyMABICJ5qaItOXuFY (accessed on 10 January 2021).
- Bleischwitz, R.; Spataru, C.; VanDeveer, S.D.; Obersteiner, M.; van der Voet, E.; Johnson, C.; Andrews-Speed, P.; Boersma, T.; Hoff, H.; van Vuuren, D.P. Resource nexus perspectives towards the United Nations Sustainable Development Goals. Nat. Sustain. 2018, 1, 737–743. [Google Scholar] [CrossRef] [Green Version]
- Palacios-Mateo, C.; van der Meer, Y.; Seide, G. Analysis of the polyester clothing value chain to identify key intervention points for sustainability. Environ. Sci. Eur. 2021, 33, 2. [Google Scholar] [CrossRef]
- Hacini, M.; Benosman, A.S.; Kazi Tani, N.; Badache, A.; Latroch, N. Utilization and assessment of recycled polyethylene terephthalate strapping bands as lightweight aggregates in Eco-efficient composite mortars. Constr. Build. Mater. 2021, 270, 121427. [Google Scholar] [CrossRef]
- Martin, E.J.P.; Oliveira, D.S.B.L.; Oliveira, L.S.B.L.; Bezerra, B.S. Life cycle comparative assessment of pet bottle waste management options: A case study for the city of Bauru, Brazil. Waste Manag. 2021, 119, 226–234. [Google Scholar] [CrossRef] [PubMed]
- Di, J.; Reck, B.K.; Miatto, A.; Graedel, T.E. United States plastics: Large flows, short lifetimes, and negligible recycling. Resour. Conserv. Recycl. 2021, 167, 105440. [Google Scholar] [CrossRef]
- Giannetti, B.F.; Sevegnani, F.; Almeida, C.M.V.B.; Agostinho, F.; Moreno García, R.R.; Liu, G. Five sector sustainability model: A proposal for assessing sustainability of production systems. Ecol. Model. 2019, 406, 98–108. [Google Scholar] [CrossRef]
- Rugani, B.; Benetto, E. Improvements to Emergy evaluations by using Life Cycle Assessment. Environ. Sci. Technol. 2012, 46, 4701–4712. [Google Scholar] [CrossRef]
- Liu, H.C.; Huang, Y.Q.; Yuan, H.Y.; Yin, X.L.; Wu, C.Z. Life cycle assessment of biofuels in China: Status and challenges. Renew. Sustain. Energy Rev. 2018, 97, 301–322. [Google Scholar] [CrossRef]
- Ulgiati, S.; Raugei, M.; Bargigli, S. Overcoming the inadequacy of single-criterion approaches to Life Cycle Assessment. Ecol. Model. 2006, 190, 432–442. [Google Scholar] [CrossRef]


| INPUTS | Unit | Quantity * | UEV ** | Unit | Emergy | |
|---|---|---|---|---|---|---|
| 1 | Energy, gross calorific value, in biomass | MJ | 4.22 × 10⁻¹ | 6.75 × 10⁴ | seJ/J | 2.85 × 10¹⁰ |
| 2 | Peat, in ground | kg | 9.39 × 10⁻⁷ | 3.19 × 10⁴ | seJ/J | 2.92 × 10⁵ |
| 3 | Wood, primary forest, standing | m3 | 1.04 × 10⁻⁶ | 1.04 × 10⁴ | seJ/J | 1.22 × 10⁸ |
| 5 | Energy, gross calorific value, renewable | MJ | 4.55 × 10⁻¹ | 1.02 × 10⁵ | seJ/J | 4.63 × 10¹⁰ |
| 6 | Energy, hydro | MJ | 3.39 × 10⁻¹ | 1.35 × 10⁵ | seJ/J | 4.56 × 10¹⁰ |
| 7 | Energy, gross calorific value, in lignite | MJ | 1.39 × 100 | 6.22 × 10⁴ | seJ/J | 8.63 × 10¹⁰ |
| 8 | Aluminium, 24% in bauxite, 11% in crude ore, in ground | kg | 1.14 × 10⁻⁵ | 5.40 × 10⁹ | seJ/g | 6.15 × 10⁷ |
| 9 | Barite, 15% in crude ore, in ground | kg | 2.67 × 10⁻⁵ | 1.68 × 10⁹ | seJ/g | 4.49 × 10⁷ |
| 10 | Basalt, in ground | kg | 3.61 × 10⁻¹⁰ | 7.56 × 10⁹ | seJ/g | 2.73 × 10³ |
| 11 | Borax, in ground | kg | 1.63 × 10⁻¹⁰ | 1.68 × 10⁹ | seJ/g | 2.75 × 10² |
| 12 | Cadmium, 0.30% in sulfide, Cd 0.18%, Pb, Zn, Ag, In, in ground | kg | 6.54 × 10⁻¹² | 3.40 × 10¹³ | seJ/g | 2.22 × 10⁵ |
| 13 | Calcite, in ground | kg | 9.02 × 10⁻³ | 1.68 × 10⁹ | seJ/g | 1.51 × 10¹⁰ |
| 14 | Carbon, in organic matter, in soil | kg | 3.34 × 10⁻⁸ | 2.77 × 10⁹ | seJ/g | 9.25 × 10⁴ |
| 15 | Chromium, 25.5% in chromite, 11.6% in crude ore, in ground | kg | 1.13 × 10⁻⁵ | 1.50 × 10¹¹ | seJ/g | 1.70 × 10⁹ |
| 16 | Chrysotile, in ground | kg | 2.97 × 10⁻⁷ | 1.68 × 10⁹ | seJ/g | 4.98 × 10⁵ |
| 17 | Clay, unspecified, in ground | kg | 1.95 × 10⁻⁴ | 4.80 × 10⁹ | seJ/g | 9.39 × 10⁸ |
| 18 | Coal | MJ | 2.45 × 100 | 5.71 × 10⁴ | seJ/J | 1.40 × 10¹¹ |
| 19 | Cobalt, in ground | kg | 1.80 × 10⁻⁴ | 1.30 × 10¹¹ | seJ/g | 2.34 × 10¹⁰ |
| 20 | Colemanite, in ground | kg | 4.53 × 10⁻⁹ | 1.68 × 10⁹ | seJ/g | 7.62 × 10³ |
| 21 | Copper, in ground | kg | 1.07 × 10⁻⁶ | 9.80 × 10¹⁰ | seJ/g | 1.05 × 10⁸ |
| 22 | Diatomite, in ground | kg | 2.00 × 10⁻¹³ | 1.68 × 10⁹ | seJ/g | 3.36 × 10⁻¹ |
| 23 | Dolomite, in ground | kg | 2.53 × 10⁻⁶ | 1.85 × 10¹⁰ | seJ/g | 4.69 × 10⁷ |
| 24 | Feldspar, in ground | kg | 2.07 × 10⁻¹² | 1.68 × 10⁹ | seJ/g | 3.48 × 100 |
| 25 | Fluorine, in ground | kg | 8.13 × 10⁻⁶ | 1.68 × 10⁹ | seJ/g | 1.37 × 10⁷ |
| 26 | Fluorspar, 92%, in ground | kg | 8.37 × 10⁻⁶ | 8.38 × 10⁸ | seJ/g | 7.02 × 10⁶ |
| 27 | Gas, natural, in ground | MJ | 1.67 × 101 | 6.83 × 10⁴ | seJ/J | 1.14 × 10¹² |
| 28 | Gold, in ground | kg | 2.44 × 10⁻¹⁷ | 5.00 × 10¹¹ | seJ/g | 1.22 × 10⁻² |
| 29 | Granite, in ground | kg | 2.07 × 10⁻¹² | 8.40 × 10⁸ | seJ/g | 1.74 × 100 |
| 30 | Gravel, in ground | kg | 6.65 × 10⁻³ | 8.40 × 10⁸ | seJ/g | 5.59 × 10⁹ |
| 31 | Gypsum, in ground | kg | 3.19 × 10⁻⁹ | 2.85 × 10⁹ | seJ/g | 9.10 × 10³ |
| 32 | Indium, 0.005% in sulfide, In 0.003%, Pb, Zn, Ag, Cd, in ground | kg | 1.03 × 10⁻¹³ | 4.03 × 10¹¹ | seJ/g | 4.15 × 101 |
| 33 | Iron, 46% in ore, 25% in crude ore, in ground | kg | 4.18 × 10⁻⁵ | 1.20 × 10¹⁰ | seJ/g | 5.02 × 10⁸ |
| 34 | Kaolinite, 24% in crude ore, in ground | kg | 6.87 × 10⁻⁷ | 1.68 × 10⁹ | seJ/g | 1.15 × 10⁶ |
| 35 | Kieserite, 25% in crude ore, in ground | kg | 1.69 × 10⁻⁹ | 1.68 × 10⁹ | seJ/g | 2.84 × 10³ |
| 36 | Lead, 5.0% in sulfide, Pb 3.0%, Zn, Ag, Cd, In, in ground | kg | 4.31 × 10⁻¹¹ | 4.80 × 10¹¹ | seJ/g | 2.07 × 10⁴ |
| 37 | Magnesite, 60% in crude ore, in ground | kg | 6.86 × 10⁻⁷ | 1.68 × 10⁹ | seJ/g | 1.15 × 10⁶ |
| 38 | Manganese, 35.7% in sedimentary deposit, 14.2% in crude ore, in ground | kg | 3.15 × 10⁻⁴ | 3.50 × 10¹¹ | seJ/g | 1.10 × 10¹¹ |
| 39 | Mercury, in ground | kg | 2.71 × 10⁻⁸ | 4.20 × 10¹³ | seJ/g | 1.14 × 10⁹ |
| 40 | Metamorphous rock, graphite containing, in ground | kg | 8.31 × 10⁻⁹ | 1.68 × 10⁹ | seJ/g | 1.39 × 10⁴ |
| 41 | Molybdenum, 0.025% in sulfide, Mo 8.2 × 10⁻³% and Cu 0.39% in crude ore, in ground | kg | 4.75 × 10⁻⁷ | 7.00 × 10¹¹ | seJ/g | 3.32 × 10⁸ |
| 42 | Nickel, 1.13% in sulfide, Ni 0.76% and Cu 0.76% in crude ore, in ground | kg | 2.63 × 10⁻⁵ | 2.00 × 10¹¹ | seJ/g | 5.26 × 10⁹ |
| 43 | Oil, crude, in ground | MJ | 4.49 × 101 | 9.45 × 10⁴ | seJ/J | 4.24 × 10¹² |
| 44 | Olivine, in ground | kg | 7.05 × 10⁻¹⁰ | 1.68 × 10⁹ | seJ/g | 1.19 × 10³ |
| 45 | Pd, in ground | kg | 1.13 × 10⁻⁸ | 1.20 × 10¹¹ | seJ/g | 1.36 × 10⁶ |
| 46 | Phosphorus, 18% in apatite, 12% in crude ore, in ground | kg | 3.25 × 10⁻⁵ | 2.07 × 10¹⁰ | seJ/g | 6.71 × 10⁸ |
| 47 | Potassium chloride, in ground | kg | 4.02 × 10⁻⁸ | 4.97 × 10⁹ | seJ/g | 2.00 × 10⁵ |
| 48 | Pt, in ground | kg | 1.95 × 10⁻¹² | 3.70 × 10¹¹ | seJ/g | 7.20 × 10² |
| 49 | Rh, in ground | kg | 1.74 × 10⁻¹² | 1.20 × 10¹² | seJ/g | 2.09 × 10³ |
| 50 | Rhenium, in crude ore, in ground | kg | 4.83 × 10⁻¹³ | 8.93 × 10¹² | seJ/g | 4.31 × 10³ |
| 51 | Rutile, in ground | kg | 2.07 × 10⁻¹² | 1.68 × 10⁹ | seJ/g | 3.48 × 100 |
| 52 | Sand, unspecified, in ground | kg | 5.61 × 10⁻⁸ | 1.68 × 10⁹ | seJ/g | 9.43 × 10⁴ |
| 53 | Shale, in ground | kg | 6.13 × 10⁻⁹ | 1.68 × 10⁹ | seJ/g | 1.03 × 10⁴ |
| 54 | Silver, in ground | kg | 6.51 × 10⁻¹⁷ | 4.50 × 10¹¹ | seJ/g | 2.93 × 10⁻² |
| 55 | Sodium bromide, in ground | kg | 4.40 × 10⁻⁴ | 1.68 × 10⁹ | seJ/g | 7.39 × 10⁸ |
| 56 | Sodium chloride, in ground | kg | 1.30 × 10⁻² | 1.68 × 10⁹ | seJ/g | 2.19 × 10¹⁰ |
| 57 | Sodium nitrate, in ground | kg | 3.33 × 10⁻¹⁵ | 1.68 × 10⁹ | seJ/g | 5.60 × 10⁻³ |
| 58 | Sodium sulphate, various forms, in ground | kg | 2.24 × 10⁻⁶ | 1.40 × 10⁹ | seJ/g | 3.13 × 10⁶ |
| 59 | Stibnite, in ground | kg | 2.71 × 10⁻⁴ | 1.68 × 10⁹ | seJ/g | 4.55 × 10⁸ |
| 60 | Sulfur, in ground | kg | 4.60 × 10⁻⁵ | 2.08 × 10¹⁰ | seJ/g | 9.58 × 10⁸ |
| 61 | Talc, in ground | kg | 9.79 × 10⁻⁸ | 2.80 × 10¹⁰ | seJ/g | 2.74 × 10⁶ |
| 62 | Tantalum, 81.9% in tantalite, 1.6 × 10⁻⁴% in crude ore, in ground | kg | 2.36 × 10⁻¹⁷ | 1.70 × 10¹¹ | seJ/g | 4.02 × 10⁻³ |
| 63 | Tellurium, 0.5 ppm in sulfide, Te 0.2 ppm, Cu and Ag, in crude ore, in ground | kg | 3.20 × 10⁻¹⁸ | 5.04 × 10¹³ | seJ/g | 1.61 × 10⁻¹ |
| 64 | Tin, 79% in cassiterite, 0.1% in crude ore, in ground | kg | 3.01 × 10⁻¹¹ | 1.70 × 10¹² | seJ/g | 5.11 × 10⁴ |
| 65 | TiO2, 54% in ilmenite, 2.6% in crude ore, in ground | kg | 4.89 × 10⁻⁶ | 3.82 × 10¹⁰ | seJ/g | 1.87 × 10⁸ |
| 66 | Ulexite, in ground | kg | 1.21 × 10⁻¹⁷ | 1.68 × 10⁹ | seJ/g | 2.02 × 10⁻⁵ |
| 67 | Uranium, in ground | kg | 6.78 × 10⁻⁶ | 1.60 × 10¹¹ | seJ/g | 1.08 × 10⁹ |
| 68 | Zinc, 9.0% in sulfide, Zn 5.3%, Pb, Ag, Cd, In, in ground | kg | 8.11 × 10⁻⁷ | 7.20 × 10¹⁰ | seJ/g | 5.84 × 10⁷ |
| 69 | Zirconium, 50% in zircon, 0.39% in crude ore, in ground | kg | 3.25 × 10⁻¹⁷ | 3.18 × 10¹⁰ | seJ/g | 1.03 × 10⁻³ |
| 70 | Magnesium, 0.13% in water | kg | 3.73 × 10⁻¹⁸ | 1.68 × 10⁹ | seJ/g | 6.26 × 10⁻⁶ |
| 71 | Water, cooling, unspecified natural origin | m3 | 5.12 × 10⁻² | 2.70 × 10⁵ | seJ/g | 1.39 × 10¹⁰ |
| 72 | Water, lake | m3 | 1.52 × 10⁻³ | 4.52 × 10⁵ | seJ/g | 6.85 × 10⁸ |
| 73 | Water, process, unspecified natural origin | m3 | 4.20 × 10⁻³ | 6.74 × 10⁴ | seJ/J | 1.18 × 10⁹ |
| 74 | Water, river | m3 | 1.77 × 10⁻³ | 3.41 × 10⁵ | seJ/g | 6.03 × 10⁸ |
| 75 | Water, salt, ocean | m3 | 5.38 × 10⁻⁵ | 5.36 × 10⁴ | seJ/J | 1.21 × 10⁷ |
| 76 | Water, salt, sole | m3 | 1.24 × 10⁻⁵ | 5.36 × 10⁴ | seJ/J | 2.79 × 10⁶ |
| 77 | Water, unspecified natural origin | m3 | 2.97 × 10⁻⁵ | 3.06 × 10⁴ | seJ/J | 3.80 × 10⁶ |
| 78 | Water, well, in ground | m3 | 6.34 × 10⁻⁴ | 6.89 × 10⁴ | seJ/J | 1.83 × 10⁸ |
| Emergy | seJ | 5.94 × 10¹² | ||||
| UEV | seJ/g | 5.94 × 10⁹ |
| Product | UEV/(109 seJ/g) This Work | UEV/(109 seJ/g) Literature | Reference |
|---|---|---|---|
| Crude oil | 4.47 | 2.96 | [48] |
| Crude oil extracted | 6.20 | [50] | |
| Natural gas | 2.80 | [48] | |
| Natural gas extracted | 6.66 | [49] | |
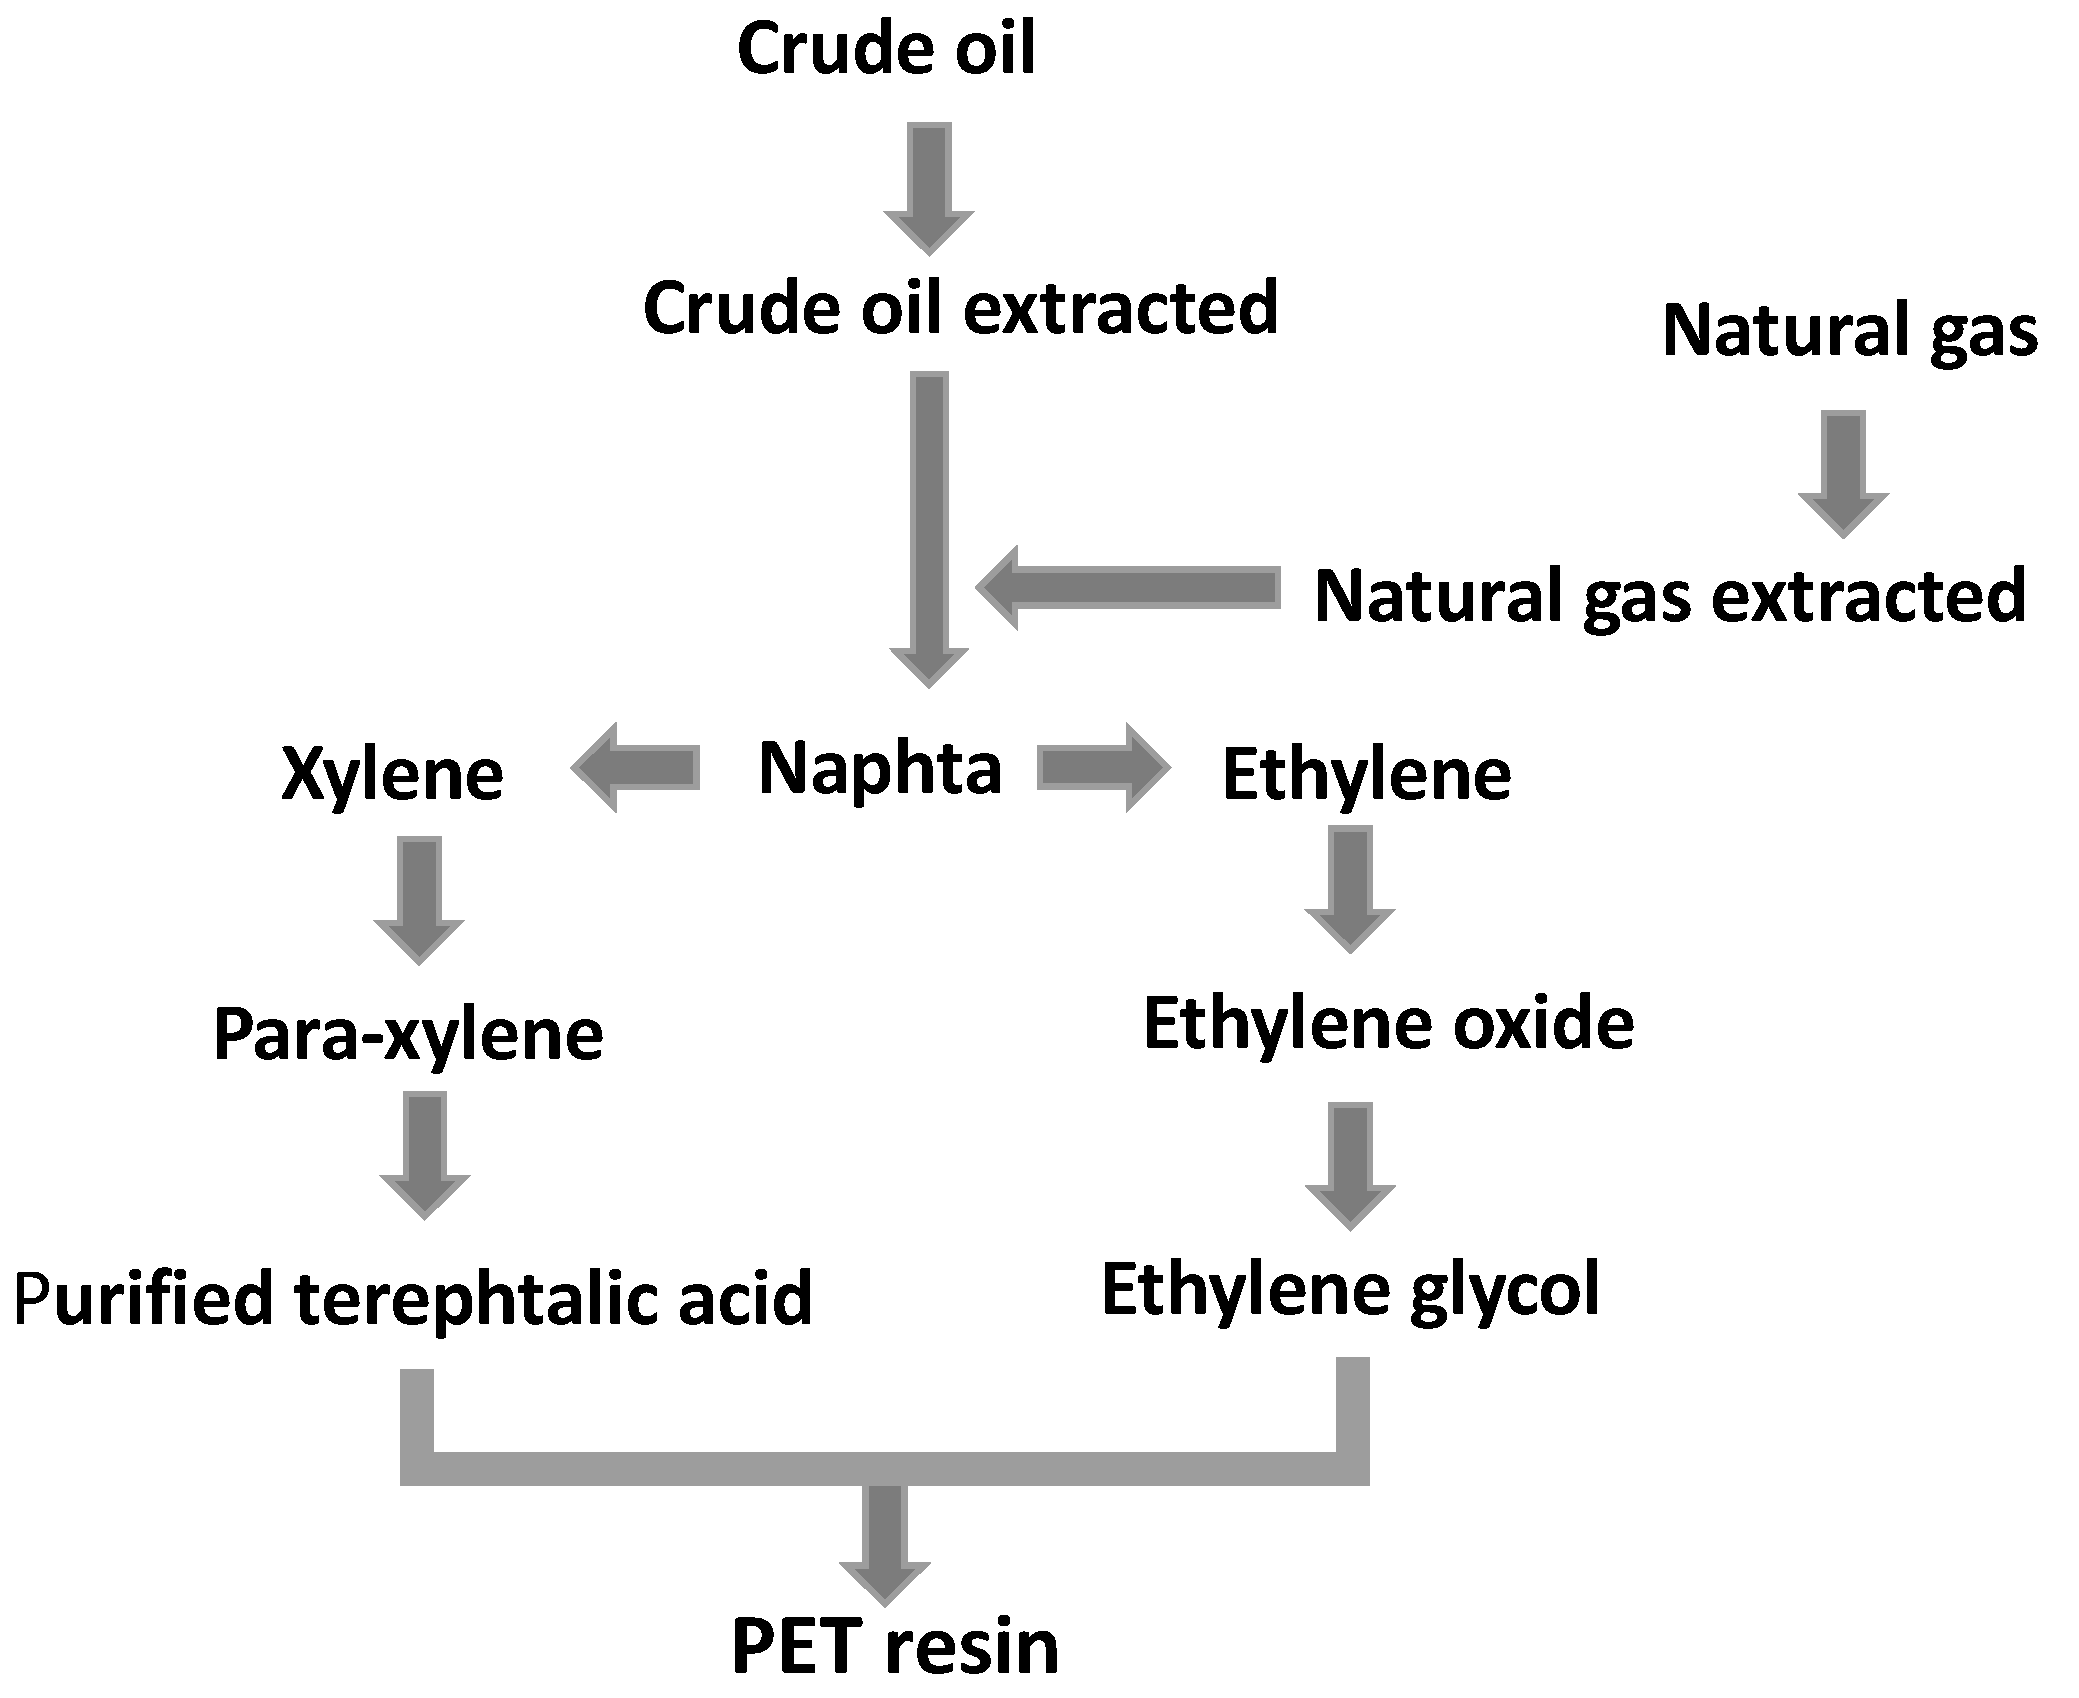
| Naphtha | 4.52 | 5.02 | [49] |
| Xylene | 5.24 | ||
| Eethylene | 6.40 | 12.0 | [49] |
| p-Xylene | 6.15 | ||
| Ethylene oxide | 5.40 | ||
| Ethylene glycol | 3.99 | ||
| Purified terephthalic acid | 5.00 | ||
| PET resin | 5.94 | 26.1 | [60] |
Publisher’s Note: MDPI stays neutral with regard to jurisdictional claims in published maps and institutional affiliations. |
© 2022 by the authors. Licensee MDPI, Basel, Switzerland. This article is an open access article distributed under the terms and conditions of the Creative Commons Attribution (CC BY) license (https://creativecommons.org/licenses/by/4.0/).
Share and Cite
Bustamante, G.; Giannetti, B.F.; Agostinho, F.; Liu, G.; Almeida, C.M.V.B. Prioritizing Cleaner Production Actions towards Circularity: Combining LCA and Emergy in the PET Production Chain. Sustainability 2022, 14, 6821. https://doi.org/10.3390/su14116821
Bustamante G, Giannetti BF, Agostinho F, Liu G, Almeida CMVB. Prioritizing Cleaner Production Actions towards Circularity: Combining LCA and Emergy in the PET Production Chain. Sustainability. 2022; 14(11):6821. https://doi.org/10.3390/su14116821
Chicago/Turabian StyleBustamante, Gustavo, Biagio Fernando Giannetti, Feni Agostinho, Gengyuan Liu, and Cecília M. V. B. Almeida. 2022. "Prioritizing Cleaner Production Actions towards Circularity: Combining LCA and Emergy in the PET Production Chain" Sustainability 14, no. 11: 6821. https://doi.org/10.3390/su14116821