1. Introduction
Today, there is a growing interest in natural and environmentally friendly production in many sectors. In the agri-food sector, the high environmental impact in terms of the world’s GHG emissions due to supply, production, and delivery of the finished products have led to increased attention and awareness on the part of consumers, producers, and processors [
1].
In recent decades, several environmental systems analysis tools have been introduced to estimate the environmental burdens related to agricultural production. The main methods adopted in scientific literature are the following: Product Environmental Footprint [
2], Environmental Impact Assessment (EIA), Environmental Auditing (EA), System of Economic and Environmental Accounting (SEEA), Material Flow Analysis (MFA), and Life Cycle Assessment (LCA) [
3].
Life Cycle Assessment (LCA) is an appropriate methodology to assess the environmental impact of a product/service or process by adopting a quantitative approach. It is based on Life Cycle Thinking, a paradigm that considers the environmental impact at all stages of the life cycle. Therefore, at the global level, LCA is considered one of the most reliable methodologies to assess the environmental impacts of products/services or processes and to identify effective solutions to address sustainability issues [
4]. The LCA technique can be applied with defined boundaries by adopting two strategies. The first strategy considers a complete life cycle analysis, so called “cradle-to-grave”; on the contrary, in the second strategy, only a part of the life cycle is investigated; it is called “cradle-to-gate”, “gate-to-gate”, or “gate-to-grave” depending on the boundaries considered.
In the agricultural sector, LCA results provide values referring to different impact categories that require careful interpretation and analysis. In fact, depending on the boundaries of the system and process/product analysed, different conditions emerge: for example, in the analysis of peach compote production, higher values of the global warming impact category are found for the tinplate can and compote production stages than for the cultivation stage, while the results are reversed for the acidification potential impact category [
5]. Interesting studies to assess sustainable agricultural production and agri-food processes with an LCA are proposed in [
6,
7,
8].
Consumer demand for high-quality food and the need for greater environmental awareness have promoted the development of the so-called “green agri-food” sector [
9].
Therefore, the environmental, and social sustainability of the agri-food supply chain is a significant challenge. It is faced with adopting several strategies [
10], most of which aim to reduce food losses and waste (FLW) produced throughout the supply chain. Processing and manufacturing phases are often used to extend shelf-life and ensure high food quality, particularly for perishable foods [
11]. The food industry has developed many long-life products using innovative technologies [
9,
12] and new equipment [
13] at both industrial and domestic levels. Well-established preservation techniques in daily life, especially for fruits and vegetables, are represented by frozen or dried products, jams, jellies, and products in oil and vinegar. However, although processing fresh food into finished products is the best solution from an environmental point of view, pre-stabilization of fresh foods reduces the amount of FLW. In the case of fruits and vegetables, their seasonality leads to complexity in coordinating harvesting and the processing steps. The harvesting of products takes place over a limited period of the year (in some cases, from two to three weeks), while the existing processing plants’ capabilities lead to the raw material processing being planned in medium-long periods (i.e., from three to six months) rather than very short periods. Therefore, during the harvest period, limited plant capability does not allow us to process the full volume of available fruits and vegetables, leading to an increase in the amount of FLW due to oversupplied quantities that cannot be processed. An alternative to prevent this kind of loss is to process raw materials into semi-finished products to extend their shelf-life and plan their processing over a longer time period, consistent with the production planning needs [
14]. Semi-finished products ensure nutritional integrity, limiting nutrients’ modifications with no or few alterations in chemical-physical and organoleptic properties [
15]. The processing of semi-finished products, like almost all industrial processes, generates environmental impacts. The LCA method is generally adopted in the scientific literature to assess the sustainability of many food production treatments [
2,
16]. For example, considering fruit treatments, an environmental analysis of peach compote production in Greece is performed by adopting the LCA method [
5].
Similarly, a cradle-to-grave approach is applied to evaluate the jam produced from agroforestry in the reforested area of the Peruvian Amazon [
17]. The semi-finished fruits’ production processes, such as those used for peaches’, are analysed using the LCA methodology to compare two alternative treatments. The traditional ohmic aseptic process is compared with a more recent process, named Low-Pressure Superheated Stream Drying with Far-Infrared Radiation (LPSSD-FIR). Although the new technology has technical limits due to its immaturity, the potential benefits are well highlighted in [
15]. The LCA methodology, assuming a cradle-to-gate approach, is adopted to quantify the potential environmental impacts of the treatments needed to process the fresh cherries into semi-finished cherries [
11].
Analogously, two treatments to produce the semi-finished apricots, using deep-freezing and ohmic aseptic processes, are compared by adopting a gate-to-gate LCA approach [
18]. In De Marco and Iannone [
19], three treatments (deep-freezing, LPSSD-FIR, and ohmic aseptic) were assessed to estimate the environmental performance of apricot production, assuming a gate-to-grave approach. The authors show that ohmic aseptic is the least impactful treatment.
Most existing studies neglect the environmental impact due to transportation and handling of fruits and vegetables inside and outside processing plants. Logistical issues are often considered outside the boundaries of the LCA system. In fact, as emerged in the reviewed papers, logistic aspects in the agri-food sector have not been sufficiently addressed in the existing scientific literature. FAO has estimated that 45% of fruits and vegetables become FLW [
20], and analysis of strategies that include transportation can reduce these quantities.
The current Italian location of fruit and vegetable cultivation areas shows a very interesting distribution. Most cultivation areas are located in rural zones, generally far away from urban and industrial centres. Therefore, considering the entire agri-food supply chain, the processing and distribution stages require, in many cases, the transportation of fruit and vegetables over long distances, with a corresponding environmental and economic impact. The lack of similar studies in the literature leads the authors to investigate issues concerning the impacts due to transportation and distances of processing plants from harvest sites.
In this paper, an LCA approach is used to compare the environmental impact due to different processes and transportation practices in apricot jam production. Consistent with the aim of the paper, production processes based on the adoption of fresh fruit and semi-finished fruit are compared. In both cases, emissions due to production and logistical processes are included in the assessment. The proposed methodology is useful to identify the best options for jam production (centralized or decentralized approach) from an environmental point of view, considering the different input materials (fresh fruit or semi-finished fruit) and the additional transportation activities required. Differently from existing studies, centralized and decentralized production approaches are analyzed from an environmental perspective, considering logistic impacts [
21]. The results suggest possible benefits deriving from industrial processing solutions which differ from the current industrial practice: process decentralization with smaller capacity plants and flexibility enough for processing multiple types of fruit throughout the year. This could yield significant environmental benefits.
This paper is organized as follows:
Section 2 outlines the methodology adopted. In
Section 3, the LCA analysis is detailed. In
Section 4 and
Section 5, the results of the analysis are shown and discussed, respectively. Finally, in
Section 6, the conclusions of this work and future research are highlighted.
2. Methodology
This section details the methodology adopted to compare the environmental impacts of different processes and transportation practices in apricot jam production by means of an LCA analysis according to the requirements of ISO 14040 [
22] and ISO 14044 [
23] standards with a “gate-to-gate” and “gate-to-grave” approach.
Generally, the industrial production plants for apricot jam are not located in areas close to harvest sites. The high perishability of apricots does not allow them to be stored for a long time under favorable environmental conditions. Therefore, there are two viable options to produce the apricot jam. The first consists of transferring the harvested apricots to more plants located in other geographic areas, ensuring to treat the fresh apricots in compliance with their shelf-life. The second consists of transforming the fresh fruit into semi-finished products to extend their shelf life and planning over time the final treatments to obtain jam.
In most cases, logistics activities for shipping fresh fruit to plants located in other regions or countries are based on the “hub and spoke” model. Different transportation units can be adopted considering the distance to be covered, the amount of product to be transferred, and the delivery time to be ensured. Consistently with these features, an LCA for different scenarios has been developed, aiming to compare the production process of apricot jam starting from fresh or semi-finished products and assuming different plant locations. In the remaining portion of the paper, production processes will be identified with:
P1 Production of apricot jam from fresh apricots;
P2 Production of semi-finished product from fresh apricots (P2-A), followed by production of apricot jam from semi-finished product (P2-B).
The environmental assessment of the two practices, when emissions due to transport and FLW generation percentage are neglected, leads to the first practice being preferred since the second one requires more energy-intensive treatments to transform fresh apricots into semi-finished products. Nevertheless, the short shelf-life of the apricots makes this practice difficult to schedule, considering the limited processing capability of one plant only, and forces fresh apricots to be transported to other plants far from harvest sites. During transportation, depending on the transportation mode adopted and hence the time required, a non-negligible percentage of fresh fruits becomes FLW.
Therefore, in the LCA analysis carried out, the impacts were evaluated by considering transport distances and the transport mode adopted, as well as the expected FLW generation percentage. Consistent with these premises, different scenarios were defined. The scenarios differed in terms of the production process considered (P1 or P2), the transportation distance, the transportation mode adopted, and the FLW generation percentage. Five scenarios (named Sc0–Sc4) were defined (see
Table 1).
In the remaining parts of this section, production processes as well as scenarios considered are detailed.
2.1. Production of Apricot Jam from Fresh Apricots
The production process of apricot jam from fresh apricots consists of the following stages. The first phase is harvesting; fresh apricots are then transported from the harvesting site to the processing plant. First, they are examined to assess the quality standard of the apricots, identify damaged products, and discard inedible apricots. Immediately after this step, the apricots are stored in cold rooms for about three days and then processed in a washing treatment to remove dust and foreign bodies before pitting them with automated machines. A check of the apricots is always carried out during this stage, and unsuitable apricots are discarded. The mixing with sugar and the cooking process are the final stages of the process. The obtained product is packaged in the bottling phase and subsequently prepared with secondary and tertiary packaging before transportation.
Figure 1 depicts a summary of the processes and system boundaries assumed in the LCA assessment for this production process. In the LCA carried out, the impact of distribution, sale, and consumption of the jam was not considered, as it is invariant for all scenarios. On the contrary, End-Of-Life (EOL) management of packaging materials (mainly glass) is included in the analysis, mainly because of the differences in materials and/or quantities characterizing the two production processes (P1 and P2). In the packaging materials EOL, recycling and landfill disposal were considered according to the shares provided by the Italian Packaging EOL management consortia [
24].
2.2. Production of Semi-Finished Product from Fresh Apricots Followed by Production of Apricot Jam from Semi-Finished Product
The need for the food industry to process qualitatively guaranteed raw materials (i.e., for safety and hygienic-sanitary standards reasons) and the need to extend the product shelf-life have led to the development of various systems for preserving fresh raw materials by processing them into semi-finished products. These techniques limit the food properties’ modification, do not alter chemical-physical and organoleptic properties, and ensure nutritional integrity [
25]. According to De Marco and Iannone [
19], three different methods to preserve apricots can be adopted: the first consists of Deep-Freezing (DF), the second is the Low-Pressure Superheated Steam Drying with Far-Infrared Radiation (LPSSD-FIR) process, and the third is based on the Ohmic Aseptic Treatment (OAT), as shown in
Figure 2. At the end of these processes (DF/LPSSD-FIR/OAT), a different semi-finished product (frozen apricots/dried apricots/aseptic apricots, respectively) is obtained. As shown in
Figure 3, independently from the semi-finished product obtained, the subsequent apricot jam production process does not change (defrosting of frozen apricots is done without energy consumption). Both
Figure 2 and
Figure 3 show the system boundaries considered in the LCA analysis. As in the previous case (
Figure 1), packaging materials EOL are considered within the system boundaries.
2.3. Scenarios Considered in the LCA Analysis
In the following, scenarios considered in the LCA analysis are detailed (see
Table 1).
2.3.1. Scenario 0: Apricot Jam Production from Semi-Finished Product
In the first (base) scenario (Sc0), jam production is made from the semi-finished product obtained by adopting one of the three alternative treatments (i.e., DF/LPSSD-FIR/OAT). In this case, the distance between the fresh fruit harvest site and the plant where a particular semi-finished product is made is assumed to be about 130 km, and a truck (lorry) was assumed to be used for transporting the materials as in [
12]. At the same plant, the jam production is scheduled and performed according to the plant’s capability. The environmental performance of the industrial process adopted to obtain the semi-finished product (from fresh apricots, see
Figure 2) is evaluated by assuming the actual data referred to in existing research work [
12]. The analysis is extended by including the environmental performance of the subsequent stages needed to transform the semi-finished product into apricot jam, consistent with the process summarized in
Figure 3. In Sc0, the FLW generated in the different process phases is considered.
General features of the scenarios Sc1–Sc4 are described in the following sub-sections, where the jam production is made by the P1 process in a plant located in an area far from the harvest site. In these cases, the main differences arise from the process plants’ distances, the transport mode adopted, and the FLW generation due to both process and transport stages. In all scenarios, the bottling, packaging, and disposal of packaging materials were considered in the LCA analysis, as shown in
Figure 1. The assessment of all scenarios includes the FLW from the different process phases, whereas the fourth scenario also considers FLW due to transportation.
2.3.2. Scenario 1: Apricot Jam Production with Road Transport (LCV)
In Sc1, distances to be travelled in the range of 100–1500 km are considered, adopting an LCV for transporting fresh apricots (not equipped with refrigerated systems). The benefits due to this transport unit are its flexibility, low transit times, high travel speed, and hence the ability to reach places located in urban areas quickly. Limitations relate mainly to the low load capacity. In the adopted Life Cycle Inventory (LCI), an LCV with a load capacity of up to 3.5 metric tons equipped with an internal combustion engine with Euro5 technology was considered, and the corresponding average emission values for Europe without Switzerland are included [
26].
2.3.3. Scenario 2: Apricot Jam Production with Road Transport (Lorry)
The third scenario considered (Sc2) involves jam production in a plant located in a different area from the harvest site. Consistent with this end, distances to be travelled in the range of 1500–5000 km were considered, adopting a lorry to transport fresh apricots (not equipped with refrigerated systems). The benefit of this transport mode is the high loading capacity. The limitations mainly concern the high transit times and the low travel speed. In the LCI adopted for this scenario, a lorry with a load capacity in the range of 3.5–7.5 metric tons, equipped with an internal combustion engine with Euro5 technology, was considered.
2.3.4. Scenario 3: Apricot Jam Production with Air Transport
In Sc3, distances to be travelled in the range of 1000–10,000 km are considered, adopting an airplane to transport fresh apricots (not equipped with refrigerated systems). The airplane makes it possible to ship products to several global areas in a few hours, with a significant advantage from the quality point of view due to the capacity to ensure the physical-chemical characteristics of fresh apricots. The limitation mainly concerns the higher shipping cost compared to road vehicles and the loading capacity, which is generally lower than that of trucks.
2.3.5. Scenario 4: Apricot Jam Production Considering Road/Air Transport and FLW Generation
In Sc4, distances in the range of 100–10,000 km are considered, including a suitable transportation mode for each case, according to the distance to be travelled, as suggested in the first three scenarios: specifically, LCV is considered to travel low-medium distances (i.e., 100–1500 km), lorry for medium-high distances (i.e., 1500–5000 km), and airplane for longer distances (i.e., 5000–10,000 km). In this scenario, it is taken into account that transportation time can affect the quality and integrity of transported products, with deterioration generating bruises and product losses. For instance, the maximum daily distance travelled by LCVs or lorries is approximately 750 km to comply with road rules [
27] and driving time regulations [
28]. On the contrary, the use of airplanes allows covering longer daily distances up to the maximum value of the range already introduced (i.e., 10,000 km) on the same day; therefore, FLW is not considered in this case. In
Table 2, based on travel time, the estimated loss of fresh apricots is summarized by adopting LCVs or lorries (not equipped with refrigerated systems) [
29]. As displayed in
Table 2, the FLW generation percentage takes the maximum value (100%) at around 5000 km.
3. LCA Analysis
3.1. LCA Methodology
The LCA methodology is applied to compare the environmental impact due to different production practices of apricot jam, which differ for the process implemented (P1 in scenarios Sc1–Sc4 and P2 in scenario Sc0) and for the transportation distances and modalities (scenarios Sc1–Sc4). This study is based on the requirements of the standards ISO 14040 [
22] and ISO 14044 [
23], and is implemented with a “gate-to-gate” and “gate-to-grave” approach. The functional unit of this study is 1 kg of apricot jam production in the different proposed scenarios.
System boundaries include the industrial stages needed for apricot jam production, from the delivery of fresh apricots to processing and packaging at the plant, as well as the management of industrial wastes (i.e., biowaste, wastewater, etc.). The impact of fresh apricot cultivation and harvesting, distribution, sales, and consumption of jam were not considered as they are invariant for all the scenarios (Sc0–Sc4). The system boundaries of Sc0 are shown in
Figure 1; the system boundaries of Sc1–Sc4 are shown in
Figure 2 and
Figure 3.
The LCA analysis developed consists of four main steps: goal and scope definition, inventory analysis, impact assessment, and results interpretation.
3.2. Goal and Scope
The aim of this study consists of comparing the potential environmental impacts related to two different production practices. The first practice considers the apricot jam production starting from fresh fruit transported, by different transportation modes depending on the distance, to a plant located in a different area from the harvest site. Transportation of fresh apricots is necessary due to both apricots’ short shelf-life and short harvest time window. In the analysis of this first production practice, different transport distances (Sc1–Sc3) and different FLW generation during transport (Sc4) are considered. The second production practice considers a preliminary process finalized to transform fresh apricots into a semi-finished product to extend their shelf-life all over the year and a subsequent jam production process adopting this semi-finished product as raw material. In this last case, it is often not necessary to transfer fresh apricots to distant jam production sites, as production can be scheduled at local sites throughout the year. For this reason, transport of semi-finished products is not considered in the analysis of this production practice (
Figure 3).
If emissions from transportation and FLW generation are not considered, the P1 process is environmentally preferable because the P2 process involves more energy-intensive treatments required to transform fresh apricots into semi-finished products. Nevertheless, the short shelf-life of the apricots and the limited capacity of local production plants make it necessary to transport most of the harvested apricots to jam production sites far away from the harvest sites, thus generating FLW.
Therefore, the LCA conducted for each scenario in which the P1 process is adopted (Sc1–Sc4) evaluates the environmental impacts by varying the travel distances and the expected FLW percentage. Consistent with these evaluations, threshold distances and FLW percentages are identified for each scenario that correspond to an environmental benefit from adopting fresh fruit (scenarios Sc1–Sc4) instead of semi-finished products (scenario Sc0) as the raw material in jam production.
3.3. Inventory Analysis and Assumptions
The LCI developed in this study is based on collecting all available and useful data related to apricot jam production, transportation, food waste management, and industrial processing of semi-finished products. This is a crucial phase of the study, which includes the research, collection, and interpretation of the data necessary to implement the environmental assessment of different production and transportation practices.
The LCA study was developed using the LCA software OpenLCA v.1.10.3; the input data of the different transport means and industrial processes needed for apricot jam production are referred to the specific geographical location of the analysis (Italy and Europe). Therefore, the approach used is to retrieve data from the Agribalyse v.3.0.1 database, considering existing processes with European and Italian geographic reference. Moreover, all stages of apricot jam production and necessary products were analysed according to the literature and industrial data. In particular, the database on the existing jam apricot production process in France was implemented with reference to the Italian area, including and detailing the additional stages required by the specific features of the scenarios considered (i.e., national energy mix).
Harvesting and production sites are assumed to be located in southern Italian regions, where Italian apricot cultivation is concentrated. In each scenario, the corresponding input data for the considered production and logistic processes, such as natural resources, energy, and water, are preliminary assessed. Subsequently, output data such as emissions to air, soil, and water are identified. The main inputs and outputs of the LCA analysis are shown in
Table 3.
In the LCI shown in
Table 3, the input and output data of the semi-finished product production process are taken from [
19]. In [
12], the functional unit of the production process is not the unit mass of apricot jam produced; therefore, for the assessment of the impacts, these data were scaled with reference to the individual mass unit of apricot jam produced.
3.4. Impact Assessment Method
The impact assessment method adopted to evaluate the different scenarios considered in the LCA analysis used OpenLCA software ReCiPe v.1.13 [
30].
The impact categories and the associated characterization factors are calculated at the midpoint level [
31]. The impact categories addressed at this level are the following: climate change (CC), human toxicity (HT), photochemical oxidant formation (POF), ozone depletion (OD), urban land occupation (ULO), terrestrial ecotoxicity (TETinf), terrestrial acidification (TA100), water depletion (WD), metal depletion (MD), marine eutrophication (ME), fossil depletion (FD), ionizing radiation (IR_HE), freshwater eutrophication (FE), marine ecotoxicity (METPinf), particulate matter formation (PMF), agricultural land occupation (ALO), freshwater ecotoxicity (FETinf), and natural land transformation (NLT).
The Recipe method identifies the time horizon for the characterization model [
32], considering the sources of uncertainty and three-time perspectives [
33]:
Individualist (identified with the letter I), in the case of undisputed short-term interest impact types and technological optimism regarding human adaptation;
Hierarchist (identified with the letter H), the most common policy principle regarding the time frame and plausibility of impact mechanisms;
Egalitarian (identified with the letter E), the most conservative viewpoint for the longest time frame and all impact pathways for which data is available).
In this study, the hierarchist perspective (H) is assumed.
3.5. Results Interpretation Method
Evaluation and interpretation of the LCA results are carried out by developing a sensitivity analysis by varying the travel distance and FLW generation percentage of the scenarios Sc1–Sc4 with the aim of comparing the impact category values of these scenarios with those of Sc0 by adopting the ReCiPe method. This approach allows assessing the environmental impact of each scenario by varying the distance to be travelled and the FLW generation percentage. This method leads to providing an insight into the benefits and limits, from an environmental perspective, of each production and transportation practice.
4. Results
The numerical results of the LCA impact categories are in
Table A1 and
Table A2 of
Appendix A, for each scenario. The ReCiPe Midpoint (H) methodology (v.1.13) is applied through the OpenLCA software.
In Sc0, two main steps are considered to produce the apricot jam. In the first step, the fresh fruits are transformed into semi-finished products by adopting one of the three treatments considered (DF/LPSSD-FIR/OAT). In the second step, a particular semi-finished product is used to produce the apricot jam. The LCA results of the impact categories for each of the three semi-finished production processes are summarized in
Figure 4. In order to improve the readability of the results, in
Figure 4 relative values of impacts are shown; they have been obtained by dividing the absolute impact values (
Table A1) by the maximum impact value in each category.
Generally, jam production from dried apricots is the least impactful treatment, while the frozen process is the most environmentally impactful of the three processes considered. It can be observed that for only four of the impact categories (ALO, ULO, NLT, and WD), the aseptic process is more impactful than the other two processes.
In the following, results obtained for the CC impact category are detailed. The reason for focusing attention on it is its greater effect in environmental terms than the other impact categories (see
Table A1). In
Figure 5, CC impacts due to jam production, adopting the semi-finished products (Sc0), are compared with those of jam production starting from fresh apricots (JP), without considering transportation and FLW generation percentage. As expected, the comparison shows that jam production from fresh fruit is less impactful than jam production starting from semi-finished products. Moreover, it is possible to identify an amount of “emissions saved” corresponding to the gap between the emissions generated from the production of fresh fruit and the emissions from jam production using dried apricots (minimum gap). Similarly, the amount of saved emissions is greater in comparison with the emissions generated by jam production using frozen apricots (
Figure 5). Analogous considerations can be extended to other impact categories calculated with the ReCiPe methodology.
As discussed in
Section 2, for a reliable evaluation of impacts due to the production of apricot jam from fresh fruit, it is necessary to consider both transportation and FLW generation. As transportation distance and FLW generation percentage increase, the impacts also increase. Since the aim of the analysis conducted is to identify the most sustainable configuration of apricot jam production, the impacts of all the scenarios considered (Sc1–Sc4) have been compared with the impacts of the scenario Sc0. The comparison is based only on the CC impact category, which is the most relevant. The comparison leads to identifying, for each of the scenarios Sc1–Sc4, the threshold (maximum) values of transport distance (Sc1–Sc3) and FLW percentage (only in Sc4) for which the impacts are equal.
A first assessment is made with reference to the impacts due to the production of apricot jam from dried apricots. In this case, the threshold values of transport distance and FLW percentage obtained represent the (maximum) limit values within which the production of apricot jam from fresh apricots is the best solution from an environmental point of view. These values are reported in
Table 4 as ‘Min’ values.
A subsequent assessment is made with reference to the impacts due to the production of apricot jam from frozen apricots. In this case, the (maximum) limit values of transport distance and FLW percentage are calculated as those for which the production of apricot jam from fresh apricots is characterized by the same value of the CC impact category as the production of apricot jam from frozen apricots. Therefore, at higher values, in the comparison between the two processes, the more sustainable one is the production of apricot jam from those semi-finished products. These threshold values of transport distance and FLW percentage are reported in
Table 4 as ‘Max’ values.
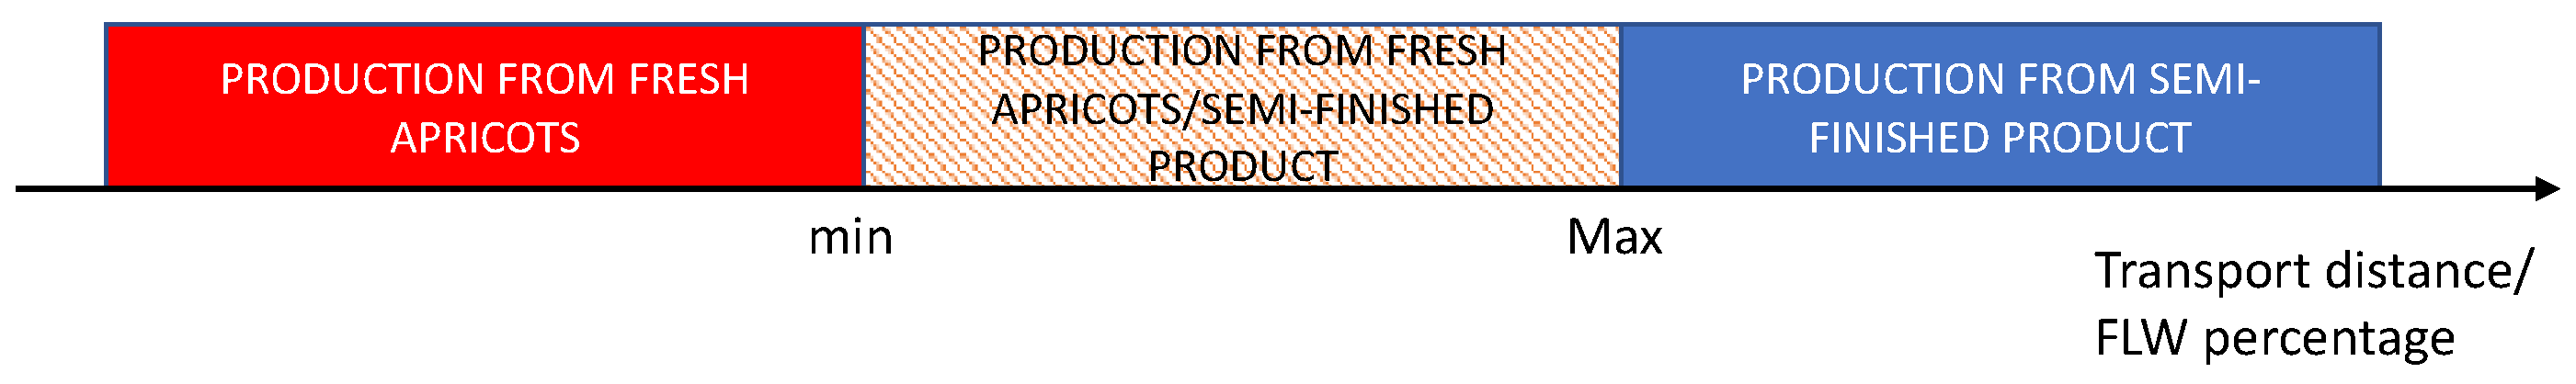
Figure 6 depicts concisely the concept of environmental convenience limits, in terms of transport distance and FLW percentage, of the jam production process starting from fresh apricots (in the different scenarios Sc1–Sc4), in comparison with the two production processes starting from the semi-finished products (dried and frozen apricots), on the basis of the minimum and maximum values (‘Min’ and ‘Max’) reported in
Table 4.
Therefore, if the transport distances or the FLW percentage for each scenario (Sc1–Sc4) are in the range between the minimum and the maximum values (
Figure 6), the process based on fresh fruits (P1) has a higher climate change impact than that of the process starting from dried apricots (P2 implementing LPSSD-FIR). Indeed, an evaluation of values is necessary to compare the P1 with the P2 implementing OAT, in order to define the best strategy. In
Table 4, the transport distances and the FLW percentage are reported with the ‘Min’ and ‘Max’ values for each scenario (Sc1–Sc4). It is noted that the analysis of these values highlights the environmental convenience of handling fresh fruit in industrial plants located in areas at a regional or national distance from the harvest site.
Although the impacts in the CC impact category are the most relevant, the comparison has been extended to other impact categories as well. The results for all the other impact categories, calculated for the ‘Min’ limit values in all the considered scenarios, are shown in
Figure 7. In the case of the ‘Min’ limit values, the scenarios (Sc1–Sc4) are characterized by the impact value in the CC impact category of the scenario Sc0, in which dried apricots are adopted as raw material (see
Figure 5).
Figure 7 shows the relative values of the impacts (obtained by dividing the absolute impact values of the considered scenarios by the higher value in each impact category).
Analogously, the results of the impact comparison for the ‘Max’ threshold limit values are shown in
Figure 8 for all the considered scenarios. In the case of the ‘Max’ threshold limit values, the scenarios (Sc1–Sc4) are characterized by the same value in the CC impact category as the scenario Sc0, in which frozen apricots are adopted as raw material (see
Figure 5). Relative impact values are shown in
Figure 8.
The results of the comparison lead to the conclusion that for the same CC impact value (see row ‘CC’ in
Table A2), the scenario Sc3 is the most sustainable compared to other scenarios (
Figure 7 and
Figure 8), its impacts being the lowest for 12 out of 18 impact categories in both figures. However, this is because in the case of the scenario Sc3, the same CC impact value is identified for a lower distance value than in the scenarios Sc2 and Sc4. On the contrary, although the scenario Sc2 has higher impact values for all impact categories except for OD, TET, MET, ULO, NLT, and FD, the highest transport distance values lead to the same CC impact value as in the other scenarios. The above considerations make it clear that when making a comparison based on the same CC impact value, depending on the transportation mode adopted, different distances and impact values in the categories considered (except CC) characterize the considered scenarios. In the next section, the scenarios are compared based on transportation distance ranges to identify the optimal system configuration in each range.
5. Discussion
The analysis performed shows that the CC impact category evaluated in the scenario Sc1, which adopts an LCV as the transportation mode, is the same as in scenario Sc0, considering the jam production from dried apricots, when the transportation distance of the fresh product is about 875 km. Similarly, the CC impact category evaluated in Sc1 is equal to that found in Sc0, considering the jam production from frozen apricots, when the transportation distance of fresh fruit is about 1260 km. This means that if the distance from the harvest site to the processing plant is lower than the identified threshold distances, jam production with fresh fruit is preferable, from an environmental perspective, to jam production with semi-finished products. In Sc2, characterized by a lorry as the transportation mode, the adoption of fresh fruits ensures better environmental performance for the CC impact category up to a distance of 3100 km when compared with the production process of dried apricots, or up to 4450 km when considering the production process of frozen apricots. Therefore, the comparison between scenarios Sc1 and Sc2 shows that the threshold distances are significantly higher (about three to four times) by adopting a lorry as the transportation mode, rather than an LCV (assuming fully loaded transport).
In scenario Sc3, adopting air transport, the use of fresh fruits for apricot jam production ensures a better environmental performance up to a distance of 1430 km, if compared to the production process from dried apricots, or up to 2075 km when considering the production process from frozen apricots. Compared to the three scenarios with varying transport distances of fresh fruit to the apricot jam production plants, Sc3 is in the middle between the first two scenarios in terms of CC impact values (
Figure 9).
In Sc4, the additional FLW generation related to the delivery time is also considered. Starting from the results of the first two scenarios and assuming the losses in
Table 2, the cases of fresh fruit transported by lorry and LCV are reconsidered. This new assessment shows that the CC impact category value in Sc4 is equal to that found in Sc0, considering the jam production from dried apricots when the transport of fresh fruit with an LCV is around 455 km. Similarly, in the case of lorry transport, jam production with fresh fruits is more sustainable than that with dried apricots up to a distance of 3075 km. In other words, the introduction of the assumptions on the FLW generation in the transport stage leads to a reduction of the threshold distances between harvesting site and plant by 48% and 1%, compared to the distances previously identified in scenarios Sc1 and Sc2, respectively.
With analogous considerations, it is possible to derive that apricot jam production with fresh fruit is more sustainable than jam production from frozen fruit up to a distance of 840 km and 4300 km, adopting an LCV or a lorry as transportation modes, respectively. This means that in Sc4, considering the FLW generation in the transport stage leads, the threshold distances harvesting site-plant are reduced by 33% and 3%, if compared to the distances previously found in scenarios Sc1 and Sc2, respectively.
The threshold values identified (
Table 4) represent the limits between the environmental convenience of the four scenarios (Sc1–Sc4) compared to Sc0, considering the CC impact factor. In this regard, it can be seen that Sc2 has a higher preference for fresh fruit processing over semi-finished product processing.
Moreover, an extensive analysis has been carried out on the FLW generation and the results highlight interesting aspects. The best solution would be the production of apricot jam in a plant located at the same place as the harvest site, as it would have no transportation activities to be considered. Under this condition, considerable plant capability would be required, and if this were not enough, FLW generation would occur due to the fruit oversupply that exceeds the plant capability. Consistently with this, the same value of the CC impact category compared with scenario Sc0 (dried semi-finished product) is obtained for high values (more than 50%) of FLW percentage. This means that, without considering the contribution of transport, the use of fresh fruit would always be more environmentally sustainable than scenario Sc0 up to high levels of FLW generation. However, as previously discussed, this result is not of practical interest due to the unavailability of large capacity plants close to the harvest sites and the need for fresh fruit transport activities. The analyses conducted show that the current plant configuration (centralized one) in apricot jam production leads to significant environmental impacts. Organizational strategies based on multiple plants (decentralized configuration) that are flexible in processing multiple types of fruit (according to seasonality) and of small capacity allow high levels of plant utilization and, at the same time, generate lower environmental impacts, also considering the required logistics supply activities. In this condition, the problem of production scheduling with perishable products in assigned time windows becomes crucial.
6. Conclusions
The agri-food sector is responsible for relevant environmental impacts, in which industrial food processes have an important responsibility. Several technologies and organizational innovations enable the reduction of environmental impacts, and the use of assessment tools represents an opportunity to guide sustainable strategic choices.
In this perspective, LCA is used to assess the environmental impacts related to different options for apricot jam production.
In this study:
Two processes of apricot jam production are considered: with fresh fruit (P1) and with semi-finished fruit (P2);
The LCA approaches “gate to gate” and “gate to grave” are used to compare P1 and P2 processes from the environmental perspective;
Due to P1 issues related to short fruit shelf life, harvest time window, and capacity constraints, four scenarios (Sc1–4) were developed, devising the production of apricot jam in more plants (decentralized solution) consequently; as a result, different transportation modes and FLW generation percentages were considered, and the LCA results of the Climate Change impact category were compared to those of scenario Sc0, taken as reference, in which apricot jam is made in the same plant where semi-finished fruit is produced all year, according to P2 (centralized solution);
The threshold values ‘Min’ and Max’ (deriving from the comparison with Sc0 processing dried and frozen apricots, respectively) of distance and FLW percentage in the four scenarios (
Table 4) are identified to discern the best production strategy (centralized or decentralized) under the mentioned environmental point of view (CC impact category).
The use of fresh apricots for jam production in plants located far from the harvest sites is environmentally preferable to processing semi-finished products for national distances and considering lorry transport over longer distances as well. Unlike in other studies, logistic impacts are considered in the environmental assessment of the centralized or decentralized option. Conclusions suggest that for more sustainable jam production, it should be possible to plan the jam production with fresh apricots by delocalizing the processing treatment to more plants located in different areas. A similar concept can be found in the preparation of artisanal ice creams using seasonal products and in the production of seasonal jam [
34]. In this way, plant capability constraints could be relieved and the distribution of fresh fruits over more plants would ensure greater flexibility in terms of production. At the same time, flexible and small-capacity plants should become suitable for processing multiple types of fruit, depending on seasonality, keeping high utilization levels throughout the year. The study shows that, in many cases, this option can be more eco-friendly if compared to jam production with semi-finished products, which is currently the most widespread practice on an industrial scale. This highlights the need to improve the environmental sustainability of industrial food processes, which are still very impactful. Moreover, the study shows that the FLW generation percentage has a negligible impact on the CC category because, in many cases, FLWs are recycled or reused by third parties (e.g., fertilizer production, secondary foods, upcycled ingredients, etc.). Nevertheless, if, from an environmental perspective, the impact is quite low, from an economic and social point of view, the minimization of FLW is a very important goal.
Further development of this work will focus on reducing food waste by planning distribution to small local food processing plants and exploiting the flexibility of seasonal flows.


