Article

Climate Adaptation and Indoor Comfort Improvement Strategies for Buildings in High-Cold Regions: Empirical Study from Ganzi Region, China

1
School of Architecture, Xi’an University of Architecture and Technology, Xi’an 710055, China
2
School of Economic Information Engineering, Southwestern University of Finance and Economics, Chengdu 611130, China
3
Xi’an Housing and Urban-Rural Construction Bureau, Xi’an 710054, China
4
Chongqing College of Electronic Engineering, Chongqing 401333, China
*
Authors to whom correspondence should be addressed.
Sustainability 2022, 14(1), 576; https://doi.org/10.3390/su14010576
Submission received: 22 November 2021 / Revised: 28 December 2021 / Accepted: 29 December 2021 / Published: 5 January 2022

Abstract

:
The improvement of building and living conditions in high-cold areas has always been an issue worthy of attention, but there is currently no research using field survey data for evaluation. The Ganzi region, based in the western plateau of China, is a typical example for such a study. Restricted by factors such as natural conditions and economic level, the winter indoor thermal environment of western plateau houses is generally poor. Taking the new residential houses in the Ganzi region as a case study, the authors of this paper conducted field research and analyses. First, the authors analyzed the construction technology and functional layout of the building through thermal environment testing and investigation; second, the authors analyzed the user’s activity path according to the production and lifestyle; thirdly, the authors comprehensively evaluated the indoor thermal comfort through questionnaires and a predicated mean vote (PMV)-predicted percentage dissatisfied (PPD) evaluation model. The research results showed that: (1) the construction technology, functional layout, and temperature distribution of the new residential building were consistent with the user’s activity path, which could effectively improve thermal insulation ability and thermal comfort; (2) compared to the developed eastern regions, the users in the building showed a stronger tolerance and wider acceptable temperature range in the extreme climate environment; and (3) under certain cooperative work conditions, an indoor temperature of 10–14 °C could meet basic thermal environment requirements and thus lower the limits of the standards. The author’s method was proven to be more resilient than current standards in dealing with climate change. Therefore, this research can provide a practical reference for the improvement of peoples’ living conditions and sustainable development in cold regions and other harsh areas.

1. Introduction

At present, many people in the world still live in plateaus or alpine regions, such as the Alps in Europe, the Andes in South America, and the Qinghai–Tibet Plateau in China. The climatic conditions in these regions are much worse than those in the plains. Studying the living conditions of people in these areas is a meaningful topic for sustainable development. The Tibetan Plateau has always been a typical sparsely populated area due to its harsh natural environment [1]. However, since 1949, the population and footprint of human activities on the Qinghai–Tibet Plateau have been continuously increasing. Thus, so far, the population size in China in this region has increased by more than four times than that in 1949. This sparsely populated area is experiencing active population growth [2]. However, the natural characteristics of high-cold regions, such as an average altitude of more than 4000 m, thin air, low temperature, deep permafrost, strong solar radiation, and fragile ecological environment, are not conducive to human living. The research of buildings in this type of region can not only improve indoor thermal environments, but also help to promote sustainable population development.
Ganzi is located in the transition zone between the Qinghai–Tibet Plateau and Sichuan Basin, and it has an average altitude of 3500 m. Due to its large fluctuation of topography, the available construction land only accounts for one third of the total area, but it accommodates about 1.1 million people. The population aggregation effect is obvious, showing the phenomenon of high population density [3,4]. In Kangding city, the regional population density of some areas is 10,684 people/km2 [5]. In recent years, although the population had continued to increase, the indoor thermal environments of buildings have remained unable to meet the physiological needs of people, so it is urgent to improve them. It has been found that there are many problems in building envelopes, such as poor air tightness, serious cold air leakage, low solar energy efficiency, and a lack of necessary energy-saving measures. At present, there have been many research achievements regarding buildings in high-cold regions. Sun et al. [6] changed the space-arrangement and increased the wall thermal resistance, and they found that the bedroom temperature increased by 609.1% and 239.1%, respectively. He et al. [7] improved the indoor thermal environments of dwellings in Western Sichuan Plateau by strengthening the utilization of solar radiation, improving the thermal insulation performance of envelope structures, and setting up reasonable sunlight rooms. Following analysis, Ma et al. [8] suggested that the design temperatures of different rooms should be different. Li et al. [9] suggest that under the limited economic or resource conditions in northwest China, the heat-storage performance of the south wall can be appropriately reduced while the demand of the north wall can be given priority. Liu et al. [[10]] suggested the further refinement of the division of cold regions and proposed corresponding design strategies. Ikeda et al. [11] compared three heat-sensitivity indicators, and the results showed that the prediction method of linking predicated mean vote (PMV) with the psychological and behavioral adaptation of the occupants was the most accurate and effective. Liu et al. [12] discussed the relationship between lifestyle and the natural environment at high altitude area. Nikolopoulou et al. [13] believed that increasing the communication between human and nature can enhance human’s ability to adapt to low temperature environment.
To sum up, most studies on buildings in high-cold areas focus on improving the thermal insulation performance of the envelope, and some scholars also study from the perspective of functional layout and psychological feelings. However, these studies are only discussed from one aspect and lack of multi-factor correlation analysis. The living environments of high-cold regions are different from those of plain regions. In addition to the necessary heat-preservation measures, factors such as behavior habits and lifestyle should also be considered. Therefore, the authors of this paper analyzed the correlations between the thermal insulation measures, functional layout, and lifestyle of the research object, and they propose the establishment of a synergy mechanism. The research results can be used to improve the design method of indoor thermal environments, put forward a more reasonable indoor temperature design standard, and promote the sustainable development of buildings in high-cold regions.

2. The Regional Climate and Research Object

2.1. The Climate Information

Figure 1a shows that China’s solar radiation intensity greatly varies in different regions, and that of the northwestern plateau region is significantly higher than other regions. The average altitude of Ganzi is 3394 m, the coldest month occurs in January, the winter freezing period (≤5 °C) is long (it lasts about 5 months), the average temperature (Tav) of the coldest month is below −3.0 °C, and the climate is cold and changeable, so this region presents the characteristics of extreme cold climate. Comparing the meteorological parameters of cities in different regions in January showed (Figure 1b) that the sunshine time (240 h) and Tav (−3 °C) of Ganzi in January are different from those in Chengdu (40 h/5.6 °C, respectively). However, the values were found to be similar to the Lhasa (250 h/−1.6 °C) and Qamdo (280 h/−2.1 °C) regions of higher elevations. Therefore, Ganzi’s climatic characteristics are typical, its sunshine time is sufficient, and it has a large potential for solar energy utilization.

2.2. The Development Process of Dwelling in Ganzi

Except for large-scale government projects and public buildings, local dwellings are still mainly self-built, and there is no local architectural design standard system. Following a long evolution, the forms of dwellings have changed a lot. The development route of dwellings in Ganzi shown in Table 1 can be summarized as follows: the materials have changed from stone and wood bungalows to brick and wood buildings, the area has increased in size from small to large, technology has changed from simple to complex, and the materials use has increased.

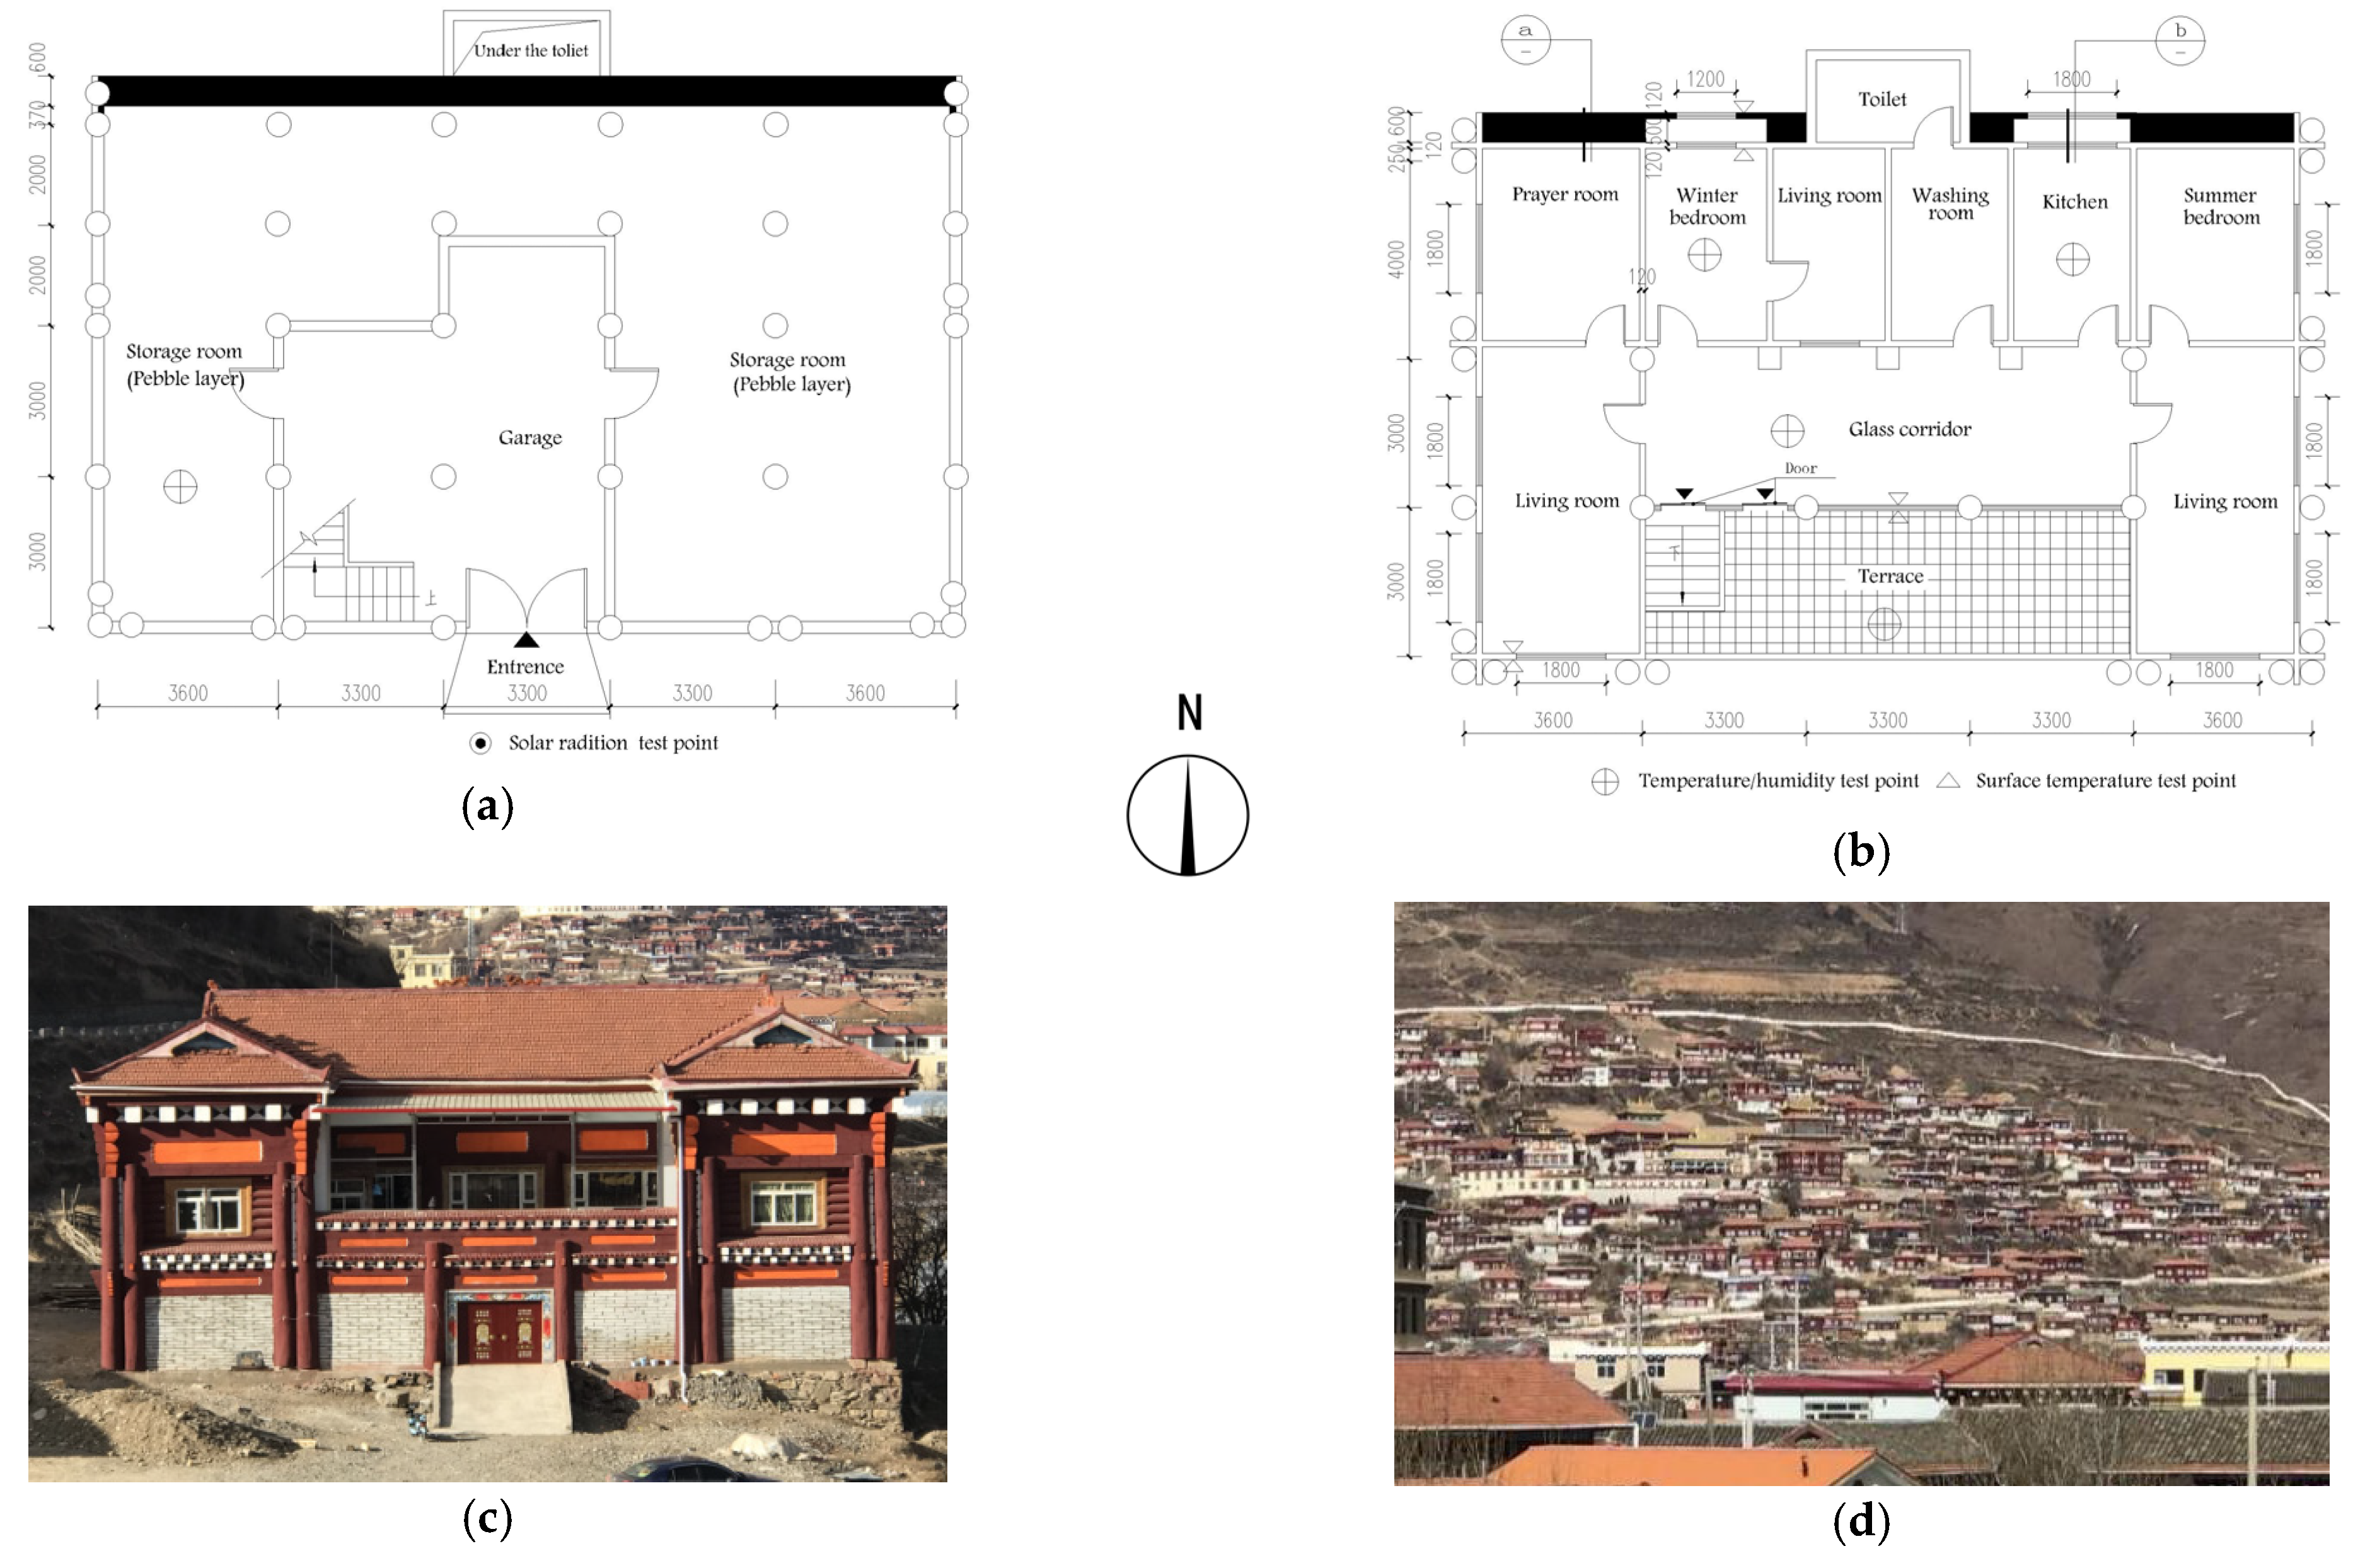
2.3. The Research Object Information

The research object was a two-story Tibetan-style dwelling located in Luhuo county, Ganzi Tibetan District. The building faces south and is located in an open area. It is regular in shape, its internal layout is compact, and its roof plan is U-shaped. There is no municipal central heating and other mechanical heating equipment in the building, the residents of which mainly rely on solar radiation and stove heating. Table 2 shows the size information and functional layout of the studied vernacular dwelling. Figure 2a,b shows the location of each room in the building. The first floor is mainly storage space, and the main use space is located on the second floor. Figure 2c,d shows the appearance and environment of the building. The information shows that the dwelling is a multi-story building, and living rooms are distributed in the middle floor, with air layers above and below to keep them warm. The U-shaped plane of the second floor provides the glass corridor and terrace with a strong sense of enclosure in order to obtain more solar radiation, resist the cold north wind, and reduce heat loss.

3. The Optimization of Building Envelope

3.1. Building Material Information

New-type vernacular dwellings have been optimized in terms of building materials, and the following principles have been followed in the selection of materials: (1) the original architectural characteristics of Tibetan residential buildings should be retained; (2) materials should be easy to obtain, process, and transport; and (3) construction materials should have good heat storage capacity and thermal insulation performance. Table 3 and Table 4 show the detailed information and the physical parameters of relevant building materials, respectively.

3.2. Energy-Saving Technical Methods for Building

Due to the shortage of conventional energy available in the local area, new-type vernacular dwellings have adopted more passive energy-saving technologies, optimized the details of node structures, strengthened the insulation performance of envelope structures, increased solar energy utilization efficiency, and effectively improved the building ability to adapt to cold environments. The residents of the research object adopted the following energy-saving measures:
(1)
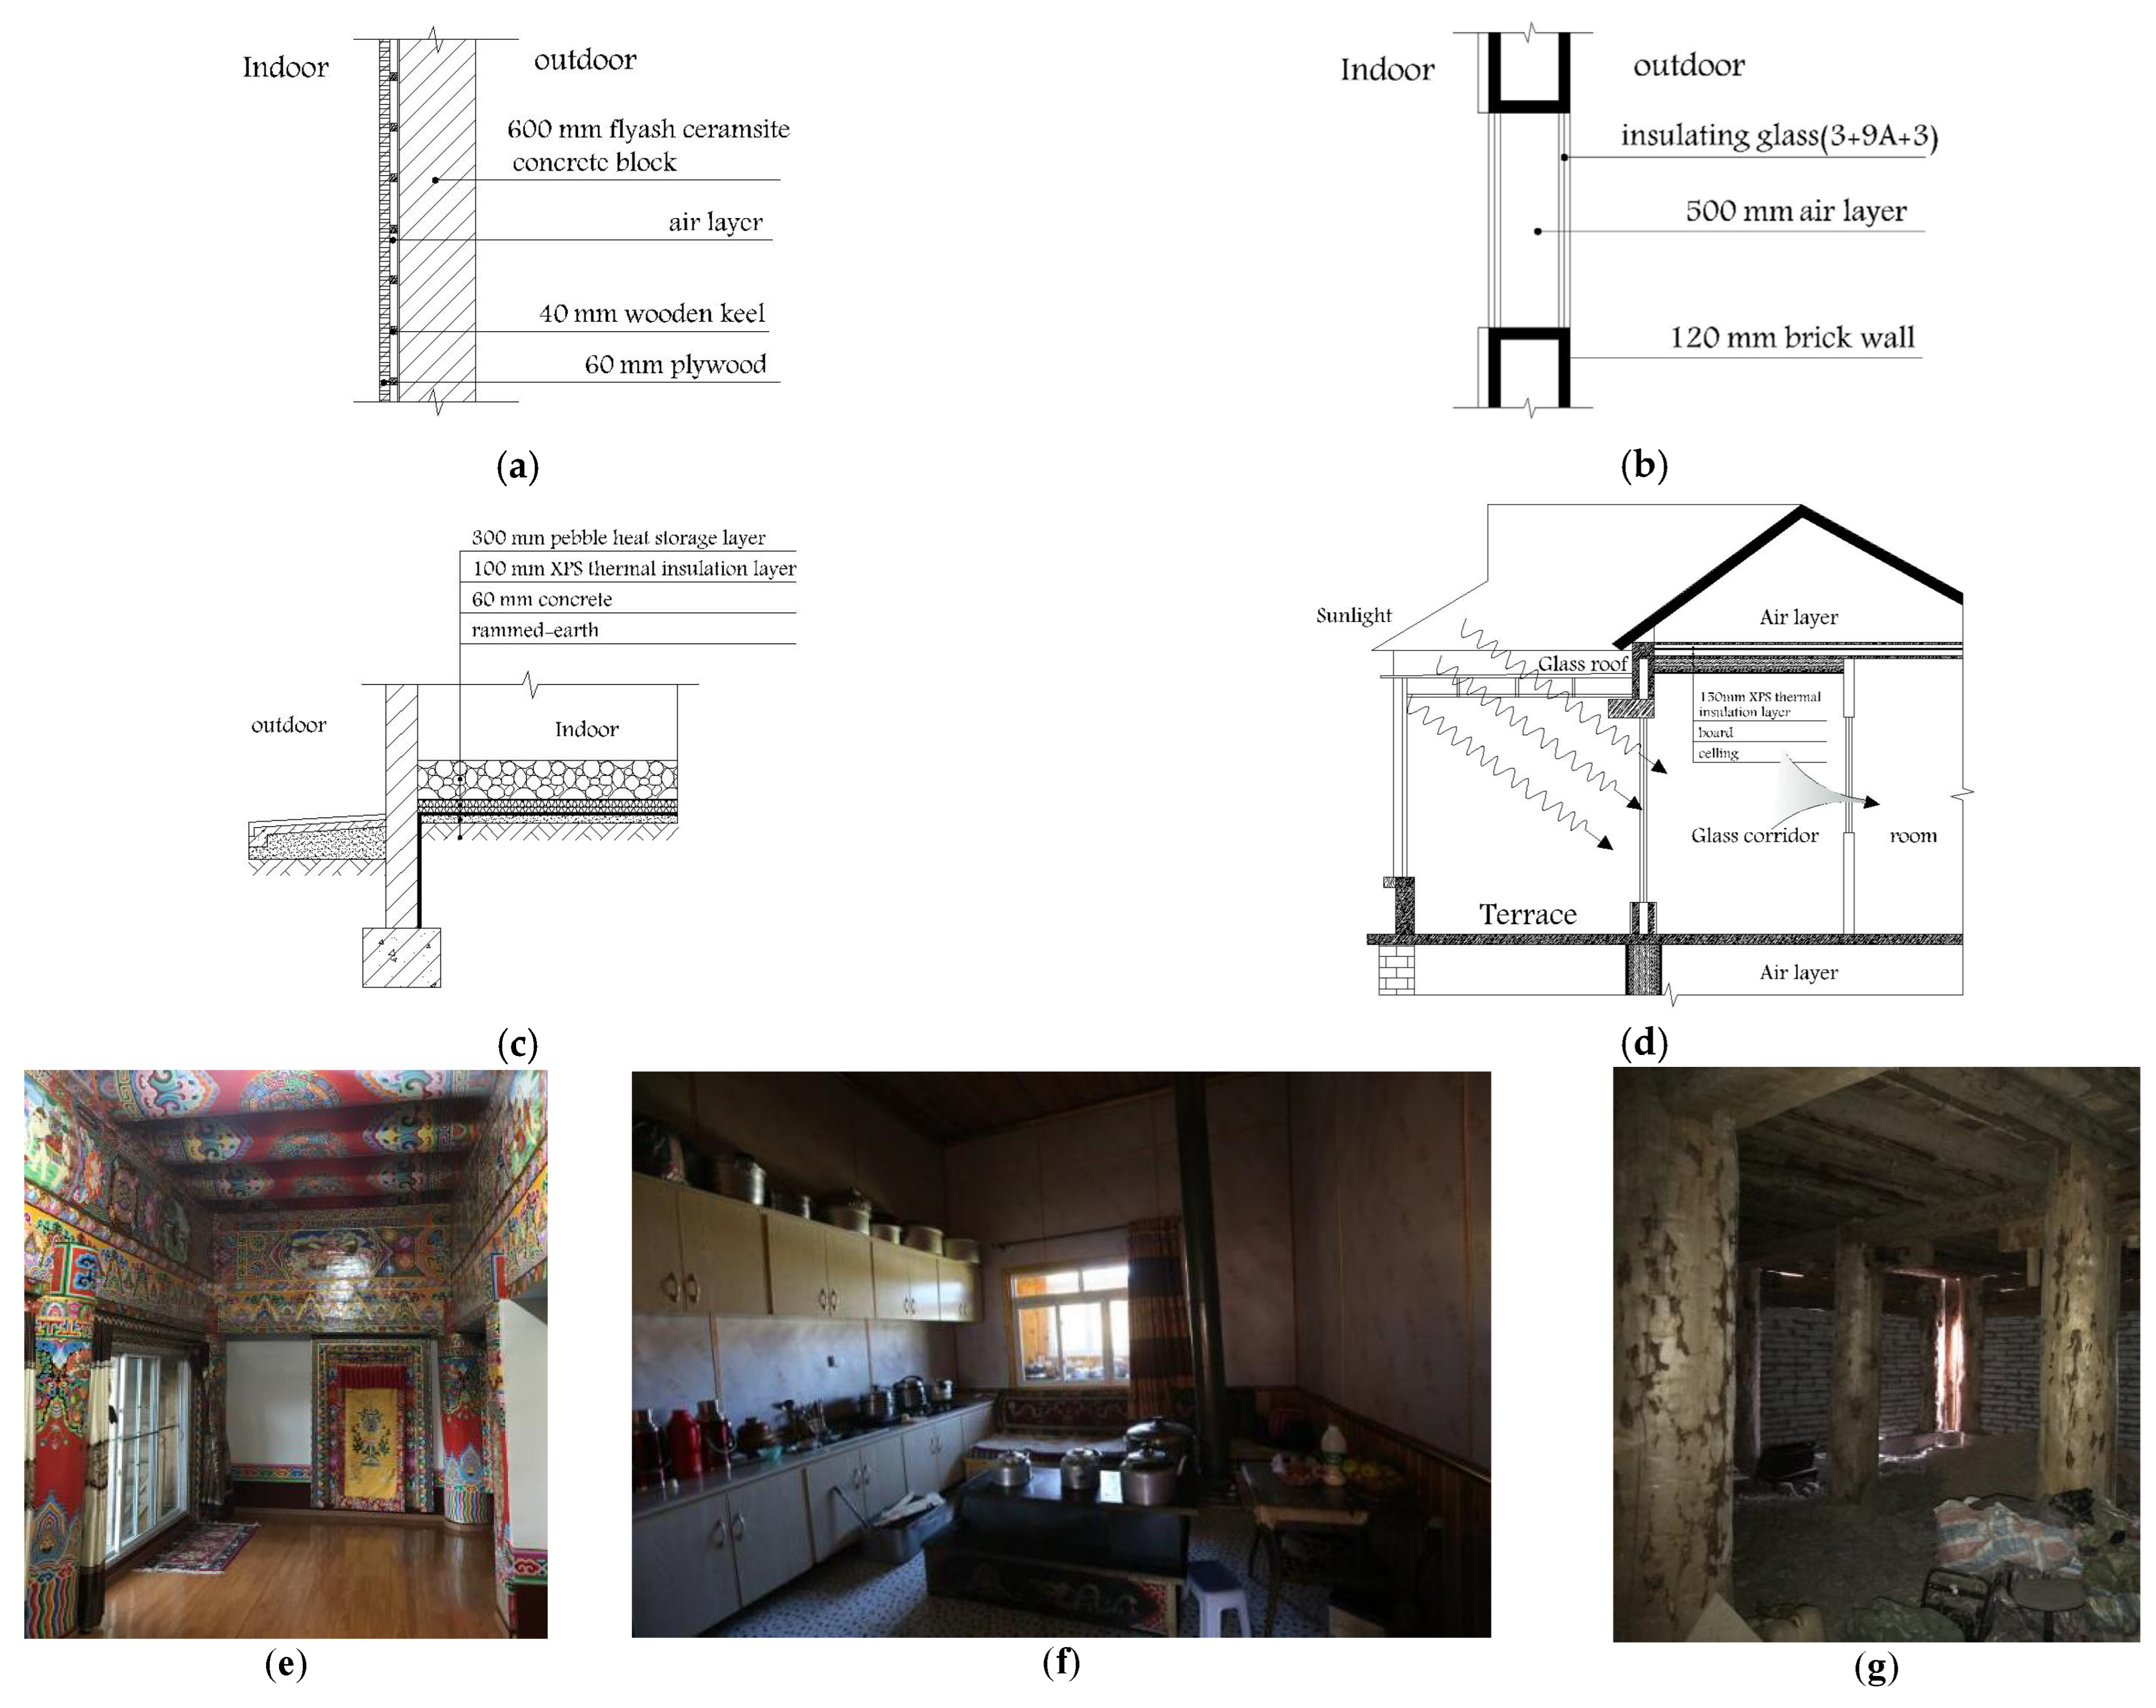
“Composite wall” structure: the unfavorable north-outer wall is 600 mm thick, with a wooden keel connected in the middle (air layer) and a plywood of about 30 mm thick on the inside (Figure 3a), which is able to effectively improve the heat storage and insulation performance of the north-facing room wall.
(2)
“Air-layer” structure: the main use space of the building is located on Floor 2, and Floor 1 and the roof loft form an “air-layer” (Figure 3d) that serves as a cold air buffer layer. This layer can reduce heat loss and enhance the insulation ability of the middle floor.
(3)
“Double-window” structure: the winter bedroom and kitchen use “double-windows” with an interval of about 500 mm; the middle space is an air layer (Figure 3b), which also serves as a storage space.
(4)
“Heat storage layer” structure: The ground of Floor 1 is a 300 mm thick pebble heat storage layer, and the interface between the pebble layer and the foundation is insulated with 100 mm thick EPS thermal insulation to form a “heat storage” layer (Figure 3c) that can minimize the loss of heat. Testing allowed for the creation of a temperature change curve, which showed that the fluctuation range of the pebble surface temperature was from −1 to 15.4 °C; next, we were able to calculate the total energy storage of the pebbles with the relevant parameters (Table 5).
The amount of heat absorbed by pebble from 0 to 15.4 °C:
Q = Cm △t = 0.92 × 2400 × (108.90 × 0.3) × (15.4-0)] = 1,104,763.97 (KJ)
(5)
“Sunshine Room” structure: the passive sunlight room is in the south side of the building, and below the sunlight room is a 500 mm high aerated block wall. In the daytime, the doors and windows of each room are opened, and the sunlight exchanges heat with other spaces through heat collection. At night, the doors and windows of the indoor rooms are closed to reduce heat loss (Figure 3d).
(6)
Controlling the shape coefficient and window–wall ratio: The data showed that for every shape coefficient increase of 0.01, energy consumption increased by about 2.4–2.8%; on the contrary, the energy consumption was reduced by 2.3–3% [14]. When an area is between 60 and 180 m2 large, a shape coefficient in the range of 0.88–0.58 is not conducive to energy saving [15]. It can be seen from Table 2 that the shape coefficient of the research object was 0.36, which could reduce the heat exchange on the outer surface. The window–wall ratio of the north wall was 0.043, which could reduce heat leakage, and the window–wall ratio of the south wall was 0.182, which could increase the solar radiation heat.

4. Indoor Thermal Environment Test and Result Analysis
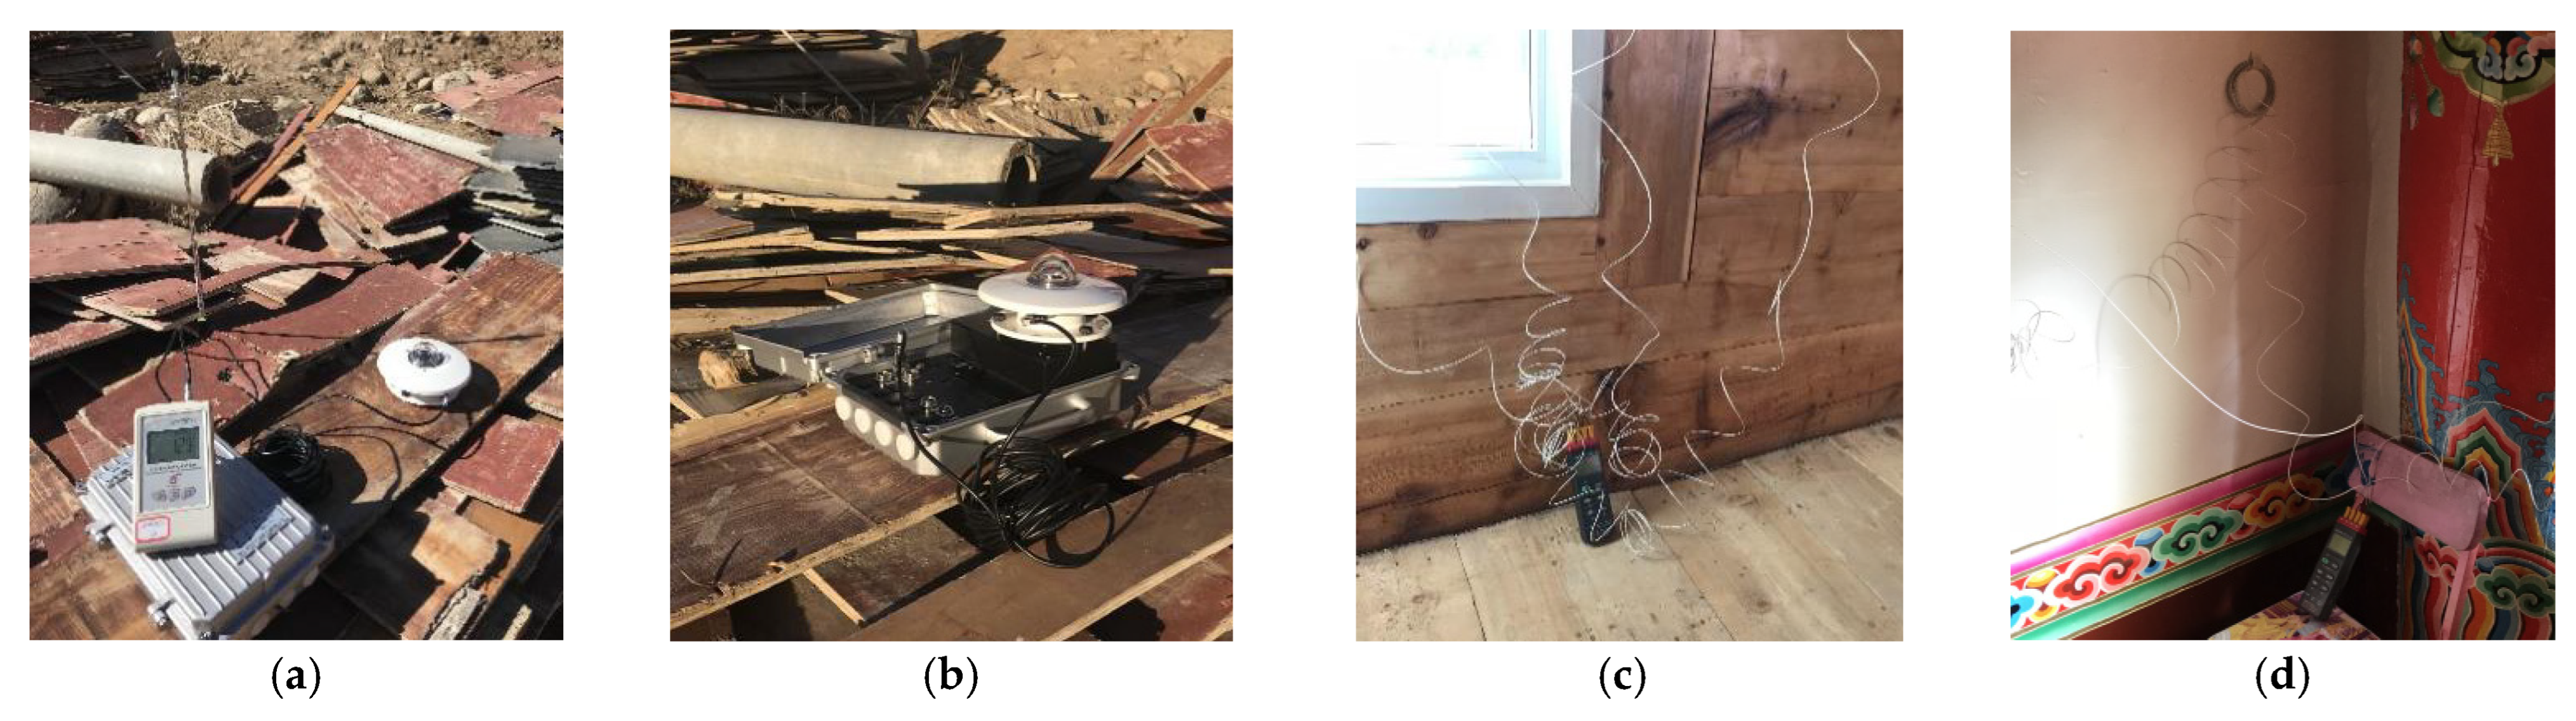
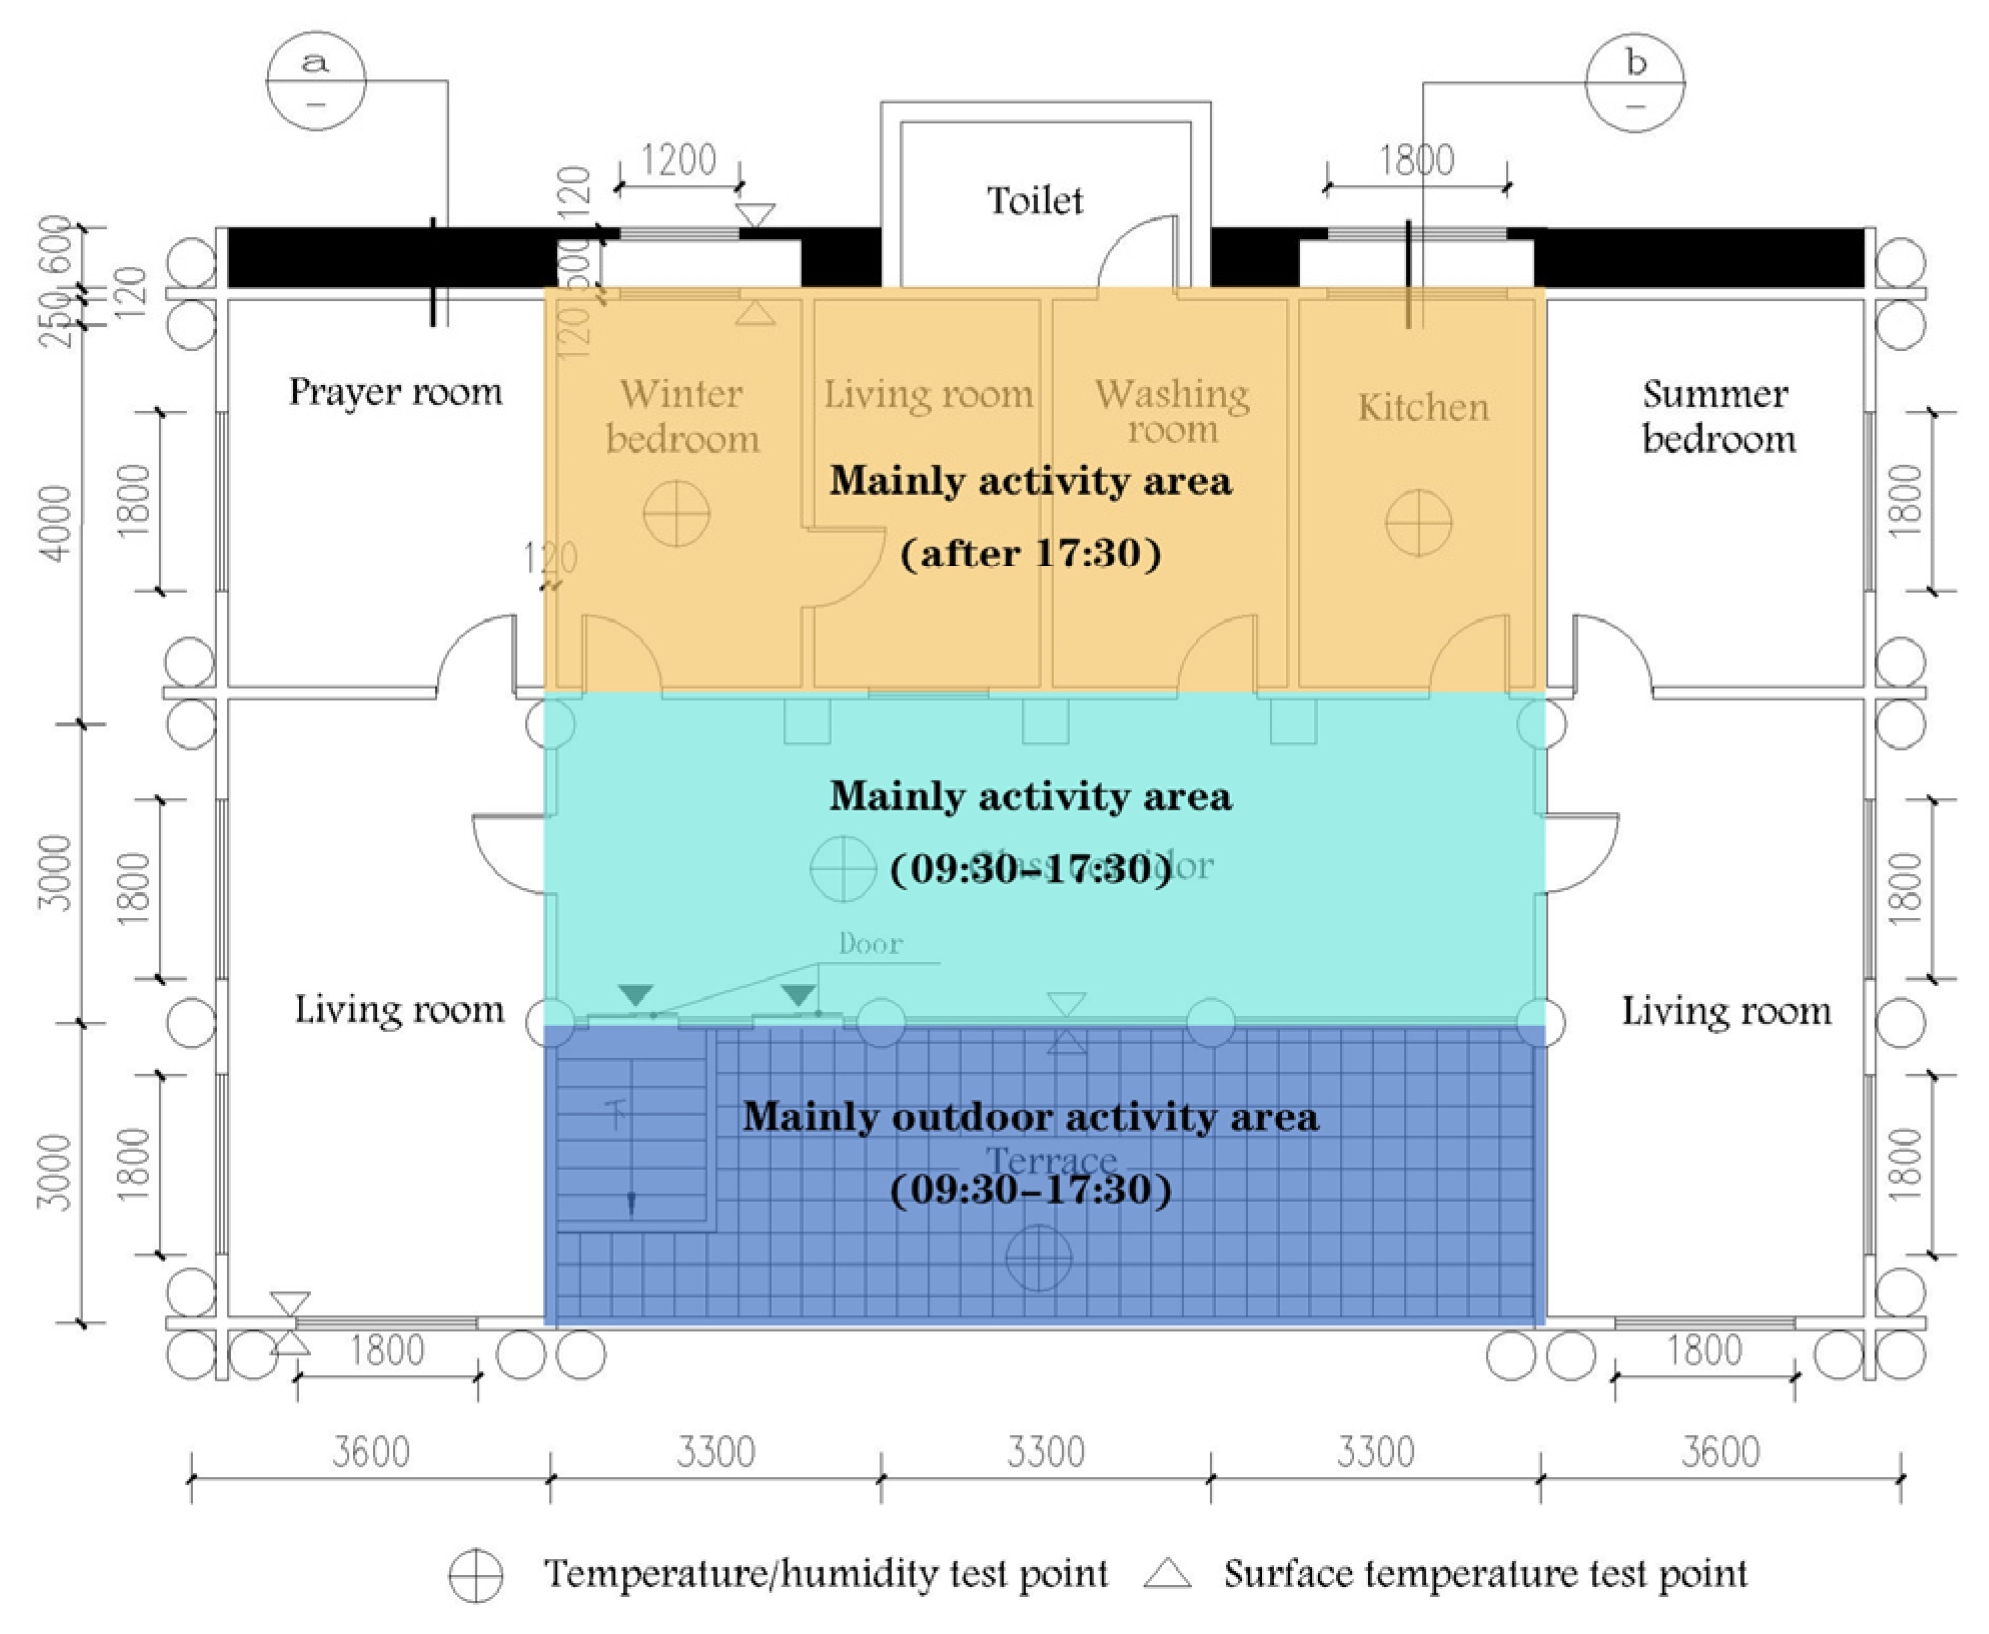
4.1. Test Program

According to the meteorological data of NMC (Ganzi, China), the monthly average lowest temperature in Ganzi prefecture appears in January. Therefore, we chose the test time to be from 08:00 on 15 January 2020 to 18:00 on 16 January 2020. Test items included: solar radiation intensity, air temperature and humidity, and the surface temperature of the envelope. The solar radiation test point was selected in the open outdoor field. The air temperature and humidity test points were pebble surface, glass corridor, winter bedroom, kitchen, and outdoors. The surface temperature test points of the envelope were the south wall of the living room, the south glass of the glass corridor, and the north wall of the winter bedroom. Table 6 presents the test items, instruments, and related parameters. Figure 4a–d shows the test site and instruments.

4.2. Test Results and Analysis

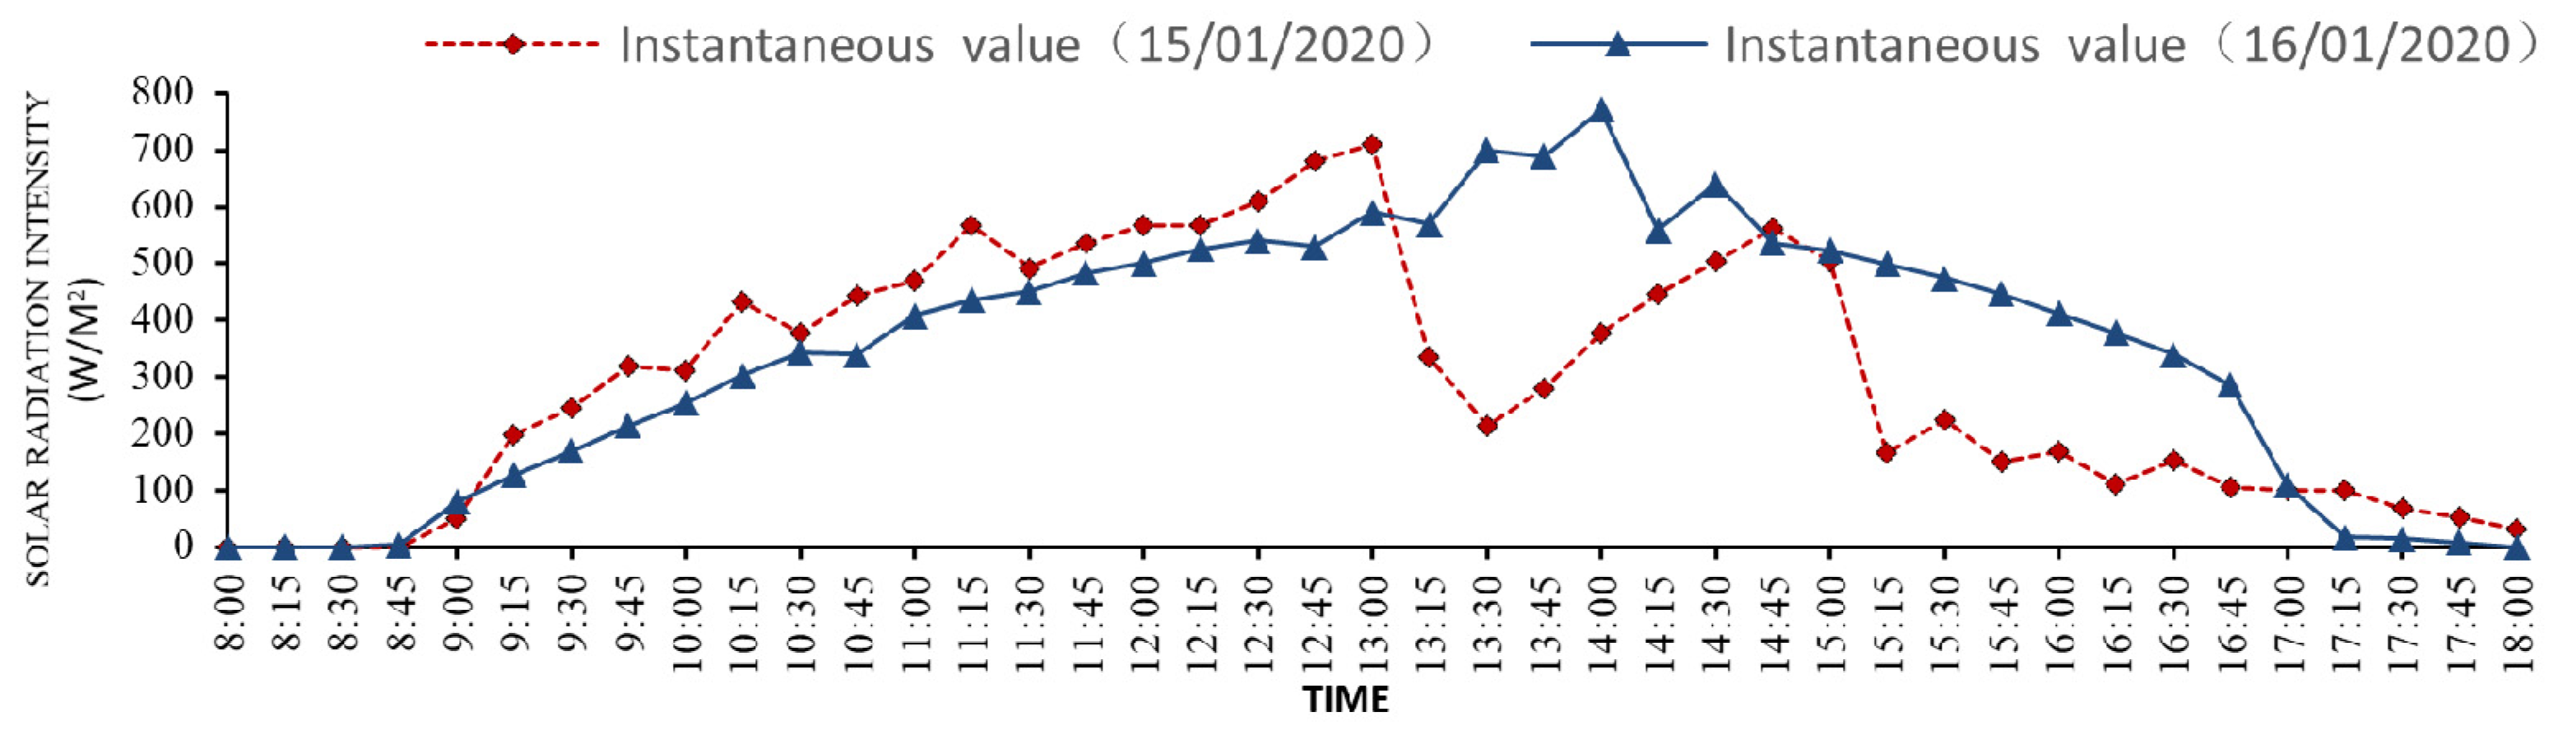
4.2.1. Solar Radiation Intensity Test

Figure 5 shows the solar radiation intensity test curve of two days. The results show that the average radiation intensity values at 8:00–18:00 on the 15th and 16th were 317.1 and 369.2 W/m2, respectively; the maxima on the 15th and 16th were 710 and 771 W/m2, respectively, and they appeared between 12:30 and 14:00 (at around 13:30 on the 15th, the radiation value rapidly decreased due to cloud cover). The cumulative values of radiation on the 15th and 16th days were 10.725 and 12.526 MJ/m2 (1 KWh = 3.6 MJ), respectively. The effective solar radiation period was found to be 09:00–17:30. The data showed that the place has a high proportion and long duration of direct sunlight in the winter, high radiation intensity, and abundant radiation resources, which demonstrate its suitability for passive solar heating design.

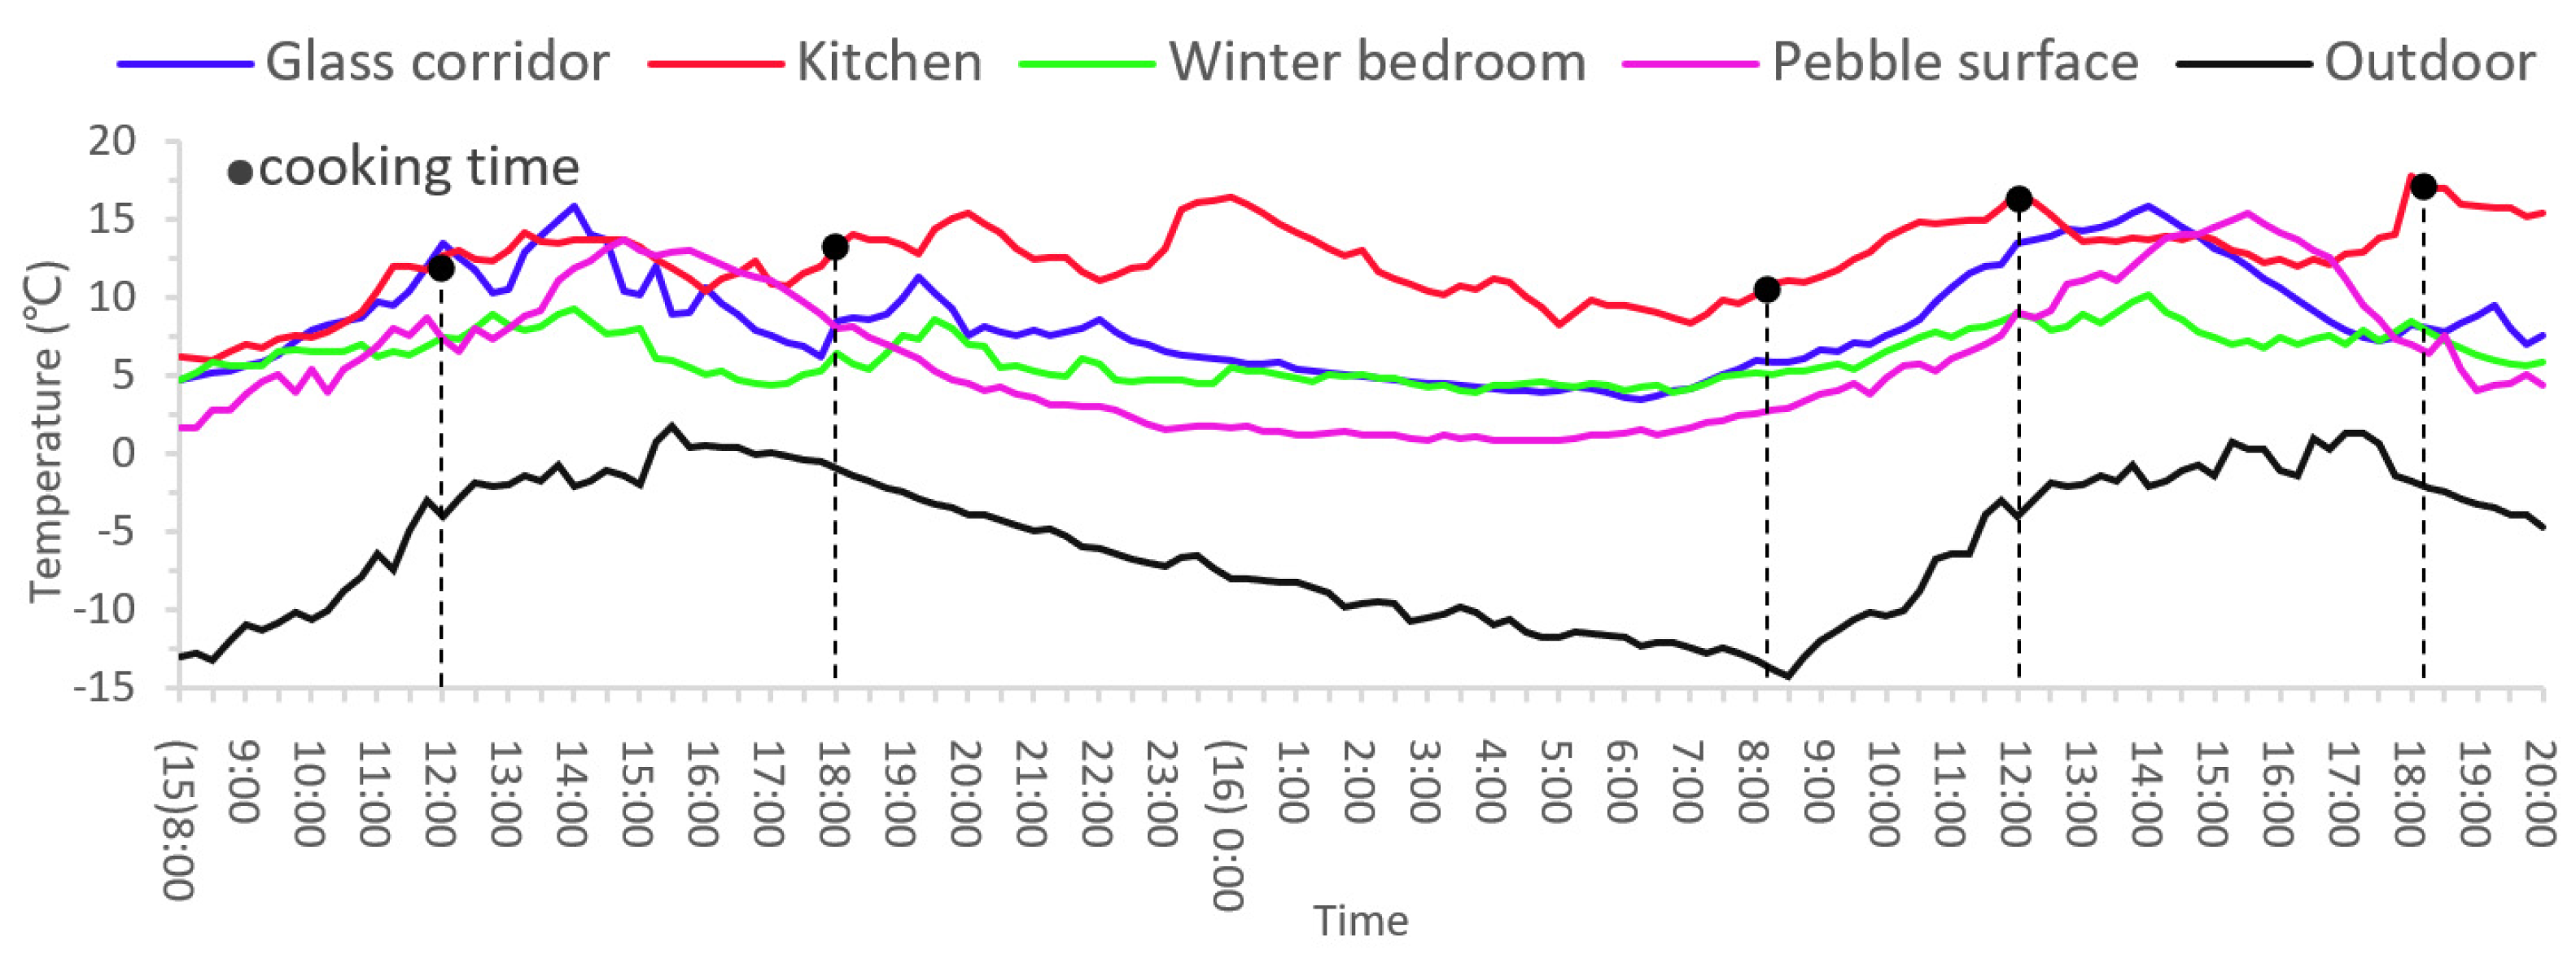
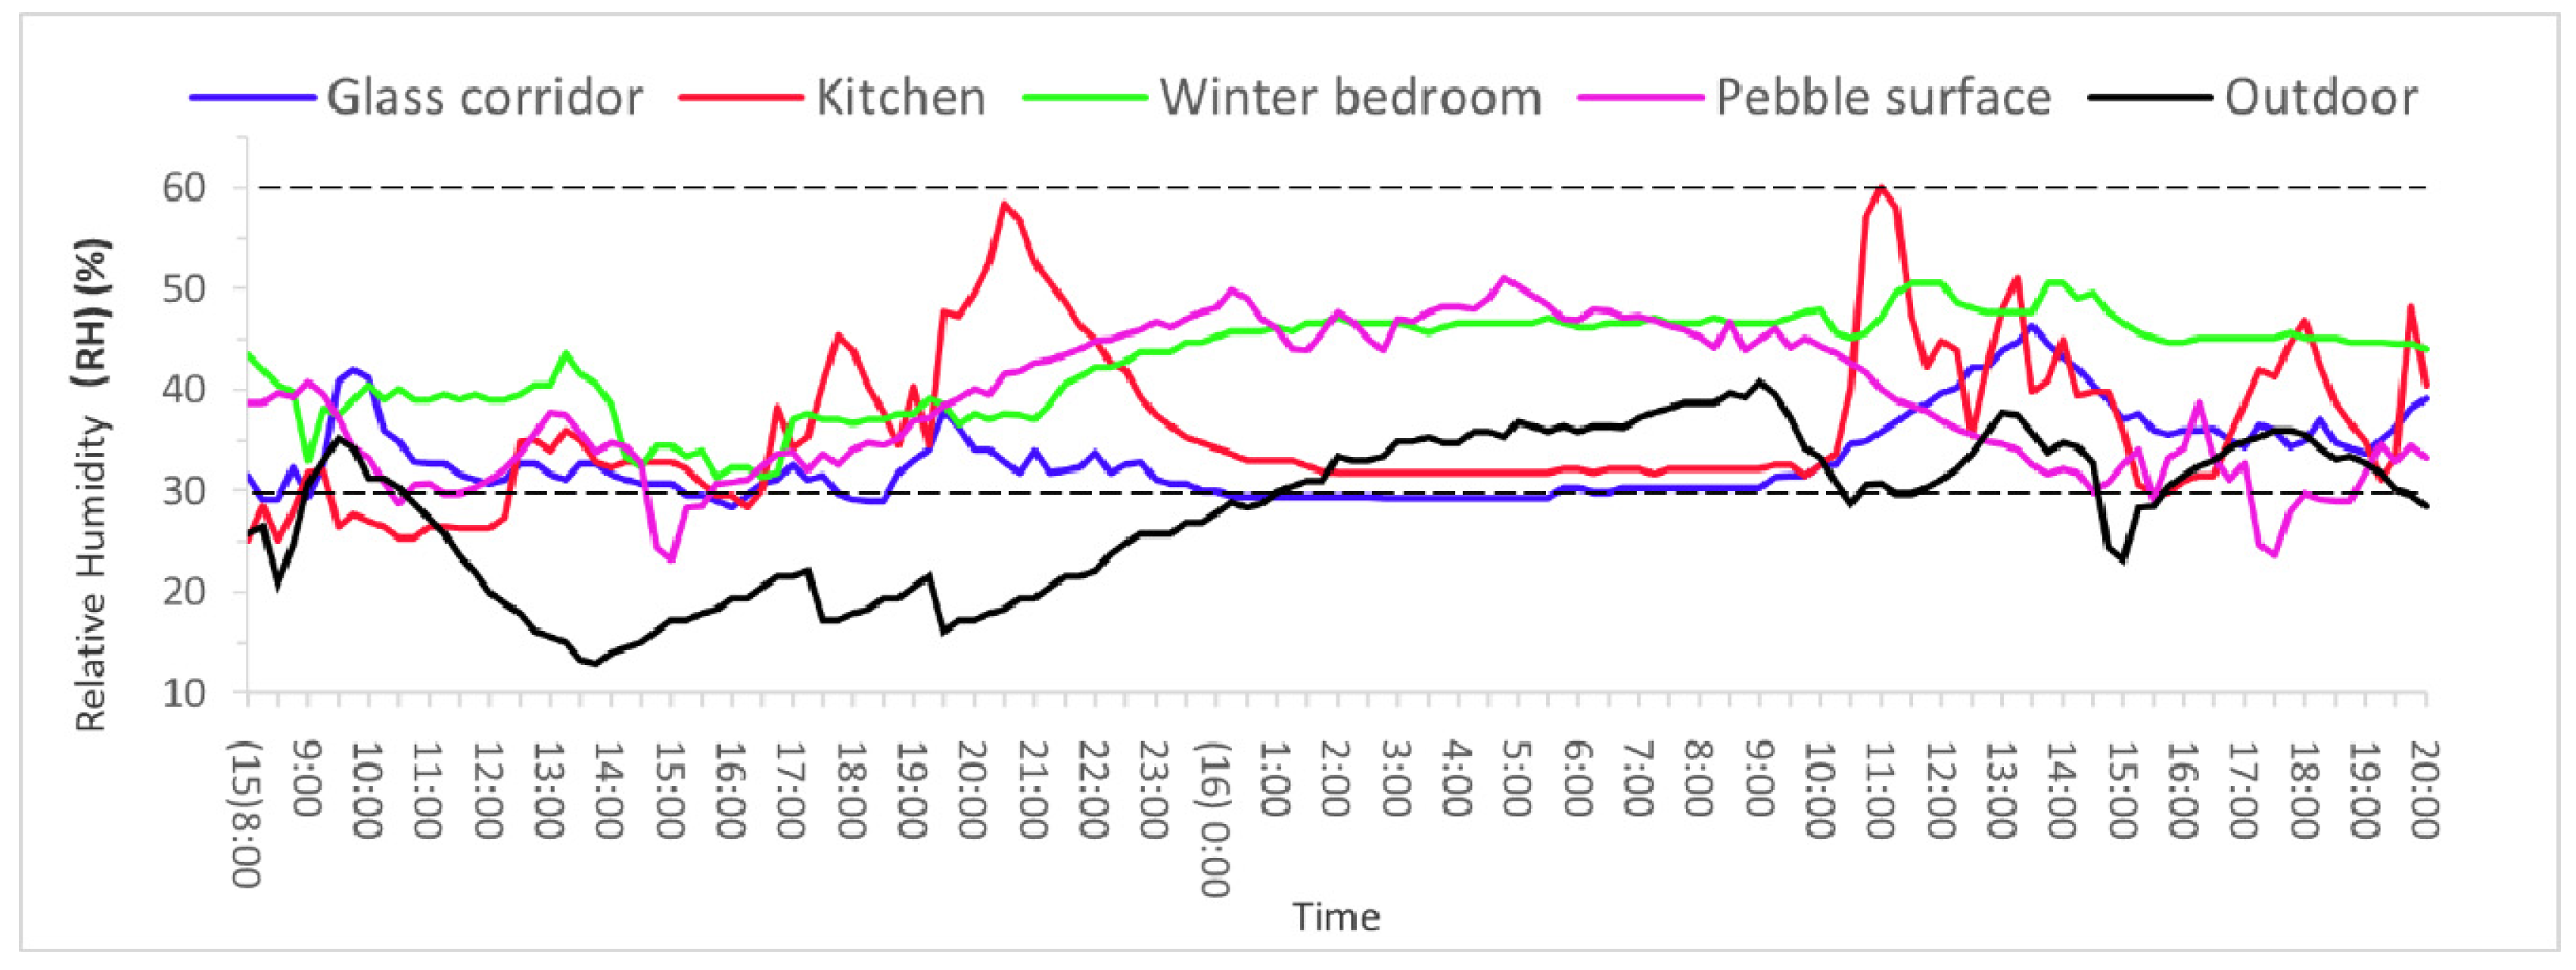
4.2.2. Air Temperature and Humidity

Figure 6 presents the air temperature change curve of our test points. The results show that during two consecutive test days, the average temperature of the glass corridor, kitchen, winter bedroom, pebble layer surface, and outdoors were, 8.3, 12.3, 6.2, 6.0, and −5.8 °C, respectively. The maximum and minimum values of outdoor air temperature were 1.50 and −14.3 °C, respectively, and the maximum temperature difference was 15.8 °C. The trend of other temperature changes was basically the same (except for the kitchen), and the maximum and minimum values appeared at 12:00–15:00 and 08:00–10:00, respectively. The kitchen is the only artificial heat source inside the building, and its temperature change is closely related to human activities; its high temperature point mostly appeared during cooking activities (at around 00:00 in the night, the residents added coal to the furnace, so there were high temperatures during this period). The results demonstrated the following. (1) Compared to the outdoor temperature, the indoor temperature maintained good stability, and the average temperatures of the kitchen and glass corridor were relatively high. The winter bedroom had relatively low temperatures (ranging from 3.0 to 10.1 °C), but it also maintained a good thermal environment. (2) In the daytime, the solar radiation had a significant effect on the heat collection of the building. At night, the kitchen was found to have a significant heat radiation effect on other rooms. (3) The pebble heat storage layer was found to have good heat storage performance and heat radiation effect. The construction measures displayed in Table 2 play important roles in maintaining the indoor thermal environment of the main space.
Figure 7 presents the relative humidity (RH) change curve of test points. The results show that the average RH values of the glass corridor, kitchen, winter bedroom, pebble layer, and outdoors were 33.1%, 36.1%, 42.9%, 38.5%, and 28.6%, respectively. The outdoor RH was lower than that of the other test points. Due to the influence of cooking activities, the fluctuation range of the kitchen RH curve was large. The RH curve trend of other test points was more balanced, and the overall curve fluctuation was slightly delayed in comparison to that of the kitchen, indicating that cooking activities have regulating effects on air humidity. Our analysis demonstrated the following. (1) The dry and cold characteristics of outdoor air were more obvious. (2) The fluctuation range of indoor RH in most periods was 30–45%, which meets the standardized comfort zone of 30–60% in the winter [16]. (3) The indoor wind speed was maintained near 0 m/s, and there was basically no wind sensation. The fluctuations of indoor RH and wind speed were small. The moisturizing effect of the envelope structure was obvious, and thermal comfort was adequate.

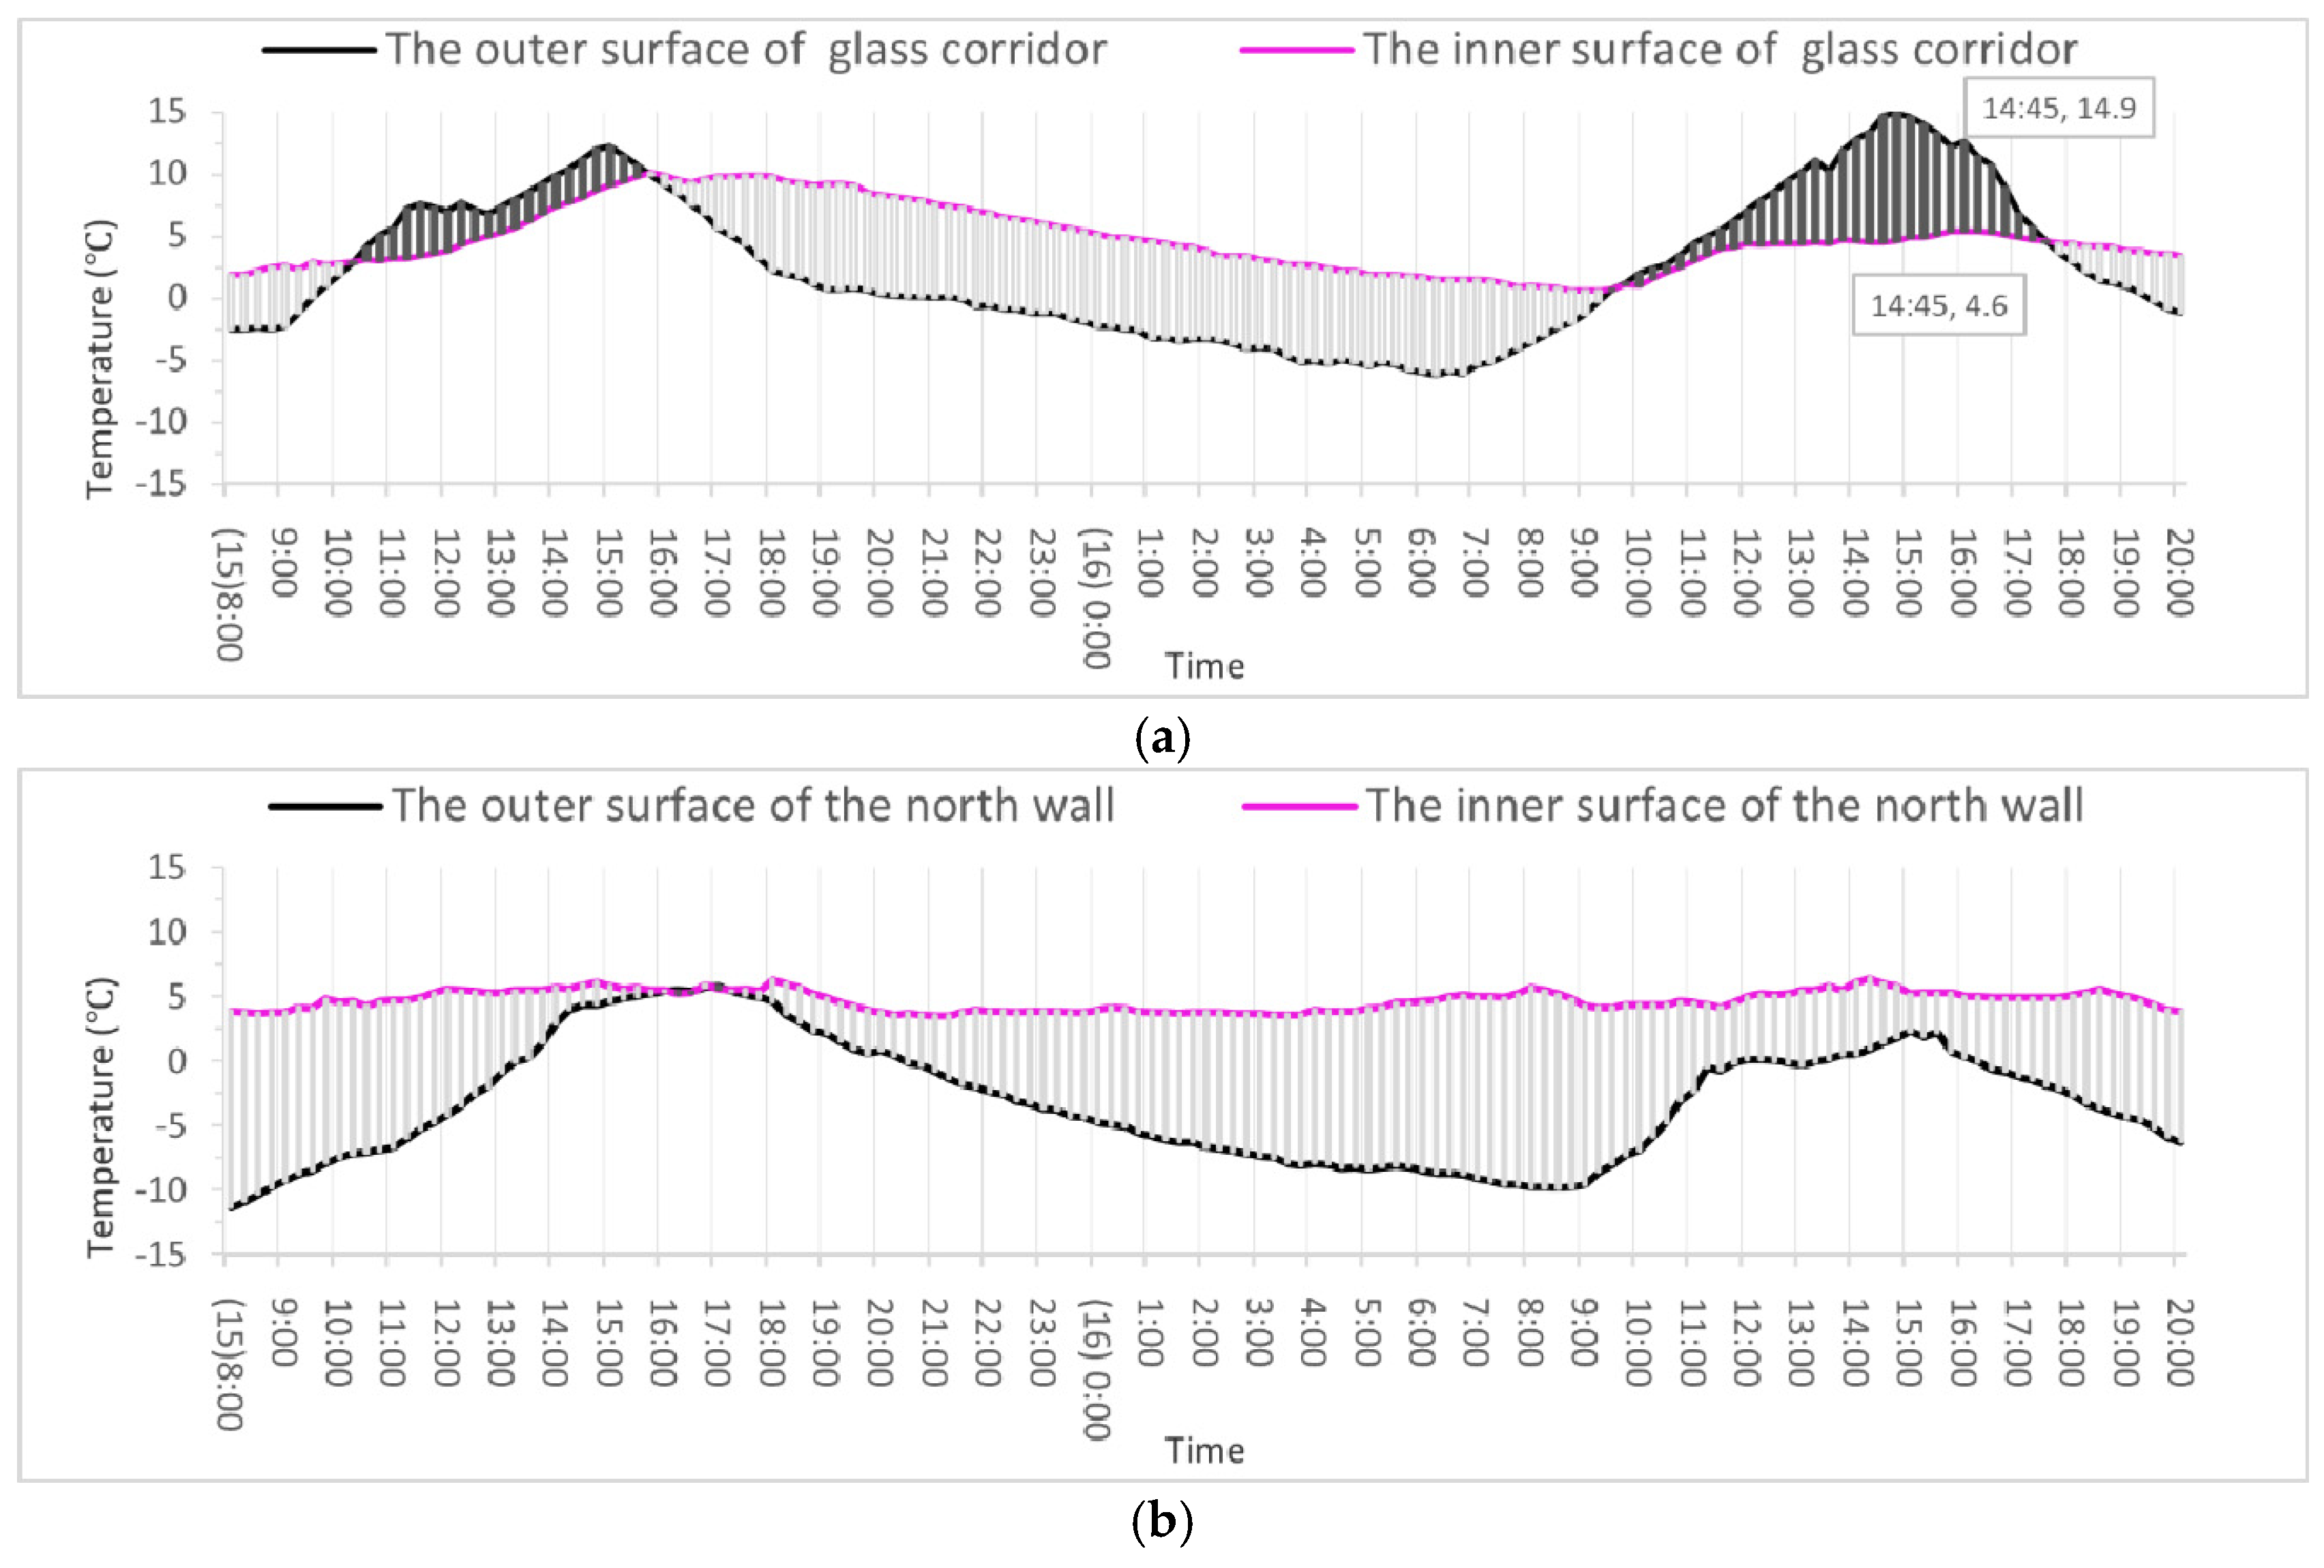
4.2.3. Surface Temperature of Enclosure Structure Material

Since the envelope structure is the interface between the internal and external spaces of the building, its physical properties are particularly important for the regulation of the indoor thermal environment. Figure 8a shows the temperature changes of the inner and outer surfaces of the corridor glass: the outer surface temperature fluctuation range was from −6.2 to 14.9 °C, with a difference of about 21 °C, and the average temperature was 2.5 °C. The inner surface temperature fluctuation range was 0.6–10.1 °C, with a difference of 9.5 °C, and the average temperature was 4.8 °C. Figure 8b shows the north wall temperature change of the internal and external surfaces of the winter bedroom: the outer surface temperature fluctuation range was from −11.4 to 5.8 °C, with a difference of about 17 °C, and the average temperature was −3.2 °C. The internal surface temperature fluctuation range of the wall was from 3.9 to 6.4 °C, with a difference of 2.5 °C, and the average temperature was 4.7 °C; the temperature change was small, and the indoor thermal stability was adequate.
The data revealed the following. (1) During the period of 09:00–16:00, the solar radiation was strong, and the south outer surface temperature was significantly higher than the inner surface, but in other periods, the temperature of the outer surface sharply dropped while the inner surface temperature slowly dropped, reaching a maximum temperature difference of 10.3 °C at 14:45. The heat collection and insulation effect of the “Sunshine Room” was obvious. (2) The winter bedroom lacks solar radiation. However, after the application of insulation measures, the wall was found to have a strong ability to resist harmonic heat. Additionally, the hot air convection effect of the stove in the sunlight during the day and the night was significant. Together, they maintained the stability and comfort of the indoor temperature. The maximum temperature difference between the inner and outer surfaces reached as high as 15.3 °C.

5. A Survey of the Lifestyle and Behavior Habits of Local Residents

5.1. A Survey of the Lifestyle

Through a survey of the local residents, it was found that in the original dwelling, the living materials used for cooking were stacked in or outside the yard. The indoor facilities were relatively simple. There was no plumbing equipment in the house. The toilet was located in the corner of the yard, far away from the house. As such, people needed to frequently shuttle between the indoor and outdoor areas. It was often inconvenient for them to put on or take off their coats. The residents also needed to keep wearing heavy clothes for a long time indoors (including cotton clothes, down jackets, cardigans, wool trousers, and warm clothing). This lifestyle accelerated the air exchange between indoor and outdoor areas, which was not conducive to building insulation.
The new-type vernacular dwelling has improved the abovementioned problems: toilets have been moved to the inside of the building, and most materials such as living materials have been moved to the utility room on the first floor. Most activities are restricted to indoor spaces, thereby reducing the frequency of residents traveling between the indoors and outdoors and shortening peoples’ outdoor stay time. In addition, the indoor temperature is high, and peoples’ clothing, such as shirts and cardigans, is relatively thin. Only in the morning or evening when the indoor temperature is low does one need to add a warm vest or similar warm clothing.

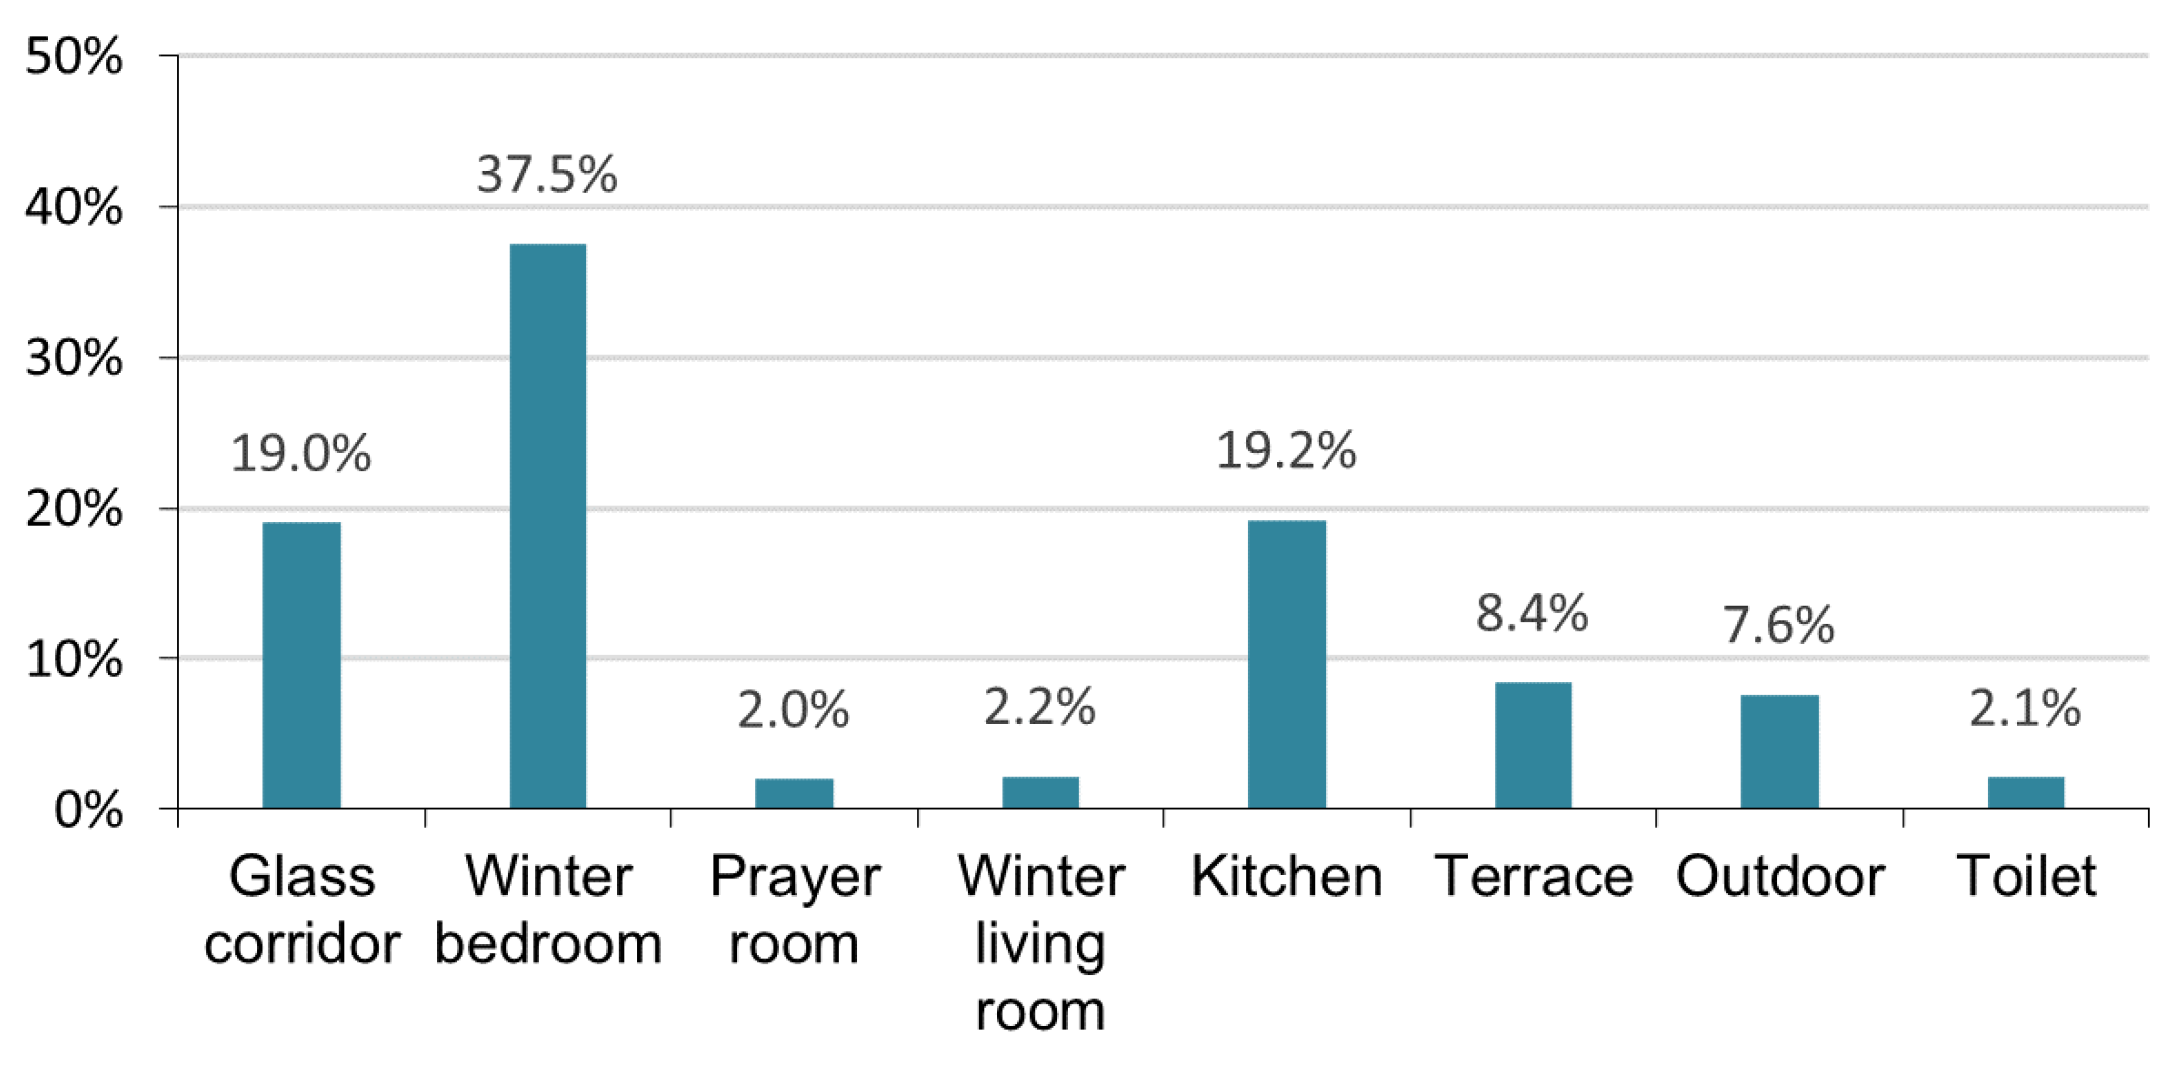
5.2. A Survey of Behavior Habits

In order to analyze the internal relationships between behavior habits and the built environment, subject users were followed for up to three consecutive days, and their activity paths were recorded. The data of Figure 9 were based on the statistics gathered over 24 h (excluding the situation of going out to work) regarding the average cumulative time of users staying in different places in the building (the terrace is a place for drying, handcrafting, and children’s play when the weather is sunny, and going outdoors is temporary or occasional). Table 7 reports the users’ activity paths in different time periods and the main room usage time.
It can be seen from Figure 9 that the main room’s usage time accounted for about 84% of the whole day, followed by the winter bedroom, kitchen, glass corridor, and terrace. Table 7 shows that during the period of strong solar radiation from 09:00 to 17:30, the daily activities of users were usually concentrated in rooms or terraces with higher southward temperatures. After 17:30, when external heat could not meet comfort requirements, the activity area moved to the kitchen with the only heat source, which was shown to become an important functional space with high frequency. The winter bedroom had no other functions other than sleeping.
In the winter, the main area of human activity was in the middle of the building (Figure 10). The active path fit with solar radiation intensity and indoor heat source (Table 7). In this way, people could receive good thermal comfort on their active path.

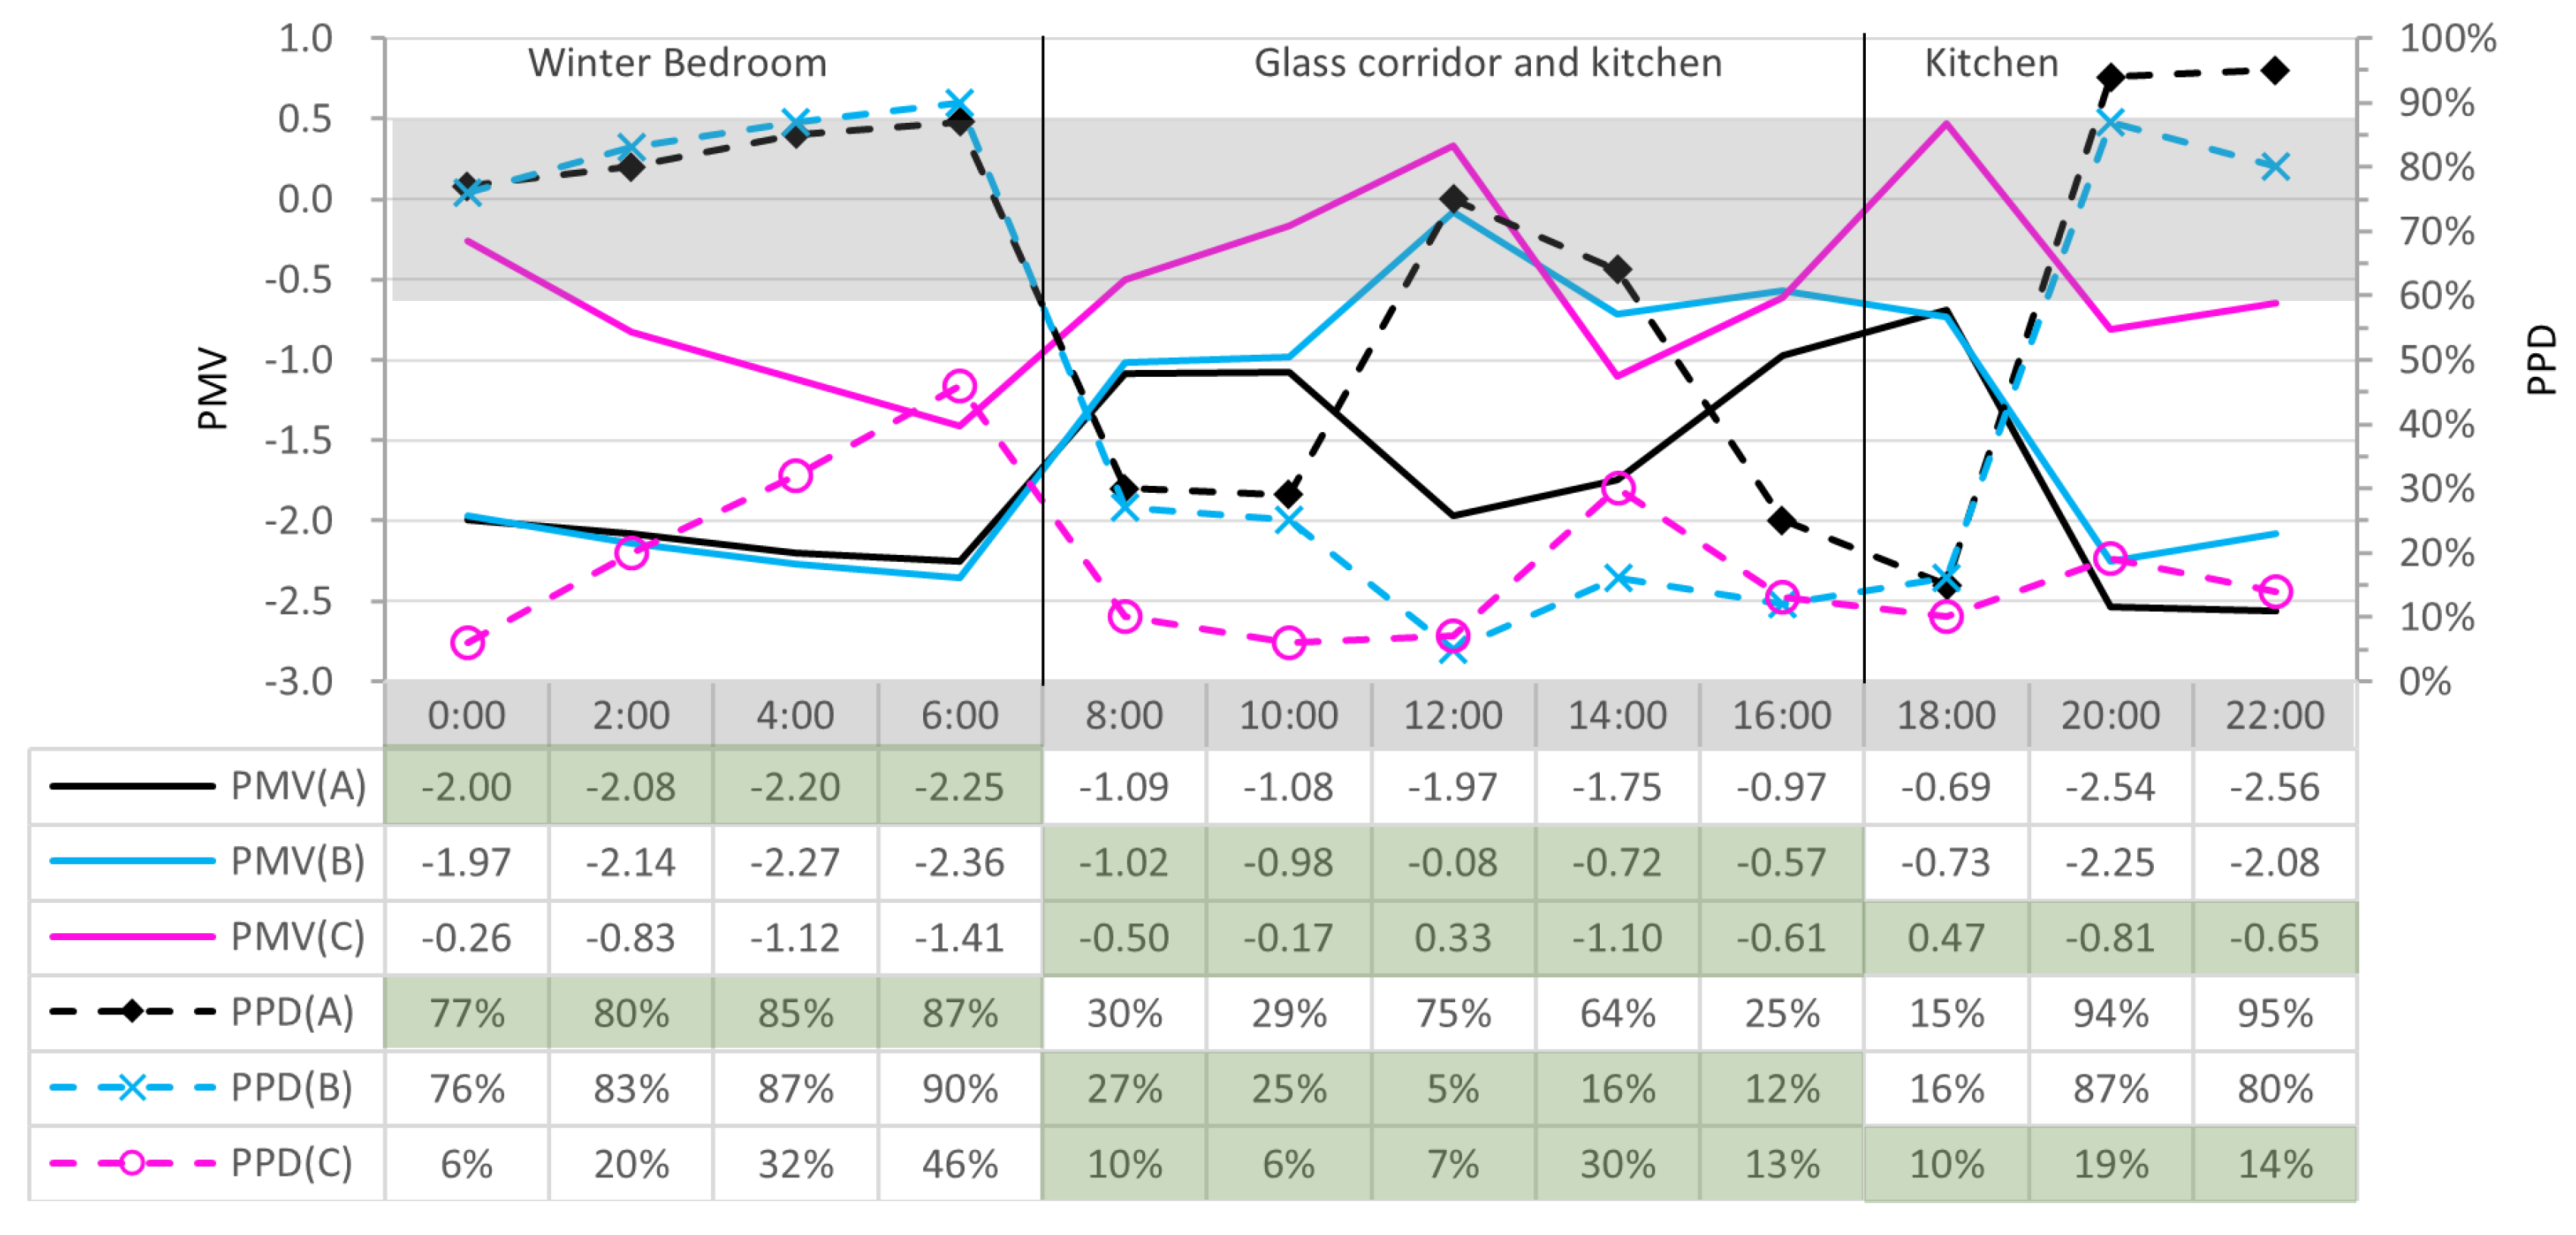
5.3. Evaluation of Indoor Thermal Environment

At present, the most internationally used building indoor thermal environment evaluation model is the PMV–PPD evaluation index proposed by Dr. Fanger. PMV–PPD integrates six factors (air temperature, mean radiation temperature, air speed, relative humidity, metabolic rate, and clothing insulation), which makes it the most comprehensive thermal environment evaluation index currently in use [17]. PMV is divided into seven thermal sensation indexes according to different evaluation values (Table 8). However, considering the differences in individual thermal sensation, the combined evaluation method of PMV–PPD can more accurately reflect the results of indoor thermal environment evaluation than PMV alone [18]. Based on the “Evaluation Standard for Indoor Thermal Environment in Civil Buildings” in China [19], Table 9 shows that the comfort standard could be divided into three levels: Level I is comfortable when −0.5 ≤ PMV ≤ 0.5 and PPD ≤ 10%; Level II is acceptable when −1 ≤ PMV <−0.5/+0.5 < PMV ≤ +1 and 10% < PPD ≤ 25%; and Level II is uncomfortable when PMV < −1/PMV > +1 and PPD > 25%.
According to the aforementioned analysis results and the description of the PMV–PPD evaluation system, the authors of this paper established a thermal environment evaluation model under the multi-mode collaborative work as follows. (1) They first determined the main space on the activity path according to the content of lifestyle. (2) Next, the PMV–PPD evaluation was used for the main space based on the thermal environment test results. (3) Compared with the use of space in different periods, they analyzed whether the PMV–PPD results met the comfort standard. (4) Finally, they verified whether the corresponding thermal insulation measures were effective in the use of space and improved the rooms that did not meet the comfort requirements.
By analyzing the path of the users, three main spaces were selected for indoor thermal environment evaluation: the winter bedroom (A), glass corridor (B), and kitchen (C). Based on the users’ lifestyles and behavior habits, the activity path can be roughly depicted: before 8:00, time is mainly spent in the winter bedroom; from 8:00 to 18:00, time is mainly spent in the vicinity of the glass corridor and kitchen area; and after 18:00, time is mainly spent in the kitchen.
The parameters in PMV–PPD evaluation indexes were recorded every 2 h in a statistical period of 24 h. Considering the activity status in different periods, the metabolic rates were 1.8 for cooking, housework, etc.; 1.7 for hanging, activities, etc.; 1.2 for sitting, chatting, etc.; and 1.0 for sleeping. According to the survey, the basic dress inside comprised underwear, vest, sweater, thick sweater, leather, sweater, pants, outerwear, thick socks, and cotton slippers; the average clothing insulation was 1.32 col (considering the thickness of the quilt, the sleeping state was 2.10 col). There was basically no sense of wind indoors, and the air speed was 0.1 m/s. Other values were obtained from the test result. Table 10 shows the index data of the evaluation object, which were substituted into the PMV–PPD calculation formula. The calculation statistics are shown in Figure 11.
In reference to the comfort standard (Table 9), Figure 10 shows that the bedroom in the winter was at Level II from 16:00 to 18:00 and at Level III the rest of the time, with a high dissatisfaction rate of thermal comfort. Glass corridors were in Level II or even Level I standards during 10:00–18:00, with poor thermal comfort the rest of the time. The kitchen had good thermal comfort in the whole statistical cycle, basically at Level I and Level II; the thermal comfort was good, especially in the period of 10:00–14:00, indicating that the kitchen plays an important role in maintaining the indoor thermal environment. It can be seen from the analysis results that, except for the poor thermal comfort of the bedroom in the winter, the most comfortable parts of the evaluation object were basically consistent with the users’ activity paths.

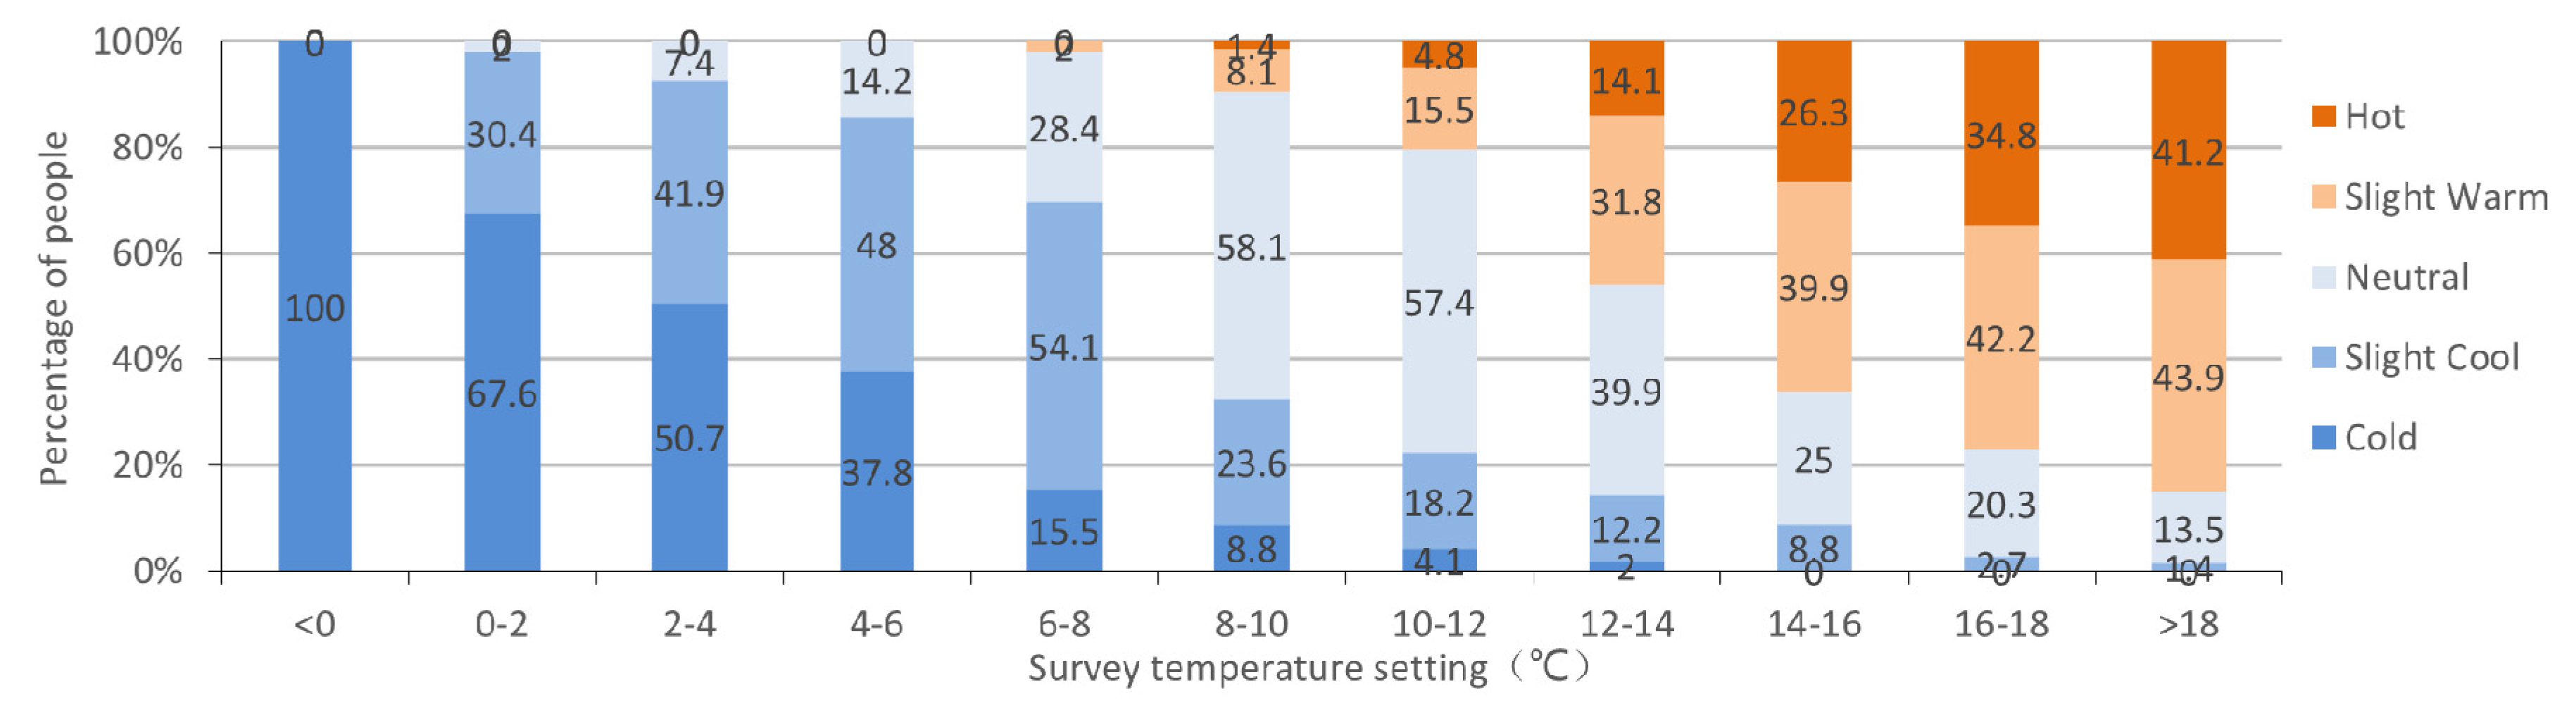
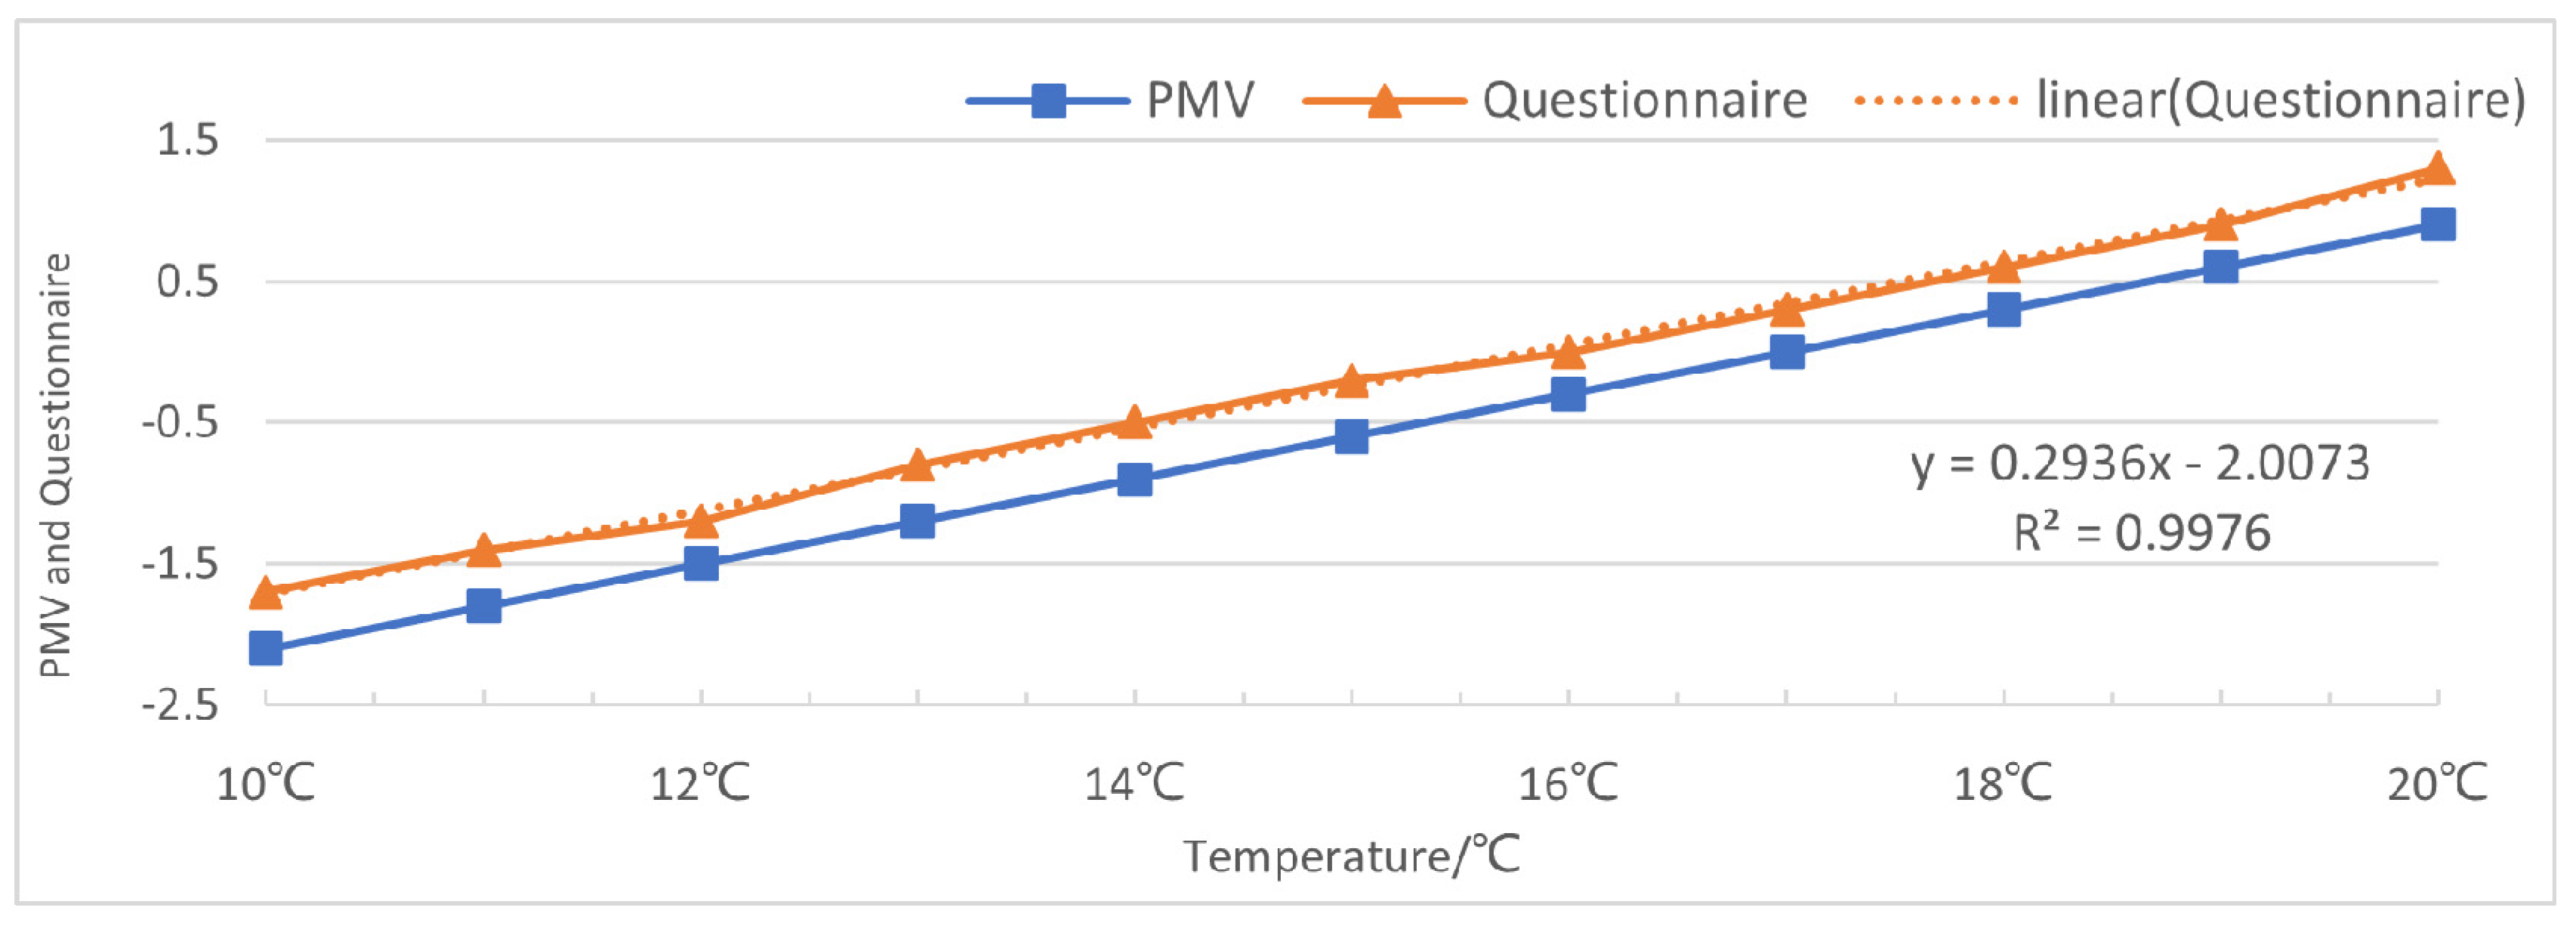
5.4. Questionnaire of Thermal Sensation

In order to further understand the ability of local residents to bear the indoor temperature in the winter, according to the thermal sensation classification in Table 3, a questionnaire was adopted to conduct a thermal sensation survey of 150 residents. In the questionnaire, a total of 11 temperature segments were set at intervals of 2 °C, with the lowest temperature set at 0 °C and the highest temperature set at 18 °C. In order to encourage the respondents to more clearly describe heat sensation, the questionnaire simplified the heat sensation classification into five criteria: cold, slight cold, moderate, warm, and hot. It was stipulated that when the sum of the proportions above the moderate standard was >60%, this was an acceptable temperature range. Finally, a total of 148 effective questionnaires were collected, and then the questionnaire data were collated and analyzed according to the above criteria, as shown in Figure 11.
Figure 12 shows that more than 90% of people reported that the indoor temperature below 6 °C was cold, about 70% of people could accept the indoor temperature of 8–10 °C, and about 60% thought that the indoor temperature of 8–14 °C was moderate. About 70% of people though that the heat sensation was stronger at 14–18 °C, and they felt a little muggy when the temperature was greater than 18 °C. Therefore, in the case of limited heating conditions, the standard of indoor temperature can be set in the range of 10–14 °C.
According to this analysis, glass corridors and kitchens could meet the standard of moderate temperature or even hotter in most periods, and the temperatures of bedrooms in the winter were below but close to the standard. However, we found differences in the results. In order to compare the differences between the results of the questionnaire survey and the calculated results of PMV, thermal comfort values of 10–20 °C were selected as the research range. As can be seen from Figure 13, there was a difference between the thermal sensation vote value and the PMV value. In the same thermal environment, the thermal sensation vote value was significantly higher than the PMV value, which indicates that residents’ requirements for indoor thermal comfort temperature are low.
It can be seen that compared to the winter heating standard of urban residences (18 °C), the demand for indoor temperature in the winter of this dwelling was greatly reduced. Additionally, the results of the questionnaire survey were more tolerant than PMV. Thermal sensation is subjective. This dwelling is different from urban housing in lifestyles, dress habits, activity path, and other aspects [20] such as the evaluation method [21]. Therefore, the abovementioned factors should be considered when discussing the thermal comfort of dwellings. The value between the design standard and tolerable temperature can be adjusted by human.

6. Discussion

6.1. Acceptable Temperature and Comfortable Temperature

Vernacular dwellings are formed in the process of long-term trial and error, and their lifestyle and climate environment have better integration than modern buildings. With the development of artificial environment control methods, more and more urban buildings are controlling their indoor environment within a narrow range of absolute comfort. However, the purpose of building climate adaptation is not to precisely control temperature or achieve perfect balance but to strive to create acceptable indoor environments [22]. Despite the existence of perfect artificial heat source environments, people have higher tolerances to simple artificial heat source environments [23,24]. This study’s survey showed that the indoor thermal comfort temperature of residents was obviously low under special climatic conditions such as low oxygen. Wang [25] found that in the same temperature environment, the indoor thermal sensation vote of residents in Tibet was higher than that of residents at a low altitude, and the comfortable temperature of Tibet was 2.61 °C lower than that in low-altitude area. Ning [26] proposed that Tibetan residents living in plateau areas have a stronger ability to adapt to cold indoor environments. Experiments showed the lower limit of comfortable indoor temperature is 16 °C and the lower limit of acceptable indoor temperature is 14.7 °C under special climatic conditions such as low plateau pressure and low oxygen in the winter. This paper also verifies the above-mentioned conclusions, so an acceptable temperature does not indicate poor comfort. “Moderate” or “hot” temperatures can be achieved when appropriate clothing, production activities, and indoor thermal environments work together.

6.2. Collaborative Working of Multiple Ways

The climate, people, and buildings are three elements that are closely related to climate-responsive buildings [27,28]. When referring to building climate adaptation strategies, people are accustomed to studying buildings themselves. However, as the users of buildings, humans’ important role is easily overlooked. In this case study, with the goal of consuming small amounts of energy and resources based on the users’ activity paths and behavior habits, an acceptable indoor thermal environment was obtained. (1) The protective structure materials were optimized to improve the building thermal insulation performance, heat storage capacity, and indoor humidity adjustment capacity. The combined use of forestry, wood products, and construction systems can effectively reduce the environmental pressure caused by carbon emissions and material shortages [29]. Designers should maximally use local materials and technologies while showing great respect for the environment and climate. (2) Functional zoning is closely related to living habits and seasonal climate. For example, the winter bedroom of the studied dwelling is located near the middle of the building, which has reduced the external wall area, and it is now easy to obtain solar radiation and kitchen waste heat; the toilet has been moved indoors to reduce cold air penetration; the glass corridor has heat collection and buffering effects; and the air barrier had an isolation effect. (3) Differential heating design should be applied for rooms according to their frequency of use. To ensure the thermal environment requirements of the main room, the secondary room only needs to meet the basic functional requirements.

6.3. Problems and Suggestions

The indoor thermal environment of the studied new-type vernacular dwelling was greatly improved, but there is still room for progress. Especially in the nighttime period of winter bedrooms, the thermal stability is good, but the indoor temperature is low and there is no stable heat source. To address these problems, the following methods can be used: first, the use of solar radiation should be improved, such as with the use of active and passive solar energy collaborative heating technology [30,31,32,33], to provide a stable and effective heat source; second, the indoor thermal comfort should be improved by reducing the emissivity of the inner surface (such as by placing aluminum foil on the inner surface) [34].

7. Conclusions

In this paper, a thermal environment test, behavior analysis, PMV–PPD evaluation, and thermal sensation questionnaire were used to comprehensively evaluate the indoor thermal environment of a new residential house in the Ganzi area. The main conclusions are as follows.
(1)
The reasonable selection of appropriate building materials and building structure can effectively improve the temperature stability and thermal insulation capacity of the envelope; these measures have low economic costs and low construction difficulty, with a wide range of promotion and significant use.
(2)
The analysis results showed that, except for the poor thermal environment of the winter bedroom, the rest of the rooms were able to meet the requirements of thermal environment during use through the combination of lifestyle, activity path, and functional layout factors. This multi-mode cooperative mechanism can be used to more comprehensively evaluate the indoor thermal environments of residential houses and propose improvement measures.
(3)
Under the same temperature condition, the thermal sensation value reported in the questionnaire survey was higher than the calculated result of the PMV, indicating the obvious regulating effect of human body function. The main role of the human body should be emphasized in the design of indoor thermal environments.
(4)
Based on the comprehensive analysis of the questionnaire survey results and PMV–PPD evaluation results, we suggest that the design range of the indoor temperature of dwellings in Ganzi should be 10–14 °C.

Author Contributions

Conceptualization, P.L.; methodology, P.L., Q.Z. and K.Z.; software, P.L.; investigation, P.L.; data curation, P.L.; writing—original draft preparation, P.L.; writing—review and editing, P.L., Q.Z., K.Z., Y.W. and Q.W.; supervision, Q.Z., Y.W. and K.Z.; funding acquisition, Q.Z. All authors have read and agreed to the published version of the manuscript.

Funding

This research was funded by National Natural Science Foundation of China, Grant No. 51678466.

Institutional Review Board Statement

Not applicable.

Informed Consent Statement

Informed consent was obtained from all subjects involved in the study.

Data Availability Statement

Not applicable.

Acknowledgments

The authors wish to thank the Government and local residents of Luhuo county, Ganzi Tibetan Region for their selfless help.

Conflicts of Interest

The authors declare no conflict of interest.

References

  1. Zheng, D.; Zhao, D.S. Due to climate, materials and other reasons, the population distribution in the alpine region is relatively small. Arid Zone Res. 2019, 36, 1–6. [Google Scholar]
  2. Qi, W.; Liu, S.H.; Zhou, L. Regional differentiation of population in Tibetan Plateau: Insight from the “Hu Line”. Acta Geographica Sinica 2020, 75, 255–267. [Google Scholar]
  3. Zhen, Y.; Li, Y.F.; He, J. Research on characteristics of precipitation change and drought and flood in Ganzi region of Northwest Sichuan Plateau. Res. Soil Water Conserv. 2019, 26, 191–197. [Google Scholar]
  4. Ai, B.W. Physical geographical characteristics of Ganzi Tibetan Autonomous Prefecture. J. Southwest Univ. 1979, 1, 84–92. [Google Scholar]
  5. Zhang, J.C.; Zhou, W.Z. Spatial autocorrelation between topographic relief and population/economy in Sichuan Province. Bull. Soil Water Conserv. 2019, 39, 250–257. [Google Scholar]
  6. Sun, Z.; Zhang, Y. Using drones and 3D modeling to survey Tibetan architectural heritage: A case study with the multi-door stupa. Sustainability 2018, 10, 2259. [Google Scholar] [CrossRef] [Green Version]
  7. He, Q.; Liu, D.L.; Zhu, X.R. Study on measuring the indoor thermal environment of Tibetan vernacular houses on the Chuanxi Plateau. J. Xi’an Univ. Arch. Tech. Nat. Sci. Ed. 2015, 3, 402–406. [Google Scholar]
  8. Ma, L.; Shao, N.; Zhang, J.; Zhang, T.; Xu, M. A Study on indoor thermal environment of rural residence in South Liaoning province. Procedia Eng. 2016, 146, 366–374. [Google Scholar] [CrossRef]
  9. Li, Z.R.; Si, Y.; Zhao, Q.; Xie, Y.J.; Lu, S.K. Suggestion on retrofitting the wall thermal inertia index for non-heated traditional house in Tibet. J. Build. Energy Effic. 2020, 48, 36–40. [Google Scholar]
  10. Liu, J.P.; He, Z.H.; Yang, L. Classification of China cold climate and the strategy in architectural thermal design. J. Xi’an Univ. Arch. Tech. Nat. Sci. Ed. 2020, 52, 309–314. [Google Scholar]
  11. Ikeda, H.; Nakaya, T.; Nakagawa, A.; Maeda, Y. An investigation of indoor thermal environment in semi-cold region in Japan—Validity of thermal predictive indices in Nagano during the summer season. J. Build. Eng. 2021, 35, 101897. [Google Scholar] [CrossRef]
  12. Liu, P.; Zhang, Q.; Wei, Y.; He, L. The spatial composition and distribution characteristics of Baima Tibetan traditional village: A case study of Yiwa Daire village based in Baima Tibetan township, Pingwu County. World Archit. 2020, 6, 112–116, 144. [Google Scholar]
  13. Nikolopoulou, M.; Steemers, K. Thermal comfort and psychological adaptation as a guide for designing urban spaces. Energy Build. 2003, 35, 95–101. [Google Scholar] [CrossRef]
  14. Li, Z.T.; Yuan, X.W.; Jiang, B. Research on energy-saving property of rural residential buildings in cold region. Archit. Technol. 2013, 44, 138–140, 160. [Google Scholar]
  15. Hong, J.; Hua, Z. Energy conservation design of village residence in severe cold regions. J. Harbin Univ. Civ. Eng. Archit. 2001, 6, 96–100. [Google Scholar]
  16. GB50736-2012; Code for Design of Heating, Ventilation and Air Conditioning for Civil Buildings. Ministry of Housing and Development of the People’s Republic of China Urban-Rural: Beijing, China, 2012; pp. 21–28.
  17. EN/ISO 7730-2005; Ergonomics of the Thermal Environment Analytical Determination and Interpretation of Thermal Comfort Using Calculation of the PMV and PDD Indices and Local Thermal Comfort Criteria. ISO: Geneva, Switzerland, 2006; pp. 13–19.
  18. Federico, M.B. Chapter 3—Principles of thermal comfort. Renew. Sustain. Energy Rev. 1998, 2, 39–66. [Google Scholar]
  19. GB/T 50785-2012; Evaluation Standard for Indoor Thermal Environment in Civil Buildings. Ministry of Housing and Development of the People’s Republic of China (MOHURD) Urban-Rural: Beijing, China, 2012; pp. 6–8.
  20. Zhu, Y.Y.; Liu, J.P. Research on the indoor thermal environment of rural architecture in winter in northwestern areas. China Civ. Eng. J. 2010, 43, 400–403. [Google Scholar]
  21. Liang, R.; Cheng, H.; Zhang, Q.; Liu, J.P. Assessment for green rural buildings in the desertification area in Northwest China. J. Northwest Univ. Nat. Sci. Ed. 2017, 47, 132–136. [Google Scholar]
  22. Olgyay, V.; Yeang, K.; Reynold, J.; Lyndon, D. Design with Climate; Princeton University Press: Princeton, NJ, USA, 2015; pp. 56–62. ISBN 9780691169736. [Google Scholar]
  23. Zhang, Y.F.; Chen, H.M.; Meng, Q.L. Thermal comfort in buildings with split air-conditioners in hot-humid area of China. Build. Environ. 2013, 64, 213–224. [Google Scholar] [CrossRef]
  24. Tzu-ping, L. Thermal perception, adaptation and attendance in a public square in hot and humid regions. Build. Environ. 2009, 44, 2017–2026. [Google Scholar]
  25. Wang, Y.L. The Study of Residential Indoor Thermal and Humid Environment in Tibet Area; Chongqing University: Chongqing, China, 2015. [Google Scholar]
  26. Ning, Z.X. Study on Indoor Human Thermal Comfort of Residential Buildings in Lhasa; Changan University: Xi’an, China, 2018. [Google Scholar]
  27. Riahi, K.; Van Vuuren, D.P.; Kriegler, E.; Edmonds, J.; O’neill, B.C.; Fujimori, S.; Bauer, N.; Calvin, K.; Dellink, R.; Fricko, O.; et al. The shared socioeconomic pathways and their energy, land use, and greenhouse gas emissions implications: An overview. Glob. Environ. Chang. 2017, 42, 153–168. [Google Scholar] [CrossRef] [Green Version]
  28. Zhong, K.Y.; Wang, Y.F.; Pei, J.M.; Tang, S.M.; Han, Z.L. Super efficiency SBM-DEA and neural network for performance evaluation. Inf. Process. Manag. 2021, 58, 102728. [Google Scholar] [CrossRef]
  29. Jim, H.; Francesco, P. More timber in construction: Unanswered questions and future challenges. Sustainability 2020, 12, 3473. [Google Scholar]
  30. Shan, M.; Yu, T.; Yang, X. Assessment of an integrated active solar and air-source heat pump water heating system operated within a passive house in a cold climate zone. Renew. Energy 2016, 87, 1059–1066. [Google Scholar] [CrossRef]
  31. Zhong, K.Y.; Wang, P.; Pei, J.M.; Xu, J.Y.; Han, Z.L.; Xu, J.W. Multiobjective optimization regarding vehicles and power grids. Wirel. Commun. Mob. Comput. 2021, 2021, 5552626. [Google Scholar] [CrossRef]
  32. Cui, Y.Q.; Ji, J.; He, W.; Pei, G. Numerical study on a novel solar heating system with coupled solar Kang and Trombe wall. Acta Energiae Solaris Sinica 2011, 32, 66–71. [Google Scholar]
  33. Li, J.P.; Wang, Z.F.; Wang, H.; Huang, J.; Wang, C.L. Research on indoor comfort of active and passive solar cooperative heating in cold Tibetan region. Xi’an Univ. Archi. Tech. Nat. Sci. Ed. 2019, 51, 584–590. [Google Scholar]
  34. Li, S.M.; Meng, Q.L.; Zhang, L.; Zhong, K.; Shao, L.L. Effect of the inner wall surface radiation rate on the indoor thermal comfort. Build. Energy Effic. 2019, 47, 98–104. [Google Scholar]
Figure 1. (a) China direct normal solar radiation; (b) meteorological parameters of cities in different regions in January.
Sustainability 14 00576 g001
Figure 2. (a) Floor 1; (b) Floor 2; (c) building to be investigated; (d) settlement of surrounding environment.
Sustainability 14 00576 g002
Figure 3. (a) “Composite wall” structure; (b) “double-window” structure; (c) “heat storage layer” structure; (d) “sunshine room” structure; (e) glass corridor; (f) kitchen; (g) storage room.
Sustainability 14 00576 g003
Figure 4. Instruments and physical measurements.
Sustainability 14 00576 g004
Figure 5. Solar radiation intensity in typical day.
Sustainability 14 00576 g005
Figure 6. The air temperature change curve of test points.
Sustainability 14 00576 g006
Figure 7. The relative humidity change curve of test points.
Sustainability 14 00576 g007
Figure 8. Changes in surface temperatures of enclosure materials: (a) glass corridor; (b) winter room.
Sustainability 14 00576 g008
Figure 9. Average cumulative time of users staying in different places.
Sustainability 14 00576 g009
Figure 10. The main activity area in the winter.
Sustainability 14 00576 g010
Figure 11. The PMV–PPD calculation result of evaluation objects.
Sustainability 14 00576 g011
Figure 12. Results of indoor thermal sensation questionnaire survey.
Sustainability 14 00576 g012
Figure 13. The relationship between PMV and questionnaire survey results.
Sustainability 14 00576 g013
Table 1. Forms of dwellings in different periods.
- Sustainability 14 00576 i001 Sustainability 14 00576 i002 Sustainability 14 00576 i003
TimeEarly timeMiddle timeNow (research object)
Height/roofSingle floor/flatSingle floor/slopeTwo floor/slope
ShapeSquareRectangle U-shape
Structural formStone wall and rammed earth wallStone base, wood partition wall, and wood beam and columnLog construction, concrete-block-filled wall (north), wood wall (south), and wood beam and column
Building materialClay and stoneStone and woodBlock, metal, glass, and wood
Table 2. The research object’s parameter information and function layout.
Floor 1Floor 2Roof
Dimensions (L × W)17.10 × 10.97 m17.10 × 10.97 m18.10 × 11.97 m
Average height3.0 m3.5 m2.5 m
Area187.6 m2157.9 m2-
Plane layoutStorage room/garageSouth: glass corridor/living room/terrace (glass roof)
North: prayer room/kitchen and dining room/bedroom (summer and winter)/living room(summer and winter)/toilet
Attic
Table 3. Construction methods and material selection of new-style vernacular dwelling.
Floor 1Sintered brick (middle ground)/300 mm thick pebbles/100 mm thick extruded polystyrene board (XPS)
Floor 2Wooden floor (surface), waterproof layer, and 100 mm thick board (bottom) (kitchen and bath-room surface: tile)
Walls1FNorth: 600 mm thick fly ash ceramsite concrete block (ρ = 1700)2FNorth: 240 mm thick sand-lime brick and 30 mm thick plywood
South, east, and west: 240 mm thick sand lime brickSouth, east, and west: 200 mm thick log construction and 50 mm thick pine board
WindowsPlastic–steel frame and insulating-tempered glass (3 + 9A + 3)
Window–wall ratio: south wall (0.182)/north wall (0.043)/east wall (0.121)/west wall (0.121)
RoofWooden ceiling, air-layer, and corrugated tile
Table 4. Material physical parameters.
PebblePine BoardInsulating GlassPlywoodFly Ash Ceramsite Concrete BlockSand Lime Brick
Heat storage coefficient [S]/w/(m2·k)18.363.85-4.578.9512.72
Thermal conductivity [K]/(w/(m·k)1.510.142.7 0.170.701.10
Sustainability 14 00576 i004
Note: The relevant material parameters are quoted from “Thermal Design Code for Civil Building” (GB 50176-2016).
Table 5. Material physical parameters.
MaterialBulk Density G/V(N/m3)Specific Heat C/kJ/(kg·k)Effective AreaThickness
Pebble24000.92108.90 m20.3 m
Table 6. Test equipment and parameter settings.
Test ItemsInstrumentParameter Setting
Solar radiation intensityTBQ solar radiation sensorRange: 0–2000 W/m2; accuracy: ±3 W/m2; sensitivity: 7–14 Μv/W·m2; placement height: 1 m; record: 15 min/times
Temperature and humidityThermograph and hygrometer
(type: TEST0·175-H2)
Range: −20.0–70.0 °C; accuracy: ±0.2 °C; record: 30 min/times
Surface temperatureFour-channel temperature meter
(type: CENTER-309)
Range: −200–1370 °C; accuracy: ± (0.3% rdg) +1 °C; record: 30 min/times
Table 7. User activity space at different times.
7:30–9:009:00–17:3017:30–20:0020:00–22:3022:00–7:30
Frequently used roomWinter bedroom, kitchen, and prayer roomGlass corridor, kitchen, and terraceKitchen and glass corridorWinter bedroom, glass corridor, and kitchenWinter bedroom
Occasionally used roomToilet, glass corridor, terrace, and outdoorsPrayer room, kitchen, and outdoorsPrayer room, toilet, terrace, and outdoorsPrayer room and toiletToilet
Solar radiation intensity<100 W/m2Between 300 and 750 W/m2<0 W/m2--
Note: bold font signifies the main activity spaces.
Table 8. Corresponding relation between PMV values and seven-point thermal index.
Thermal SensationColdColdSlight CoolNeutralSlight WarmWarmHot
PMV−3−2−10+1+2+3
Table 9. Comfort level based on PMV–PPD.
CategoryEvaluation Index
I−0.5 ≤ PMV ≤ +0.5PPD ≤ 10%
II−1 ≤ PMV < −0.5/+0.5 < PMV ≤ +110% < PPD ≤ 25%
IIIPMV < −1/PMV > +1PPD > 25%
Table 10. The indoor thermal environment index data of the evaluation object.
TimeA/B/C Air Temperature (°C)A/B/C Mean Radiation Temperature (°C)Air Speed (m/s)A/B/C Relative Humidity (%)Metabolic Rate (met)Clothing Insulation (clo)
00:005.5/5.9/16.45.5/5.9/16.40.145.2/30.4/34.21.02.10
02:005.0/4.9/13.05.0/4.9/13.00.147.1/29.4/31.81.02.10
04:004.3/4.1/11.24.3/4.1/11.20.146.6/29.3/31.71.02.10
06:004.0/3.5/9.44.0/3.5/9.40.146.1/30.3/32.21.02.10
08:005.1/5.9/10.15.1/5.9/10.10.146.6/30.3/32.11.81.32
10:006.5/7.5/13.86.5/7.5/13.80.148.0/32.5/32.61.71.32
12:008.9/13.4/16.68.9/13.4/16.60.150.5/39.7/44.81.81.32
14:0010.1/15.8/13.710.1/15.8/13.70.150.5/43.2/45.01.21.32
16:007.4/10.6/12.47.4/10.6/10.40.144.6/36.0/30.91.71.32
18:008.4/8.2/17.78.4/8.2/17.70.145.1/34.9/46.81.81.32
20:005.8/7.5/15.45.8/7.5/15.40.144.0/39.1/40.41.21.32
22:005.7/8.5/16.25.7/8.5/16.20.145.0/33.8/45.01.21.32
Note: A = winter bedroom/B = glass corridor/C = kitchen.
Publisher’s Note: MDPI stays neutral with regard to jurisdictional claims in published maps and institutional affiliations.

