
Sex-Specific Habitat Suitability Modeling for Panthera tigris in Chitwan National Park, Nepal: Broader Conservation Implications

 , , , and
Abstract
:1. Introduction
2. Data and Methods
2.1. Study Area
2.2. Variable Generation and Selection
2.3. Statistical Modeling
2.3.1. Maxent
Model Evaluation
2.3.2. Occupancy Modelling
Model Evaluation
3. Results
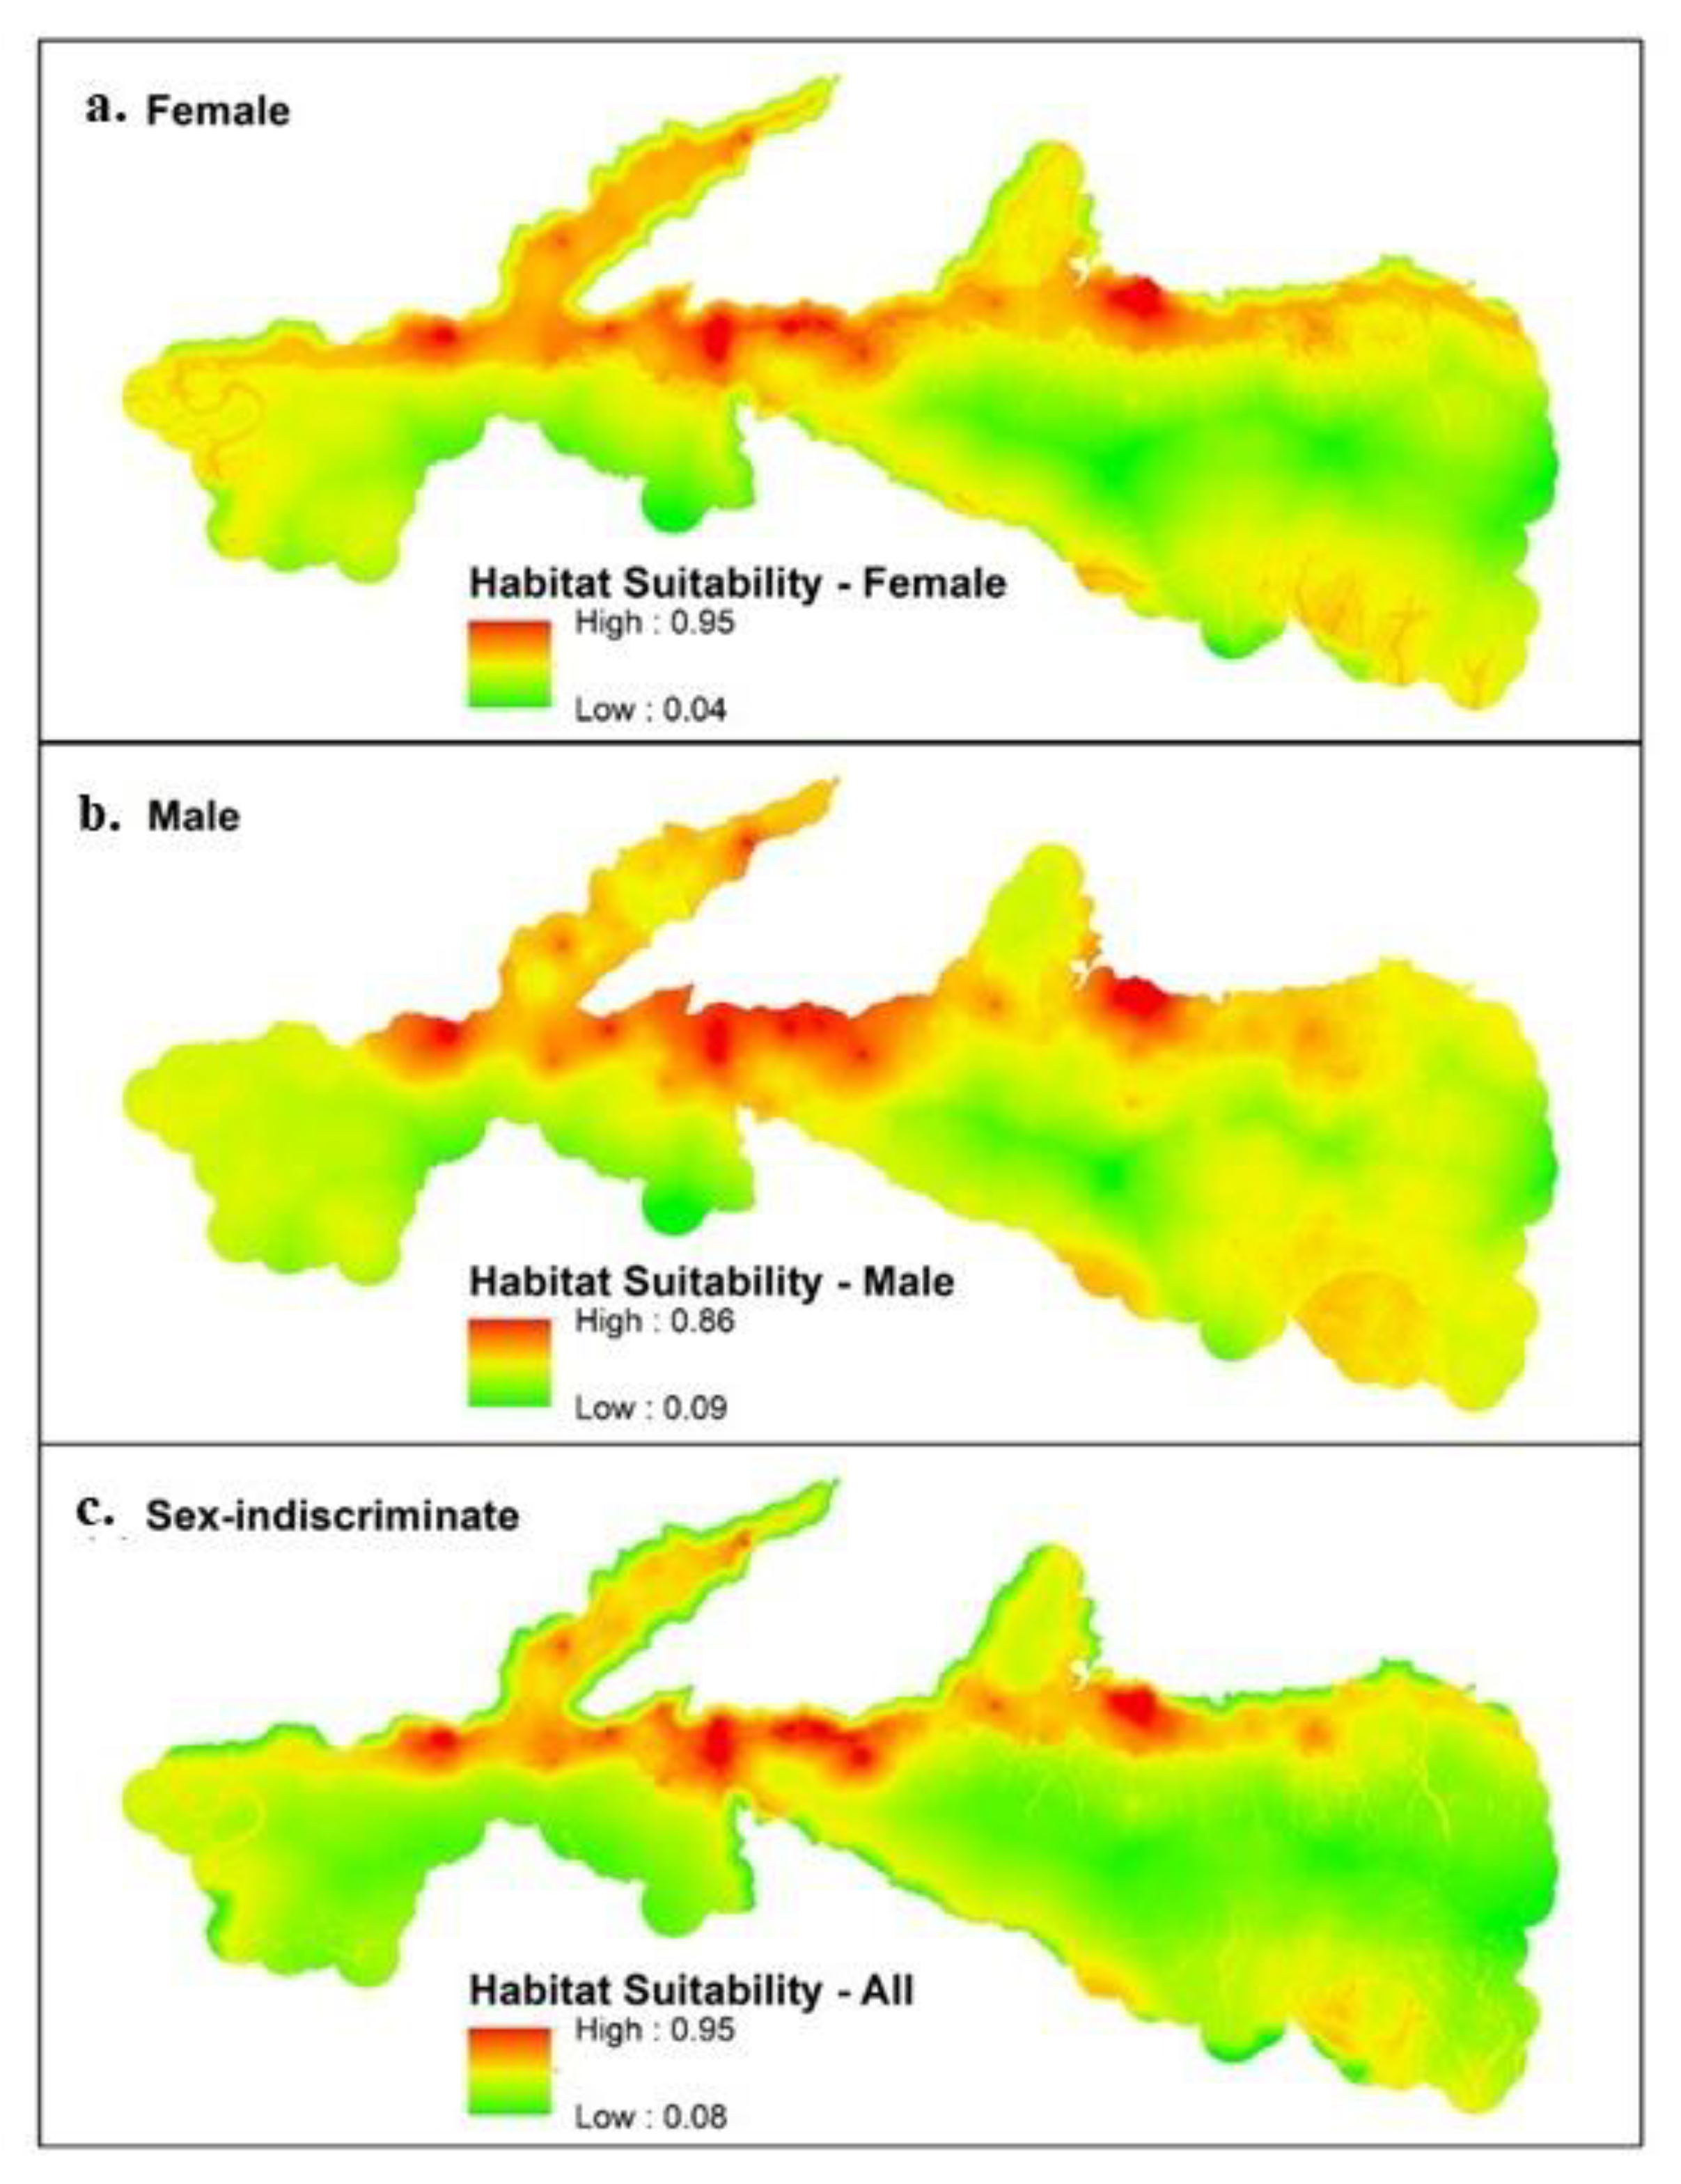
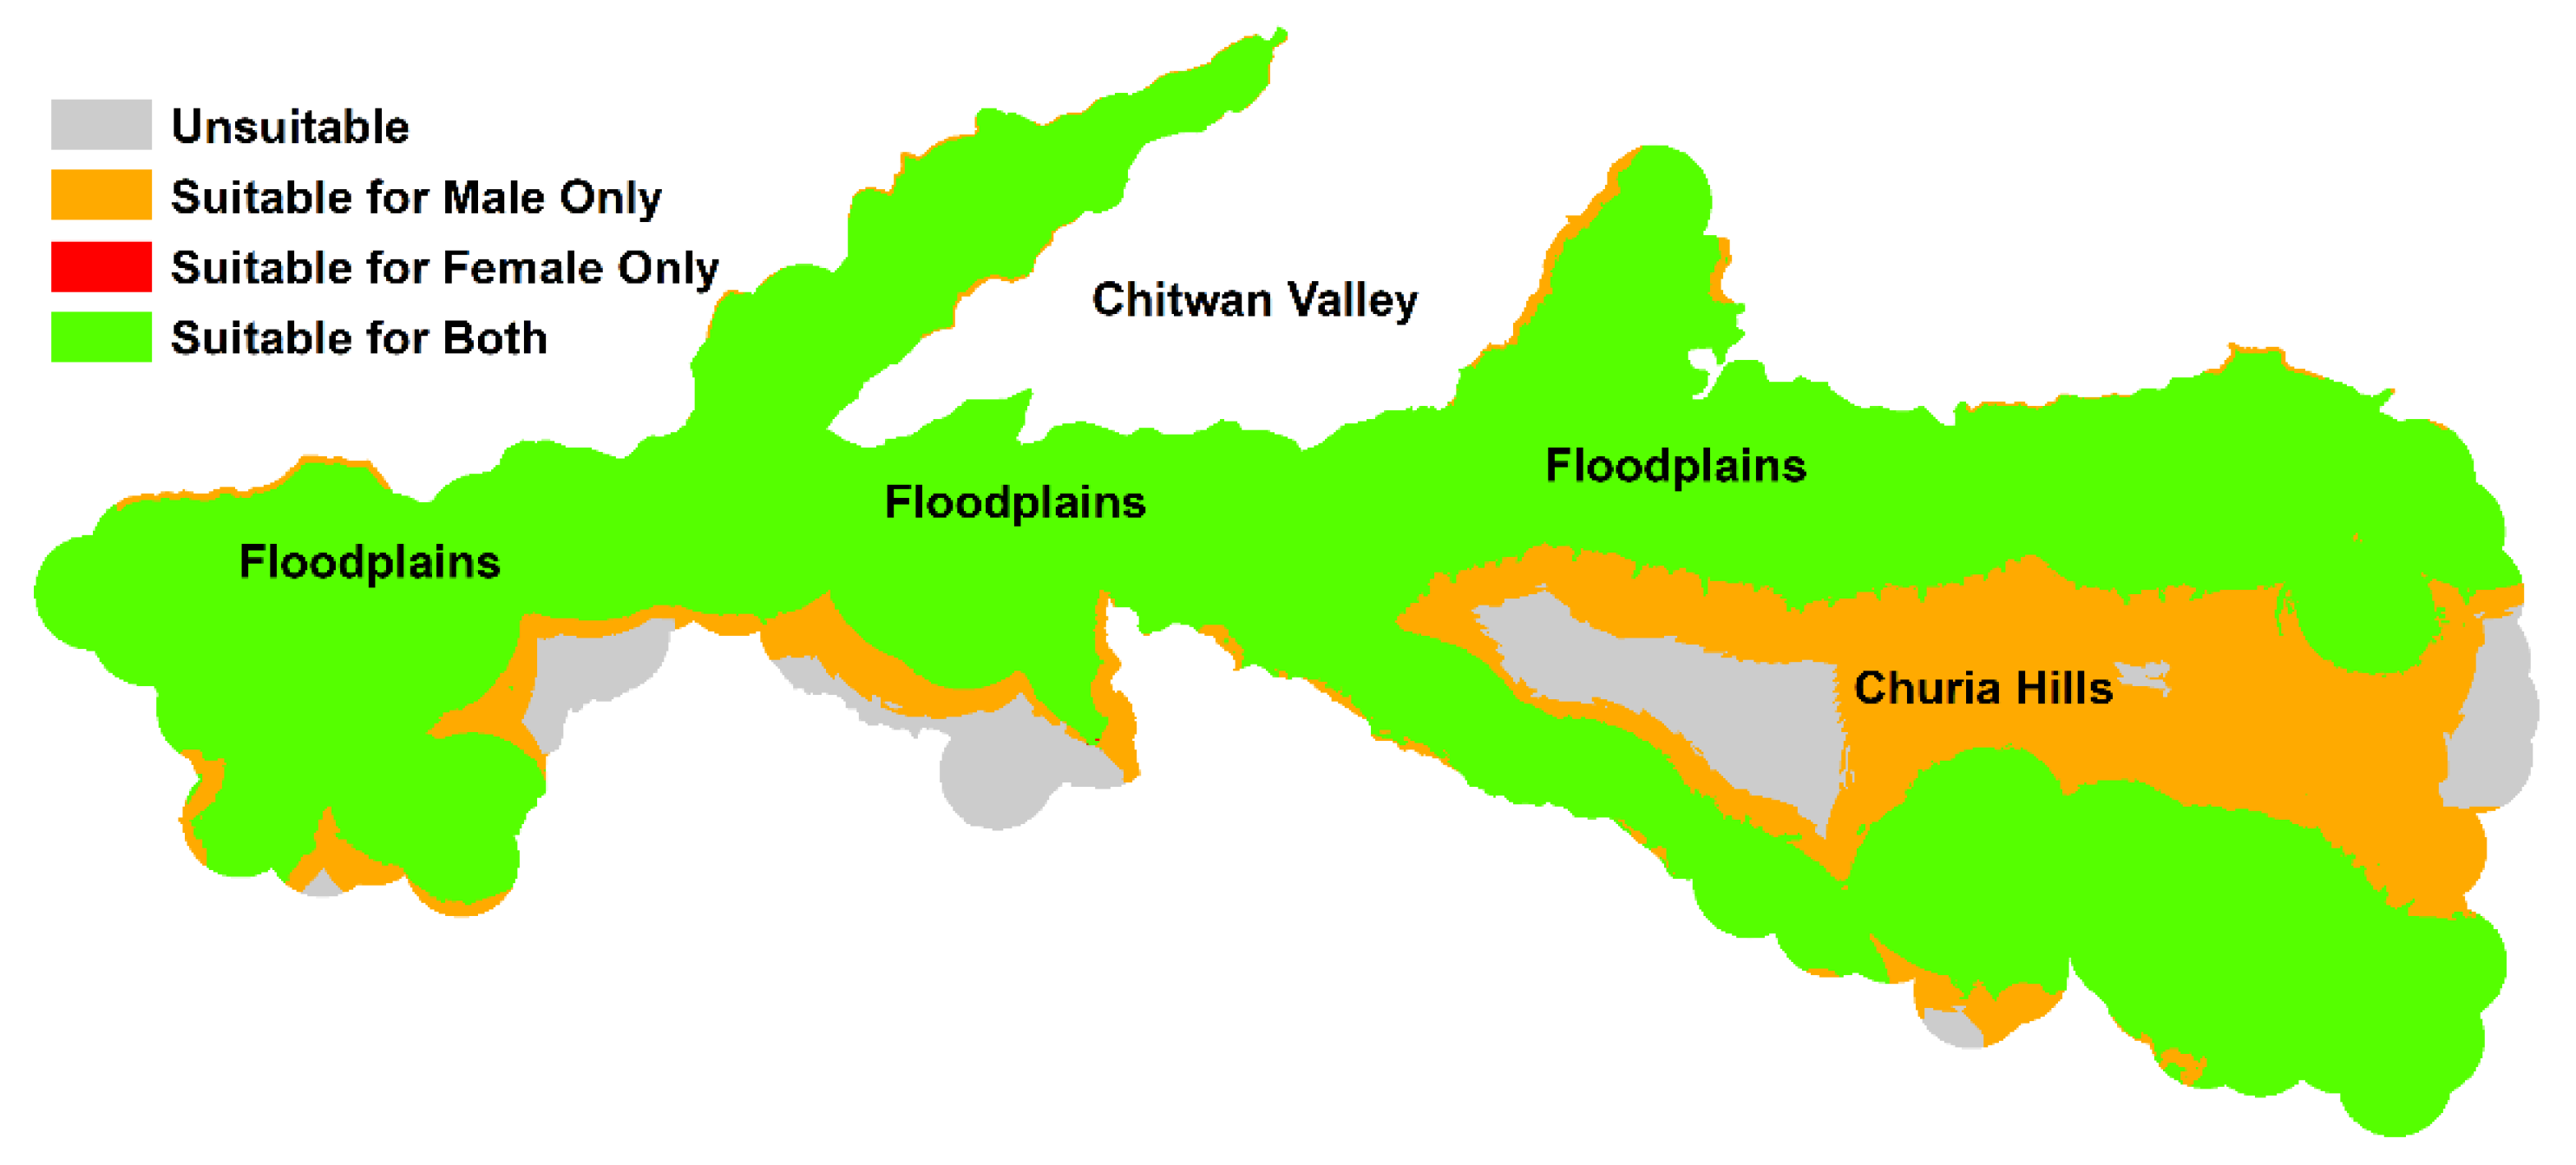
3.1. Maxent
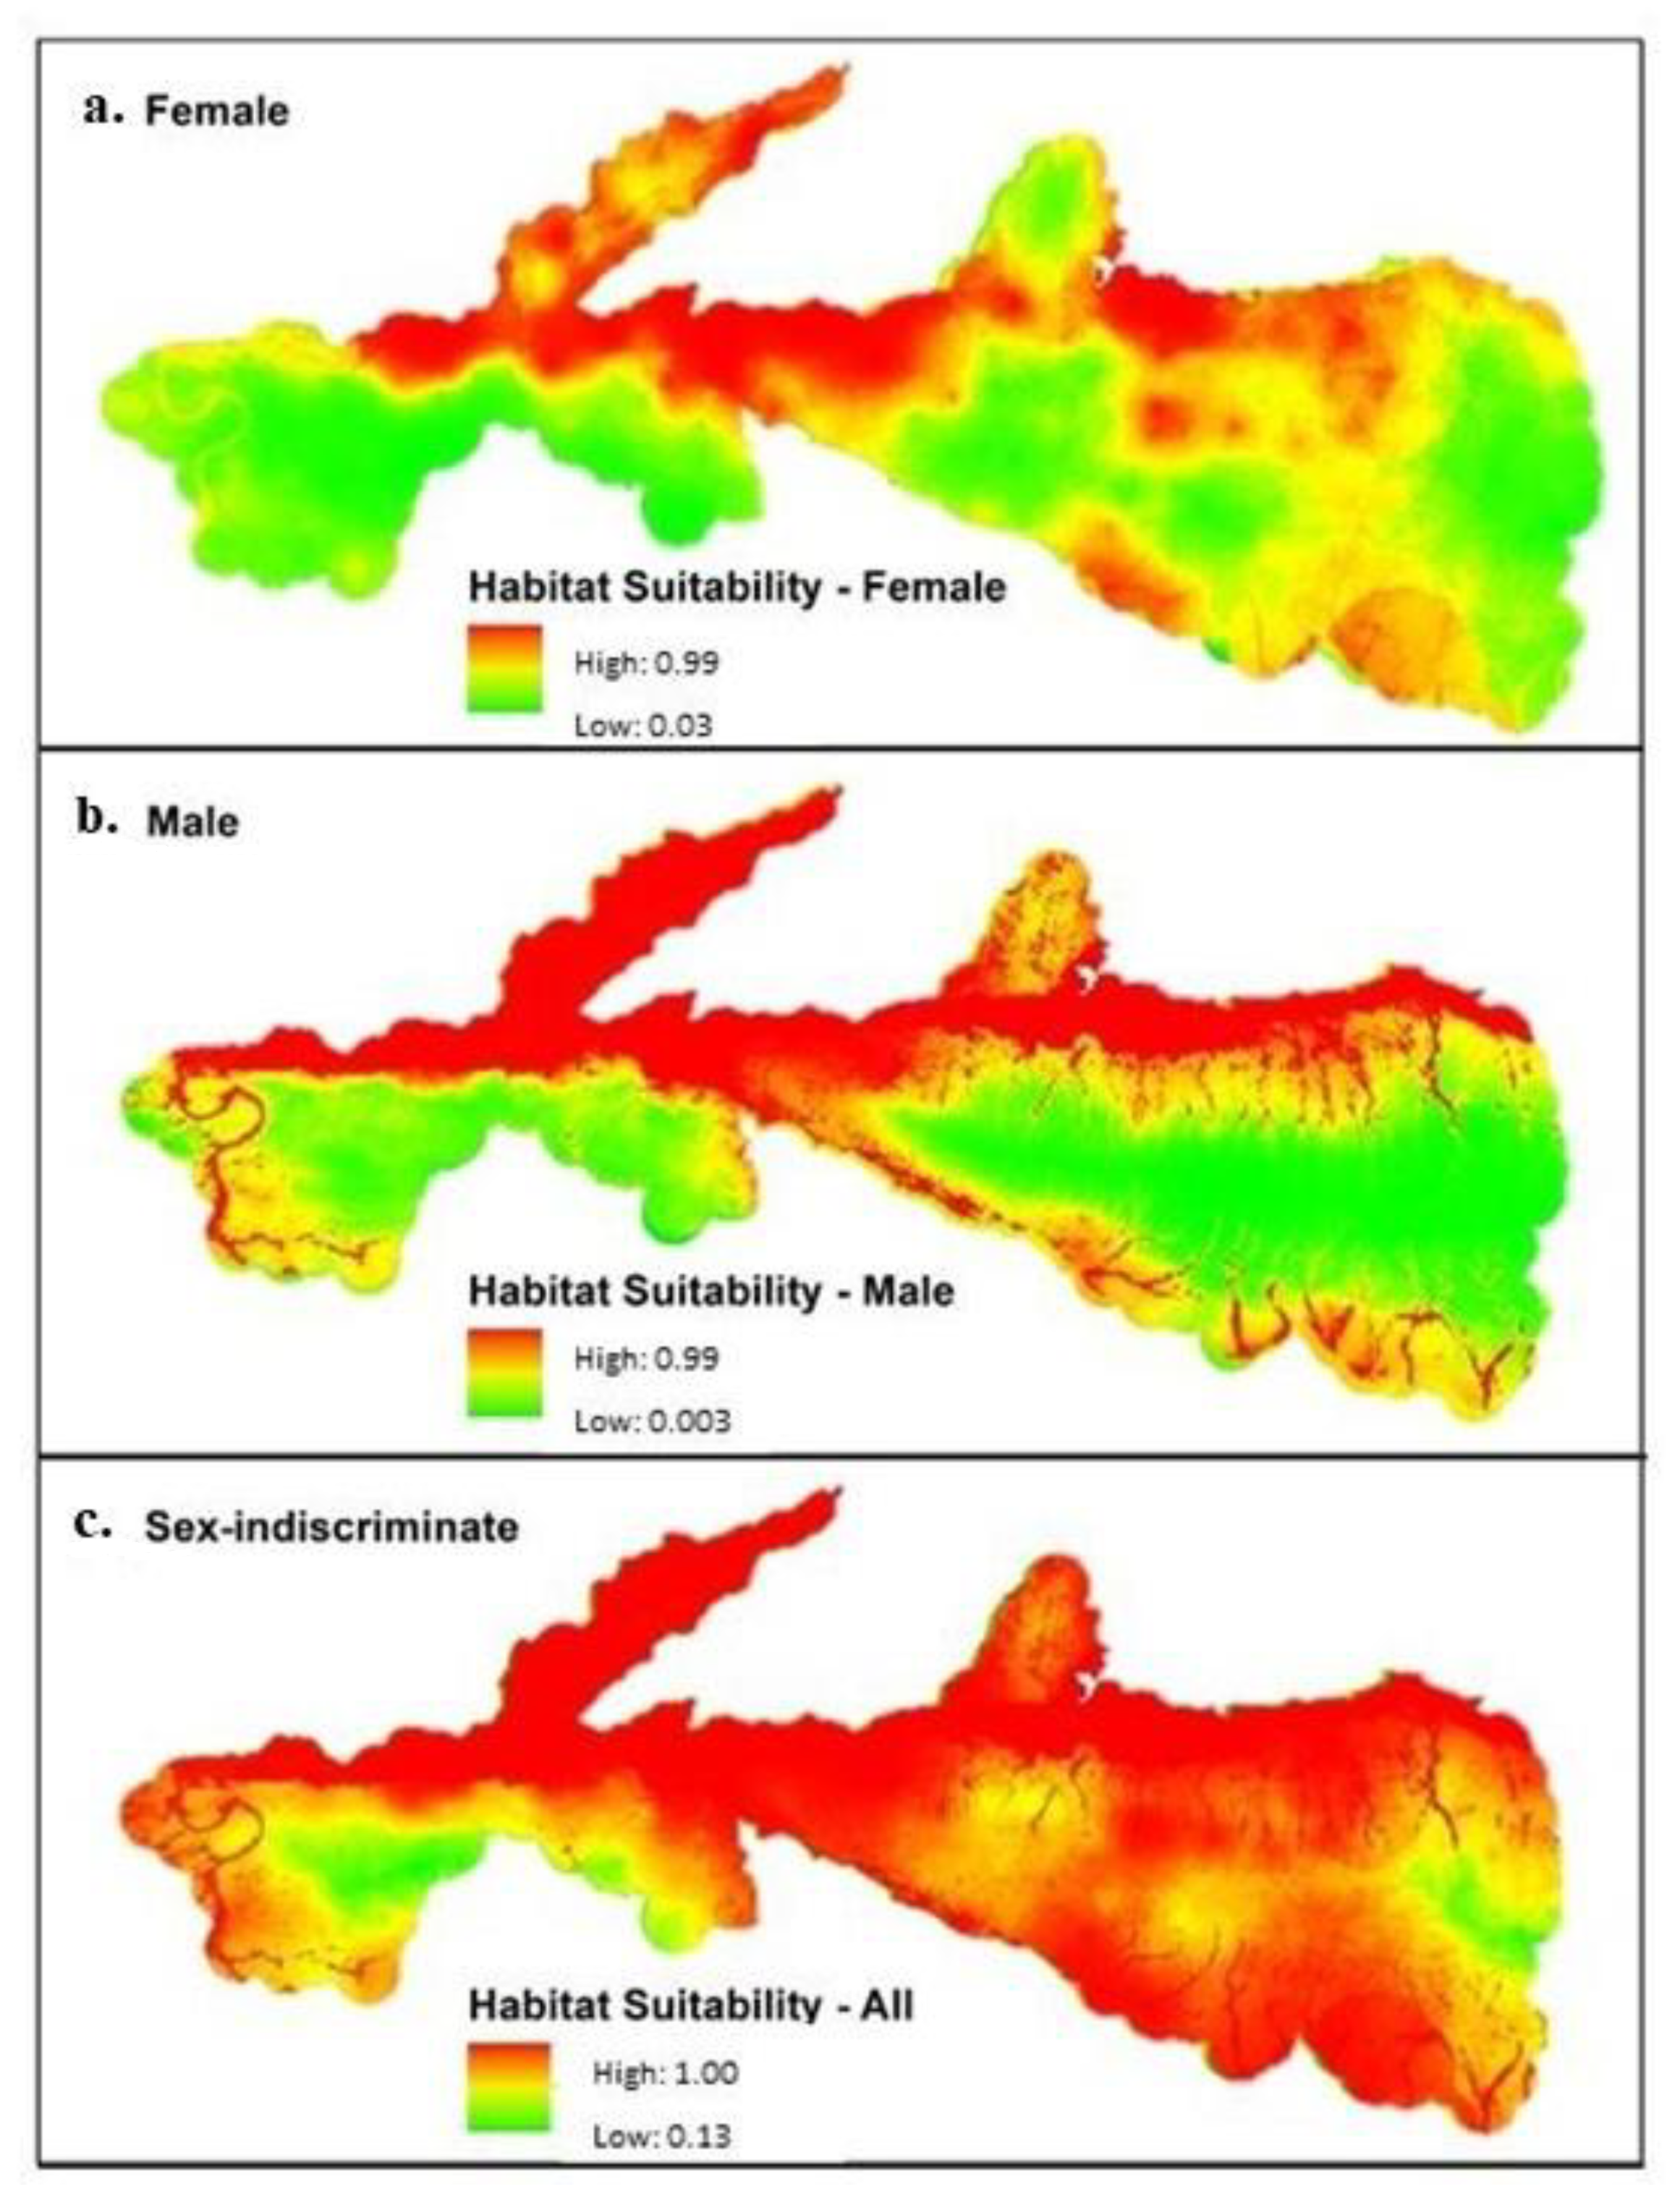
3.2. Occupancy
4. Discussion
5. Conclusions
Author Contributions
Funding
Institutional Review Board Statement
Informed Consent Statement
Data Availability Statement
Acknowledgments
Conflicts of Interest
References
- Schipper, J.; Chanson, J.S.; Chiozza, F.; Cox, N.A.; Hoffmann, M.; Katariya, V.; Lamoreux, J.; Rodrigues, A.S.L.; Stuart, S.N.; Temple, H.J.; et al. The Status of the World’s Land and Marine Mammals: Diversity, Threat, and Knowledge. Science 2008, 322, 225–230. [Google Scholar] [CrossRef] [Green Version]
- Hoffmann, M.; Belant, J.L.; Chanson, J.S.; Cox, N.A.; Lamoreux, J.; Rodrigues, A.S.L.; Schipper, J.; Stuart, S.N. The Changing Fates of the World’s Mammals. Philos. Trans. R. Soc. B Biol. Sci. 2011, 366, 2598–2610. [Google Scholar] [CrossRef] [PubMed]
- Ripple, W.J.; Estes, J.A.; Beschta, R.L.; Wilmers, C.C.; Ritchie, E.G.; Hebblewhite, M.; Berger, J.; Elmhagen, B.; Letnic, M.; Nelson, M.P.; et al. Status and Ecological Effects of the World’s Largest Carnivores. Science 2014, 343, 1241484. [Google Scholar] [CrossRef] [PubMed] [Green Version]
- Ripple, W.J.; Wolf, C.; Newsome, T.M.; Hoffmann, M.; Wirsing, A.J.; McCauley, D.J. Extinction Risk Is Most Acute for the World’s Largest and Smallest Vertebrates. Proc. Natl. Acad. Sci. 2017, 114, 10678–10683. [Google Scholar] [CrossRef] [Green Version]
- Rodrigues, A.S.; Brooks, T.M.; Butchart, S.H.; Chanson, J.; Cox, N.; Hoffmann, M.; Stuart, S.N. Spatially Explicit Trends in the Global Conservation Status of Vertebrates. PLoS One 2014, 9, e113934. [Google Scholar] [CrossRef]
- Villard, M.-A.; Trzcinski, M.K.; Merriam, G. Fragmentation Effects on Forest Birds: Relative Influence of Woodland Cover and Configuration on Landscape Occupancy. Conserv. Biol. 1999, 13, 774–783. [Google Scholar] [CrossRef] [Green Version]
- Ceballos, G.; Ehrlich, P.R. Mammal Population Losses and the Extinction Crisis. Science 2002, 296, 5. [Google Scholar] [CrossRef] [PubMed] [Green Version]
- Ripple, W.J.; Chapron, G.; López-Bao, J.V.; Durant, S.M.; Macdonald, D.W.; Lindsey, P.A.; Bennett, E.L.; Beschta, R.L.; Bruskotter, J.T.; Campos-Arceiz, A.; et al. Saving the World’s Terrestrial Megafauna. BioScience 2016, 66, 807–812. [Google Scholar] [CrossRef] [PubMed] [Green Version]
- WWF. WWF Global Wild Tiger Population Status; Technical Report; WWF: Gland, Switzerland, 2016. [Google Scholar]
- Sanderson, E.W.; Forrest, J.; Loucks, C.; Ginsberg, J.; Dinerstein, E.; Seidensticker, J.; Leimgruber, P.; Songer, M.; Heydlauff, A.; O’Brien, T.; et al. Setting Priorities for Tiger Conservation. In Tigers of the World; Elsevier: Amsterdam, The Netherlands, 2010; pp. 143–161. ISBN 978-0-8155-1570-8. [Google Scholar]
- Broomhall, L.S.; Mills, M.G.L.; Toit, J.T. Home Range and Habitat Use by Cheetahs ( Acinonyx Jubatus ) in the Kruger National Park. J. Zool. 2003, 261, 119–128. [Google Scholar] [CrossRef]
- Gaines, W.L.; Lyons, A.L.; Lehmkuhl, J.F.; Raedeke, K.J. Landscape Evaluation of Female Black Bear Habitat Effectiveness and Capability in the North Cascades, Washington. Biol. Conserv. 2005, 125, 411–425. [Google Scholar] [CrossRef]
- Conde, D.A.; Colchero, F.; Zarza, H.; Christensen, N.L.; Sexton, J.O.; Manterola, C.; Chávez, C.; Rivera, A.; Azuara, D.; Ceballos, G. Sex Matters: Modeling Male and Female Habitat Differences for Jaguar Conservation. Biol. Conserv. 2010, 143, 1980–1988. [Google Scholar] [CrossRef]
- Carter, N. Modeling Tiger Population and Territory Dynamics Using an Agent-Based Approach. Ecol. Model. 2015, 16, 347–362. [Google Scholar] [CrossRef] [Green Version]
- Carter, N.H.; Levin, S.A.; Grimm, V. Effects of Human-induced Prey Depletion on Large Carnivores in Protected Areas: Lessons from Modeling Tiger Populations in Stylized Spatial Scenarios. Ecol. Evol. 2019, 9, 11298–11313. [Google Scholar] [CrossRef] [Green Version]
- Rayan, D.M.; Linkie, M. Managing Conservation Flagship Species in Competition: Tiger, Leopard and Dhole in Malaysia. Biol. Conserv. 2016, 204, 360–366. [Google Scholar] [CrossRef]
- Kafley, H.; Gompper, M.E.; Sharma, M.; Lamichane, B.R.; Maharjan, R. Tigers (Panthera Tigris) Respond to Fine Spatial-Scale Habitat Factors: Occupancy-Based Habitat Association of Tigers in Chitwan National Park, Nepal. Wildl. Res. 2016, 43, 398. [Google Scholar] [CrossRef]
- Thapa, K.; Kelly, M.J. Density and Carrying Capacity in the Forgotten Tigerland: Tigers in the Understudied Nepalese Churia. Integr. Zool. 2017, 12, 211–227. [Google Scholar] [CrossRef]
- Carter, N.H.; Shrestha, B.K.; Karki, J.B.; Pradhan, N.M.B.; Liu, J. Coexistence between Wildlife and Humans at Fine Spatial Scales. Proc. Natl. Acad. Sci. 2012, 109, 15360–15365. [Google Scholar] [CrossRef] [PubMed] [Green Version]
- Stræde, S.; Helles, F. Park-People Conflict Resolution in Royal Chitwan National Park, Nepal: Buying Time at High Cost? Environ. Conserv. 2000, 27, 368–381. [Google Scholar] [CrossRef]
- WWF. The Terai Arc Landscape: Bengal Tigers in the Himalaya’s Shadow; Technical Report; WWF: Gland, Switzerland, 2004. [Google Scholar]
- Carter, N.H.; Gurung, B.; Viña, A.; Campa III, H.; Karki, J.B.; Liu, J. Assessing Spatiotemporal Changes in Tiger Habitat across Different Land Management Regimes. Ecosphere 2013, 4, art124. [Google Scholar] [CrossRef]
- GoN Tiger Conservation Action Plan for Nepal, Kathmandu; Technical Report; Government of Nepal: Kathmandu, Nepal, 2008.
- Thapa, T.B. Habitat Suitability Evaluation for Leopard (Panthera Pardus) Using Remote Sensing and GIS in and around Chitwan National Park, Nepal; Saurashtra University: Rajkot, India, 2011. [Google Scholar]
- Chanchani, P.; Lamichhane, B.R.; Malla, S.; Maurya, K.; Bista, A.; Warrier, R.; Nair, S.; Almeida, M.; Ravi, R.; Sharma, R.; et al. Tigers of the Transboundary Terai Arc Landscape Status, Distribution and Movement in the Terai of India and Nepal; Global Tiger Forum: Dew Delhi, India, 2014. [Google Scholar] [CrossRef]
- Karki, J.B.; Pandav, B.; Jnawali, S.R.; Shrestha, R.; Pradhan, N.M.B.; Lamichane, B.R.; Khanal, P.; Subedi, N.; Jhala, Y.V. Estimating the Abundance of Nepal’s Largest Population of Tigers Panthera Tigris. Oryx 2015, 49, 150–156. [Google Scholar] [CrossRef] [Green Version]
- Ahearn, S.C.; Smith, J.L.D.; Joshi, A.R.; Ding, J. TIGMOD: An Individual-Based Spatially Explicit Model for Simulating Tiger/Human Interaction in Multiple Use Forests. Ecol. Model. 2001, 140, 81–97. [Google Scholar] [CrossRef]
- Smith, J.L.D. The Role of Dispersal in Structuring the Chitwan Tiger Population. Behaviour 1993, 124, 165–195. [Google Scholar] [CrossRef]
- Kanagaraj, R.; Wiegand, T.; Kramer-Schadt, S.; Anwar, M.; Goyal, S.P. Assessing Habitat Suitability for Tiger in the Fragmented Terai Arc Landscape of India and Nepal. Ecography 2011, 34, 970–981. [Google Scholar] [CrossRef]
- Mazak, V. Panthera Tigris. In The American Society of Mammologists; 1981; Volume 152, pp. 1–8. [Google Scholar]
- Phillips, S.J.; Anderson, R.P.; Schapire, R.E. Maximum Entropy Modeling of Species Geographic Distributions. Ecol. Model. 2006, 190, 231–259. [Google Scholar] [CrossRef] [Green Version]
- MacKenzie, D.I.; Nichols, J.D.; Hines, J.E.; Knutson, M.G.; Franklin, A.B. Estimating Site Occupancy, Colonization, and Local Extinction When a Species Is Detected Imperfectly. Ecology 2003, 84, 2200–2207. [Google Scholar] [CrossRef] [Green Version]
- Elith, J.; Graham, C.H. Do They? How Do They? WHY Do They Differ? On Finding Reasons for Differing Performances of Species Distribution Models. Ecography 2009, 32, 66–77. [Google Scholar] [CrossRef]
- Elith, J.; Phillips, S.J.; Hastie, T.; Dudík, M.; Chee, Y.E.; Yates, C.J. A Statistical Explanation of MaxEnt for Ecologists: Statistical Explanation of MaxEnt. Divers. Distrib. 2011, 17, 43–57. [Google Scholar] [CrossRef]
- Elith, J.; Graham, C.H.; Anderson, R.P.; Dudík, M.; Ferrier, S.; Guisan, A.; Hijmans, R.J.; Huettmann, F.; Leathwick, J.R.; Lehmann, A.; et al. Novel Methods Improve Prediction of Species’ Distributions from Occurrence Data. Ecography 2006, 29, 129–151. [Google Scholar] [CrossRef] [Green Version]
- Hernandez, P.A.; Graham, C.H.; Master, L.L.; Albert, D.L. The Effect of Sample Size and Species Characteristics on Performance of Different Species Distribution Modeling Methods. Ecography 2006, 29, 773–785. [Google Scholar] [CrossRef]
- Rupprecht, F.; Oldeland, J.; Finckh, M. Modelling Potential Distribution of the Threatened Tree Species Juniperus Oxycedrus: How to Evaluate the Predictions of Different Modelling Approaches?: Modelling Potential Distribution of Juniperus Oxycedrus. J. Veg. Sci. 2011, 22, 647–659. [Google Scholar] [CrossRef]
- Lobo, J.M.; Jiménez-Valverde, A.; Real, R. AUC: A Misleading Measure of the Performance of Predictive Distribution Models. Glob. Ecol. Biogeogr. 2008, 17, 145–151. [Google Scholar] [CrossRef]
- McPherson, J.M.; Jetz, W. Effects of Species’ Ecology on the Accuracy of Distribution Models. Ecography 2007, 30, 135–151. [Google Scholar] [CrossRef]
- Raes, N.; ter Steege, H. A Null-Model for Significance Testing of Presence-Only Species Distribution Models. Ecography 2007, 30, 727–736. [Google Scholar] [CrossRef]
- MacKenzie, D.I.; Bailey, L.L.; Nichols, J.D. Investigating Species Co-Occurrence Patterns When Species Are Detected Imperfectly. J. Anim. Ecol. 2004, 73, 546–555. [Google Scholar] [CrossRef]
- Royle, J.A.; Kery, M. Applied Hierarchical Modeling in Ecology: Analysis of Distribution, Abundance and Species Richness in R and BUGS; Volume 1: Prelude and Static Models; Elsevier: Amsterdam, The Netherlands, 2015. [Google Scholar]
- Kellner, K. Package “JagsUI.” CRAN Repos. 2019. Available online: https://cran.r-project.org/web/packages/jagsUI/jagsUI.pdf (accessed on 15 November 2021).
- Broms, K.M.; Hooten, M.B.; Fitzpatrick, R.M. Model Selection and Assessment for Multi-Species Occupancy Models. Ecology 2016, 97, 1759–1770. [Google Scholar] [CrossRef]
- Majka, D.; Jenness, J.; Beier, P. CorridorDesigner: ArcGIS Tools for Designing and Evaluating Corridors. 2007. Available online: https://corridordesign.org/ (accessed on 15 November 2021).
- Smith, J.L.D.; McDougal, M.; Sunquist, M.E. Female Land Tenure System in Tigers. In Tigers of the World: The Biology, Biopolitics, Management, and Conservation of an Endangered Species.; Noyes Publications: Park Ridge, IL, USA, 1987; p. 510. [Google Scholar]
- Karki, J.B.; Jnwali, S.R.; Shrestha, R.; Pandey, M.B.; Gurung, G.; Thapa, M. Tiger and Their Prey Base Abundance in Terai Arc Landscape Nepal; Ministry of Forests and Soil Conservation Department of National Parks and Wildlife Conservation and Department of Forests: Babar Mahal, Nepal, 2009. [Google Scholar]
- Bhattarai, B.R.; Fischer, K. Human–Tiger Panthera Tigris Conflict and Its Perception in Bardia National Park, Nepal. Oryx 2014, 48, 522–528. [Google Scholar] [CrossRef] [Green Version]
- Dhungana, R. Human-Tiger (Panthera Tigris Tigris) Conflict in Chitwan National Park, Nepal. Master’s Thesis, Prince of Songkla University, Hat Yai, Thailand, 2016. [Google Scholar]
- Karanth, K.; Stith, B. Prey Depletion Is a Critical Determinant of Tiger Population Viability. In Riding the Tiger: Tiger Conservation in Human-Dominated Landscapes; Cambridge University Press: Cambridge, UK, 1999; pp. 100–113. [Google Scholar]
- Lahoz-Monfort, J.J.; Guillera-Arroita, G.; Wintle, B.A. Imperfect Detection Impacts the Performance of Species Distribution Models. Glob. Ecol. Biogeogr. 2014, 23, 504–515. [Google Scholar] [CrossRef]
- Lamichhane, B.R.; Leirs, H.; Persoon, G.A.; Subedi, N.; Dhakal, M.; Oli, B.N.; Reynaert, S.; Sluydts, V.; Pokheral, C.P.; Poudyal, L.P.; et al. Factors Associated with Co-Occurrence of Large Carnivores in a Human-Dominated Landscape. Biodivers. Conserv. 2019, 28, 1473–1491. [Google Scholar] [CrossRef] [Green Version]
- Sollmann, R.; Furtado, M.M.; Gardner, B.; Hofer, H.; Jácomo, A.T.A.; Tôrres, N.M.; Silveira, L. Improving Density Estimates for Elusive Carnivores: Accounting for Sex-Specific Detection and Movements Using Spatial Capture–Recapture Models for Jaguars in Central Brazil. Biol. Conserv. 2011, 144, 1017–1024. [Google Scholar] [CrossRef]
- Satter, C.B.; Augustine, B.C.; Harmsen, B.J.; Foster, R.J.; Kelly, M.J. Sex-specific Population Dynamics of Ocelots in Belize Using Open Population Spatial Capture–Recapture. Ecosphere 2019, 10, e02792. [Google Scholar] [CrossRef]
- Carter, N.; Killion, A.; Easter, T.; Brandt, J.; Ford, A. Road Development in Asia: Assessing the Range-Wide Risks to Tigers. Sci. Adv. 2020, 6, eaaz9619. [Google Scholar] [CrossRef] [PubMed]
- Jones, S. Tigers, Trees and Tharu: An Analysis of Community Forestry in the Buffer Zone of the Royal Chitwan National Park, Nepal. Geoforum 2007, 38, 558–575. [Google Scholar] [CrossRef]
- Diaz, S. Summary for Policymakers of the Global Assessment Report on Biodiversity and Ecosystem Services of the Intergovernmental Science-Policy Platform on Biodiversity and Ecosystem Services; IPBES Secretariat: Bonn, Germany, 2019. [Google Scholar]


| Dist. to Water | Dist. to Human | Prey | Elevation | % Grass | % Riverine | % Sal | |
|---|---|---|---|---|---|---|---|
| Dist. to Water | 1 | 0.5241 (2.2 × 10⁻¹⁶) | −0.1143 (0.0443) | 0.6498 (2.2 × 10⁻¹⁶) | −0.3731 (1.12 × 10⁻¹¹) | −0.3068 (3.49 × 10⁻⁸) | 0.5527 (2.2 × 10⁻¹⁶) |
| Dist. to Human | 1 | −0.2085 (0.0002) | 0.6694 (2.2 × 10⁻¹⁶) | −0.3320 (2.04 × 10⁻⁹) | −0.3310 (2.3 × 10⁻⁹) | 0.5152 (2.2 × 10⁻¹⁶) | |
| Prey | 1 | −0.1321 (0.0210) | 0.3767 (6.8 × 10⁻¹²) | 0.1297 (0.0223) | −0.3447 (4.44 × 10⁻¹⁰) | ||
| Elevation | 1 | −0.3310 (3.19 × 10⁻⁹) | −0.2877 (3.17 × 10⁻⁷) | 0.4819 (2.2 × 10⁻¹⁶) | |||
| % Grass | 1 | −0.0269 (0.6359) | −0.7085 (2.2 × 10⁻¹⁶) | ||||
| % Riverine | 1 | −0.5686 (2.2 × 10⁻¹⁶) | |||||
| % Sal | 1 |
| n | Avg. AUC | Standard Deviation | p-Value | ||
|---|---|---|---|---|---|
| Female | True | 69 | 0.7086 | 0.2486 | 2.72 × 10⁻¹⁴ |
| Random | 1000 | 0.5143 | 0.2762 | ||
| Male | True | 57 | 0.6692 | 0.2892 | 3.73 × 10⁻⁹ |
| Random | 1000 | 0.4984 | 0.2572 | ||
| Sex-Indiscriminate | True | 108 | 0.6885 | 0.2780 | 2.06 × 10⁻¹⁰ |
| Random | 1000 | 0.5041 | 0.2830 | ||
| Models | Habitat Suitability | 0.0–0.3 | 0.3–0.6 | 0.6–0.8 | 0.8–1.0 |
|---|---|---|---|---|---|
| Female | % of study area | 28.1 | 65.4 | 5.9 | 0.5 |
| Total area (km2) | 396.5 | 921.8 | 83.3 | 7.5 | |
| Male | % of study area | 8.1 | 84.7 | 7.0 | 0.1 |
| Total area (km2) | 114.6 | 1193.6 | 99.6 | 1.5 | |
| Sex-Indiscriminate | % of study area | 31.9 | 61.4 | 6.0 | 0.6 |
| Total area (km2) | 449.6 | 865.6 | 85.6 | 8.4 |
| Female | Male | Sex-Indiscriminate | |
|---|---|---|---|
| Urban | −0.336 | −0.900 | −0.760 |
| Sal Forest | −0.175 | −1.594 | −1.087 |
| River | −0.023 | 0.480 | 0.221 |
| Distance to Water | −0.130 | −0.213 | 0.015 |
| Prey Density | 1.588 | 0.949 | 1.572 |
| Log Score | AUC | Briers Log | |
|---|---|---|---|
| Female | 229.72 | 0.75 | 17.33 |
| Male | 307.35 | 0.69 | 24.28 |
| Sex-Indiscriminate | 482.03 | 0.63 | 47.64 |
Publisher’s Note: MDPI stays neutral with regard to jurisdictional claims in published maps and institutional affiliations. |
© 2021 by the authors. Licensee MDPI, Basel, Switzerland. This article is an open access article distributed under the terms and conditions of the Creative Commons Attribution (CC BY) license (https://creativecommons.org/licenses/by/4.0/).
Share and Cite
An, L.; Bohnett, E.; Battle, C.; Dai, J.; Lewison, R.; Jankowski, P.; Carter, N.; Ghimire, D.; Dhakal, M.; Karki, J.; et al. Sex-Specific Habitat Suitability Modeling for Panthera tigris in Chitwan National Park, Nepal: Broader Conservation Implications. Sustainability 2021, 13, 13885. https://doi.org/10.3390/su132413885
An L, Bohnett E, Battle C, Dai J, Lewison R, Jankowski P, Carter N, Ghimire D, Dhakal M, Karki J, et al. Sex-Specific Habitat Suitability Modeling for Panthera tigris in Chitwan National Park, Nepal: Broader Conservation Implications. Sustainability. 2021; 13(24):13885. https://doi.org/10.3390/su132413885
Chicago/Turabian StyleAn, Li, Eve Bohnett, Curtis Battle, Jie Dai, Rebecca Lewison, Piotr Jankowski, Neil Carter, Dirgha Ghimire, Maheshwar Dhakal, Jhamak Karki, and et al. 2021. "Sex-Specific Habitat Suitability Modeling for Panthera tigris in Chitwan National Park, Nepal: Broader Conservation Implications" Sustainability 13, no. 24: 13885. https://doi.org/10.3390/su132413885