Article

Participatory Mapping for Strengthening Environmental Governance on Socio-Ecological Impacts of Infrastructure in the Amazon: Lessons to Improve Tools and Strategies

by
Carla Mere-Roncal
1,2,*,
Gabriel Cardoso Carrero
3,
Andrea Birgit Chavez
2,4,
Angelica Maria Almeyda Zambrano
2,4,
Bette Loiselle
4,5,
Felipe Veluk Gutierrez
1,
Vanessa Luna-Celino
6,
Marliz Arteaga
6,
Eduardo Schmitz Bongiolo
2,
André Segura Tomasi
7,
Paul André Van Damme
8,
Dennis Edgar Lizarro Zapata
9 and
Eben North Broadbent
1,2
1
School of Forest, Fisheries, and Geomatics Sciences, University of Florida, Gainesville, FL 32611, USA
2
Spatial Ecology and Conservation Lab, School of Forest, Fisheries, and Geomatics Sciences, University of Florida, Gainesville, FL 32611, USA
3
Department of Geography, University of Florida, Gainesville, FL 32611, USA
4
Center for Latin American Studies, University of Florida, Gainesville, FL 32611, USA
5
Department of Wildlife Ecology and Conservation, University of Florida, Gainesville, FL 32611, USA
6
School of Natural Resources and Environment, University of Florida, Gainesville, FL 32611, USA
7
Instituto Internacional de Educação do Brasil IEB, Brazilia 70863-520, Brazil
8
Faunagua, Instituto de Investigación Aplicada de los Recursos Acuáticos, Sacaba-Cochabamba 31001, Bolivia
9
Centro de Investigación de Recursos Acuáticos, Universidad Autónoma del Beni Mcal. José Ballivián, Campus Universitario “Hernán Melgar Justiniano”, Trinidad, Bolivia
*
Author to whom correspondence should be addressed.
Sustainability 2021, 13(24), 14048; https://doi.org/10.3390/su132414048
Submission received: 19 November 2021 / Revised: 13 December 2021 / Accepted: 14 December 2021 / Published: 20 December 2021
(This article belongs to the Special Issue Biodiversity and Ecosystem Services in Forest Ecosystems)

Abstract

:
The Amazon region has been viewed as a source of economic growth based on extractive industry and large-scale infrastructure development endeavors, such as roads, dams, oil and gas pipelines and mining. International and national policies advocating for the development of the Amazon often conflict with the environmental sector tasked with conserving its unique ecosystems and peoples through a sustainable development agenda. New practices of environmental governance can help mitigate adverse socio-economic and ecological effects. For example, forming a “community of practice and learning” (CoP-L) is an approach for improving governance via collaboration and knowledge exchange. The Governance and Infrastructure in the Amazon (GIA) project, in which this study is embedded, has proposed that fostering a CoP-L on tools and strategies to improve infrastructure governance can serve as a mechanism to promote learning and action on factors related to governance effectiveness. A particular tool used by the GIA project for generating and sharing knowledge has been participatory mapping (Pmap). This study analyzes Pmap exercises conducted through workshops in four different Amazonian regions. The goal of Pmap was to capture different perspectives from stakeholders based on their experiences and interests to visualize and reflect on (1) areas of value, (2) areas of concern and (3) recommended actions related to reducing impacts of infrastructure development and improvement of governance processes. We used a mixed-methods approach to explore textual analysis, regional multi-iteration discussion with stakeholders, participatory mapping and integration with ancillary geospatial datasets. We believe that by sharing local-knowledge-driven data and strengthening multi-actor dialogue and collaboration, this novel approach can improve day to day practices of CoP-L members and, therefore, the transparency of infrastructure planning and good governance.

1. Introduction

The Amazon rainforest plays crucial roles from a sociocultural, economic and environmental perspective. The region is recognized for its unique and vast biological and cultural diversity, and for providing a wide variety of environmental goods and services, including the regulation of regional and global biochemical and atmospheric cycles [1,2,3].
In the past decades, the Amazon basin has been viewed as a source of economic growth due to extractive industries and large-scale infrastructure development endeavors, such as roads, dams, oil and gas pipelines and mining [4,5,6,7]. These projects promise social and economic progress (e.g., energy, broader access to markets, health care and education) [8,9]. However, the associated negative environmental (e.g., forest fragmentation and degradation, fires and poaching) and social impacts (e.g., land grabbing, corruption, human conflicts and violence) are escalating, as environmental roll-backs promote more infrastructure and resource extraction investments [5,6,7,8,9,10,11,12,13,14,15,16].
International and national policies advocating for the development of the Amazon basin often conflict with the environmental sector tasked with conservation of its unique ecosystems and peoples through a sustainable development agenda [17,18]. For instance, the Initiative for the Integration of the Regional Infrastructure of South America (IIRSA, now COSIPLAN) aims to facilitate regional and global commerce through the development of terrestrial, aerial and fluvial infrastructure throughout the Amazon [12,13,14,15,16,17,18,19]. The outcomes of such development projects are seen everywhere. For example, road construction increased migration and has led to high rates of deforestation and contentious processes [9,10,11,12,13,14,15,16,17,18,19,20,21,22,23,24,25]. Lack of public participation in the planning process is one of the crucial factors behind the negative outcomes of large-scale infrastructure projects; especially neglected is the participation by local communities who are directly and indirectly affected by these projects [26,27,28].
Besides the need for policies aimed at integrating infrastructure development, resource extraction and conservation in the Amazon [6,29,30], there is a need for “innovative models of governance to mitigate the negative socio-economic and ecological effects” [31] (p. 1890). Environmental governance practices can provide such a model when diverse social actors are engaged in ways that reflect greater equity and responsibility [32,33]. Certainly, environmental governance approaches have branched out to more decentralized and multicentric structures and thus, contribute to improved monitoring and mitigation of the negative impacts of infrastructure initiatives [27,28,29,30,31,32,33,34,35,36]. One example is reported by Mendoza et al. [27] who conducted multi-stakeholder workshops to facilitate participation in planning to mitigate the negative impacts of an Amazonian road. The workshops involved many local people who identified the potential problems from infrastructure, providing key information for establishing local planning priorities.
Forming a “community of practice and learning” (CoP-L) is another approach for effective governance via collaboration. A CoP-L’s objective is to foster expertise exchange by focusing on a core issue that its members acknowledge and care about [37]. Like any other community, a CoP-L requires reciprocity and trust, values that are developed through open, committed interactions where individuals show the willingness to share and learn together. Sharing knowledge, skills and techniques allow the community to create a sense of belonging [38,39,40,41].
Along these lines, the Governance and Infrastructure in the Amazon (GIA, https://giamazon.org/, accessed on 14 September 2021) project, in which this study is embedded, has proposed that fostering a CoP-L on tools and strategies to improve infrastructure governance can serve as a mechanism to promote learning and action on factors related to governance effectiveness. Once learning occurs, there is scope to incorporate this knowledge into the practices of CoP-L members, which are then expected to improve results in terms of infrastructure planning and environmental governance. GIA, led by the University of Florida (UF)’s Tropical Conservation and Development (TCD) program, is analyzing how social learning is playing out in CoP-L with partners in focus regions in Bolivia, Brazil, Colombia and Peru.
A particular tool used by the GIA project for generating and sharing knowledge is participatory mapping (Pmap). Pmap combines participatory methods and geospatial analysis to create maps with the aim of providing a visual discussion and representation of a place and the important features or issues within it. Pmap projects have grown throughout the world over the past decades and have been largely used as a tool to incorporate indigenous rights and environmental knowledge into science-based conservation planning [42,43]. Participatory maps are not restricted to portraying geographic features only (e.g., rivers, roads, communal territories); they can also depict cultural, historical and social knowledge [44].
The implementation of Pmap projects, along with the development of Geographic Information System (GIS) tools, has advanced community participation and empowerment in decision-making processes [45,46]. Aditya (2010) described the main benefits from using Pmap methods for decision-making and problem-solving activities, which include: facilitate explicit communication, gather and transfer information and ideas, and enable access of shared resources [47]. All these characteristics make Pmap a critical tool for building and supporting a CoP-L. Our framework is thus based on the theoretical assumption that maps produced in a participatory way portray a collective expression by the community and other stakeholders of their values and concerns, and can be used successfully in many contexts to a. exchange information and ultimately b. persuade decision-makers of the legitimacy of local claims to land and natural resources and question prospective infrastructure projects.
Pmap can be implemented through a diverse set of tools and methods that are increasingly being developed and improved in many parts of the world. Our case study presented here uses maps as a mechanism to facilitate communication of stakeholder’s spatial information to better understand why places are important (aspect of value) and what is at stake in an event of significant change in land use (concerns). Here, we adopt a simplified applications-driven method where collection of original geo-referenced field data via scale mapping is combined with dialogue and reflection during participatory organized workshops that were part of the consolidation of a CoP-L In this application, Pmap acts as a mechanism to promote knowledge sharing among participants within the CoP-L and provides an overview of the temporal and spatial understanding of the respective regions.
We report on Pmap exercises conducted in each of the four focal regions with the goal to capture the different perspectives, priorities, values and concerns as they relate to reducing impacts of infrastructure development and improvement of environmental governance processes. Using textual and spatial analysis, this study shows how Pmap can be used as a tool to visualize and reflect on (1) areas of value, (2) areas of concern and (3) recommended actions. The study will further shed light on implications for infrastructure and other environmental governance projects in Amazonia and elsewhere given the context of strengths and weaknesses of the Pmap. (As areas of concern, we define a personal or institutional perspective related to socio-ecological sustainability and well-being that is affected by infrastructure projects (roads, dams, hydroways) and impacts natural resources, livelihoods, biodiversity, protected areas, indigenous territories and local communities, among others. As areas of value, we characterize biophysical, social, cultural, economic and holistic attributes as defined by workshop participants. As recommended actions, we define activities on the ground that reduce or address described concerns directly and indirectly (i.e., legal actions, satellite monitoring, etc.) as well as based on identified needs and/or opportunities. (See Salafsky et al. 2008 for a better understanding of threats and actions within conservation projects.)

2. Materials and Methods
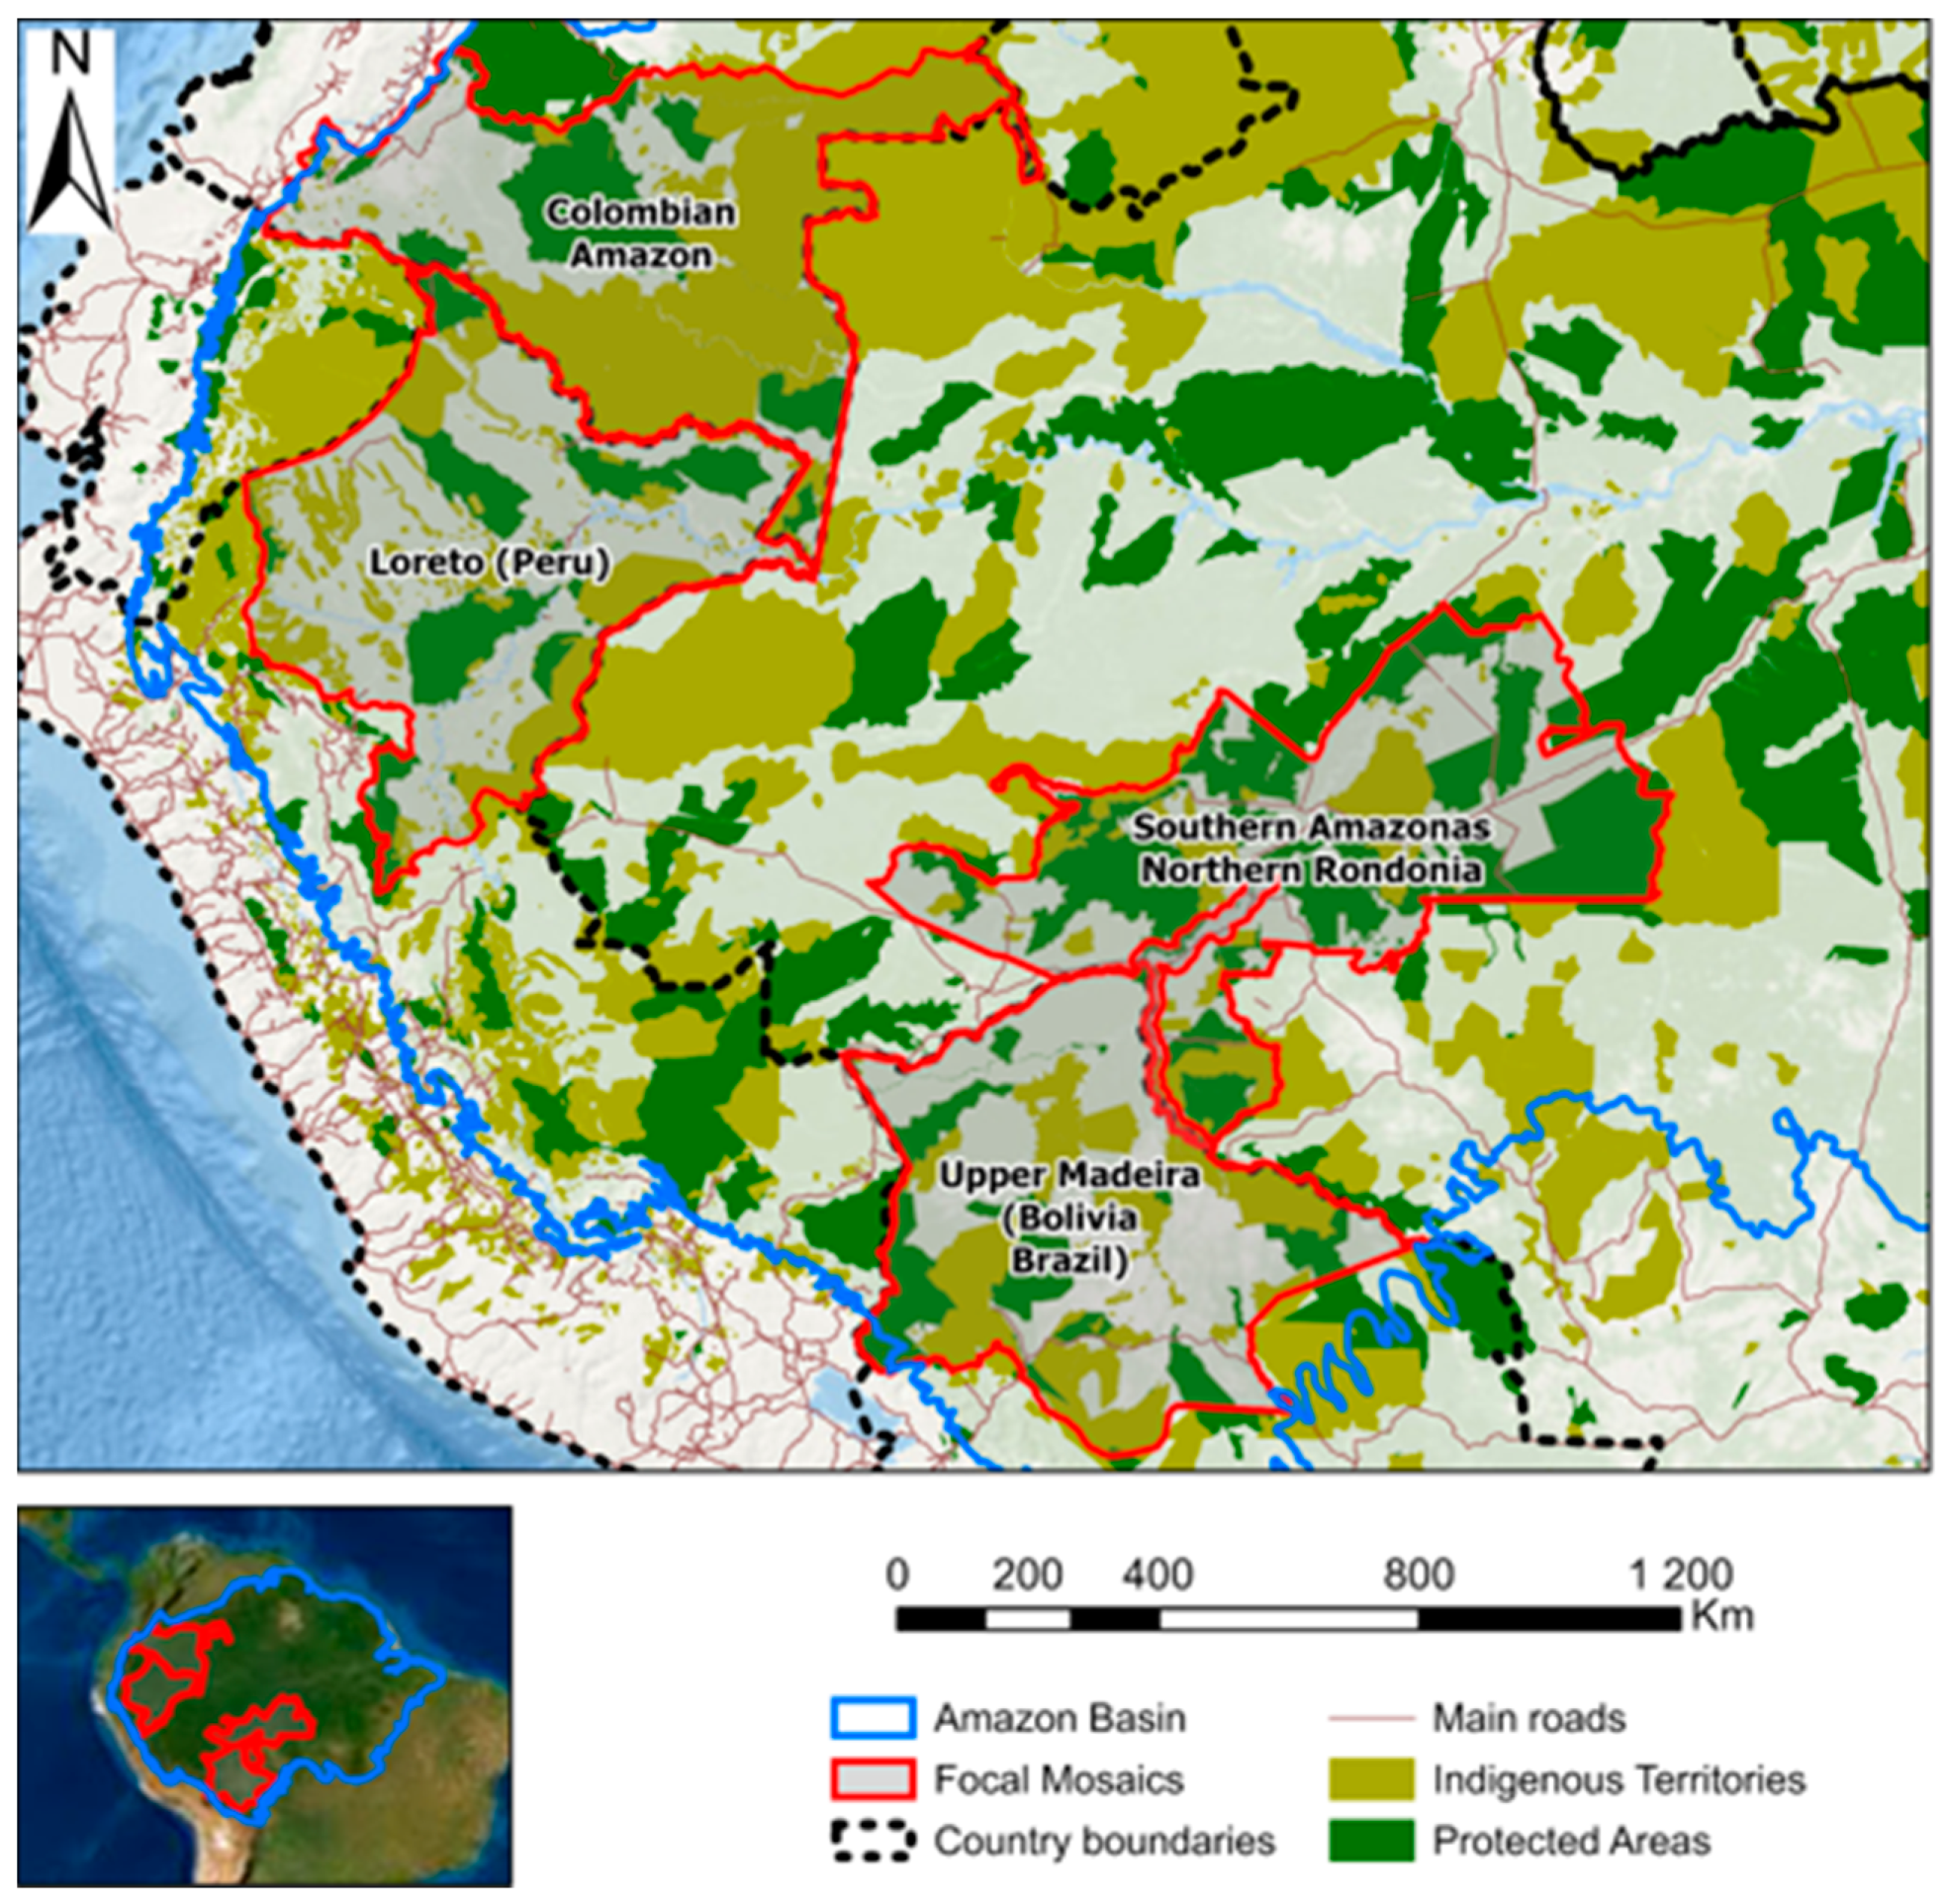
2.1. Study Areas

The research is based on the development of a CoP-L in a series of workshops organized by the GIA project in each of its four different Amazonian focus regions (hereafter called mosaics) shown in Figure 1, with relevant contextual data in Table 1. These mosaics were selected for gathering clusters of diverse actors involved in governance processes related to infrastructure projects. CoP-L members themselves adjusted and validated the relevance of these landscape mosaics during previous interviews and other communications prior to the Pmap exercise. The mosaic boundaries of the Bolivian workshop encompass part of Brazilian territory (dashed area in Figure 1), an area of 10 km alongside the Mamoré and Madera rivers, from Principe da Beira location up to the city of Porto Velho in Rondônia state. The inclusion was a request from Bolivian participants that felt the need to point out concerns that stemmed from infrastructure impacts on the countries’ borders, mainly the two built hydroelectric dams of Santo Antônio and Jirau.
Bolivia’s mosaic (hereafter called Bolivia) is represented by the Upper Madera river basin, Amazon river’s largest tributary. The mosaic encompasses the northernmost portion of Bolivia, in the departments (states) of Pando and Beni, bordering Southern Peru (upper Madre de Dios basin) and Rondônia and Acre States in Brazil. The mosaic’s total population is over 683,996 inhabitants centered mostly in the cities of Trinidad, Riberalta, Guayaramerin and Cobija. It is inhabited by 12 ethnic groups along with riverine people; the region hosts six indigenous territories [48] and six national protected areas [49] that represent 29% and 32% of the total area, respectively. There are also several subnational protected areas occupying a large surface area. The mosaic is connected to Brazil through twin cities and roads, such as Cobija (Pando) and Brasileia/Epitaciolândia (Acre) and Guayaramerin (Beni) and Guajara-Mirim (Rondônia). Madre de Dios and Mamoré rivers meet to form the Madera river, the border between Brazil and Bolivia. Besides two dams on the Madera river (Jirau and Santo Antônio) on the Brazilian side (80 km from the Bolivian border), both countries are planning the construction of the binational Ribeirão Preto dam on the Madera River; Bolivia is also planning for the Cachuela Esperanza dam on the Beni River [50]. Both of these planning operations foresee sluices and hydroways to transport agricultural commodities from upstream to the lower Amazon basin.
Brazil’s mosaic (hereafter called Brazil) extends over Southern Amazonas and Northern Rondônia states, located in the southwestern Brazilian Amazon and comprising 14 municipalities distributed equally in each state. Total population is over 963,000 inhabitants, of which 530,000 live in Porto Velho, the Rondônia state capital [51]. Besides urban residents, the region is home to 20 ethnic groups, traditional communities including riverine, agro-extractive, quilombolas, as well as colonists and ranchers. This vast territory, with over 393,000 km2, is in the interfluvial region of the Madera and Purus rivers, with diverse forest and water ecosystems, comprising a total of 51 indigenous territories and 82 protected areas representing 16.4% and 45.9% of its total area (Table 1), respectively [52,53]. There are various challenges and threats affecting this region, which is recognized for its significant importance for the conservation of Amazonian socio-biodiversity [54]. Among these challenges and threats are the uncontrolled encroachment at the agricultural frontier, illegal logging [55] and mining, forest fires [56], land tenure insecurity and land grabbing [57], low government presence and services [58] and major infrastructure projects, such as the paving of half of the 2.687 km of Federal and State Highways (BR-319, BR-230 and BR-364) and the Santo Antônio and Jirau hydroelectric dams, among others [50].
The Colombian Amazon mosaic (hereafter called Colombia) accounts for nearly 8% of the total area of the Amazon Basin and more than 65% of the country’s forest. This mosaic is comprised of two ecological landscapes, the Amazonian lowlands representing 35% of the Colombian Amazon (Putumayo, Caquetá, Guaviare, Amazonas, Vaupés, Guainía and southern Vichada departments) and the Andean–Amazonian transition zone called Piedemonte (Meta, Nariño and Cauca departments), the latter of which has the greatest anthropic intervention and has experienced significant ecosystem transformations. The percent area of the Colombian Amazon under protected areas and indigenous territories is 27.8% and 53.3%, respectively, with an overlap of 7% (74.1% in total). The Amazonian lowlands have been less impacted by anthropogenic disturbance and harbor most of the indigenous population; in contrast, the more impacted Piedemonte hosts most of the region’s population. After the Peace agreement in 2016, this mosaic has been targeted for transport-related infrastructure projects, especially roads and hydroways to connect the mosaic and other regions that are not well integrated with the rest of the country [59].
Sources: Total Population (Brazil: [51], Peru: [60], Colombia: [61], Bolívia: [62], Indigenous Population (Brazil: [63], Peru: [60], Colombia: [64], Bolivia: [62], Protected Areas, Indigenous Areas, Dams (RAISG: https://www.amazoniasocioambiental.org/en/, accessed on 1 December 2021); Deforestation (RAISG, cumulative deforestation up to 2000; Global Forest Change data from 2001 to 2019: https://earthenginepartners.appspot.com/science-2013-global-forest, accessed on 1 December 2021); Roads (Ministry of Infrastructure for Brazil: https://www.gov.br/infraestrutura/pt-br/assuntos/dados-de-transportes/bit/bitmodosmapas#maprodo (accessed on 1 December 2021) and GRIP4 global roads database for other countries: https://www.globio.info/download-grip-dataset, accessed on 14 September 2021).
Peru’s mosaic (hereafter called Peru) comprises the Loreto department located in its northwestern region. This mosaic borders with Brazil and Colombia and is Peru’s largest department covering nearly 369,000 km2. This mosaic is drained by two mighty rivers, Marañon and Ucayali, that come together to form the Amazon River (Solimões River for Brazil). The total population in this mosaic is 1,049,364, most of which is centered in Loreto’s capital city of Iquitos, the largest Peruvian city not connected by road and only accessible by river or air. Loreto possesses an extraordinary biological and cultural diversity and it harbors one of the largest peatlands (i.e., Pastaza-Marañon) responsible for storing 32% of the soil carbon in South America [65]. The percent area of Peru’s mosaic under protected areas and indigenous territories is 23.8% and 28.4%, respectively. Several development projects, including infrastructure, oil, mining and others threaten the mosaic [66]. There are two mega-infrastructure projects planned or in the process of being implemented: The Amazon Waterway (-or Hydroway) and the Iquitos–Saramiriza highway. Oil and gas operations encompass many hydrocarbon blocks which have caused significant negative environmental and social impacts through toxic spills into local waterways for several decades [67,68]. The dynamics of governance in the mosaic have been influenced in recent years by processes of decentralization and emergent political will to address the ecological viability of infrastructure projects. Socio-environmental problems related to infrastructure projects create challenges that emanate the need for a collaborative network to strengthen governance tools in the mosaic.

2.2. Participatory Research Design

Pmap activities were implemented in four sequential steps (Figure 2). The first two steps are part of a preliminary assessment of the overall context of the region and possible participants to the workshops. It included a developmental phase from October 2018 to May 2019 based on qualitative data collection from interviews and surveys with key partner organizations, secondary data collection and planning activities to strategically develop the context for the Pmap exercise.
In a second step, secondary sources of information were used to prepare and test a pilot participatory mapping exercise. After a period of revision, the third step led to the implementation of the workshops and the Pmap exercises, which generated qualitative and quantitative spatial data that were digitized and stored in a geodatabase. The last step was to summarize and interpret the results, integrate qualitative and quantitative information on the analyses and results. Our mixed-methods approach explored textual analysis, regional multi-iteration discussion with stakeholders, participatory mapping and integration with ancillary geospatial datasets. Our results mainly focus on the core steps three and four of the p-map exercise design.

2.3. Workshops and the Pmap

Four workshops, one in each country’s mosaic, were organized to stimulate discussion and reflection on governance and infrastructure in the Amazon. Workshop participants were selected by GIA and Workshop participants included non-profit organizations (NGOs) with a long trajectory working in the mosaics and other relevant local actors, civil society groups, some government representatives, indigenous and traditional communities and academia. In addition, a limited number of participants from other mosaics were invited. A total of 117 stakeholders attended the workshops (see Table S1 for complete list of stakeholders per mosaic). Although the criteria to include participants was similar for each mosaic, the actual composition of stakeholders and organizations present differed (See Figure 3 for participant composition per workshop).
The Bolivia workshop brought together a diversity of participants from Bolivia, Brazil, Colombia, Peru and included researchers, academics, urban and rural community leaders, and indigenous, NGOs and government representatives. Since it was jointly organized by the Amazon University of Pando (UAP), academic participants outnumbered participants from other groups. Here the overarching objective was the promotion of a dialogue between different social actors regarding the development of hydropower in the Amazon, with a focus on research and impact analysis. Crucial was the connections/networks of rural, urban and indigenous leaders with academia and NGOs.
The Peru workshop had most participants stemming from the regional government of Loreto in contrast to other workshops, such as Bolivia where governmental officials were absent. In Peru, NGOs were also well represented. Here, a major objective was to better understand the role of infrastructure projects within the vision of territorial planning in Loreto, a domain mainly executed by the government sector. Furthermore, NGOs have long been important players in the environmental and conservation arena in Loreto.
The Brazil workshop was jointly organized and facilitated by IEB (International Institute for Education in Brazil), in partnership with WWF-Brazil and IDESAM (Institute of Conservation and Sustainable Development of the Amazon), and a total of 35–40 stakeholders from various institutions (universities, NGOs, grassroots and indigenous organizations and government) attended the event. The focus was to reflect, exchange experiences and lessons learned about the strategies and tools related to protected areas (PAs) governance and regional infrastructure development and explore research projects to strengthen governance processes and regional socio-environmental development.
The organization of the Colombian workshop was led by Foundation for Conservation and Sustainable Development (FCDS) and linked five NGOs with active programs in the Colombian Amazon (Amazon Conservation Team, Fundación GAIA Amazonas, World Wild Fund (WWF), FCDS and Action Fund), as well as officials of the Ministry of Environment and Sustainable Development and the Ministry of Transport. A major objective was to generate agreements with territorial entities for the implementation of green road infrastructure guidelines, through a capacity building process led by the Ministry of Environment and Sustainable Development and the Ministry of Transportation.
The short summary of the participants profile from each mosaic hints that heterogeneity likely influences the results of the exercise. We acknowledge the biases of participants’ profiles and assume that implemented workshop tools were still able to capture the different perspectives at the time of the workshop. Furthermore, the primary role of UF GIA participants in the workshop was facilitation and promoting dialogue, while other participants contributed data information in the Pmap exercise.
Pmap was one of the key tools implemented in the workshops, as a mechanism to promote knowledge sharing and provide an overview of the temporal and spatial understanding of the study mosaics according to the participants. Specifically, Pmap was designed to enable participants to highlight areas of value and concern and suggest actions that could address their perceived concerns. The methodology used here is justified by the approach of place value and the simple and intuitive meaning of place perception within diverse population groups [69]. The mapping of place values often entails the inclusion of other spatial attributes or land use preferences such as resource extraction activities which determine important land use outcomes that might turn into concern issues for a specific stakeholder group.
In each mosaic, participants were divided into four to six groups of four to seven people; each group contained a mix of different stakeholders (Figure 4). Groups had one facilitator to explain and guide the activity, but who did not participate in the Pmap exercise. Each Pmap activity lasted around two hours and was divided in two main steps: (1) mapping of two smaller maps (i.e., maps A and B) and (2) a larger one. All the maps showed the same information, such as country borders, main rivers, protected areas and indigenous lands, roads and main cities. All groups were introduced to geospatial vocabulary, such as polygons, lines and features associated with individual drawings. Furthermore, all participants had an ice-breaker exercise to learn how to read and interpret maps pointing out features on the map as needed.
In map A, each participant drew at most three areas of value and explained why they were of value for them. The same process was repeated in map B for the areas of concern, plus they suggested some recommendations or actions to address those concerns. Participants used points, lines and mostly polygons to draw areas of concern or value, which might include communities, roads, rivers, protected areas, indigenous lands and other areas; each drawn object was identified with a unique number. The facilitators summarized in a flipchart the explanations associated with each drawing. At the end, the group discussed and elected one area of value, one area of concern and one recommendation from all the drawings to be then shared in the larger map in a plenary session with all groups to promote a group discussion.
Every Pmap exercise had a debrief with GIA facilitators to discuss the main challenges and opportunities of performing Pmap within and among mosaics (Figure 4). As the larger maps were just an extract of the smaller maps to share with the plenary, this paper only uses the results of the small participatory mapping exercise.
There were some differences in this process for Pmap exercises in two mosaics. In Bolivia, the first workshop, no areas of value were drawn, but this part was completed later by the key partner institution representatives. After the Bolivia Pmap exercise, an adapted improved methodology was used for the exercises in other mosaics. In Colombia, instead of making recommendations for the areas of concern, the participants listed general recommendations to address the pressures identified by the mapping exercise.

2.4. Textual and Geospatial Analysis of Pmap Responses
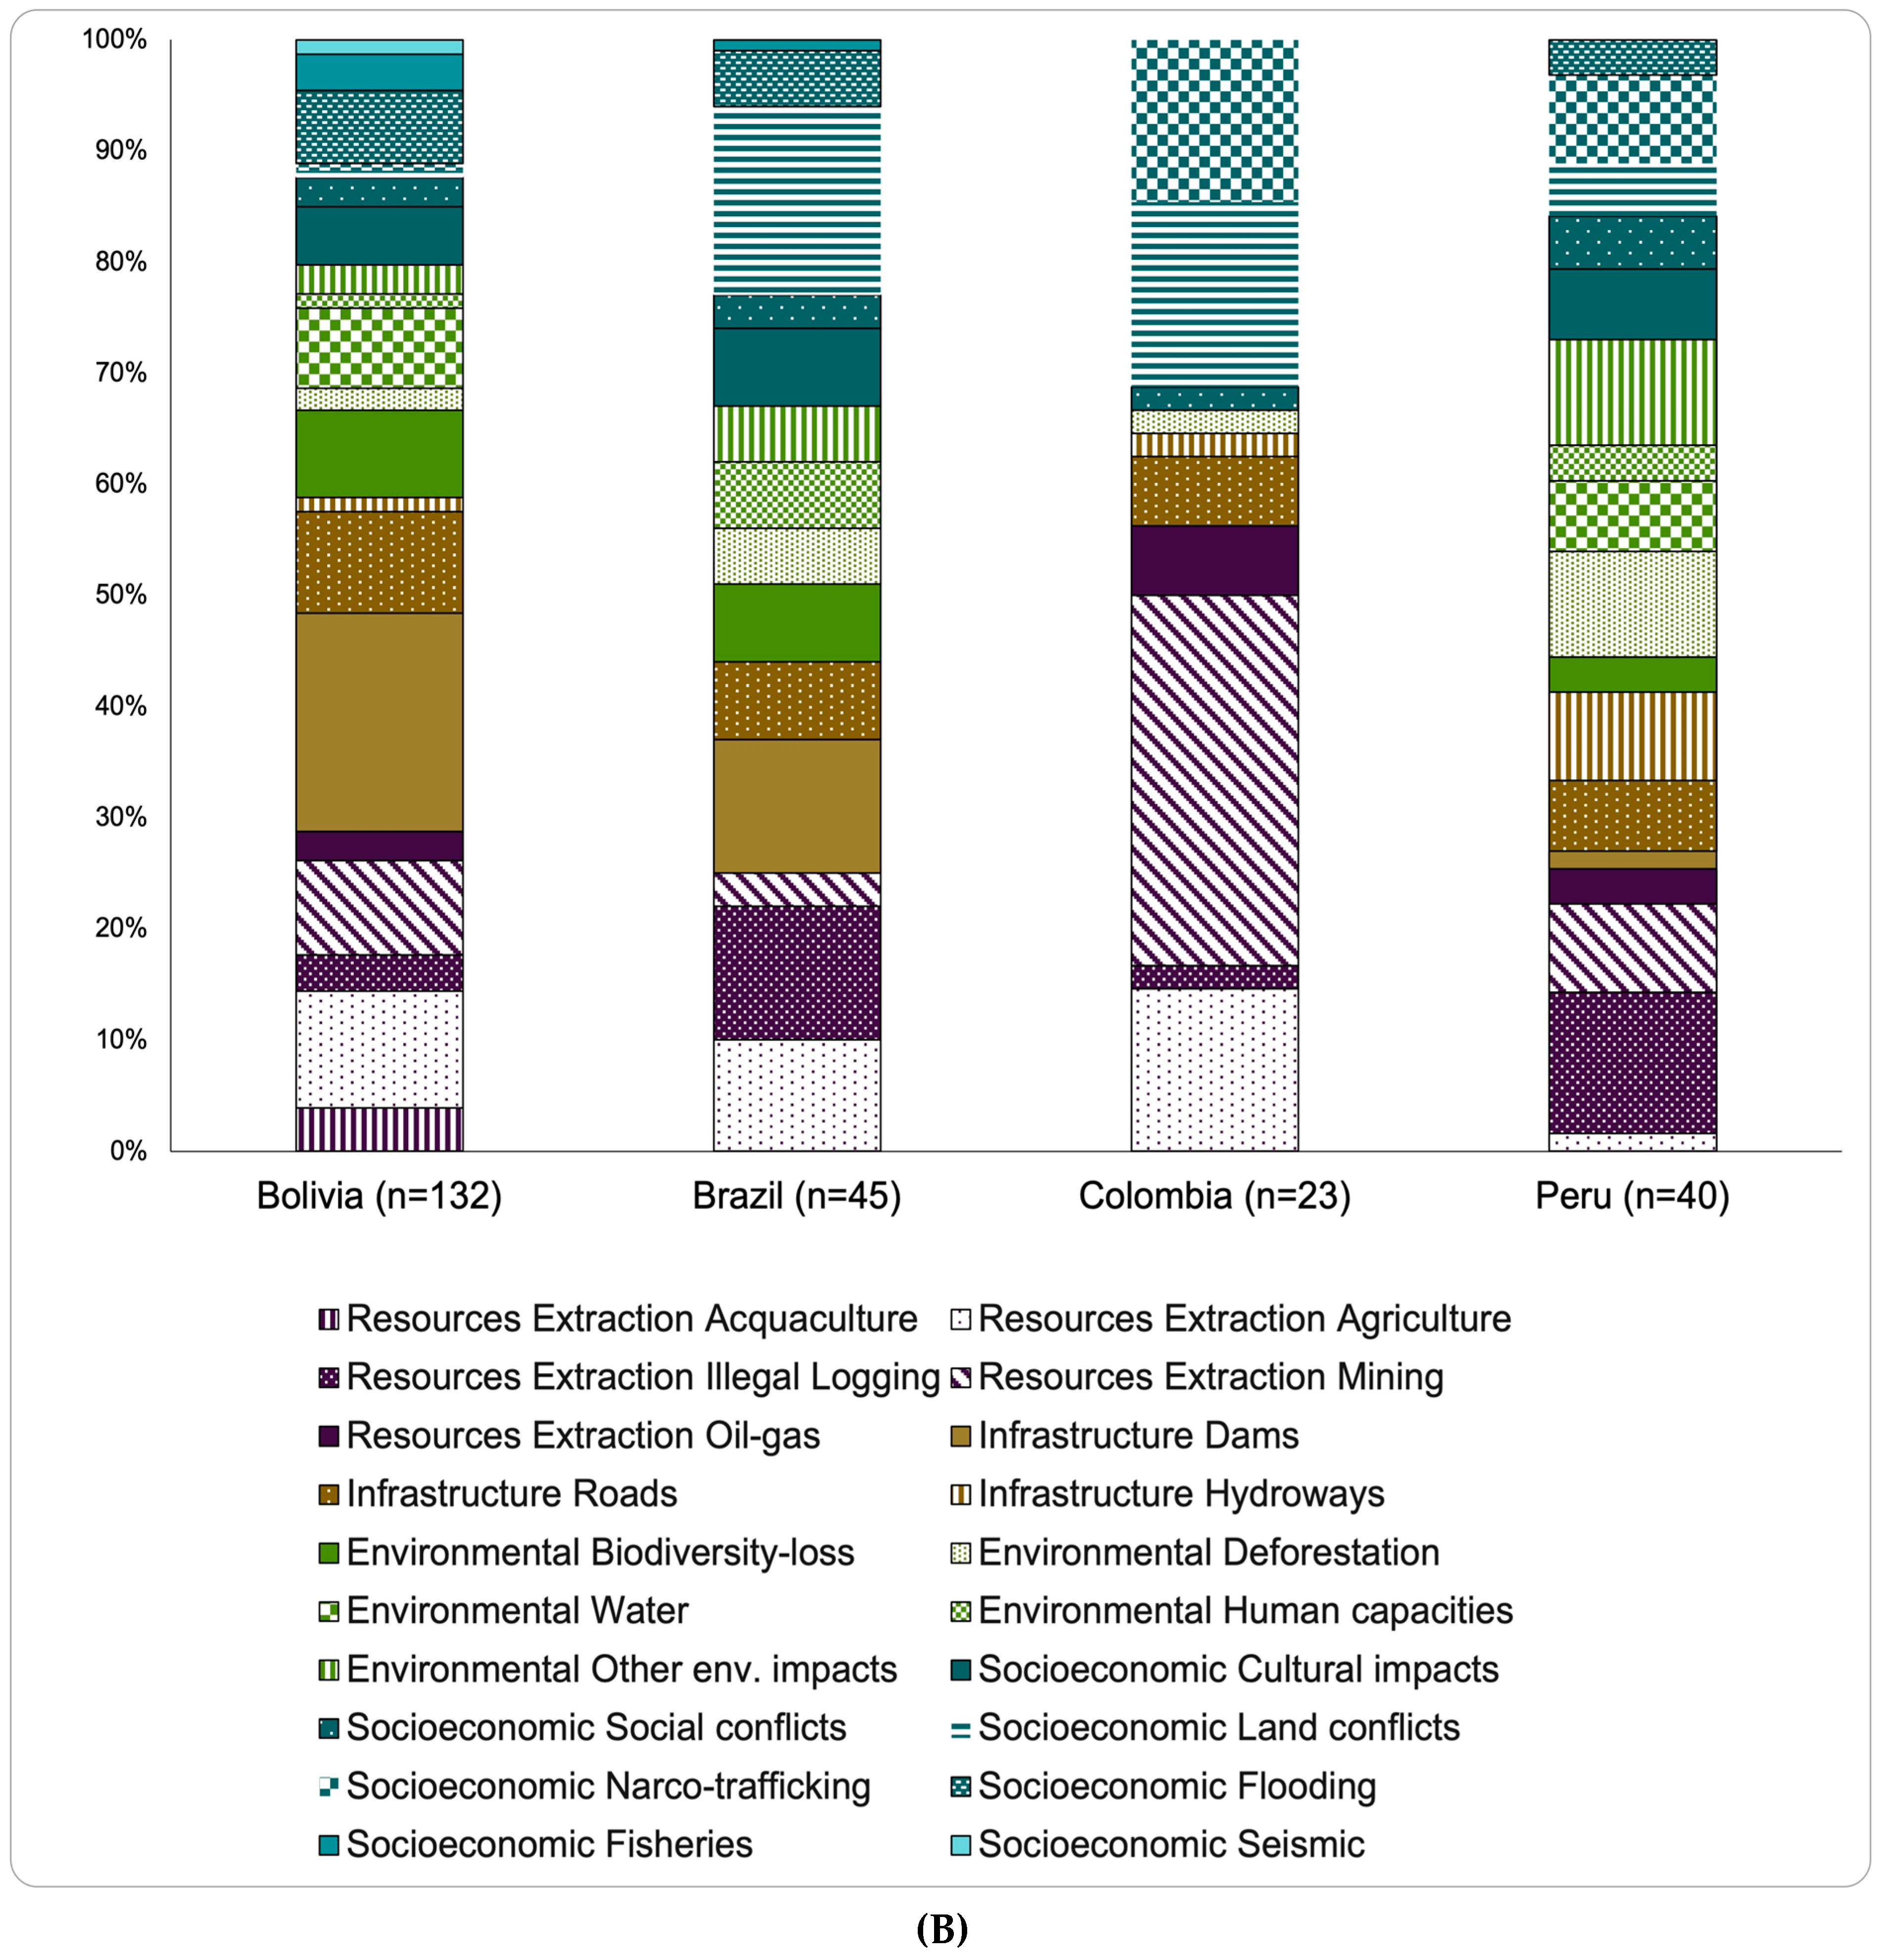
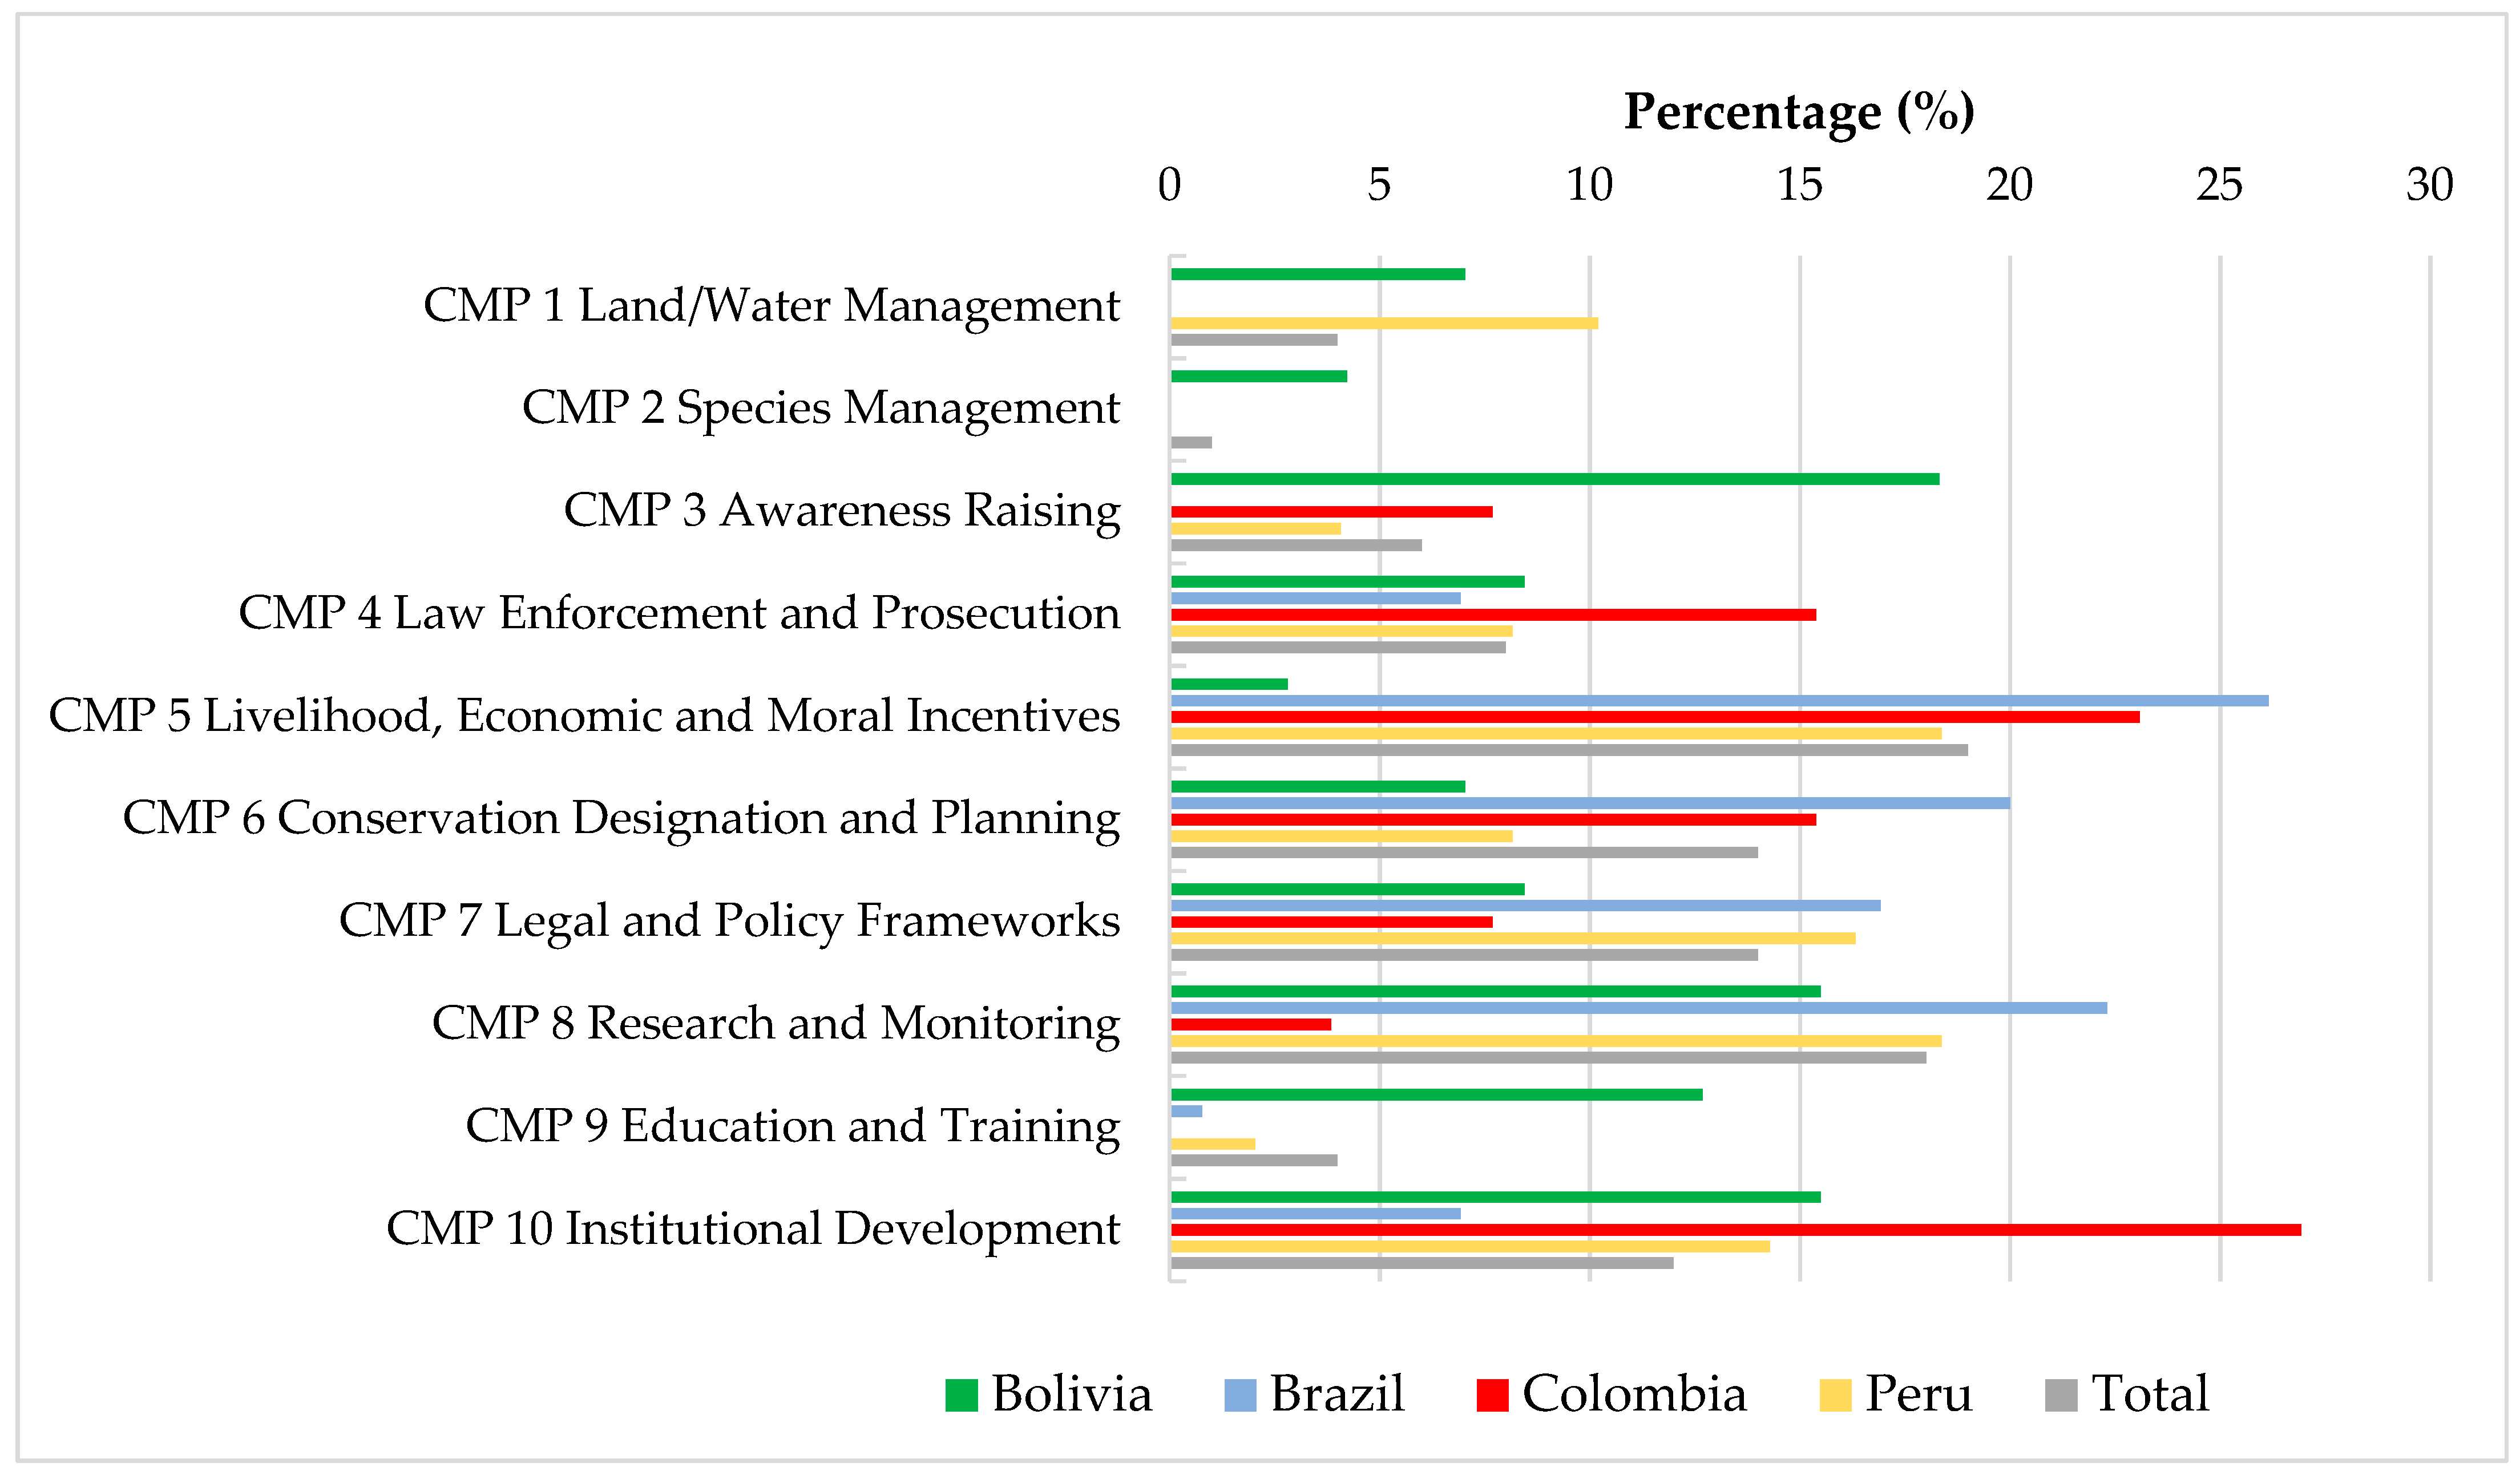
We organized all information collected from the Pmap in tables, grouping the responses associated with each object drawn into categories to describe the areas of values, concerns and recommendations. Nine categories resulted based on political and biophysical elements cited by the participants (Table S2). In addition, we captured the reasons why areas were of value or of concern in the results table. Categories and subcategories were then assigned keywords after a consensus among co-authors was reached. Two categories (Environmental and Social) and ten subcategories were defined to explain areas identified as of value and four categories (Resource Extraction, Infrastructure, Environmental and Socio-economic) and twenty sub-categories for the areas of concern (Supplementary Table S3). Summaries for all sub-categories are presented per mosaic.
The recommended actions provided for the areas of concern were categorized following the IUCN–CMP Unified Classification of Conservation Actions Needed (Version 2.0; Supplementary Table S4). The IUCN–CMP classification represents sets of actions that are proposed to reach a project’s objective to help conservation practitioners to identify the actions needed at their site and facilitate cross-project learning and development of conservation science [70]. All recommendations were linked to the areas of concern, after which we counted the frequency of categories and subcategories of concern linked with the recommendations.
All areas of concern and value drawn by workshop participants were digitized in ArcGIS geospatial software, transformed to point, line or polygon features and coded with a unique ID. For each point and line, buffers were created followed by a shared discussion among co-authors and converted to polygons. For instance, if a point drawn represented a community, we created a buffer of 5 km. If a line drawn represented a road, we created a buffer of 10 km on each side of the road. We linked all textual data of categories and subcategories of areas of value, concern and recommendations to the drawing’s unique spatial feature ID. The spatial features were then clipped by the focal mosaics’ boundaries.
All spatial features were combined with the layers of Protected Areas (PA) and Indigenous Territories (IT) found on Amazon Georeferenced Socio-environmental Information Network-RAISG (https://www.amazoniasocioambiental.org/en, accessed on 14 September 2021). The number and area of value and concern polygons identified by workshop participants were summarized by PA and IT. We also summarized the tabular data to better understand how various categories and subcategories associated with areas of concern and value were represented within PA and TI both within and across the four focal mosaics.

3. Results

Textual Results

The areas of value identified among mosaics encompass mostly protected areas (Figure S1A). In Brazil, the areas of value covered mainly protected areas (38%) and administrative boundaries (29%), while areas of value in Colombia included mostly biological corridors (39%) and protected areas (31%); protected areas (61%) were the most commonly identified areas of value for participants in Peru and Bolivia. In Colombia, the most cited areas of value encompassed larger landscapes connecting Chiribiquete National Park with other protected areas (e.g., Chiribiquete–Macarena Corridor) and other landscapes such as the Amazon Piedmont. In Peru, the areas of value included Pacaya Samiria National Reserve, Tamshiyacu Tahuayo Mosaical Conservation Area, Abanico del Pastaza and RAMSAR sites, wetlands of international importance.
Regarding why such areas were mentioned, overall, environmental explanations delineated 33% of the “why” an area was considered to be of value, mostly due to their biodiversity value (Figure 5A). In Colombia these values represent 80% of all mentions, followed by Peru (40%), Bolivia (32%) and Brazil (18%). Social values totaled 67%, showing greatest importance in Brazil (82%), followed by Bolivia (68%) and Peru (60%), among which cultural/spiritual values and community forest livelihoods (timber and non-timber, agroforestry) were the most cited.
The areas of concern varied among mosaics, from mainly protected areas, infrastructure projects (i.e., roads and dams) to administrative boundaries (Supplementary Figure S1B). In Bolivia, the most important areas of concern encompassed rivers/watersheds (27%), administrative boundaries (21%) and dams (21%). The dams and rivers of most concern to the participants were Cachuela-Esperanza, Santo Antonio, Jirau and Ribeirao dams, and the Madera watershed and Madre de Dios River. In Brazil, areas of concern were mostly represented by protected areas (29%), administrative boundaries (22%) and roads (18%). The protected area of most concern was Bom Futuro National Forest, along with the protected area clusters of Boca do Acre, BR-230 and BR-319 highways. In Colombia, the areas of concern encompassed larger landscapes (41%), similar to areas of value that contained protected areas, forest corridors and piedmont. In Peru, administrative boundaries (28%), protected areas (21%) and roads (19%) were the majority of areas of concern. Roads, such as Iquitos-Saramiriza highway and protected areas such as Alto Nanay Pintuyacu Chambira Regional Conservation Area were the most frequently identified by participants.
For why the areas of concern were mentioned, the category of major concern was resource extraction (31%), among which mining and agricultural activities were the most cited (Figure 5B). Mining was especially noted in Colombia (33%). The second category associated with concerns was socioeconomic (27%), especially in Brazil (33%) and Colombia (33%). The socioeconomic subcategories most mentioned included land conflicts (39%) and cultural impacts (19%). In Brazil, land conflicts represented 52% of all socioeconomic concerns. Environmental concern was the least important category mentioned overall and accounted for only 2% of concerns in Colombia; however, in Peru, environmental reasons were the most commonly cited explanation for areas of concern (32%). The infrastructure category was of most concern for Bolivia (30%), specifically the subcategory of dams (Figure 5B).
In 20 polygons, infrastructure and socioeconomic concerns appeared together, whereas socioeconomic and socioenvironmental concerns were mentioned together in 19 polygons. For the 43 polygons mentioning dams as a concern, 19 of them also mentioned other concerns, mostly socioeconomic (67%), including flooding impacts in Bolivia and/or Brazil. For the 28 polygons mentioning roads as a concern, 24 other concerns also were mentioned, especially concerns related to agricultural and cultural impacts that together represented 40% of all concerns mentioned.
Table 2 summarizes the identified number and area of Protected Areas and Indigenous Territories as “areas of value” or “areas of concern” in participatory mapping exercise in each mosaic. For example, 8 polygons (16% of total polygons) were identified as areas of value within the Protected Areas in Bolivia; these 8 polygons accounted for 11,000 km2 or 10% of the total land area within Protected Areas. As another example, 150 polygons in Colombia were identified as areas of concern within indigenous territories making up 58% of the Indigenous Territories area.
Most of the values identified by participants in Colombia were related to the environment in both ITs (85%) and PAs (70%), while in Brazil, values identified were mostly social for both ITs (76%) and PAs (84%) (Figure 6). In Peru and Bolivia, participants identified both social and environmental values more evenly in ITs and PAs. Regarding concerns in PAs and ITs, the distribution of categories within a mosaic closely matched between PAs and ITs, as it did for values. Resource extraction was frequently the most mentioned concern across mosaics, while concerns regarding infrastructure were considerably less important, except in Brazil where it accounted for 24% of concern in PAs; infrastructure was not mentioned at all in Colombia. Environmental concerns were more prevalent in PAs and ITs of Bolivia and Peru, while socio-economic concerns emerged as important in Colombia with little or no environmental concerns identified (Figure 6).
Recommended actions varied across mosaics with 100% of areas including recommendations in Brazil, 65% in Peru and 40% in Bolivia. For the 132 drawings with recommendations, a total of 250 recommendations were mentioned, of which 49% of the drawn areas had one, 27% two, 10% three and 14% four recommendations. Most recommended actions mentioned by participants included Research and Monitoring (CMP 8) and Livelihood, Economic and Moral Incentives (CMP 5) (Figure 7). The most common recommendations linked to CMP 8 included: research on the impacts of development projects (i.e., roads, dams, mining) on the environment before the projects are implemented, more rigorous environmental impact assessments and ecological and social research within protected areas and indigenous territories. The CMP 5 recommendations encompass strengthening Amazonian communities and local organizations, promoting investment and supporting sustainable economic activities, productive (i.e., family-based agriculture) and cultural activities, and reappraisal of local culture and tourism.

4. Discussion

Overall, the Pmap results show that participants were concerned with many environmental and social aspects within the focal mosaics. Our findings also highlight the central roles that protected areas and indigenous territories play in terms of areas of value and concern in all mosaics. An apparent exception is for valuing Bolivian protected areas, in which less than a third of such areas were reported to have value by participants at the workshop (see Table 2). In contrast, concerns for these Bolivian areas were among the highest.
Brazil had the least environmental values listed, perhaps because there are many social and socio-economic issues at stake with increasing investments in infrastructure [71] and decreasing human and land tenure rights for traditional and indigenous populations in the current administration [58,59,60,61,62,63,64,65,66,67,68,69,70,71,72]. The weakening of environmental regulations seemed to motivate participants to reinforce the social values and concerns related to agricultural, hydroelectric dam and road expansion, as well as issues related to flooding, cultural impacts and land conflicts.
In Colombia, however, participants highlighted the importance of environmental values (80% vs. 20% socio-economic), but virtually no environmental concerns were mentioned. This result might be explained by the fact that many participants worked in and recognized the “green infrastructure” which establishes environmental corridors and protected areas [73]. Since the post-conflict transition, Colombia has followed approaches for advancing infrastructure projects and encouraging economic expansion in the Amazon while also considering environmental conservation and protection of indigenous territories [74]. Colombian concerns were mostly related to natural resource extraction (mainly mining) and road and agricultural expansion; these concerns do impact environmental values and reflect the current situation of Colombian Amazon with intact forests being targeted for resource extraction [75]. Among social concerns pressing governance attention are continued and renewed land conflicts and narco-trafficking [76] as cited by participants at the workshop.
The concerns raised in Bolivia focused on infrastructure (mainly hydroelectric dams), which reflect the current situation regarding the planned bi-national dam located on the Brazil–Bolivia border, as well as recent impacts on riverine livelihoods related to floods of two dams operating on the Brazilian side. Many workshop participants are professionally engaged or live in the northern Bolivian Amazon (where operational and planned dams are located). That said, Bolivian concerns derive from issues beyond its borders highlighting the relevant cross-boundary perspective and understanding on common impacts.
In the case of Peru, value and concern categories were evenly distributed among environmental and social categories. This could be due to the diversity of stakeholders participating in the Pmap exercise (i.e., eight major stakeholder groups), each of them providing their own perspective on the topics addressed. However, this could also reflect the understanding of how environmental and social subcategories are closely intertwined. For instance, a community representative of the Pucacuro National Reserve identified that the value of this protected area relied on the conservation of wildlife and fish in order to sustainably manage these resources and support their community. At the same time, resource extraction concerns characterized by illegal logging and mining are extensively emphasized. NGOs tend to draw their attention toward deforestation and land conflicts, which were also mentioned.
Overall, the results of the Pmap exercise reveal a cross-comparison of current concerns within protected areas and indigenous territories as well as the need to account for their values. The results capture the current socio-economic and environmental approaches enforced by current political mandates in different Amazonian countries as well as the loud voices of grassroot and environmental defenders to protect land rights and territories and resource use and access.
In this sense, we acknowledge the effectiveness of Pmap as a tool for improving environmental governance, nonetheless with some caveats or limitations. Collection of qualitative and quantitative spatial data in participatory mapping exercises provides valuable information from local stakeholders in a short period of time and engages participants in an open space to reflect and get feedback from others. While other data collection tools like surveys or questionnaires also can provide key insights to researchers, these interviews are more time consuming and do not necessarily provide opportunities for discussion among participants. Despite the time advantages, the use of Pmap needs to consider the following conditions that may limit interpretation. In our Pmap exercise, the workshop organizers controlled the composition of participants. A recommendation would be to conduct prior analysis of the profile, interest and experience of each workshop participant to permit evaluation on representativeness and how the interest of the (individual) workshop participant might influence the result. The data collected during workshops and interviews are an expression of participant’s experiences, perceptions-interest and biases, meaning that our data do not fully represent all social actors in the territory at stake nor fully all project actions and challenges. We were aware of this fact and agree that the results reflect entirely the views, perceptions and interests of the (individual) participants. Although these biased caveats occur in all mosaics, results do still reflect realities of ground-based local actors. A solution is to identify subregions of interest and to replicate the exercise in these areas if funds and time allow and without compromising the quality of the process.
Having said this, we found that the Pmap exercise did further facilitate discussions among stakeholders that are often not well represented (e.g., indigenous communities) and such participants were able to record their concerns, interact and learn from other participants and provide new insights for their own or shared agendas. Studies have shown that group mapping not only allows participants to raise their concerns but also can contribute to strengthening community connectedness [77]. This is particularly relevant for a CoP-L that aims to build high levels of trust among its members. The Pmap discussion in Colombia provided important feedback to continuous development of shared agendas. For example, the areas of high concern and value (expressed by indigenous leaders) were selected for consideration of the implementation of the green road infrastructure (IVV, for Spanish, ‘Infraestructura Vial Verde’) that involved the participation of various and diverse CoP-L members (government and NGOs).
Spatial tools and developing maps in a fully participatory process is itself empowering, builds capacity, facilitates local involvement in decision-making processes and community advocacy [43,78]. The latter is accomplished by providing the skills and expertise required to create maps themselves and visualize local spatial knowledge on maps [79]. A limitation was the reduced amount of time for this skill-building activity within the GIA workshops. Nonetheless, it is valuable to highlight these capacity-building opportunities whenever using spatial tools with local or underrepresented communities. Furthermore, confronting perceptions (value and concerns) with technical information is an interesting challenge and this exercise offers the potential to provide feedback to both perceptions and knowledge. Overall, improved inclusive strategies should entail more in-depth capacity building and dialogue activities. Our Pmap exercise did not include an extended space for discussion nor a validation of results due to time constraints. Our Pmap activities could be improved by including not only participation in the workshop, but also participation in interpretation of results. We see this type of post Pmap activity as a crucial future improvement component for learning and discussion of local perspectives.
The project did however create an applied ArcGIS online interactive map platform that integrates geographic features of value and concern layers digitized from each participant’s intervention (https://giamazon.org/analysis/ accessible to view and download, accessed on 14 September 2021) The online platform could give continuity to a more profound discussion within each mosaic on the relative importance given to different concerns or the superposition of values and accumulation (cumulative impact) of concerns, a task this Pmap exercise was not able to provide.
Spatial participatory tools claim to foster accountability and other governance dimensions such as legitimacy, participation, respect for rights, empowerment, equity and competence [78]. We believe that by sharing local-knowledge-driven data and strengthening multi-actor dialogue and collaboration, this novel approach can improve day to day practices of CoP-L members, reduce the ambiguity and subjectivity of interpreting place values, and ultimately improve the transparency of infrastructure planning and good governance. In our exercise, the type of data collected has the potential to focus on the synergistic and cumulative impacts of infrastructure. For example, further discussions could lead to identifying knowledge gaps and opportunities among stakeholders. In Brazil, different NGOs and other partners (e.g., universities) working in the mosaic could develop a platform for outreach and information purposes, such as the Amazon Geo-Referenced Socio-Environmental Information Network (known as RAISG, from its Portuguese initials) or the BR-319 observatory (http://www.observatoriobr319.org.br/, accessed on 14 September 2021) but focusing on the mosaic as a whole or areas of action for each NGO. Therefore, more in-depth analysis and regional perspectives of the challenges affecting the Amazon region related to governance and infrastructure are needed. The first step has been the Pmap exercise.

5. Conclusions

We believe that the structure of the workshops enabled a trustworthy environment among participants to assess and share the value of locations that were collectively important. Despite the participants’ bias effect, we feel the use of Pmap not only allowed for more accessible spatial representation of local areas of value and concern but enabled a comparison of perceptions among four mosaics. The differences in perceptions among mosaics might be used as input for the development of more efficient internationally coordinated and internationally articulated infrastructure governance efforts. The Pmap was not the end of the consolidation process in this specific case study but the beginning for expressing and advancing an agenda fortifying environmental governance. This novel approach can improve day to day practices of CoP-L members and, therefore, the transparency of infrastructure planning and good governance.

Supplementary Materials

The following are available online at https://www.mdpi.com/article/10.3390/su132414048/s1, Figure S1: Percentages per category of areas of value (A) and concern (B) per mosaic., Table S1: List of stakeholder participants per mosaic, including government, indigenous or community representatives, non-profit organizations (NGO) and academia. The number of participants per institution are shown in parenthesis, Table S2: Categories of the Areas of Value and Concern, Table S3: Categories and subcategories of participants’ “explanations” of why the areas selected are of value and concern., Table S4: CMP Conservation Actions Classification v.2.0 (Conservation Measures Partnership, 2016).

Author Contributions

Conceptualization, C.M.-R., G.C.C., A.B.C., A.M.A.Z., B.L. and E.N.B.; methodology, C.M.-R., G.C.C., A.B.C., A.M.A.Z., B.L., E.S.B. and E.N.B.; software, G.C.C., E.S.B. and E.N.B., validation, C.M.-R., G.C.C., A.B.C., A.M.A.Z., B.L., F.V.G., V.L.-C., M.A., A.S.T., P.A.V.D., D.E.L.Z. and E.N.B.; formal analysis, G.C.C., A.B.C., A.M.A.Z. and E.N.B.; investigation, C.M.-R., G.C.C., A.B.C., A.M.A.Z., B.L., F.V.G., V.L.-C., M.A., A.S.T., P.A.V.D., D.E.L.Z. and E.N.B.; resources, A.B.C., A.M.A.Z., B.L. and E.N.B.; data curation, C.M.-R., G.C.C., A.B.C. and E.N.B.; writing—original draft preparation, C.M.-R., G.C.C., A.B.C., A.M.A.Z., B.L. and E.N.B.; writing—review and editing, C.M.-R., G.C.C., A.B.C., A.M.A.Z., B.L., F.V.G., V.L.-C., M.A., A.S.T., P.A.V.D., D.E.L.Z. and E.N.B.; visualization, C.M.-R., G.C.C., A.B.C., E.S.B. and E.N.B.; supervision, A.B.C. and E.N.B.; project administration, E.N.B.; funding acquisition, A.M.A.Z., B.L. and E.N.B. All authors have read and agreed to the published version of the manuscript.

Funding

This research was funded by the GORDON AND BETTY MOORE FOUNDATION, grant number 7715 implemented by the “Governance and Infrastructure in the Amazon (GIA)” project under the number P0101525, and led by University of Florida’s Tropical Conservation and Development Program (TCD) in the Center for Latin American Studies.

Institutional Review Board Statement

Not applicable.

Informed Consent Statement

Not applicable.

Data Availability Statement

Data supporting reported results can be found under https://giamazon.org/analysis/ (accessed on 14 September 2021), including the ArcGIS online interactive map platform that integrates all data obtained during the map exercises. The maps include each geographic feature (represented by polygon shape files) drawn by each participant carefully digitized in the concern and value layers. Results of the participatory map exercise are distinguished by macro-regions (mosaics).

Acknowledgments

We dedicate this paper in gratitude to the life and legacy of our dear friend, esteemed colleague and passionate conservationist, Dennis Edgar Lizarro Zapata. We sincerely thank all the participants in each mosaic, including all the government, non-profit organizations, academia and indigenous or community representatives, for providing valuable contribution to this research. We would like to thank each mosaic coordinator Leddy Cecilia Sanjinez (Bolivia), Ney Maciel (Brazil), Maryi Adriana Serrano (Colombia) and Frida Sanchez (Peru) for helping in the logistics and organization of the workshops. We thank the faculty, students, and participants of the GIA project for their support in different ways throughout the process. Finally, we thank the Gordon and Betty Moore Foundation for their support and funding and the University of Florida for authorizing this research.

Conflicts of Interest

The authors declare no conflict of interest. The funders had no role in the design of the study; in the collection, analyses, or interpretation of data; in the writing of the manuscript, or in the decision to publish the results.

References

  1. Malhi, Y.; Roberts, J.T.; Betts, R.A.; Killeen, T.J.; Li, W.; Nobre, C.A. Climate change, deforestation, and the fate of the Amazon. Science 2008, 319, 169–172. [Google Scholar] [CrossRef] [Green Version]
  2. RAISG. Amazonia 2019 Protected Areas and Indigenous Territories; Amazonian Georeferenced Socio-Environmental Information Network. 2019. Available online: http://www.amazoniasocioambiental.org/ (accessed on 1 December 2021).
  3. Charity, S.; Dudley, N.; Oliveira, D.; Stolton, S. (Eds.) Living Amazon. Report 2016: A Mosaical Approach to Conservation in the Amazon; WWF Living Amazon Initiative: Brasília, Brazil; Quito, Ecuador, 2016. [Google Scholar]
  4. Martinez-Alier, J. The environmentalism of the poor. Geoforum 2014, 54, 239–241. [Google Scholar] [CrossRef]
  5. Finer, M.; Jenkins, C.N.; Pimm, S.L.; Keane, B.; Ross, C. Oil and Gas Projects in the Western Amazon: Threats to Wilderness, Biodiversity, and Indigenous Peoples. PLoS ONE 2008, 3, e2932. [Google Scholar] [CrossRef]
  6. Fearnside, P.M. Amazon dams and waterways: Brazil’s Tapajós Basin plans. Ambio 2015, 44, 426–439. [Google Scholar] [CrossRef] [PubMed] [Green Version]
  7. Tucker Lima, J.M.; Valle, D.; Moretto, E.M.; Pulice, S.M.P.; Zuca, N.L.; Roquetti, D.R.; Beduschi, L.E.C.; Praia, A.S.; Okamoto, C.P.F.; da Silva Carvalhaes, V.L.; et al. A social-ecological database to advance research on infrastructure development impacts in the Brazilian Amazon. Sci. Data 2016, 3, 160071. [Google Scholar] [CrossRef] [Green Version]
  8. Larkin, B. The Politics and Poetics of Infrastructure. Annu. Rev. Anthropol. 2013, 42, 327–343. [Google Scholar] [CrossRef] [Green Version]
  9. Harvey, P.; Knox, H. Roads: An Anthropology of Infrastructure and Expertise; Cornell University Press: Ithaca, NY, USA, 2015. [Google Scholar]
  10. Benítez-López, A.; Alkemade, R.; Verweij, P.A. The impacts of roads and other infrastructure on mammal and bird populations: A meta-analysis. Biol. Conserv. 2010, 143, 1307–1316. [Google Scholar] [CrossRef] [Green Version]
  11. Barber, C.P.; Cochrane, M.A.; Souza, C.M.; Laurance, W.F. Roads, deforestation, and the mitigating effect of protected areas in the Amazon. Biol. Conserv. 2014, 177, 203–209. [Google Scholar] [CrossRef]
  12. Kanai, M.J. The pervasiveness of neoliberal territorial design: Cross-border infrastructure planning in South America since the introduction of IIRSA. Geoforum 2016, 69, 160–170. [Google Scholar] [CrossRef]
  13. Laurance, W.F.; Arrea, I.B. Roads to riches or ruin? Science 2017, 358, 442–444. [Google Scholar] [CrossRef]
  14. Bebbington, A.J.; Humphreys Bebbington, D.; Sauls, L.A.; Rogan, J.; Agrawal, S.; Gamboa, C.; Imhof, A.; Johnson, K.; Rosa, H.; Royo, A.; et al. Resource extraction and infrastructure threaten forest cover and community rights. Proc. Natl. Acad. Sci. USA 2018, 115, 13164. [Google Scholar] [CrossRef] [PubMed] [Green Version]
  15. Stickler, C.M.; Coe, M.T.; Costa, M.H.; Nepstad, D.C.; McGrath, D.G.; Dias, L.C.P.; Rodrigues, H.O.; Soares-Filho, B.S. Dependence of hydropower energy generation on forests in the Amazon Basin at local and regional scales. Proc. Natl. Acad. Sci. USA 2013, 110, 9601. [Google Scholar] [CrossRef] [PubMed] [Green Version]
  16. Perrault, T. Energy, extractivism and hydrocarbon geographies in contemporary Latin America. J. Lat. Am. Geogr. 2018, 17, 235–252. [Google Scholar] [CrossRef]
  17. Coe, M.T.; Marthews, T.R.; Costa, M.H.; Galbraith, D.R.; Greenglass, N.L.; Imbuzeiro, H.M.A.; Levine, N.M.; Malhi, Y.; Moorcroft, P.R.; Muza, M.N.; et al. Deforestation and climate feedbacks threaten the ecological integrity of south–southeastern Amazonia. Philos. Trans. R. Soc. B Biol. Sci. 2013, 368, 20120155. [Google Scholar] [CrossRef] [PubMed] [Green Version]
  18. Latrubesse, E.M.; Arima, E.Y.; Dunne, T.; Park, E.; Baker, V.R.; d’Horta, F.M.; Wight, C.; Wittmann, F.; Zuanon, J.; Baker, P.A.; et al. Damming the rivers of the Amazon basin. Nature 2017, 546, 363–369. [Google Scholar] [CrossRef]
  19. Bravo Orellana, S. CarreteraInteroceánica Sur del Perú; Corporación Andina de Fomento: Bogota, Colombia, 2013. [Google Scholar]
  20. Swenson, J.J.; Carter, C.E.; Domec, J.-C.; Delgado, C.I. Gold Mining in the Peruvian Amazon: Global Prices, Deforestation, and Mercury Imports. PLoS ONE 2011, 6, e18875. [Google Scholar] [CrossRef] [Green Version]
  21. Achtenberg, E. Contested Development: The Geopolitics of Bolivia’s TIPNIS Conflict; The North American Congress on Latin America (NACLA): New York, NY, USA, 2013; pp. 6–11. [Google Scholar]
  22. Fraser, B. Deforestation: Carving up the Amazon. Nature 2014, 509, 418–419. [Google Scholar] [CrossRef] [Green Version]
  23. Bebbington, D.H.; Verdum, R.; Gamboa, C.; Bebbington, A.J. The Infrastructure-Extractives-Resource Governance Complex in the Pan-Amazon. Eur. Rev. Lat. Am. Caribb. Stud./Rev. Eur. De Estud. Latinoam. Y Del Caribe 2018, 106, 183–208. [Google Scholar] [CrossRef]
  24. Uribe, S. Illegible infrastructures: Road building and the making of state-spaces in the Colombian Amazon. Environ. Plan. D Soc. Space 2018, 37, 886–904. [Google Scholar] [CrossRef]
  25. Fabricant, N.; Postero, N. Performing Indigeneity in Bolivia: The Struggle Over the TIPNIS. In Indigenous Life Projects and Extractivism: Ethnographies from South America; Vindal Ødegaard, C., Rivera Andía, J.J., Eds.; Springer International Publishing: Cham, Switzerland, 2019; pp. 245–276. [Google Scholar]
  26. Acosta, A.; Bigs, S.; Monasterio, F.; Viale, E. Una consulta Inconsulta: El caso del TIPNIS, Bolivia. Rev. Ecuad. Debate 2019, 106, 129–140. [Google Scholar]
  27. Mendoza, E.; Perz, S.; Schmink, M.; Nepstad, D. Participatory stakeholder workshops to mitigate impacts of road paving in the southwestern Amazon. Conserv. Soc. 2007, 5, 382–407. [Google Scholar]
  28. Vilela, T.; Malky Harb, A.; Bruner, A.; Laísa da Silva Arruda, V.; Ribeiro, V.; Auxiliadora Costa Alencar, A.; Julissa Escobedo Grandez, A.; Rojas, A.; Laina, A.; Botero, R. A better Amazon road network for people and the environment. Proc. Natl. Acad. Sci. USA 2020, 117, 7095. [Google Scholar] [CrossRef] [Green Version]
  29. De Souza, E.S.; Fernandes, A.R.; de Souza Braz, A.M.; Sabino, L.L.L.; Alleoni, L.R.F. Potentially toxic elements (PTEs) in soils from the surroundings of the Trans-Amazonian Highway, Brazil. Environ. Monit. Assess. 2014, 187, 4074. [Google Scholar] [CrossRef] [PubMed]
  30. Fearnside, P.M. Environmental and Social Impacts of Hydroelectric Dams in Brazilian Amazonia: Implications for the Aluminum Industry. World Dev. 2016, 77, 48–65. [Google Scholar] [CrossRef]
  31. Perz, S.; Brilhante, S.; Brown, F.; Caldas, M.; Ikeda, S.; Mendoza, E.; Overdevest, C.; Reis, V.; Reyes, J.F.; Rojas, D.; et al. Road building, land use and climate change: Prospects for environmental governance in the Amazon. Philos. Trans. R. Soc. Lond. B Biol. Sci. 2008, 363, 1889–1895. [Google Scholar] [CrossRef] [PubMed]
  32. Lemos, M.C.; Agrawal, A. Environmental Governance. Annu. Rev. Environ. Resour. 2006, 31, 297–325. [Google Scholar] [CrossRef]
  33. Batterbury, S.P.J.; Fernando, J.L. Rescaling governance and the impacts of political and environmental decentralization: An introduction. World Dev. 2005, 34, 1851–1863. [Google Scholar] [CrossRef]
  34. Pattberg, P.; Widerberg, O. Transnational multistakeholder partnerships for sustainable development: Conditions for success. Ambio 2016, 45, 42–51. [Google Scholar] [CrossRef] [Green Version]
  35. Reyes-García, V.; Fernández-Llamazares, Á.; Bauchet, J.; Godoy, R. Variety of indigenous peoples opinions of large infrastructure projects: The TIPNIS road in the Bolivian Amazon. World Dev. 2020, 127, 104751. [Google Scholar] [CrossRef]
  36. Perz, S.; Buschbacher, B.; Romero, C.; Almeyda Zambrano, A.; Chavez Michaelsen, A. Preliminary Assessment of the Effectiveness of Conservation Strategies to Address Infrastructure Governance in the Amazon. (Summary). 2020. Available online: https://giamazon.org/wp-content/uploads/2020/09/Tools-and-Strategies-Preliminary-Assessment.pdf (accessed on 1 December 2021).
  37. Wenger, E.C.; Snyder, W.M. Communities of Practice: The Organizational Frontier. Harv. Bus. Rev. 2000, 78, 139–145. [Google Scholar]
  38. Goldstein, B.E.; Butler, W.H. Expanding the Scope and Impact of Collaborative Planning. J. Am. Plan. Assoc. 2010, 76, 238–249. [Google Scholar] [CrossRef]
  39. Suškevičs, M.; Hahn, T.; Rodela, R.; Macura, B.; Pahl-Wostl, C. Learning for social-ecological change: A qualitative review of outcomes across empirical literature in natural resource management. J. Environ. Plan. Manag. 2018, 61, 1085–1112. [Google Scholar] [CrossRef] [Green Version]
  40. Wenger, E. A Social Theory of Learnin, 1st ed.; Illeris, K.E., Ed.; Routledge Taylor & Francis Group: New York, NY, USA, 2009. [Google Scholar]
  41. Cundill, G.; Rodela, R. A review of assertions about the processes and outcomes of social learning in natural resource management. J. Environ. Manag. 2012, 113, 7–14. [Google Scholar] [CrossRef] [PubMed]
  42. Chapin, M.; Lamb, Z.; Threlkeld, B. Mapping Indigenous Lands. Annu. Rev. Anthropol. 2005, 34, 619–638. [Google Scholar] [CrossRef] [Green Version]
  43. Gilmore, M.P.; Young, J.C. The Use of Participatory Mapping in Ethnobiological Research, Biocultural Conservation, and Community Empowerment: A Case Study From the Peruvian Amazon. J. Ethnobiol. 2012, 32, 6–29. [Google Scholar] [CrossRef] [Green Version]
  44. IFAD. Good Practices in Participatory Mapping. A Review Prepared for the International Fund for Agricultural Development; International Fund for Agricultural Development. 2009. Available online: https://www.ifad.org/documents/38714170/39144386/PM_web.pdf/7c1eda69-8205-4c31-8912-3c25d6f90055 (accessed on 1 December 2021).
  45. Craig, W.J.; Harris, T.M.; Weiner, D. Community Participation and Geographic Information Systems; Taylor and Francis: London, UK, 2002. [Google Scholar]
  46. Jankowski, P. Towards Participatory Geographic Information Systems for community-based environmental decision making. J. Environ. Manag. 2009, 90, 1966–1971. [Google Scholar] [CrossRef]
  47. Aditya, T. Usability Issues in Applying Participatory Mapping for Neighborhood Infrastructure Planning. Trans. GIS 2010, 14, 119–147. [Google Scholar] [CrossRef]
  48. Tamburini, L. Bolivia: Atlas Sociopolítico sobre los Territorios Indígenas de las Tierras Bajas; Iwgia: Santa Cruz de la Sierra, Bolivia, 2019; p. 367. [Google Scholar]
  49. Oller, C.M. Áreas Protegidas Municipales, Una Realidad en Bolivia; Prometa-Protección del Medio Ambiente: Tarija, Bolivia, 2009. [Google Scholar]
  50. Anderson, E.P.; Jenkins, C.N.; Heilpern, S.; Maldonado-Ocampo, J.A.; Carvajal-Vallejos, F.M.; Encalada, A.C.; Rivadeneira, J.F.; Hidalgo, M.; Cañas, C.M.; Ortega, H.; et al. Fragmentation of Andes-to-Amazon connectivity by hydropower dams. Sci. Adv. 2018, 4, eaao1642. [Google Scholar] [CrossRef] [Green Version]
  51. IBGE. Censos e Contagens Populacionais; Instituto Brasileiro de Geografia e Estadistica: Rio de Janeiro, Brazil, 2020. Available online: https://www.ibge.gov.br/ (accessed on 1 December 2021).
  52. FUNAI. Dados Terras Indígenas, Shape; Fundação Nacional do Indio: Brasília, Brazil, 2020. Available online: https://www.gov.br/funai/pt-br (accessed on 1 December 2021).
  53. Ministerio do Meio Ambiente (MMA). Cadastro Nacional de UCS, Dados Georreferenciados. Ministerio de Meio Ambiente. 2020. Available online: https://antigo.mma.gov.br/areas-protegidas/cadastro-nacional-de-ucs/dados-georreferenciados.html (accessed on 14 September 2021).
  54. Castro, R.B.; Albernaz, A.L. Consistency and use of information about threats in the participatory process for identification of priority conservation areas in the Brazilian Amazon. J. Nat. Conserv. 2016, 30, 44–51. [Google Scholar] [CrossRef]
  55. Brancalion Pedro, H.S.; de Almeida Danilo, R.A.; Vidal, E.; Molin Paulo, G.; Sontag Vanessa, E.; Souza Saulo, E.X.F.; Schulze Mark, D. Fake legal logging in the Brazilian Amazon. Sci. Adv. 2018, 4, eaat1192. [Google Scholar] [CrossRef] [PubMed] [Green Version]
  56. Berenguer, E.; Lennox, G.D.; Ferreira, J.; Malhi, Y.; Aragão, L.E.O.C.; Barreto, J.R.; Espírito-Santo, F.D.B.; Figueiredo, A.E.S.; França, F.; Gardner, T.A.; et al. Tracking the impacts of El Niño drought and fire in human-modified Amazonian forests. Proc. Natl. Acad. Sci. USA 2021, 118, e2019377118. [Google Scholar] [CrossRef] [PubMed]
  57. Azevedo-Ramos, C.; Moutinho, P.; Arruda, V.L.d.S.; Stabile, M.C.C.; Alencar, A.; Castro, I.; Ribeiro, J.P. Lawless land in no man’s land: The undesignated public forests in the Brazilian Amazon. Land Use Policy 2020, 99, 104863. [Google Scholar] [CrossRef]
  58. Ferrante, L.; Fearnside, P.M. Brazil’s new president and ‘ruralists’ threaten Amazoniaxs environment, traditional peoples and the global climate. Environ. Conserv. 2019, 46, 261–263. [Google Scholar] [CrossRef]
  59. Clerici, N.; Salazar, C.; Pardo-Diaz, C.; Jiggins, C.D.; Richardson, J.E.; Linares, M. Peace in Colombia is a critical moment for Neotropical connectivity and conservation: Save the northern Andes-Amazon biodiversity bridge. Conserv. Lett. 2018, 12, e12594. [Google Scholar] [CrossRef]
  60. INEI. Loreto, Compendio Estadístico 2017; Instituto Nacional de Estadistica e Informatica: Lima, Peru, 2017. [Google Scholar]
  61. DANE. Censo Nacional de Población y Vivienda; Departamento Administrativo Nacional de Estadisticas: Bogota, Colombia, 2018. Available online: https://www.datos.gov.co/widgets/qzc6-q9qw (accessed on 1 December 2021).
  62. INE. Instituto Nacional de Estadística del Estado Plurinacional de Bolivia; Instituto Nacional de Estadistica: La Paz, Bolivia, 2020; Available online: https://www.ine.gob.bo/ (accessed on 1 December 2021).
  63. ISA. Povos Indígenas no Brasil; Instituto Socioambiental: São Paulo, Brazil, 2020; Available online: https://www.socioambiental.org/pt-br/o-isa/programas/povos-indigenas-no-brasil (accessed on 1 December 2021).
  64. DANE. Población Indígena de Colombia; Departamento Administrativo Nacional de Estadisticas: Bogota, Colombia, 2019. Available online: https://www.datos.gov.co/Inclusi-n-Social-y-Reconciliaci-n/Poblaci-n-ind-gena/nhat-uw3m (accessed on 1 December 2021).
  65. Dourojeanni, M. Loreto Sostenible al 2021-Resumen Ejecutivo; Derecho, Ambiente y Recursos Naturales: Lima, Peru, 2013; p. 40. [Google Scholar]
  66. Kirkland, M.; Eisenberg, C.; Bicerra, A.; Bodmer, R.E.; Mayor, P.; Axmacher, J.C. Sustainable wildlife extraction and the impacts of socio-economic change among the Kukama-Kukamilla people of the Pacaya-Samiria National Reserve, Peru. Oryx 2020, 54, 260–269. [Google Scholar] [CrossRef] [Green Version]
  67. Orta Martínez, M.; Napolitano, D.A.; MacLennan, G.J.; O’Callaghan, C.; Ciborowski, S.; Fabregas, X. Impacts of petroleum activities for the Achuar people of the Peruvian Amazon: Summary of existing evidence and research gaps. Environ. Res. Lett. 2007, 2, 045006. [Google Scholar] [CrossRef]
  68. Finer, M.; Jenkins, C.N.; Powers, B. Potential of Best Practice to Reduce Impacts from Oil and Gas Projects in the Amazon. PLoS ONE 2013, 8, e63022. [Google Scholar] [CrossRef] [Green Version]
  69. Brown, G.; Reed, P.; Raymond, C.M. Mapping place values: 10 lessons from two decades of public participation GIS empirical research. Appl. Geogr. 2020, 116, 102156. [Google Scholar] [CrossRef]
  70. IUCN-CMP. Unified Classification of Conservation Actions. 2006. Available online: https://www.iucnredlist.org/resources/classification-schemes (accessed on 14 September 2021).
  71. Walker, R.T.; Simmons, C.; Arima, E.; Galvan-Miyoshi, Y.; Antunes, A.; Waylen, M.; Irigaray, M. Avoiding Amazonian Catastrophes: Prospects for Conservation in the 21st Century. One Earth 2019, 1, 202–215. [Google Scholar] [CrossRef] [Green Version]
  72. Vale, M.M.; Berenguer, E.; Argollo de Menezes, M.; Viveiros de Castro, E.B.; Pugliese de Siqueira, L.; Portela, R.d.C.Q. The COVID-19 pandemic as an opportunity to weaken environmental protection in Brazil. Biol. Conserv. 2021, 255, 108994. [Google Scholar] [CrossRef]
  73. Botero, R.; Serrano, M.A. La Gobernabilidad y la Gobernanza en la Planificación Multi-Actor Participativa de la Carretera Marginal de la Selva; Athayde, S., Buschbacher, B., Chavez, A., Eds.; 2021.
  74. Sabo, A.; Arteaga, M.; Chavez, A.; Jordao, C.; Ferreira, S.; Luna-Celino, V.; Montero, P.; Perz, S. The Wisdom of Hindsight: A Comparative Analysis of Timelines of Environmental Governance of Infrastructure across the Pan-Amazon. Ecol. Soc. 2021, in press. [Google Scholar]
  75. Finer, M.; Mamani, N. MAAP Synthesis: 2019 Amazon. Deforestation Trends and Hotspots; MAAP Synthesis #4; Available online: https://maaproject.org/2020/synthesis-2019/ (accessed on 14 September 2021).
  76. Watch, G.G.F. Tree cover loss in Colombia. 2019.
  77. Haworth, B.; Whittaker, J.; Bruce, E. Assessing the application and value of participatory mapping for community bushfire preparation. Appl. Geogr. 2016, 76, 115–127. [Google Scholar] [CrossRef]
  78. McCall, M.K. Seeking good governance in participatory-GIS: A review of processes and governance dimensions in applying GIS to participatory spatial planning. Habitat Int. 2003, 27, 549–573. [Google Scholar] [CrossRef]
  79. Corbett, J. Good Practices in Participatory Mapping: A Review Prepared for the International Fund for Agricultural Development; International Fund for Agricultural Development IFAD: Rome, Italy, 2003. [Google Scholar]
Figure 1. The four study mosaics in western Amazonia in Bolivia, Brazil, Colombia and Peru.
Sustainability 13 14048 g001
Figure 2. Pmap flowchart of exploratory sequential mixed-method design.
Sustainability 13 14048 g002
Figure 3. Composition of workshop participants in each mosaic classified according to major stakeholder groups. The total number of participants is given by “n”. UF GIA represents students and faculty from the University of Florida associated with the GIA project.
Sustainability 13 14048 g003
Figure 4. Photos during the Pmap exercises in Bolivia (top left), Brazil (top right), Colombia (bottom left) and Peru (bottom right). Faces are blurred for anonymity.
Sustainability 13 14048 g004
Figure 5. “Why” explanations for areas of value (A) and concern (B) within the four mosaics. The categories are represented by the following shade of colors: purple (Resource Extraction), brown (Infrastructure), green (Environmental), cyan (Value-Social/Concern-Socioeconomic). The number of polygons (n) per mosaic are in parenthesis.
Sustainability 13 14048 g005aSustainability 13 14048 g005b
Figure 6. Counts of areas of value (top) and areas of concern (down) per category for each ITs and PAs.
Sustainability 13 14048 g006
Figure 7. Percentage of recommended actions (CMP) cited by participants within all 4 mosaics. Recommendations for Colombia were not explicitly associated with the areas of concern polygons.
Sustainability 13 14048 g007
Table 1. Characteristics of the four focal mosaics.
Bolivia *BrazilColombiaPeru
Total area (km2)330,383393,008376,211374,985
National Protected Areas (km2)104,210192,070101,35589,236
Indigenous Areas (km2)97,30563,254196,054106,553
Total population683,996963,1121,411,0791,049,364
Indigenous population48,46215,818At least 168,065105,900
Main citiesRiberalta, Guayaramerin, Cobija, TrinidadPorto Velho, Humaitá, Guajará-MirimLeticia, FlorenciaIquitos, Yurimaguas
Dams (inventoried/built)4/018/31/05/0
Length of roads (km)28578600731286
Cumulative deforestation 2019 (km2)17,369 *49,54640,02922,579
* Data for Bolivia mosaic excludes information from the Brazilian portion to avoid double counting.
Table 2. Number and area of Protected Areas and Indigenous Territories that were identified as “areas of value” or “areas of concern” in Pmap exercise in each mosaic. The percent of total number or area of Protected Areas and Indigenous Territories represented are shown in parentheses (all values were rounded to nearest integer).
MosaicAreas of ValueAreas of Concern
Number (% of Total)Area in 1000 km2 (% of Total)Number (% of Total)Area in 1000 km2 (% of Total)
Protected AreasBolivia8 (16%)11.0 (10%)49 (98%)91.3 (85%)
Brazil85 (87%)168.4 (88%)59 (60%)137.7 (72%)
Colombia20 (62%)67.7 (67%)29 (91%)54.2 (53%)
Peru17 (89%)81.9 (92%)17 (89%)89.2 (100%)
Indigenous TerritoriesBolivia15 (27%)17.2 (18%)36 (64%)90.5 (93%)
Brazil47 (82%)46.1 (73%)40 (70%)31.2 (49%)
Colombia119 (71%)76.9 (39%)150 (90%)114.6 (58%)
Peru504 (75%)89.3 (84%)547 (81%)105.2 (99%)
Publisher’s Note: MDPI stays neutral with regard to jurisdictional claims in published maps and institutional affiliations.

