Article

Assessing the Effectiveness for Achieving Policy Objectives of Land Consolidation in China: Evidence from Project Practices in Jiangsu Province from 2001 to 2017

1
College of Public Policy and Management, Hohai University, Nanjing 210098, China
2
School of Public Policy, China University of Mining and Technology, Xuzhou 221043, China
3
College of Hydrology and Water Resources, Hohai University, Nanjing 210098, China
4
Geospatial Science, School of Science, STEM College, RMIT University, Melbourne, VIC 3000, Australia
*
Author to whom correspondence should be addressed.
Sustainability 2021, 13(24), 13891; https://doi.org/10.3390/su132413891
Submission received: 17 November 2021 / Revised: 8 December 2021 / Accepted: 10 December 2021 / Published: 15 December 2021

Abstract

:
Land consolidation (LC) is an important measure taken to increase the quantity and productivity of farmland while reducing land fragmentation and ensuring food security. However, long-term land consolidation project (LCP) practices are rarely analyzed to assess the effectiveness for achieving current policy objectives of LC in China. Taking the practices of LCPs in Jiangsu Province from 2001 to 2017 as a case study, we used the spatial self-related analysis, the consistency analysis, and the redundant analysis (RDA), and found that the construction scale and the investment amount of LC in Jiangsu Province displayed varying trends, and that the newly increased farmland rate is clearly divided into three stages and gradually decreases. The newly increased farmland area, the investment funds, and reserved land resources for farmlands are not spatially synchronized in Jiangsu Province. Only the positive relationship between the LC rate and the Normalized Difference Vegetation Index (NDVI) growth rate continue to rise. The earlier stage of land consolidation projects (LCPs)’s practices is mainly affected by natural and social factors, and the late stage is mainly affected by economic and strategic factors. Finally, a new implementation scheme framework of LC planning has been proposed. This framework provides reference for top-level design, planning, and management of LC policies at the national level in China and other developing countries.

1. Introduction

Since 1978, China’s economy has substantially grown after a huge sacrifice of resources and environment [1,2,3], including the loss of high quality farmlands, the contamination of soil and water, and the degradation of different ecological systems. China has a population of 1400 million [2]. However, the per capita farmland area is only 0.09 hectares [1]. For this reason, China’s Central Government has paid great attention to farmland protection [4]. Since 1986, “extremely cherishing and reasonably utilizing each inch of land and substantially protecting farmland” has been one of the basic state policies [2]. Article 31 of the 1998 Land Management Law contains the national farmland compensation principle [4]. In 2008, the Ministry of Land and Resources of China ordered a comprehensive requisition–compensation balance of farmland occupied by non-agricultural construction [5]. However, those actions were not enough to stop the decline of arable land. Only in 2015 did the farmland area decrease 3.0 × 10⁵ ha [6] due to construction, disasters, the adjustment of agricultural structure, and the withdrawal from cultivated land for ecological purposes [7]. In addition, the household contract responsibility system based on family units, which was applied in China in 1980s, aggravated land fragmentation and negatively impacted the conditions required for the implementation of modern agriculture and large scale management [8]. A long-term policy that “encouraged the subsidization and development of industry by agriculture” adopted by China promoted the migration of the labor force and fund flow to the city. Thus, the urban–rural gap has gradually aggravated [5]. Chinese rural population, society, and economy have suffered a continuous contraction [1]. Thus, it is urgent to decrease land fragmentation, accelerate land transfer, expand agricultural scale operation, increase grain productivity, and promote rural revitalization [9,10].
Land consolidation has been widely applied worldwide as an effective tool to alleviate land fragmentation [11], improve agricultural production conditions [12], achieve a dynamic balance of total farmland [13], increase farmland quality and productivity [14,15], safeguard national grain safety [16], and promote rural revitalization [17,18]. Different studies in Europe, Middle Asia, and South Asia have proved that LC is able to decrease agricultural production cost by reducing land fragmentation [19,20,21]. In addition, LC has effectively improved the structure of rural land tenure systems. The land privatization reform in Eastern Europe and Africa has aggravated land fragmentation to different extents. On the other hand, LC increased land tenure transfer and improve land tenure structure [19,20]. Besides the influence of social economy, LC decreases water and soil loss, increases carbon reservoirs [22], promotes landscape optimization [23], and improves ecological services. In 2003, the Food and Agriculture Organization (FAO) divided LC into five categories [24]. Farmland fragmentation reduction was the only traditional objective of LC [4]. Currently, LC has been applied to promote rural development, village upgrading, environment protection, as well as agricultural recreation value [25,26]. The multiple objectives of LC have been some of the important principles of project performance evaluation [27,28]. In addition, LC corresponds to a complex project that involves technology, society, and policies, funding, and organization assurance. Thus, local governments were not easy to successfully accelerate LC [29].
The initial objectives of LC in China were different from those in other countries. In China, the initial goal of LC was to increase new farmland spaces for achieving a balance between the area occupied by construction and the area of newly increased cultivated land [12]. The newly increased farmland area was the determining factor in LC investment behavior [12]. The decision-making process of whether or not LC should receive national fund subsidies was not based on the benefit–cost criteria of the market. The political goal directed to increase farmland was the key factor [30]. Thus, some local governments whose economic development is relatively low do not usually pay attention to the economic and ecological feasibility of land consolidation projects (LCPs) [22,31]. However, they all tried to obtain national free LC funds, which were created to promote local economic development. This situation resulted in a reorientation of LC goals in China, where the focus was oriented to quantity instead of quality, neglecting ecological services [2,7,8,22,32]. During 40 years of rapid development of the Chinese economy, land utilization strategies and farmland protection policies have been adjusted several times [33,34]. Currently, social development faces important changes. Ecological safety has become the prioritized objective [25,35]. According to the multiple goals of LC, some Chinese researchers have proposed that consolidation should serve the national development objective [6,36]. However, the regional differentiation in China is high. The level of economic development, the policy implementation ability, and different problems related to LC vary in different regions [29].
The standard used to evaluate the LC implementation effect is whether or not it achieved the policy objectives and changed in accordance with the developmental status [37]. However, there has been a lack of long-term LC data, and it is impossible to effectively evaluate the actual policy implementation’s effect [38,39]. Thus, in the present research, 1064 LCPs that were approved and implemented from 2001 to 2017 in Jiangsu Province were selected to examine the evolution stage of China’s LC policy for the last twenty years. We examined: (1) Whether or not project practices in Jiangsu Province followed the policy objective orientation and if different stage preferences existed; (2) The degree of achievement of policy goals at different stages considering different crucial factors that may influence the implementation of LC; (3) A new LC implementation scheme as a quantitative reference for the future formulation of top-level designs, planning, and management of LC strategies at the national level in China and other developing countries.

2. A Brief Review of China’s Land Consolidation in the Past 20 Years

Large-scale LC began in China in the 1990s. Three centralization modes of LC include the centralization of farmland to farming experts, the centralization of industry to park areas, and the centralization of residencies to city and town. In order to comply with these centralization modes, Shanghai promoted land transferring between urban and rural areas with the aim of enhancing land utilization efficiency [18,40]. Given the yearly increase in construction land in China, which has occupied a significant amount of farmlands, the number of high quality farmlands has severely decreased. In order to answer the question “who will raise China in the 21st century”, the 1998 Land Management Law stated that: “Nation encourages land consolidation”. Thus, the policy purpose of LC in China initially preferred the increase of new farmland [4]. In 2001, the Ministry of Land and Resources officially approved and allocated the first national investment to fund LCPs. This represented the prologue of large-scale LCPs in China. During the subsequent five years, 3–5 billion US dollars were invested each year in national LCPs.
In 2006, the State Council of China ordered the government in each province to invest 15% of the net income of the land transfer fee obtained from the paid use of construction land in support of agricultural development [41]. Subsequently, the Ministry of Land and Resources transferred the registration right of LCPs to each province [42]. Thus, LC funds became stable and continuously increased. However, the farmland supplementary strategy, namely “the important quantity and the less important quality” turned more and more into an important disadvantage [38]. The grain yield in China did not increase between 2002 and 2007 due to a shortage of basic supporting facilities for agricultural production [43]. In the 1980s, China generally applied the household contract responsibility system, which greatly promoted the interest of farmers and increased agricultural productivity level. However, it was excessively focused on allocating farmland areas to each household according to family population [44]. Due to differentiation, quality, and the production conditions of farmlands, most households were in charge of 5–7 farmland spots with areas below 0.1 hectare. The benefit of the household contract responsibility system has been totally consumed after these twenty years. The production and economic capacities of each household were not able to guarantee large investments dedicated to expanding basic farmland facilities as well as large agricultural equipment [43]. The Chinese government has granted privileges to grain safety [45]. In order to increase agricultural productivity, the policy goal of LC changed its preferences to basic farmland-supporting facilities and water conservancy [46]. In 2009, the National Agricultural Comprehensive Development Office required that each region should accelerate the construction of basic farmland with high standards. In 2011, the Ministry of Land and Resources released “the plan of land consolidation in China (2011–2015)”, which ordered the construction of 2.67 × 10⁷ ha of high standard basic farmland at the national level at the end of 2015.
In 2012, LC was extended to the whole region [43]. In 2015, the Chinese government confirmed the permanent basic regionalization around 106 cities to protect high quality farmlands, ensure food safety, provide land rights and benefits to the farmers, as well as promote agricultural civilization [47]. Innovation, coordination, green, open, and sharing were five basic ideas of the Chinese social development. The adjustment of the national development strategy required that LC was responsible for the orientation and the adjustment of land structure, production, life, and ecology, as well as the construction of the corresponding national spatial pattern [48]. On one hand, current technology should be integrated to regional LC sets with multiple objectives including technology, funding, and incentives systems. On the other hand, the green development of LC should be launched. Ecological theory should be considered in different categories and segments of LC, leading to green production and lifestyle, and serving as the construction objective of the national ecological civilization [31].
In summary, in the last twenty years, theoretical and experimental research regarding LC in China has been developed. LC has changed from “quantity is priority” to “quantity and quality are both important”. Thus, it involves the three aspects of quantity, quality, and ecology. The corresponding policy considered significant differences in stage continuity and stability and was improved and expanded during the evolution of the related policies. Figure 1 shows the evolution and characteristics of the LC policy with an emphasis on management mode and investment.

3. Data Sources and Methods
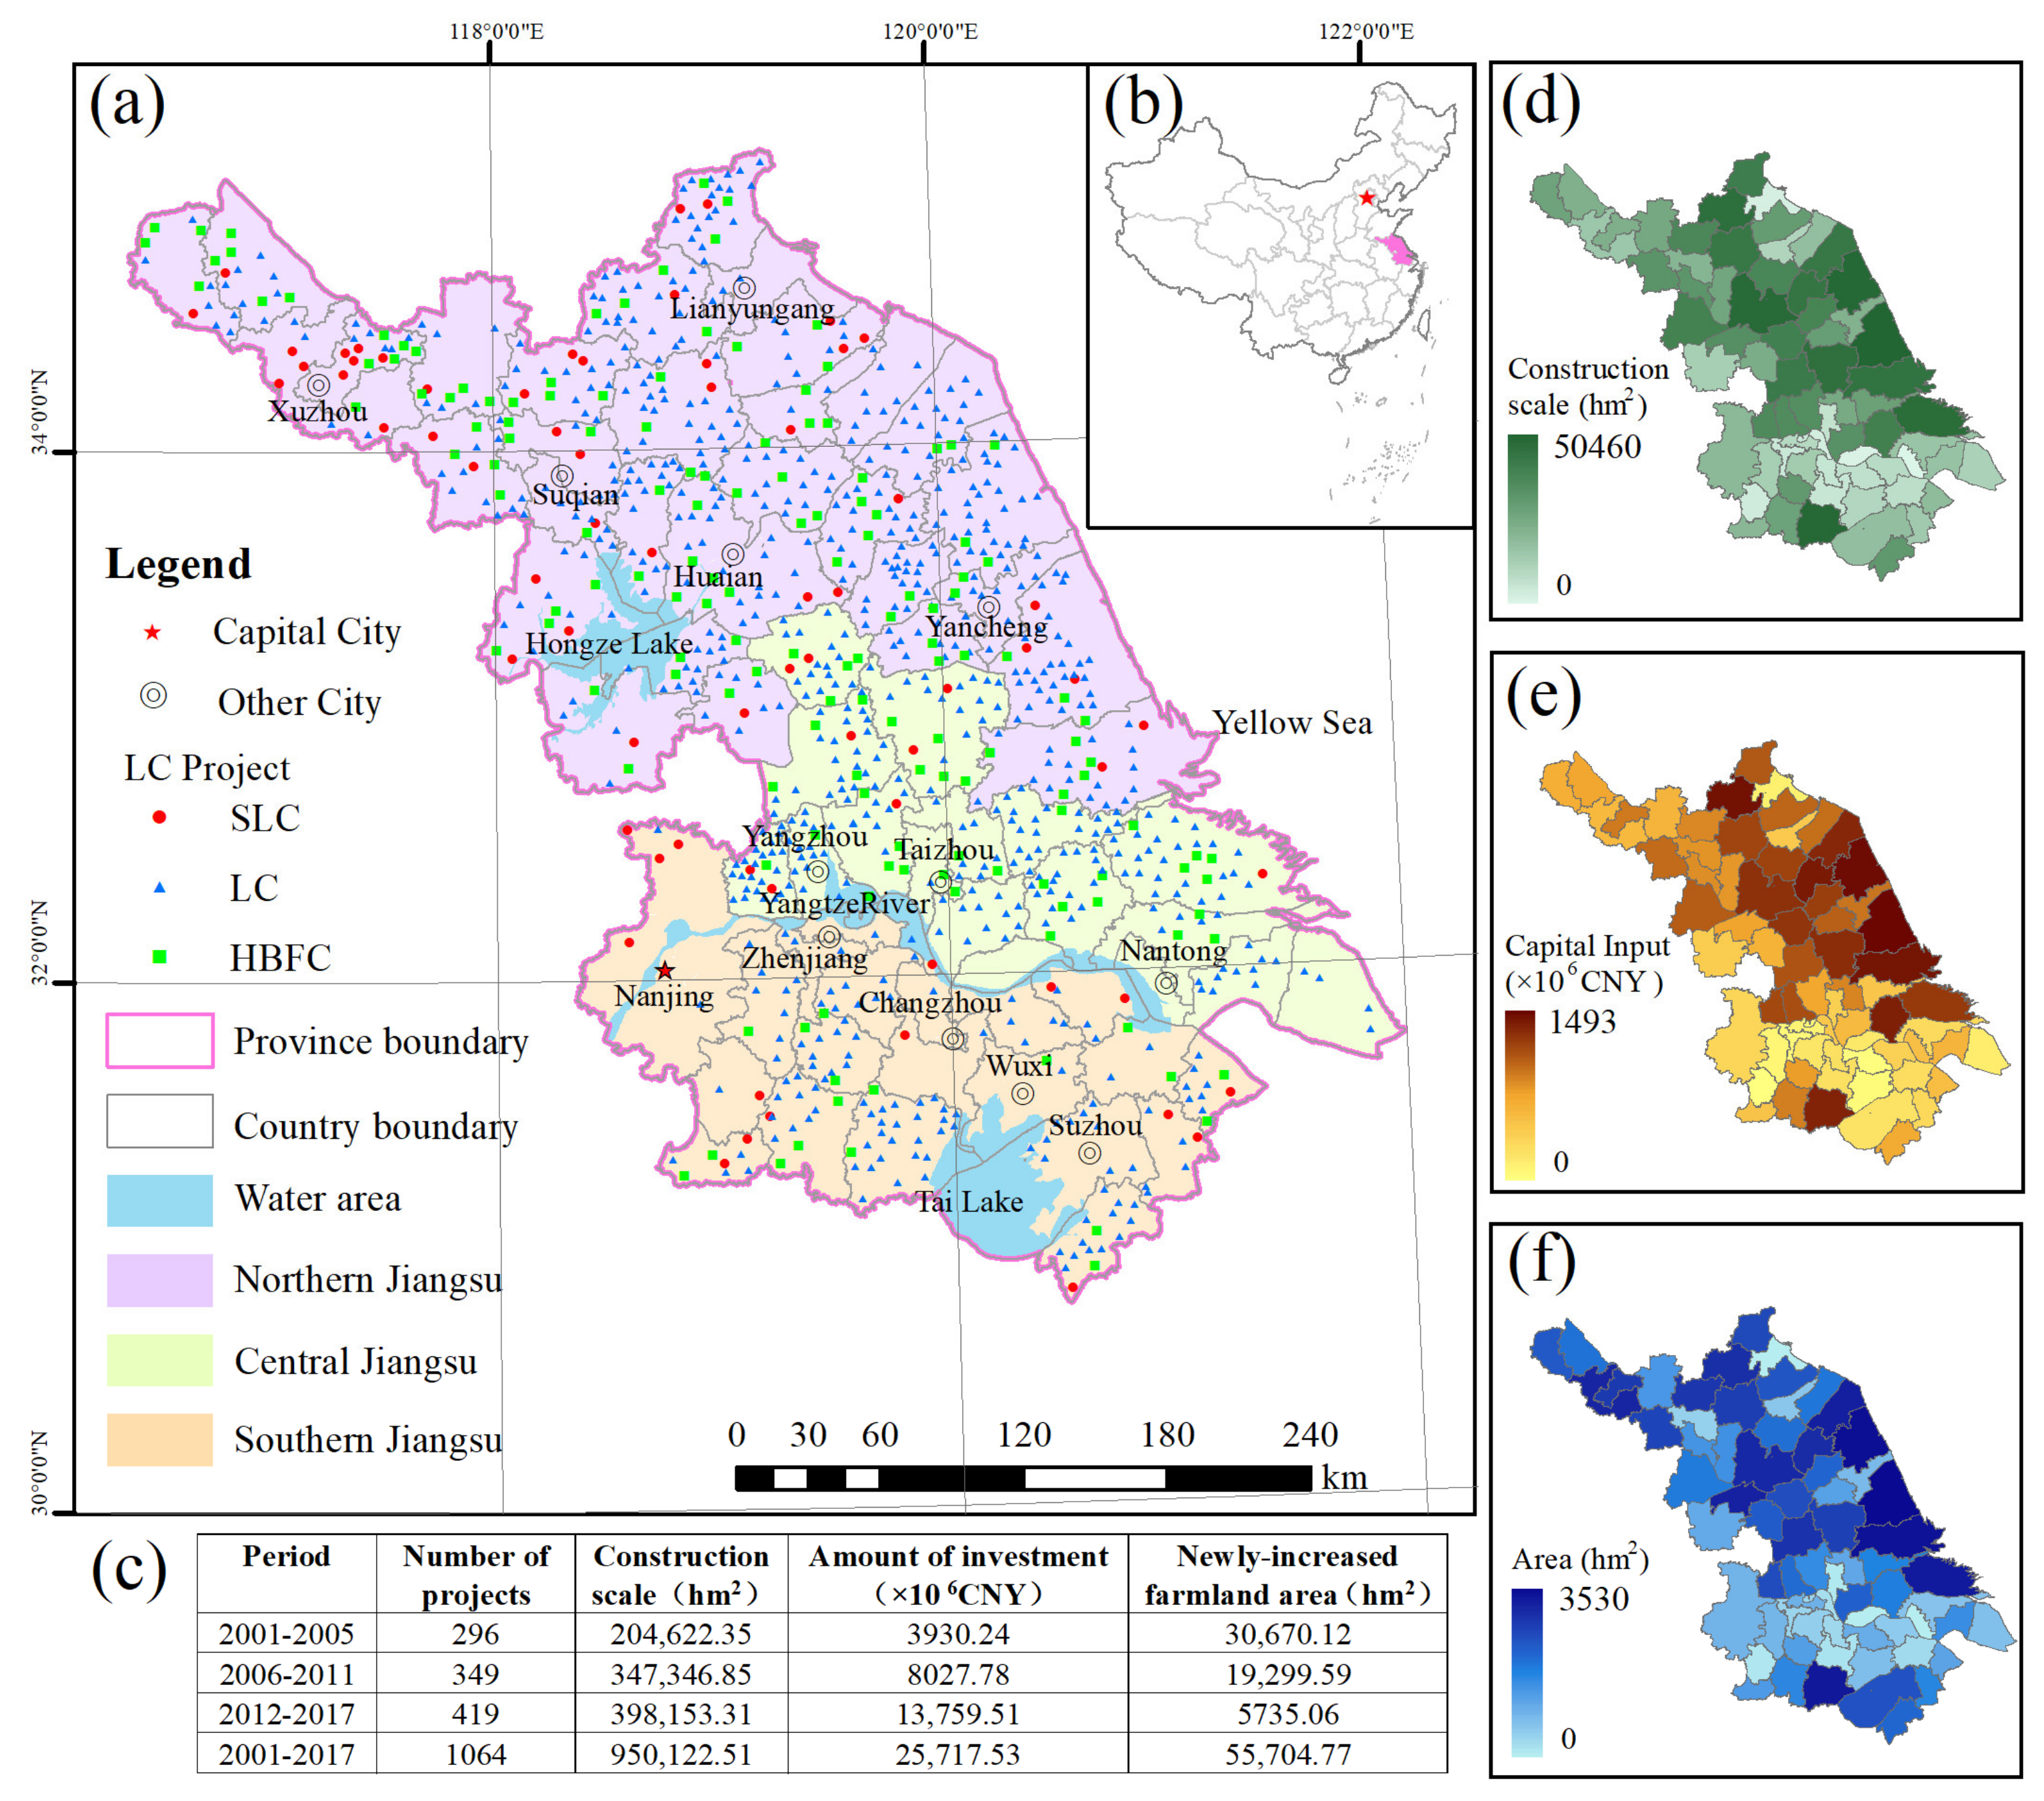
3.1. Study Area

Jiangsu Province is located on China’s eastern coast at 116°18′–121°57′ E and 30°45′–35°20′ N. The weather varies from warm to subtropical with an average temperature between 13 and 16 °C [1]. This region displays an annual precipitation of 850–1350 mm, the total area of the province is 1.07 × 10⁵ km2 [1]. Plains and water bodies account for 90% of the province’s total area and contain small mountains scattered in the north and south [49]. In 2018, the permanent resident population was 79.8 million and the urbanization rate was approximately 66.5% [49]. The local gross domestic product corresponds to 1051.22 billion US dollars. Jiangsu is one of China’s most economically developed provinces and contains important urban agglomerations in the delta of the Yangtze River (Figure 2). In addition, the Jiangsu Province presents favorable light and heat conditions as well as water and soil resources. For this reason, Jiangsu Province has been one of the most important and major grain production areas in China. The increased population, industrialization, urbanization, and grain safety has significantly impacted farmland allocation [50]. In 2018, the per capita farmland allocation was only 610.2 m2. In fact, the supplementary and reserve farmland resources in Jiangsu Province were scarce. Thus, it was urgent and important to supply farmland, increase grain productivity, and enhance the regional ecological environmental carrying capacity through LC [51]. In addition, the south of Jiangsu Province promoted the construction of “China modern comprehensive demonstration zone”. As a tool, LC has played a very important role in promoting the rural land system reform and village comprehensive consolidation, among others.

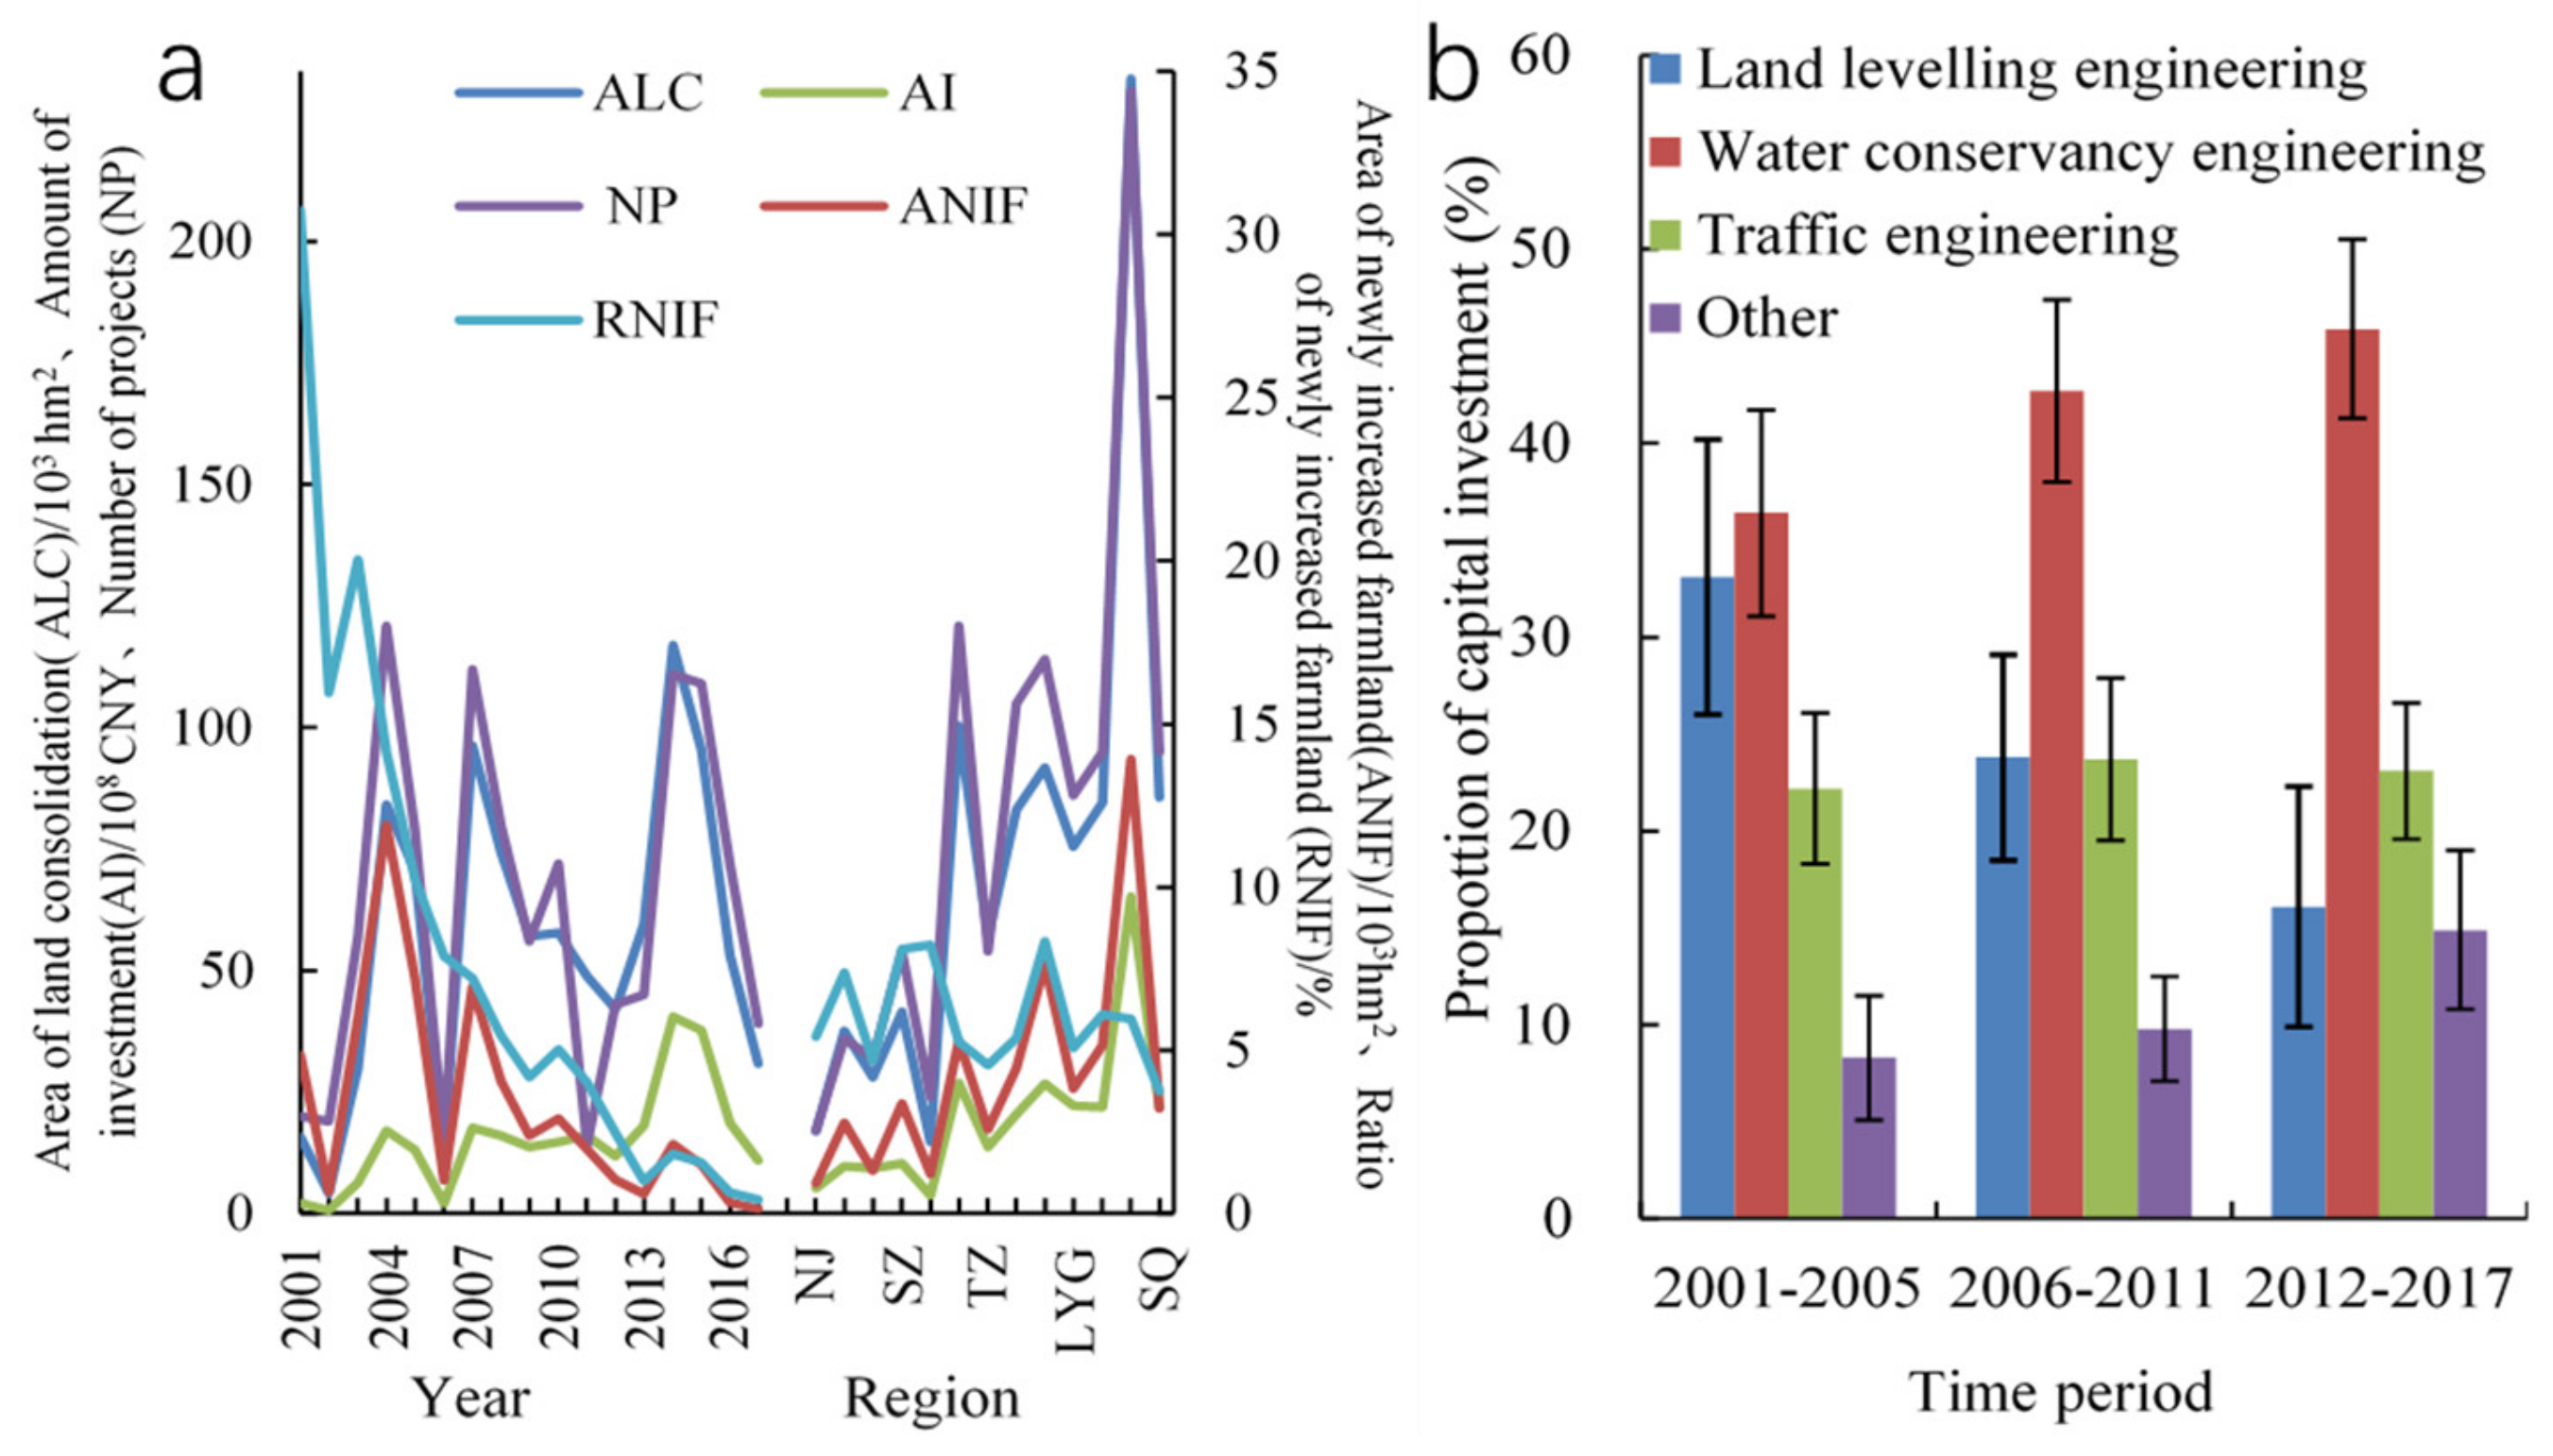
3.2. Data Sources and Treatment

LC data was obtained from 2001 to 2017 in the data library of “rural land consolidation monitoring information system of Jiangsu Province” of Land Consolidation Center of Jiangsu Province. Data was collected from 1064 projects that included three categories: (a) ordinary LCPs; (b) high standard basic farmland consolidation projects; (c) special projects (country upgrading and environmental pollution consolidation projects). The four indexes corresponded to project location, construction scale (CS), investment amount (IA), and the newly increased farmland area (NIFA). The socioeconomic data was mainly obtained from the Jiangsu Province statistical year book (2002–2018). The natural quality grade of agricultural land was acquired by area weighing based on the investigation and evaluation of Chinese farmland quality grade (Jiangsu Province). The MODIS-NDVI-16 day-250 m product (MOD13Q1, with a spatial resolution of 250 m × 250 m and a temporal resolution of 16 days) can be downloaded in the National Aeronautics and Space Administration (NASA, https://search.earthdata.nasa.gov 12 October 2021). NDVI has been verified to determine any significant correlation with farmland grain productivity [51], which could be used as an indicator of grain productivity.
The research framework includes the following steps (Figure 3): Step 1: Collect and organize data. Step 2: Analysis of spatial characteristics change. Step 3: Implementation effect evaluation. Step 4: The future framework. In this study, the county was selected as the evaluation unit. Selected counties included municipal administrative cities such as Nanjing and Suzhou, whose farmland area is small and are properly classified as LCPs according to the administrative region. A total of 69 evaluation units were chosen after considering the realistic status of LC and the availability of data. A vector data library for LCPs’ data and environmental factors was created using the ArcGIS 10.2 (ESRI, Sacramento, CA, USA) software. SPSS 22.0 (IBM, USA) was used for data statistics and for the analysis of LCPs, and Canoco 4.5 for windows software was used for the redundancy analysis (RDA).

3.3. Research Methods

In China, the effective implementation of LC involves different actors, including society, economy, technology, policy, and natural conditions [48,52]. Generally, the amount of investment and the increasing farmland rate have been essential in the consolidation of these types of projects. As LC has expanded, the selection of project location has been more influenced by the natural conditions of the areas including certain characteristics required for a space to be used as farmland. Investment efficiency and preference as well as the increasing grain productivity have become the key indicators used to evaluate the benefits of LCPs [53,54]. In addition, policy reinforcement and local workforce usually influences the degree of implementation and development of LCPs. In the present research, in order to evaluate the degree of implementation and evolution of policy goals, as well as the factors influencing LC, the following methods were applied.

3.3.1. The Spatial Self-Related Analysis

The spatial self-related analysis consists of a spatial statistical analysis method that can be used to evaluate the expanding benefit and clustering characteristic of indexes of the newly increased farmland area and the investment fund [55]. The spatial self-related characteristic can be divided into: (a) global and (b) local spatial self-related characteristics. Global Moran’s I was used to determine the distribution of the spatial mode and to measure the attribute value within the study area in the whole regional space. Local Moran’s I was used to illustrate the similarity or correlation between attribute values of the spatial unit and the adjacent spatial unit for the recognition of the hot spot area and the heterogeneousness of data [56]. Global Moran’s I is computed as:
I = n i = 1 n j = 1 n W i j X i X ¯ X j X ¯ i = 1 n j = 1 n W i j i = 1 n ( X i X ¯ ) 2
where, n indicates the total number of counties in the study area, Wij is spatial weighing, and Xi and Xj indicate the newly increased farmland quantity or investment amount in the i or j county, respectively; X ¯ corresponds to the average of the newly increased farmland area and amount of investment. The data range for I was [−1,1]. I < 0, I > 0, and I near 0 corresponded to a spatially negative correlation, a spatially positive correlation, and a random distribution, respectively.
Local Moran’s I is computed as:
I i = n X i X ¯ i = 1 n ( X i X ¯ ) 2 j i n W i j X j X ¯
where, Ii > 0 indicates a small significant difference in the newly increased farmland quantity or in the investment amount between county i and the adjacent county. A smaller Ii indicates a strong isotropy and clustering. On the other hand, Ii < 0 represents the opposite. Its high–high (low–low) pattern represents small spatial differentiation significance. Besides, the attribute values of the study unit and the adjacent countries were all relatively high (low). High–low (low–high) patterns indicate large spatial differentiation significance. Besides, the attribute value of the study unit was relatively higher (lower), whereas that of the adjacent country was relatively lower (higher). Moran’s I indexes and p values for the time periods of 2001–2005, 2005–2012, and 2012–2017 were calculated using the ArcGIS 10.2 (ESRI, Sacramento, CA, USA) software.

3.3.2. The Consistency Analysis

The consistency analysis was used to evaluate the real effect of LC planning implementation [57] and is expressed as:
C i = x i / y i = ( X i / i = 1 n X i ) ( Y i / i = 1 n Y i )
where, Ci corresponds to the consistency coefficient of the evaluation unit i. The higher the consistency coefficient, the better the real effect of the planning implementation. n indicates the number of the evaluation unit. xi is the clustering level of the newly increased farmland quantity of the evaluation unit i. yi represents the clustering level of the investment amount of the evaluation unit i. Xi is the newly increased farmland total area between 2001 and 2017 for the evaluation unit i. Yi is the investment amount of the evaluation unit i. In general, when Ci ≤ 0.5, 0.5 < Ci ≤ 0.8, 0.8 < Ci ≤ 1.2, 1.2 < Ci < 2.0, and Ci ≥ 2.0, the clustering level of the newly increased farmland quantity was far lower than, a little lower than, basically consistent with, a little higher than, and far higher than that of the investment amount, respectively.

3.3.3. The Redundancy Analysis

The redundancy analysis was used to explore the influencing factors of LC [1]. Three indexes: (a) area of LC (ALC); (b) area of the newly increased farmland (ANIF); (c) the amount of investment (AI) were used to determine the LC level in different counties. In addition, the Monte Carlo permutation test was used to test the significance of all variables in the corresponding analysis [1]. Four different factors including nature, society, economy, and policy, influenced LC implementation (Table 1).
(1)
Natural conditions were related to the degree of difficulty in carrying out LCPs, including the farmland quality index, reserve land for the newly increased farmland, the farmland fragmentation degree, grain productivity, and the amount of used fertilizer.
(2)
Social conditions directly determined the demand for new increased farmland and new increased consolidation land in the region, and indirectly determined the willingness of rural residents to participate in LC, such as employment demand. These indexes included the per capita farmland area, the newly increased construction land area, the population density, and the proportion of rural employees to the total population.
(3)
Economic conditions directly determined the capital conditions of LC. The level of economic development indirectly affected the demand for LC and, particularly, the demand for the replacement of new increased farmland by new increased construction land. These indicators included land lending revenue, the amount of rural production per capita, the second and third industry product per capita, and the proportion of primary production to the total GDP.
(4)
Policy conditions mainly referred to the support of local government and provincial government to LC, including the emphasizing degree to local governments on farmland/agriculture and LC as well as the degree of the support of provincial government on local regions. The indicators included the ratio of investment in agriculture (the primary industry) to total investment, the financial transfer payment income, and the amount of science and technology innovation granted to LCPs.

4. Results

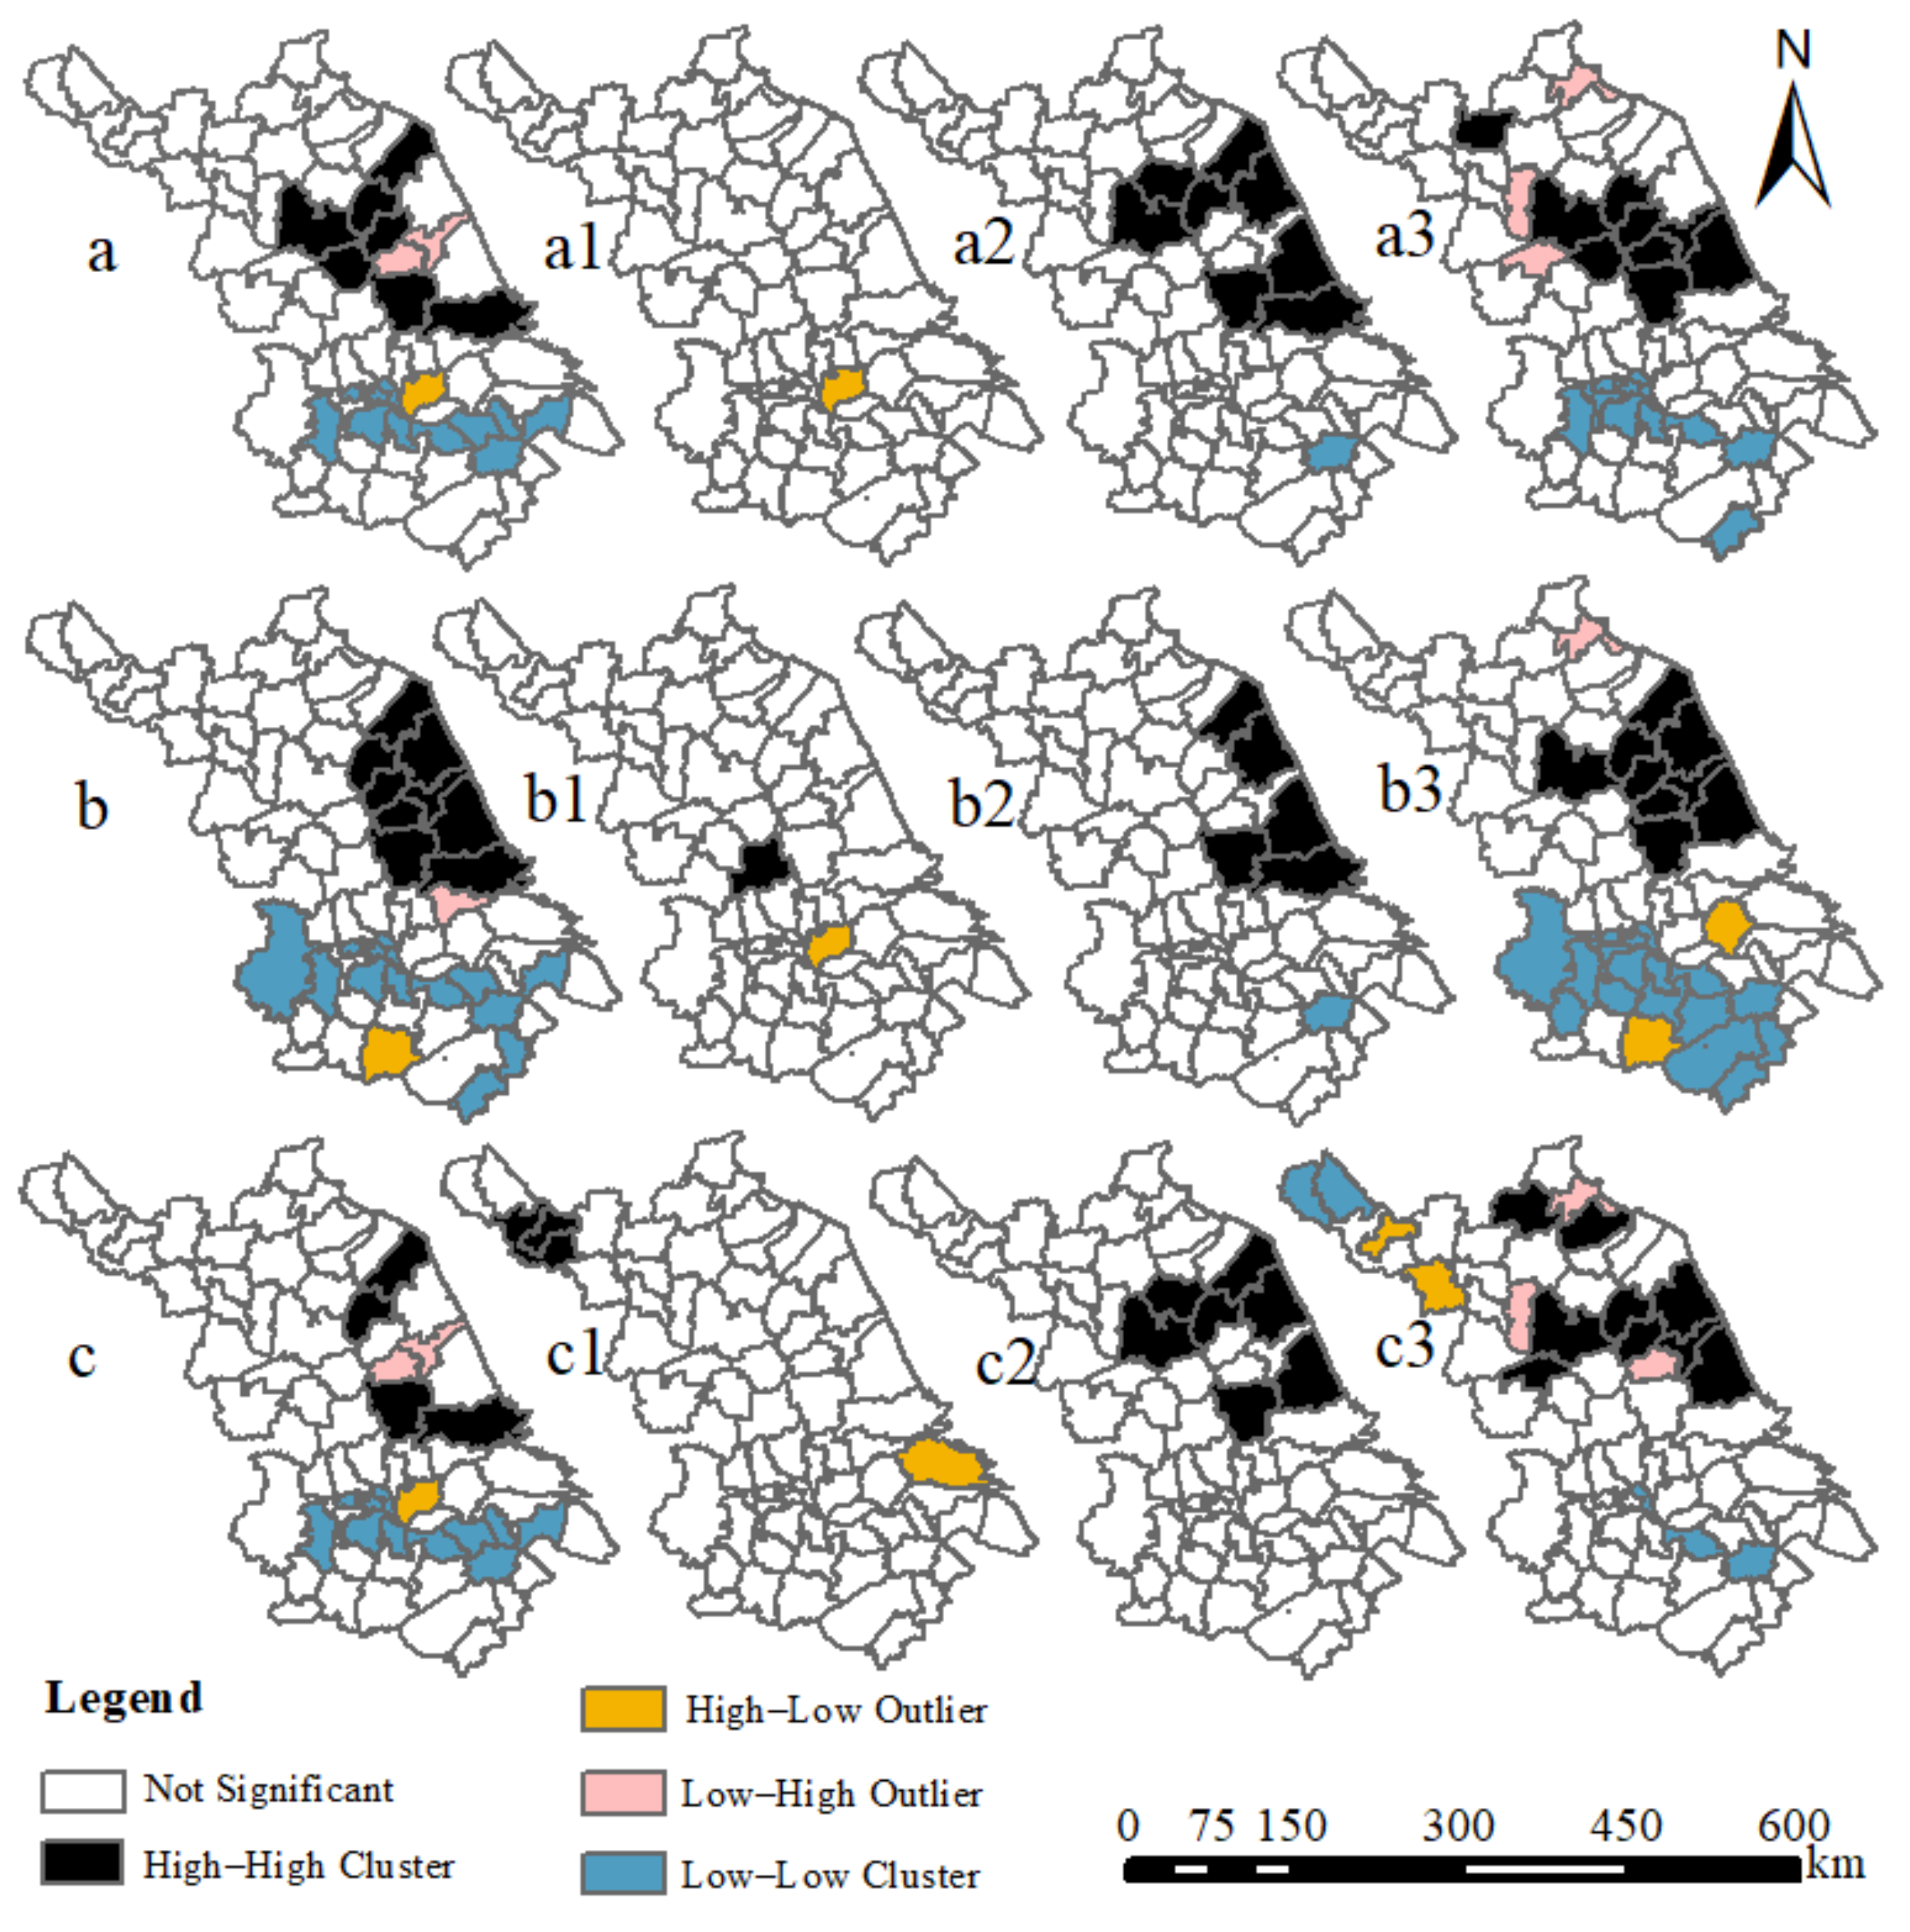
4.1. Spatio-Temporal Pattern and Regional Differentiation of LCPs in Jiangsu Province

There were 1064 LCPs implemented in Jiangsu Province from 2001 to 2017. The construction scale was 950,122.51 ha. The cumulative investment was 25.718 billion. The newly increased farmland area was 55,704.77 ha (Figure 4). Figure 4a indicates that the number of LCPs and land construction scale displayed three peaks in 2004, 2007, and 2014. The investment values showed a gradual increasing trend with fluctuations from 0.21 billion in 2001 to 1.084 billion in 2017, reaching the highest peak of 3.773 billion in 2014. However, the newly increased farmland rate displayed a decreasing trend with a value of 30.37% in 2001 and 0.43% in 2017. An LC fund was usually invested in earthwork leveling and water conservancy supplementary facility projects. Herein, water conservancy supplementary facility projects displayed a gradual increasing trend with three stages. However, the proportion of earthwork leveling investment gradually decreased, also showing three stages. The traffic engineering investment was relatively stable. The investment proportion of ecological engineering such as forest protection gradually increased (Figure 4b).
Figure 5 indicates that the spatial differentiations of LCPs in different stages were significant. In general, the distribution of LCPs was relatively uniform between 2001 and 2005. As time passed, LC progressed toward the coastal area and central Li-Xia river plain area. After 2006, LCPs of the southern Jiangsu suffered a continuous contraction.
Spatial self-related analysis was introduced to further clarify the spatial differentiation of LC in Jiangsu Province. According to the data presented in Table 2, the LC construction scale, the investment amount, and the newly increased farmland quantity in 2001–2017 were all spatially positively correlated. Comparing the results of the Global Moran’s I between the three periods, it was observed that the spatial self-relation of the construction scale, the investment amount, and the newly increased farmland quantity increased by 0.36, 0.35, and 0.15, respectively. The spatial differentiation also further increased. Spatial selection of initial LCPs was in the exploratory stage. The local government usually selected a location where work was easy to carry out or where the people expressed a higher level of enthusiasm or participatory intention. Thus, LCPs lacked dramatic spatial correlation, leading to small Global Moran’s I coefficients for the period 2001–2005.
Local Moran’s I results indicated that the construction scale, the investment amount, and the newly increased farmland quantity of LCPs of Jiangsu Province in 2001–2017 presented a similar local spatial clustering pattern. For example, a high–high clustering area was centered in central Huaian city, the middle and south of Yancheng city, as well as Xinhua city. A low–low clustering area was located in Changshu city, Yangzhong city, Jiangyin city, as well as Changzhou city. High–low clustering area was centered in Yixin city Figure 6. However, the change in local Moran’s I construction scale, investment amount, as well as the newly increased farmland quantity in different stages was extremely large. Local Moran’s I index construction scale and investment amount continuously increased in high–high clustering areas. In addition, high–low and low–low clustering areas of local Moran’s I index gradually appeared. These data illustrated the centralization to pieces trend of LCPs. In addition, the policy orientation was clearer at the northern area of the Jiangsu Province. Local Moran’s I index of the newly increased farmland quantity presented a high–high clustering area (Xuzhou city) and a high–low clustering area (Nantong city) in 2001–2005. For the newly increased farmland, only a high–high clustering area was observed in the period 2006–2011, which was centered in the eastern coastal area and the middle of the Li-Xia river plains of Jiangsu Province. In 2012–2017, a high–high clustering area (Donghai country) and a high–low clustering area (Lianyungang city) occurred in 2012–2017. Data indicated that the high–high clustering area decreased as compared with that of 2006–2011.

4.2. Evaluating the Success of LCPs in Jiangsu Province

Most of LCPs of the Jiangsu Province were mainly centered in minority areas in 2001–2017 (Figure 4). It was not possible to evaluate the real performance of the implementation. According to the data presented in Figure 7a, the consistency coefficient of the newly increased farmland quantity and the investment amount was larger than 1.2. In this case, only 16 evaluation units were selected, which represent a proportion of 23.19%. The units with high coefficients were mainly distributed in Suzhou, Wuxi, and Xuzhou, which were the key areas during the implementation of the initial LCPs. Those in a coastal area and the Li-Xia river plain area of Jiangsu Province represent the largest levels of newly increased farmland. The consistency coefficient of the newly increased farmland quantity and the investment amount was less than 0.8 with 29 evaluation units, whose proportion was 42.03%. Those units with low coefficients were mainly distributed in the northern and southwestern area of Jiangsu, most of which had a relatively greater amount of newly increased farmland quantity, as well as larger investment amounts. Thus, the investment fund of LCPs in Jiangsu Province was not clustered with the area with a large, newly increased farmland quantity. The real effect of the scheme implementation was not very good.
According to the data presented in Figure 7b, the consistency coefficient between the investment amount and reserve land for the newly increased farmland was less than 0.8, with 24 units evaluated representing a proportion of 34.78%. Those units with low coefficients were mainly centered in the eastern coastal area, the southwestern part, and the northeastern part of Jiangsu Province. Reserve land for their newly increased farmland accounted for 56.85% of the whole province, and they only obtained 24.65% of the total invested fund. The consistency coefficient between the investment amount and reserve land for the newly increased farmland was larger than 2.0 with 22 evaluation units, which represent a proportion of 31.88%. Those units with high coefficients were mainly distributed in Changzhou, Taizhou, Huaian, and Suqian. Their reserve land for farmland accounted for 14.30% of the whole province, and they obtained 40.23% of the total invested fund. Thus, the investment fund of LCPs of Jiangsu Province in 2001–2007 was not clustered with the area with large reserve land for the newly increased farmland. The effect of the real scheme implementation was not very good.
In 2001–2005, the proportion of consolidated farmland in the province was less than 5%. High value districts were located in the southeastern and the mid-western part (Figure 8a). However, during the same period, the NDVI increasing area was mainly located in the north of Jiangsu Province, which was in an almost inverse relationship, as compared with the area with a high LC rate (Figure 8c). From a long-term viewpoint, and especially after 2006, a positive correlation between the LC rate and the increasing rate of NDVI can be observed (Figure 8e). This result indicated that LCPs of Jiangsu Province in 2006–2017 involved the enhancement of farmland productivity. The implementation of LCPs complied with policy requirements and presented positive effects.

4.3. Main Factors Influencing the Implementation of LC in Jiangsu Province

According to the results of the Monte Carlo permutation test for the LCPs of the Jiangsu Province, during the period of 2001–2017, all sorting axes presented a significant level (p = 0.002 < 0.05). These results proved the occurrence of the ideal sorting effect. The former two axes explained 74.0% of variation in species information and 100.0% in species–environment relationship information (Table 3). The forward selection and the Monte Carlo test were used to determine whether there was a significant effect of environmental factors on LCPs’ implementation during the three stages. The results for the period 2001–2017 indicated a confidence level of 5% for the three variables, including a proportion of first industry product to the total GDP (F = 23.02, p = 0.002), reserve land for the newly increased farmland (F = 9.21, p = 0.006), and the income of fiscal transfer payment (F = 4.26, p = 0.034) (Figure 9a).
The influencing factor in the LCPs’ implementation in different periods showed different confidence levels. According to the data presented in Table 3 and Figure 9b–d, in 2001–2005, two variables of reserve land for the newly increased farmland (F = 12.95, p = 0.004) and population density (F = 4.67, p = 0.04) showed a confidence level of 10%. They were key factors of LCPs’ implementation in the first stage. In 2006–2011, three variables of agricultural production per capita (F = 30.94, p = 0.002), the farmland fragmentation degree (F = 4.17, p = 0.032), and population density (F = 3.84, p = 0.058) displayed a confidence level of 10%, and were key factors in LCPs’ implementation in the second stage. In 2012–2017, four variables, including the proportion of first industry product to total GDP (F = 39.14, p = 0.002), the income of fiscal transfer payment (F = 5.86, p = 0.006), the amount of awards (F = 3.62, p = 0.076), and the fertilizer application amount (F = 3.49, p = 0.064), presented a confidence level of 10%, and were the key factors of LCPs in the third stage.

5. Discussion

5.1. Response of LCPs’ Implementation in Jiangsu Province to National Policies

LC practices of Jiangsu Province in 2001–2017 presented a significant stage preference, which changed according to the national policy objective. Before 2005, the main objective of LC in China was the development of unutilized land resources and an increment in farmland areas [18,33]. Newly increased farmland rate in 2001–2005 was larger than 10%, which fulfilled the objective. However, the disadvantage of the farmland supplement strategy, in which one “paid more attention to the quantity than the quality”, gradually occurred [50]. In 2002–2007, Chinese grain yield was constant due to the unavailability of agriculturally basic supplementary facilities [58]. For this reason, LC policy was focused on the improvement of GP. High standard basic agricultural construction turned into a conventional practice. After 2010, the high standard basic farmland construction was the core of LCPs in Jiangsu Province. In 2011–2015, the proportion of these schemes exceeded 50%. Even when the transformation to national policy of LC was behind, LCPs in Jiangsu Province clearly transformed from increasing farmland quantity to enhancing farmland grain productivity. A more significant piece of evidence is the newly increased farmland rate, which decreased from 30.37% in 2001 to 0.43% in 2017. Some studies have focused on changes in the newly increased farmland rate and grain production capacity caused by land consolidation [1,49,50], but have never linked such changes to LC policy objectives and are only used as an indicator to evaluate the effectiveness of LC.
Before 2005, intense LC activities intended to increase farmland areas in China. Ecological factors and landscape patterns were seldom considered in the design of LCPs. The excessive stabilization of moat roads resulted in alterations to the farmland ecological system [59,60]. After 2012, ecology became the priority objective of socio-economic development in China. The focus of LC policy changed from quantity priority and “the quantity and quality were both important” to “quantity, quality, and ecology” [61]. In addition, the unequal rural and urban development in China significantly reduced the advancement of sustainable development in China [25]. In addition, it caused the continuous contraction of economy in rural areas [1]. China expected to promote the inclusive growth of the whole socio-economic system by the transformation of rural land use structure. Jiangsu Province has carried out global rural LCPs since 2009, which has been used as an important tool to promote rural upgrading and rural transformation, as well as to serve the current construction objective of ecological civilization in China [18].

5.2. Spatial Factors Influencing the Success of LCPs in Jiangsu Province

Figure 8 shows that the clustering of the newly increased farmland quantity and the investment amount were evenly distributed. However, the spatial distribution consistency of the investment fund and reserve land for farmland was relatively poor, showing different characteristics in the three stages. In general, the enhancement effect of the newly increased farmland quantity and NDVI of LCPs in northern Jiangsu displayed better results as compared to those in central and southern Jiangsu. According to the results of the forward selection and the Monte Carlo test, LCPs of Jiangsu Province in 2001–2005 were mainly influenced by nature and social factors, and were dramatically influenced by economic and policy factors in 2006–2017. Eigenvalues of LCPs were positively correlated with reserve land for the newly increased farmland and were negatively correlated with population density. In general, the larger the farmland reserves, the easier for the region to obtain the LC investment fund, and the more the newly increased farmland quantity [46,62]. Southern Jiangsu displayed more LCPs in 2001–2005. However, it was not the region with abundant farmland reserve resources. The pressure of farmland protection encouraged local governments to take part in LCPs [53]. With a decrease in reserve land resources, the selection of spaces for LCPs moved to the coastal wetland and the Li-Xia river plain area in northern Jiangsu [63]. Since 2006, LC eigenvalues were positively correlated with per capita rural agricultural production and per capita first industrial product. Generally speaking, the less developed the economy, the more the reliability on agriculture, and the more cooperatively farmers take part in LCPs [64]. Due to the relatively undeveloped economy in northern Jiangsu, people in this place were more interested in taking part in LCPs, as compared to citizens in southern Jiangsu and middle Jiangsu. LC eigenvalues were positively correlated with fiscal transfer payment income. This result indicated that LCPs promoted grain production and were facilitated by policy factors [46].

5.3. Uncertainty of Land Consolidation Implementation and Policy Implementation

LC practices showed that the real effect of LC implementation was relatively good in Jiangsu. However, some problems were present mainly due to incapable activities of local governments and nonstandard operations, such as excessively pursuing newly increased farmland quantity, which resulted in the reduction of small patches of pools and woodland with important ecological functions [7,65,66]. Some local governments, whose economy was reduced, misused LC funds. All these acts negatively influenced the LCPs’ implementation process and also generated negative emotions in the citizens [61]. Some governments strongly promoted land transferring by LC. This also caused some protests in regions where farmers had no farmland or a life in the urban city [53]. In addition, in the process of LC implementation, different inconsistencies occurred between investment methods, the amount of increased farmland, and the most thoroughly used developable land reserve. LCPs must comply with LC planning and safeguard its highly efficient implementation. Thus, in the present research, a feasible LC implementation framework was proposed (Figure 10).
(1)
Preparation stage. LCPs are applied to local people’s government (LPG) according to the willingness of farmer households. The implementation of this program is determined by two aspects. First, it is necessary to evaluate the management and implementation ability of the local people’s government. Second, the newly increased farmland area increased by this program is evaluated by the third party, in this case, the Technical and Service Company (TSC). If two evaluations pass, this program may also pass, and the notice of the land consolidation project (LCP) is issued in order to begin the calling for public tenders in the planning stage. Otherwise, this program is stopped.
(2)
The planning stage. Before calling for public tenders, the local government organizes the meetings, and the requirement and expectation of people toward the LCP is analyzed [67,68]. In addition, the implementation feasibility of the LCP is discussed, including the following four aspects: (a) first, the increased farmland area list is organized; (b) second, the construction project planning is provided; (c) third, a land evaluation scheme is generated and land protection planning is drafted; (d) fourth, the investment cost of the LCP is evaluated. After the feasibility evaluation, the LCP’s planning and design are conducted, including LC, the irrigation and drainage system, road greening, and other engineering details. If the LCP’s design and planning satisfies the condition of residence and is reasonable, LCP implementation is carried out. Otherwise, replanning and redesigning are recommended.
(3)
Stage of implementation and late implementation. After the project is assigned to a construction corporation, the LCP-defined plan and design are carried out. Activities are supervised by the professional engineering construction supervision company along with the leading group that includes the local people’s bank (LPB), LPG, and farmer representatives. After LC engineering is finished, an LCP inspection is carried out, including financial auditing, the inspection of the LCP, and reserve land for the newly increased farmland. If the inspection is approved, new data is sent to the land cadastral system and is registered in the land registration office. Otherwise, it is withdrawn for further improvement, which is not the end, as it still needs to carry out land allocation and calling for tenders organized by the leading group, including the maintenance of facilities, the agricultural productivity monitoring after LC, and the fertilizer application of the newly increased farmland. Thereafter, the accomplished LC engineering is considered complete and sustainable.

6. Conclusions

LC represents an important procedure to increase farmland quantity and increase farmland quality and productivity. The understanding of the real effect of LC implementation is important to alleviate farmland loss and safeguard national grain safety. Since 2001, cumulative consolidated farmland in China has exceeded 60 million hectares. However, there is no objective evaluation of the effects of its implementation. Thus, 1064 LCPs implemented in Jiangsu Province from 2001 to 2017 were systematically studied. We have reached the following conclusions:
(1)
LCPs in Jiangsu Province displayed a significant stage preference and complied with the objective orientation of the national LC policy. LCPs paid great attention to the newly increased farmland quantity in 2001–2005, changed to enhancing grain productivity in 2006–2001, and finally transformed to farmland ecological construction after 2012.
(2)
Considering the consistency coefficient of the newly increased farmland quantity and the investment fund, as well as the investment fund and reserve land for farmland and the relationship between the LC rate and the increasing rate of NDVI, data have indicated a certain spatial mismatching for the former, whereas the efficiency of the latter was good. Thus, in general, the real effect of LC implementation was not very good.
(3)
The initial stage of LC implementation in the Jiangsu Province was mainly influenced by natural and societal factors including reserve land for the newly increased farmland (RLNIF) and population density (PD). The late stage was mainly influenced by economic and policy factors such as agricultural production per capita (APPC), degree of farmland fragmentation (DFF), proportion of the first industry to GDP (PFIPDGP), and the income fiscal transferring payment (IFTP), among others.
In the future, ecological theory and green development were considered in each segment of LC. Ecological environmental protection and recovery were strengthened. Frequent adjustment of national policy objectives was avoided. Detailed verification, experimental pilot, and step-by-step implementation were performed before issuing the new policy. Otherwise, land consolidation practice was difficult to maintain along with policy adjustments. Thus, in this study, a new LC implementation framework was proposed. This framework can be implemented in the future for top-level design, planning, and management of LC policy in China and other countries around the world.

Author Contributions

Conceptualization, F.C.; Data curation, X.G. and X.S.; Funding acquisition, F.C.; Investigation, J.M. and H.Y.; Methodology, Y.S. and H.Y.; Project administration, F.C.; Software, X.G. and Y.S.; Supervision, F.C. Visualization, G.-J.L.; Writing—original draft, Y.S. and J.M.; Writing—review and editing, G.-J.L. and F.C. All authors have read and agreed to the published version of the manuscript.

Funding

This work was supported by the Key Projects in the National Science & Technology Pillar Program during the Twelfth Five-year Plan Period (2015BAD06B02). In addition, the authors would like to thank Institute of Land Surveying and Planning of Jiangsu for the support during the research. There is no conflict of interest in this manuscript.

Institutional Review Board Statement

Not applicable.

Informed Consent Statement

Not applicable.

Data Availability Statement

Not applicable.

Acknowledgments

Not applicable.

Conflicts of Interest

The authors declare no conflict of interest.

References

  1. Chen, F.; Yu, M.; Zhu, F.; Shen, C.; Zhang, S.; Yang, Y. Rethinking Rural Transformation Caused by Comprehensive Land Consolidation: Insight from Program of Whole Village Restructuring in Jiangsu Province, China. Sustainability 2018, 10, 2029. [Google Scholar] [CrossRef] [Green Version]
  2. Jiang, Y.; Tang, Y.; Long, H.; Deng, W. Land consolidation: A comparative research between Europe and China. Land Use Policy 2022, 112, 105790. [Google Scholar] [CrossRef]
  3. Yu, M.; Yang, Y.; Chen, F.; Zhu, F.; Qu, J.; Zhang, S. Response of agricultural multifunctionality to farmland loss under rapidly urbanizing processes in Yangtze River Delta, China. Sci. Total Environ. 2019, 666, 1–11. [Google Scholar] [CrossRef] [PubMed]
  4. Tang, H.; Yun, W.; Liu, W.; Sang, L. Structural changes in the development of China’s farmland consolidation in 1998–2017: Changing ideas and future framework. Land Use Policy 2019, 89, 104212. [Google Scholar] [CrossRef]
  5. Yan, J.; Xia, F.; Bao, H.X.H. Strategic planning framework for land consolidation in China: A top-level design based on SWOT analysis. Habitat Int. 2015, 48, 46–54. [Google Scholar] [CrossRef] [Green Version]
  6. Li, X.; Yu, M.; Ma, J.; Luo, Z.; Chen, F.; Yang, Y. Identifying the Relationship between Soil Properties and Rice Growth for Improving Consolidated Land in the Yangtze River Delta, China. Sustainability 2018, 10, 3072. [Google Scholar] [CrossRef] [Green Version]
  7. Zhang, Q.; Zhang, T. Land Consolidation Design Based on an Evaluation of Ecological Sensitivity. Sustainability 2018, 10, 3736. [Google Scholar] [CrossRef] [Green Version]
  8. Liu, Y.; Li, J.; Yang, Y. Strategic adjustment of land use policy under the economic transformation. Land Use Policy 2018, 74, 5–14. [Google Scholar] [CrossRef]
  9. Jiang, Y.; Long, H.; Tang, Y.; Deng, W.; Chen, K.; Zheng, Y. The impact of land consolidation on rural vitalization at village level: A case study of a Chinese village. J. Rural Stud. 2021, 86, 485–496. [Google Scholar] [CrossRef]
  10. Lyu, L.; Gao, Z.; Long, H.; Wang, X.; Fan, Y. Farmland Use Transition in a Typical Farming Area: The Case of Sihong County in the Huang-Huai-Hai Plain of China. Land 2021, 10, 347. [Google Scholar] [CrossRef]
  11. Zeng, S.; Zhu, F.; Chen, F.; Yu, M.; Zhang, S.; Yang, Y. Assessing the Impacts of Land Consolidation on Agricultural Technical Efficiency of Producers: A Survey from Jiangsu Province, China. Sustainability 2018, 10, 2490. [Google Scholar] [CrossRef] [Green Version]
  12. Jin, X.; Shao, Y.; Zhang, Z.; Resler, L.M.; Campbell, J.B.; Chen, G.; Zhou, Y. The evaluation of land consolidation policy in improving agricultural productivity in China. Sci. Rep. 2017, 7, 2792. [Google Scholar] [CrossRef] [Green Version]
  13. Zhou, Y.; Li, X.; Liu, Y. Cultivated land protection and rational use in China. Land Use Policy 2021, 106, 105454. [Google Scholar] [CrossRef]
  14. Jiang, G.; Zhang, R.; Ma, W.; Zhou, D.; Wang, X.; He, X. Cultivated land productivity potential improvement in land consolidation schemes in Shenyang, China: Assessment and policy implications. Land Use Policy 2017, 68, 80–88. [Google Scholar] [CrossRef]
  15. Xie, X.; Zhang, A.; Cai, Y.; Zhang, Y. How government-led land consolidation efforts achieve grain production stability? An empirical analysis in Hubei Province, China. Land Use Policy 2020, 97, 104756. [Google Scholar] [CrossRef]
  16. Tuyen Quang, T.; Huong, V. The impact of land fragmentation on food security in the North Central Coast, Vietnam. Asia Pac. Policy Stud. 2021, 8, 327–345. [Google Scholar]
  17. Huang, J.; Xiang, C.; Jia, X.; Hu, R. Impacts of training on farmers’ nitrogen use in maize production in Shandong, China. J. Soil Water Conserv. 2012, 67, 321–327. [Google Scholar] [CrossRef] [Green Version]
  18. Long, H. Land use policy in China: Introduction. Land Use Policy 2014, 40, 1–5. [Google Scholar] [CrossRef]
  19. Abubakari, Z.; van der Molen, P.; Bennett, R.M.; Kuusaana, E.D. Land consolidation, customary lands, and Ghana’s Northern Savannah Ecological Zone: An evaluation of the possibilities and pitfalls. Land Use Policy 2016, 54, 386–398. [Google Scholar] [CrossRef]
  20. Ntihinyurwa, P.D.; de Vries, W.T. Farmland Fragmentation, Farmland Consolidation and Food Security: Relationships, Research Lapses and Future Perspectives. Land 2021, 10, 129. [Google Scholar] [CrossRef]
  21. Asiama, K.O.; Voss, W.; Bennett, R.; Rubanje, I. Land consolidation activities in Sub-Saharan Africa towards the agenda 2030: A tale of three countries. Land Use Policy 2021, 101, 105140. [Google Scholar] [CrossRef]
  22. Zhong, L.; Wang, J.; Zhang, X.; Ying, L.; Zhu, C. Effects of agricultural land consolidation on soil conservation service in the Hilly Region of Southeast China - Implications for land management. Land Use Policy 2020, 95, 104637. [Google Scholar] [CrossRef]
  23. Guo, B.; Fang, Y.; Jin, X.; Zhou, Y. Monitoring the effects of land consolidation on the ecological environmental quality based on remote sensing: A case study of Chaohu Lake Basin, China. Land Use Policy 2020, 95, 104569. [Google Scholar] [CrossRef]
  24. FAO. The Design of Land Consolidation Pilot Projects in Central and Eastern Europe; FAO: Rome, Italy, 2003. [Google Scholar]
  25. Perrin, C.; Clement, C.; Melot, R.; Nougaredes, B. Preserving Farmland on the Urban Fringe: A Literature Review on Land Policies in Developed Countries. Land 2020, 9, 223. [Google Scholar] [CrossRef]
  26. Harasimowicz, S.; Janus, J.; Bacior, S.; Gniadek, J. Shape and size of parcels and transport costs as a mixed integer programming problem in optimization of land consolidation. Comput. Electron. Agric. 2017, 140, 113–122. [Google Scholar] [CrossRef]
  27. Cheng, L.; Brown, G.; Liu, Y.; Searle, G. An evaluation of contemporary China’s land use policy—The Link Policy: A case study from Ezhou, Hubei Province. Land Use Policy 2020, 91, 104423. [Google Scholar] [CrossRef]
  28. Yang, B.; Wang, Z.; Yao, X.; Chai, J. Assessing the Performance of Land Consolidation Projects in Different Modes: A Case Study in Jianghan Plain of Hubei Province, China. Int. J. Environ. Res. Public Health 2020, 17, 1410. [Google Scholar] [CrossRef] [Green Version]
  29. Zhong, T.; Zheng, W.; Zhao, Y.; Zhang, Y.; Huang, X. Farmland preservation policies in China and their impacts on urban expansion: A multilevel analysis. J. Environ. Plan. Manag. 2021, 64, 2552–2572. [Google Scholar] [CrossRef]
  30. Hu, Y.; Hu, Z.; Cao, S. Theoretical study on Manson-Coffin equation for physically short cracks and lifetime prediction. Sci. China-Technol. Sci. 2012, 55, 34–42. [Google Scholar] [CrossRef]
  31. Liu, C.; Xue, S.; Wu, Y. Ecological environmental effects of land consolidation: Mechanism of action and application path. J. Appl. Ecol. 2019, 30, 685–693. [Google Scholar]
  32. Wang, R.; Tan, R. Patterns of revenue distribution in rural residential land consolidation in contemporary China: The perspective of property rights delineation. Land Use Policy 2020, 97, 104742. [Google Scholar] [CrossRef]
  33. Tan, R.; Wang, R.; Sedlin, T. Land-Development Offset Policies in the Quest for Sustainability: What Can China Learn from Germany? Sustainability 2014, 6, 3400–3430. [Google Scholar] [CrossRef] [Green Version]
  34. Ying, L.; Dong, Z.; Wang, J.; Mei, Y.; Shen, Z.; Zhang, Y. Rural economic benefits of land consolidation in mountainous and hilly areas of southeast China: Implications for rural development. J. Rural Stud. 2020, 74, 142–159. [Google Scholar] [CrossRef]
  35. Wójcik-Leń, J.; Sobolewska-Mikulska, K.; Sajnóg, N.; Leń, P. The idea of rational management of problematic agricultural areas in the course of land consolidation. Land Use Policy 2018, 78, 36–45. [Google Scholar] [CrossRef]
  36. Wang, R.; Tan, R. Rural Renewal of China in the Context of Rural-Urban Integration: Governance Fit and Performance Differences. Sustainability 2018, 10, 393. [Google Scholar] [CrossRef] [Green Version]
  37. Zhou, Y.; Li, Y.; Xu, C. Land consolidation and rural revitalization in China: Mechanisms and paths. Land Use Policy 2020, 91, 104379. [Google Scholar] [CrossRef]
  38. Li, P.; Chen, Y.; Hu, W.; Li, X.; Yu, Z.; Liu, Y. Possibilities and requirements for introducing agri-environment measures in land consolidation projects in China, evidence from ecosystem services and farmers’ attitudes. Sci. Total Environ. 2019, 650, 3145–3155. [Google Scholar] [CrossRef]
  39. Wang, Q.; Zhang, M.; Cheong, K.-C. Stakeholder perspectives of China’s land consolidation program: A case study of Dongnan Village, Shandong Province. Habitat Int. 2014, 43, 172–180. [Google Scholar] [CrossRef]
  40. Shi, Y.; Cao, X.; Fu, D.; Wang, Y. Comprehensive Value Discovery of Land Consolidation Projects: An Empirical Analysis of Shanghai, China. Sustainability 2018, 10, 2039. [Google Scholar] [CrossRef] [Green Version]
  41. Jin, X.; Xiang, X.; Guan, X.; Wu, X.; Bai, Q.; Zhou, Y. Assessing the relationship between the spatial distribution of land consolidation projects and farmland resources in China, 2006–2012. Food Secur. 2017, 9, 889–905. [Google Scholar] [CrossRef]
  42. Zhang, B.; Sun, P.; Jiang, G.; Zhang, R.; Gao, J. Rural land use transition of mountainous areas and policy implications for land consolidation in China. J. Geogr. Sci. 2019, 29, 1713–1730. [Google Scholar] [CrossRef] [Green Version]
  43. Qu, Y.; Jiang, G.H.; Li, Z.; Tian, Y.; Wei, S. Understanding rural land use transition and regional consolidation implications in China. Land Use Policy 2019, 82, 742–753. [Google Scholar] [CrossRef]
  44. Wang, Y.; Li, Y. Promotion of degraded land consolidation to rural poverty alleviation in the agro-pastoral transition zone of northern China. Land Use Policy 2019, 88, 104114. [Google Scholar] [CrossRef]
  45. Zhang, Q.; Sun, Z.; Wu, F.; Deng, X. Understanding rural restructuring in China: The impact of changes in labor and capital productivity on domestic agricultural production and trade. J. Rural Stud. 2016, 47, 552–562. [Google Scholar] [CrossRef]
  46. Liu, Y.; Yang, R.; Li, Y. Potential of land consolidation of hollowed villages under different urbanization scenarios in China. J. Geogr. Sci. 2013, 23, 503–512. [Google Scholar] [CrossRef]
  47. Liu, J.; Jin, X.; Xu, W.; Sun, R.; Han, B.; Yang, X.; Gu, Z.; Xu, C.; Sui, X.; Zhou, Y. Influential factors and classification of cultivated land fragmentation, and implications for future land consolidation: A case study of Jiangsu Province in eastern China. Land Use Policy 2019, 88, 104185. [Google Scholar] [CrossRef]
  48. Li, Y.; Wu, W.; Liu, Y. Land consolidation for rural sustainability in China: Practical reflections and policy implications. Land Use Policy 2018, 74, 137–141. [Google Scholar] [CrossRef]
  49. Ge, X.; Zhu, F.; Yang, Y.; Liu, G.; Chen, F. Probing influence factors of implementation patterns for sustainable land consolidation: Insights from seventeen years of practice in Jiangsu Province, China. Sustainability 2020, 12, 3576. [Google Scholar] [CrossRef]
  50. Liu, Y.S.; Wang, J.Y.; Long, H.L. Analysis of arable land loss and its impact on rural sustainability in Southern Jiangsu Province of China. J. Environ. Manag. 2010, 91, 646–653. [Google Scholar] [CrossRef]
  51. Du, X.; Zhang, X.; Jin, X. Assessing the effectiveness of land consolidation for improving agricultural productivity in China. Land Use Policy 2018, 70, 360–367. [Google Scholar] [CrossRef]
  52. Jiang, G.; Wang, X.; Yun, W.; Zhang, R. A new system will lead to an optimal path of land consolidation spatial management in China. Land Use Policy 2015, 42, 27–37. [Google Scholar]
  53. Tang, X.; Pan, Y.; Liu, Y. Analysis and demonstration of investment implementation model and paths for China’s cultivated land consolidation. Appl. Geogr. 2017, 82, 24–34. [Google Scholar] [CrossRef]
  54. Zhou, Y.; Guo, L.; Liu, Y. Land consolidation boosting poverty alleviation in China: Theory and practice. Land Use Policy 2019, 82, 339–348. [Google Scholar] [CrossRef]
  55. Zhang, D.; Agterberg, F. Modified Weights-of-Evidence Modeling with Example of Missing Geochemical Data. Complexity 2018, 7945960. [Google Scholar] [CrossRef]
  56. Zhang, D.; Jia, Q.; Xu, X.; Yao, S.; Chen, H.; Hou, X.; Zhang, J.; Jin, G. Assessing the coordination of ecological and agricultural goals during ecological restoration efforts: A case study of Wuqi County, Northwest China. Land Use Policy 2019, 82, 550–562. [Google Scholar] [CrossRef]
  57. Wang, X.; Hu, S. The consistency of the nearest neighbor estimator of the density function based on WOD samples. J. Math. Anal. Appl. 2015, 429, 497–512. [Google Scholar] [CrossRef]
  58. He, C.; Liu, Z.; Xu, M.; Ma, Q.; Dou, Y. Urban expansion brought stress to food security in China: Evidence from decreased cropland net primary productivity. Sci. Total Environ. 2017, 576, 660–670. [Google Scholar] [CrossRef]
  59. Sherlund, S.M.; Barrett, C.B.; Adesina, A.A. Smallholder technical efficiency controlling for environmental production conditions. J. Dev. Econ. 2002, 69, 85–101. [Google Scholar] [CrossRef]
  60. Zhang, Z.; Zhao, W.; Gu, X. Changes resulting from a land consolidation project (LCP) and its resource–environment effects: A case study in Tianmen City of Hubei Province, China. Land Use Policy 2014, 40, 74–82. [Google Scholar] [CrossRef]
  61. Zhou, Y.; Guo, Y.; Liu, Y.; Wu, W.; Li, Y. Targeted poverty alleviation and land policy innovation: Some practice and policy implications from China. Land Use Policy 2018, 74, 53–65. [Google Scholar] [CrossRef]
  62. Di Falco, S.; Penov, I.; Aleksiev, A.; van Rensburg, T.M. Agrobiodiversity, farm profits and land fragmentation: Evidence from Bulgaria. Land Use Policy 2010, 27, 763–771. [Google Scholar] [CrossRef]
  63. Long, Y.; Jin, X.; Yang, X.; Zhou, Y. Reconstruction of historical arable land use patterns using constrained cellular automata: A case study of Jiangsu, China. Appl. Geogr. 2014, 52, 67–77. [Google Scholar] [CrossRef]
  64. Rahman, S.; Rahman, M. Impact of land fragmentation and resource ownership on productivity and efficiency: The case of rice producers in Bangladesh. Land Use Policy 2009, 26, 95–103. [Google Scholar] [CrossRef] [Green Version]
  65. Zhou, J.; Cao, X. What is the policy improvement of china’s land consolidation? Evidence from completed land consolidation projects in Shaanxi Province. Land Use Policy 2020, 99, 104847. [Google Scholar] [CrossRef]
  66. Crecente, R.; Alvarez, C.; Fra, U. Economic, social and environmental impact of land consolidation in Galicia. Land Use Policy 2002, 19, 135–147. [Google Scholar] [CrossRef]
  67. Niroula, G.S.; Thapa, G.B. Impacts and causes of land fragmentation, and lessons learned from land consolidation in South Asia. Land Use Policy 2005, 22, 358–372. [Google Scholar] [CrossRef]
  68. Wójcik-Leń, J.; Leń, P.; Sobolewska-Mikulska, K. The proposed algorithm for identifying agricultural problem areas for the needs of their reasonable management under land consolidation works. Comput. Electron. Agric. 2018, 152, 333–339. [Google Scholar] [CrossRef]
Figure 1. Change of policy and major characteristic of land consolidation in China during the past two decades.
Sustainability 13 13891 g001
Figure 2. The study area: (a) Sampling points of LCPs; (b) Location in China; (c) Data of LCPs; (d) Land consolidation scale of each county; (e) Amount of investment of each county; (f) Newly-increased farmland area of each county.
Sustainability 13 13891 g002
Figure 3. Research framework of this study.
Sustainability 13 13891 g003
Figure 4. The whole characteristic (a) and internal investment structure change (b) of LCPs in Jiangsu Province from 2001 to 2017.
Sustainability 13 13891 g004
Figure 5. Spatial pattern of LCPs in different stages: (ac) represents CS, AI, and NIFA, respectively; 1, 2, and 3 represents the periods of 2001–2005, 2006–2011, and 2012–2017, respectively.
Sustainability 13 13891 g005
Figure 6. The spatial clustering pattern change of LCPs in Jiangsu Province: (ac) represents CS, AI, and NIFA, respectively; 1, 2, and 3 represents 2001–2005, 2006–2011, and 2012–2017, respectively. No number represents 2001–2017.
Sustainability 13 13891 g006
Figure 7. The consistency coefficients between: (a) the newly increased farmland quantity and the investment amount of LC; (b) the investment amount and reserve land for the newly increased farmland.
Sustainability 13 13891 g007
Figure 8. The first stage (a) and overall (b) cumulative LC ratio, the first stage (c) and overall (d) cumulative NDVI increasing ratio, and correlation (e) between LC ratio and NDVI increasing ratio in Jiangsu Province.
Sustainability 13 13891 g008
Figure 9. RDA ordination plot showing the relationship between eigenvalues of LCPs and environmental factors at different time periods.
Sustainability 13 13891 g009
Figure 10. Framework for the future implementation of LC in China.
Sustainability 13 13891 g010
Table 1. Redundancy analysis data.
FactorsIndicatorsUnitMeaning
Natural conditionsNatural quality grade of farmland, NQGF-Indicates the degree of difficulty of LCPs. The lower the quality grade, the more difficult LC was.
Reserve land for newly increased farmland, RLNIFhaRepresents the reserve land for ANIF of LC. The larger the reserve land, the easier the implementation of LCPs.
Degree of farmland fragmentation, DFFHousehold/haThe higher the fragmentation degree, the more the LC was needed.
Grain productivity, GPkg/haThe lower GP, the more the LC was required by the government.
Intensity of fertilizer application, IFAkg/haThe more IFA, the more LC was needed.
Social conditionsPer capita area of farmland, PCAFha/personThe smaller PCAF, the larger the farmland pressure, and the more LC was needed to increase farmland areas.
Area of newly increased construction land, ANICLha/yearThe larger ANICL, the more the non-agricultural land transferred to construction land, the more LC was needed to increase farmland.
Population density, PDperson/km2The more PD, the higher the stress of the farmland resource, and the more ANIF was needed to increase GP.
Proportion of rural to total population, PRTP%The larger PRTP, the higher the rural population, and the more LC was needed to promote the economy.
Economic conditionsLand leasing revenue, LLR104CNY/yearThe more LLR, the stronger the economic’s ability to carry out LC.
Agricultural production per capital, APPCCNY/yearThe lower APPC, the more LC was needed to increase GP and farmer income.
Second and third industry product per capital, STIPPCCNY/yearThe lower STIPPC, the less developed the economy, the larger the reliability to agriculture, the more LC was needed.
Proportion of first industry product to total GDP, PFIPDGP%The lower PFIPDGP, the less developed the economy, the larger the reliability to agriculture, the more LC was needed.
Policy conditionProportion of agriculture investment to total investment, PAITI%Indicates the emphasizing degree of PAITI; the higher the emphasizing degree, the more LCPs were achieved.
Income of fiscal transfer payment, IFTP108 CNYRepresents the caring degree of provincial government on local governments.
Amount of awards, AAtimesIndicates the importance of local government on LCPs.
Table 2. Moran’s I of spatial self-related coefficient of LCPs of Jiangsu Province in 2001–2017.
PeriodGlobal Moran’s IZ Scorep Value
CSIANIFACSIANIFACSIANIFA
2001–20050.0290.0020.1190.5750.2141.7340.5650.8300.083
2006–20110.2370.1970.2083.5132.9883.0900.0000.0030.002
2012–20170.3910.3480.3065.1674.6404.1630.0000.0000.000
2001–20170.3250.3300.1894.3934.4412.6590.0000.0000.008
Table 3. RDA result of eigenvalues change in land consolidation with all environmental factors.
Axis1234
Eigenvalues0.530.210.060.20
Species–environment correlations0.740.5230.4330.00
Cumulative percentage variance of species data (%)53.074.180.199.9
Cumulative percentage variance of species-environment relation (%)99.4100.0100.0100.0
Sum of all eigenvalues1.00
Sum of all canonical eigenvalues0.74
Significance of all canonical axis0.002
Publisher’s Note: MDPI stays neutral with regard to jurisdictional claims in published maps and institutional affiliations.

