
Experimental Test on Nonuniform Deformation in the Tilted Strata of a Deep Coal Mine


Abstract
:1. Introduction
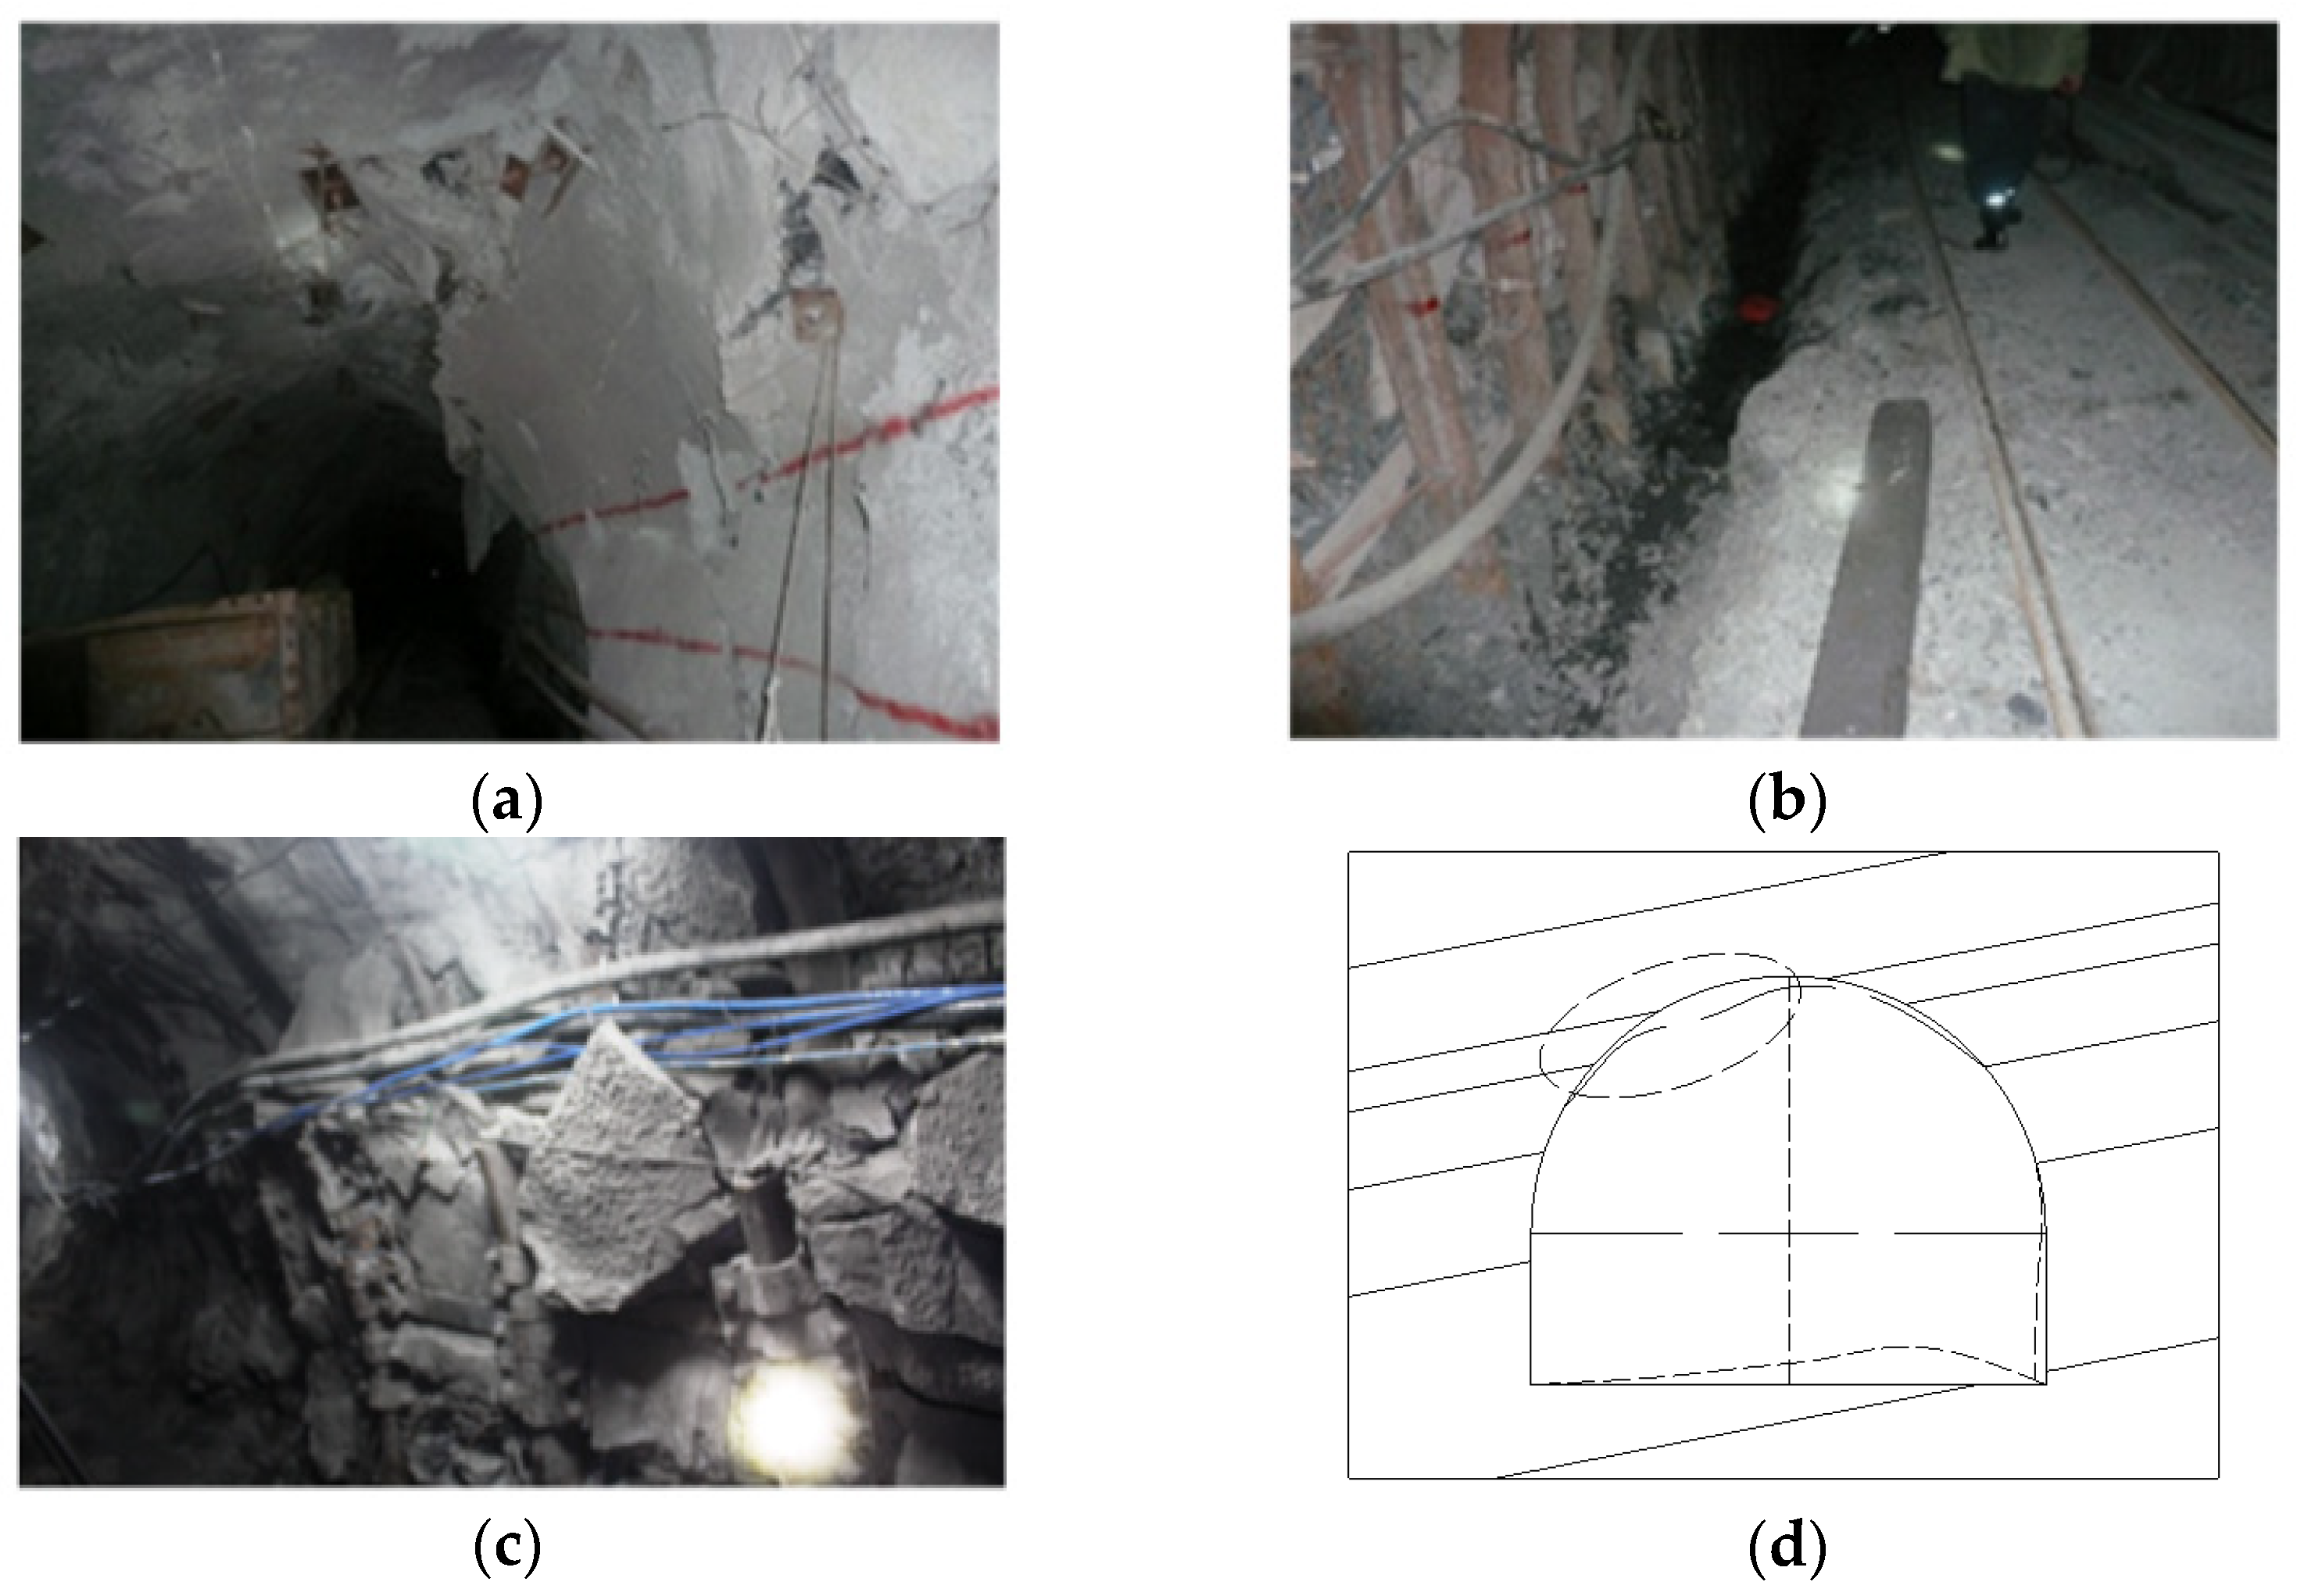
2. Similar Simulation Engineering Background
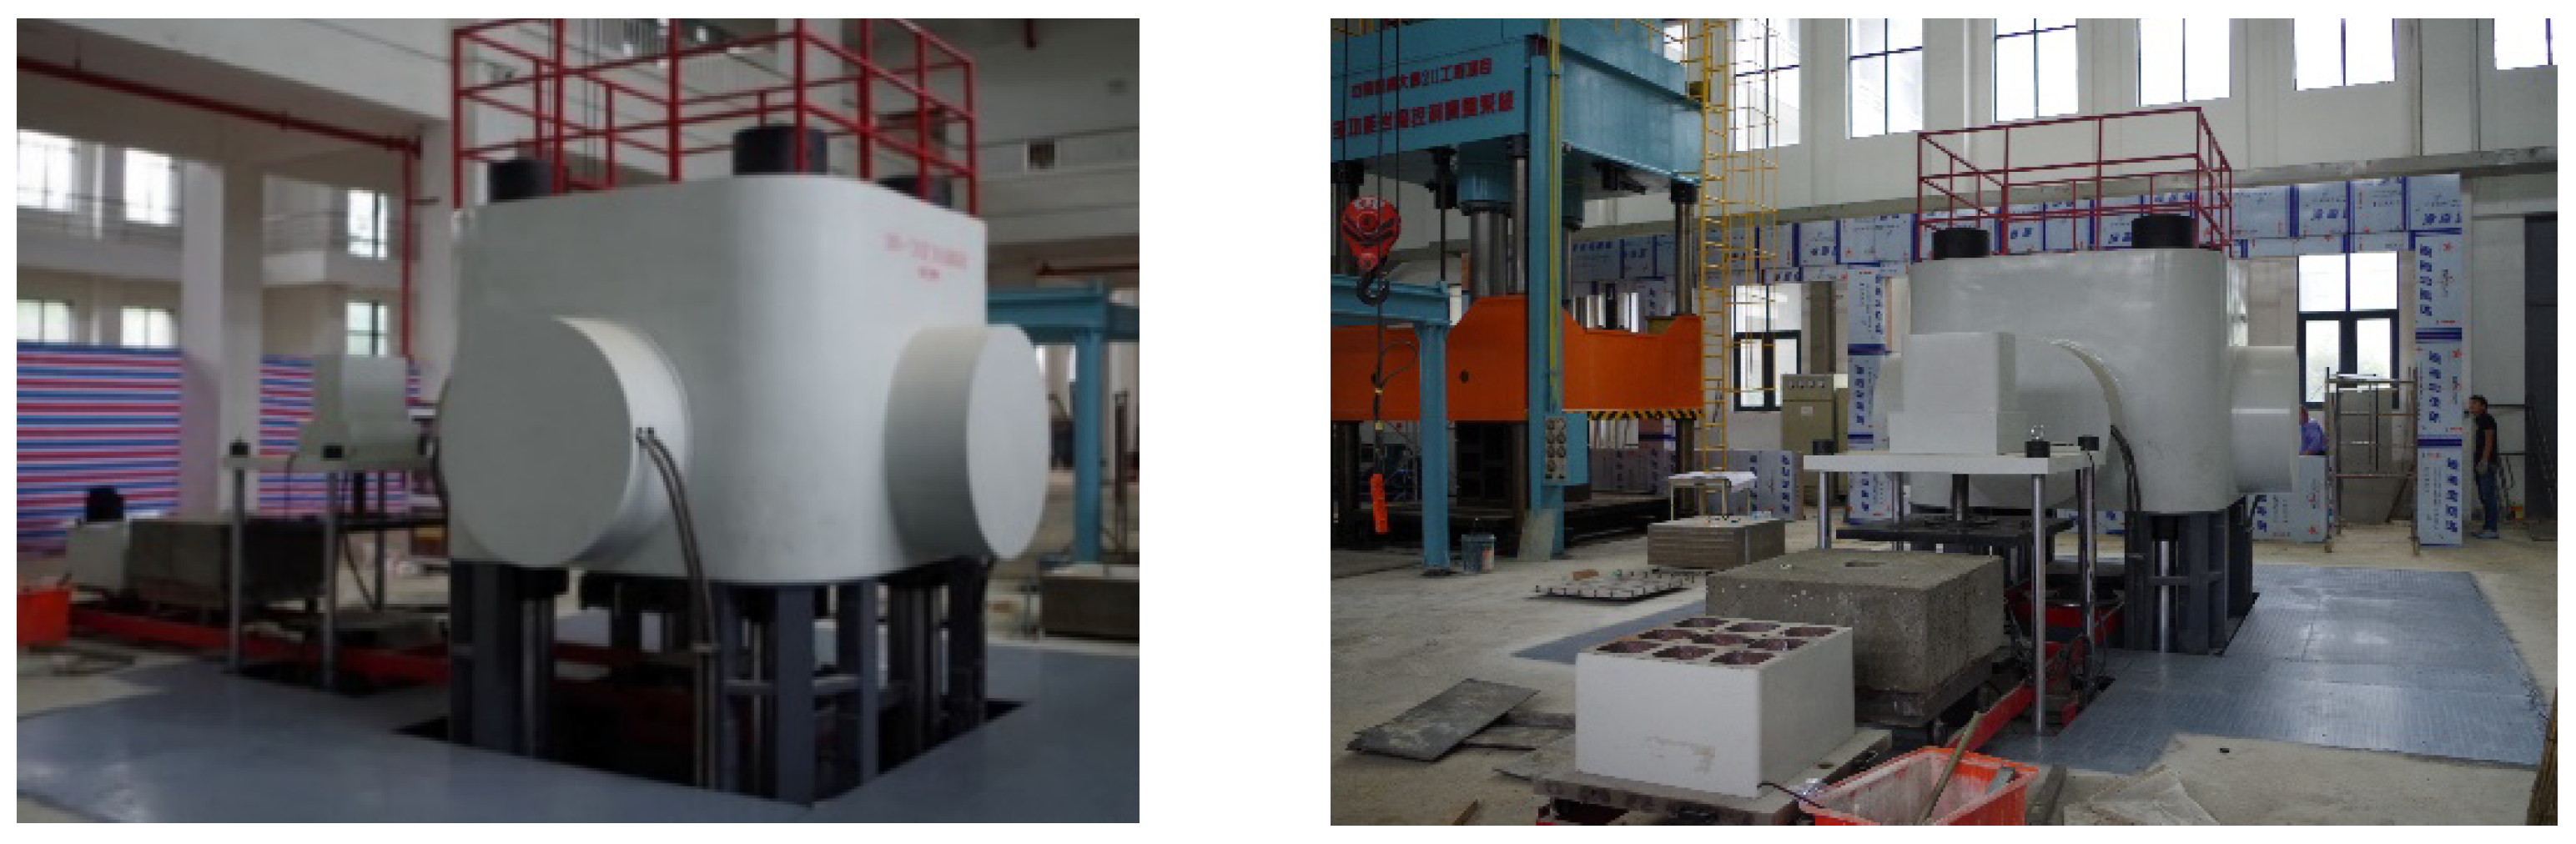
Introduction of Experimental Equipment
3. Experimental Model Making and Experimental Scheme
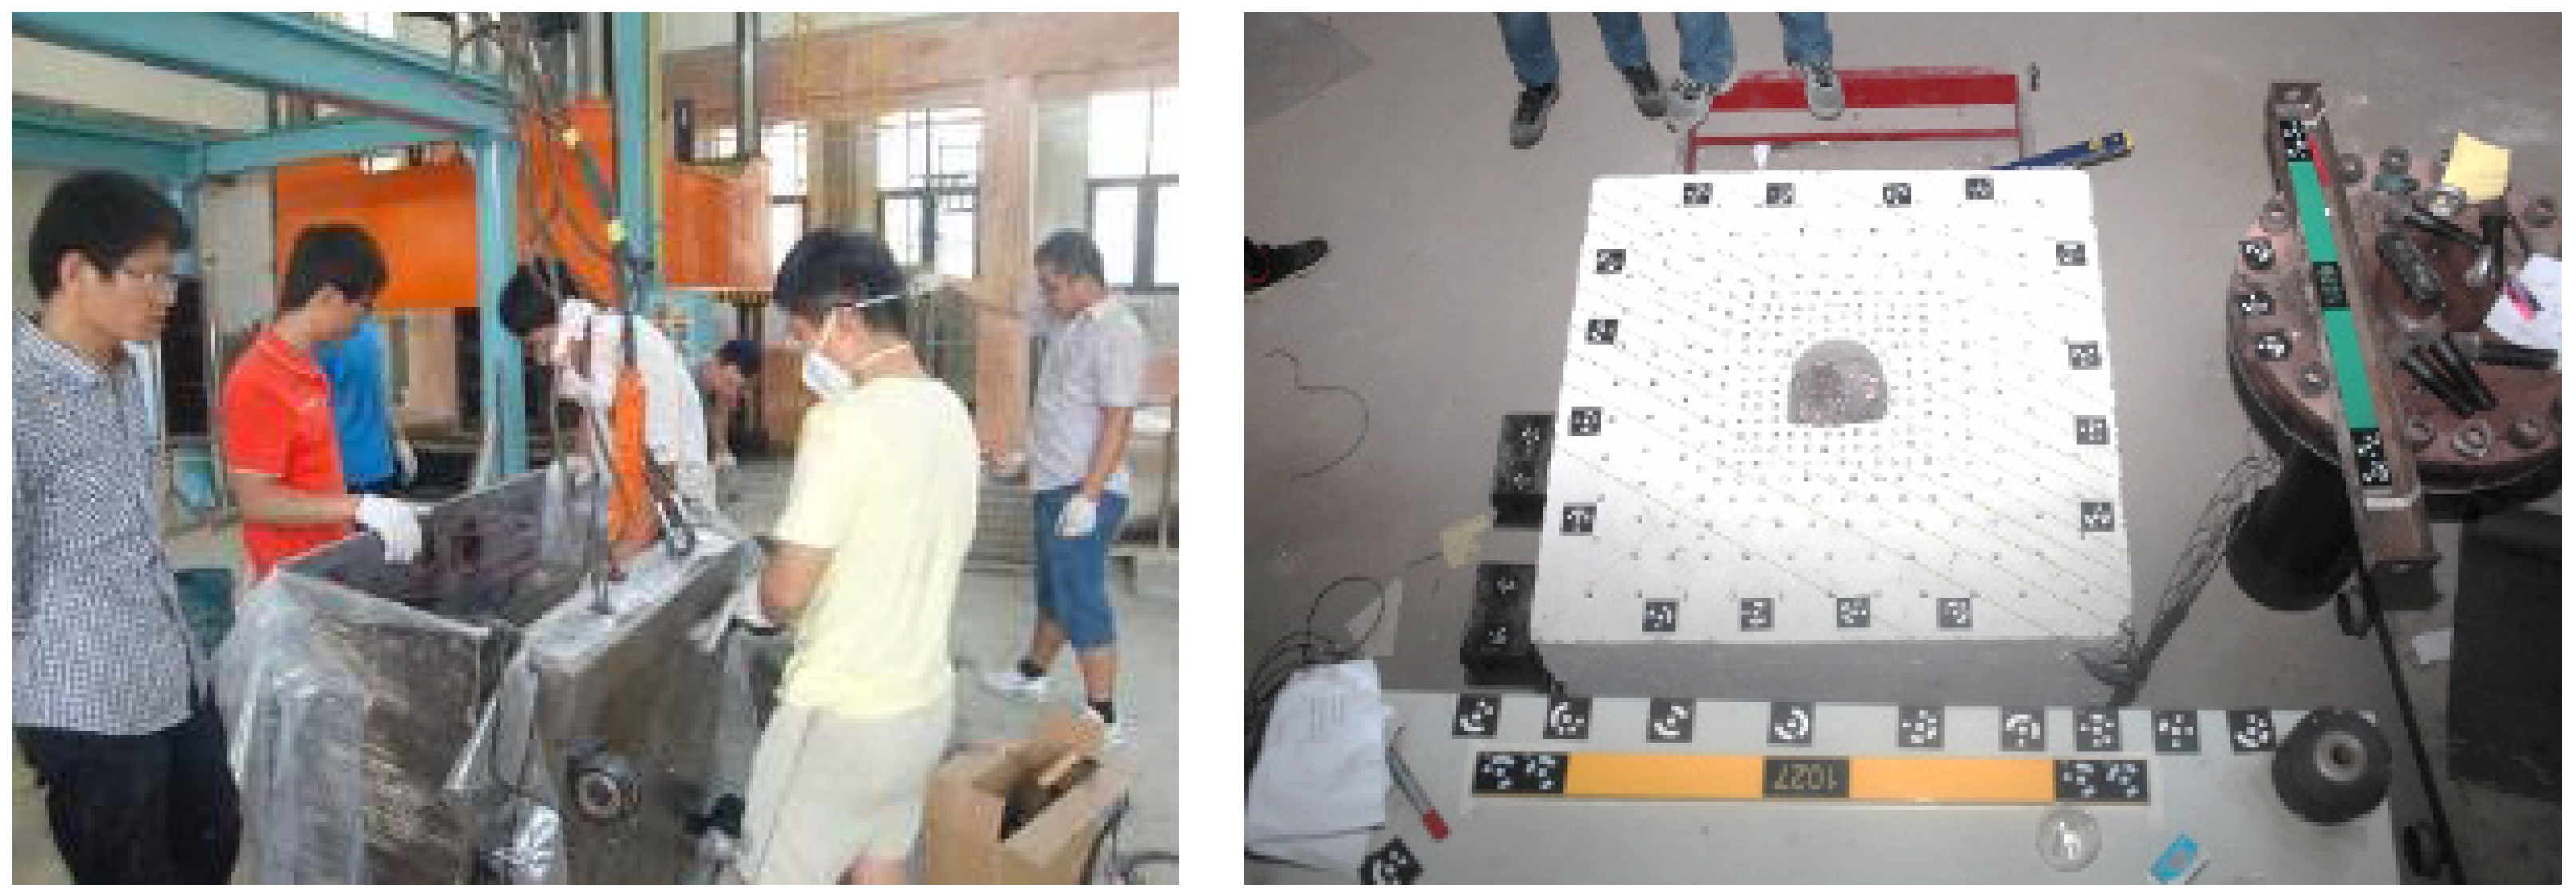
3.1. Introduction of Experimental Equipment
3.2. Experimental Model-Making Process
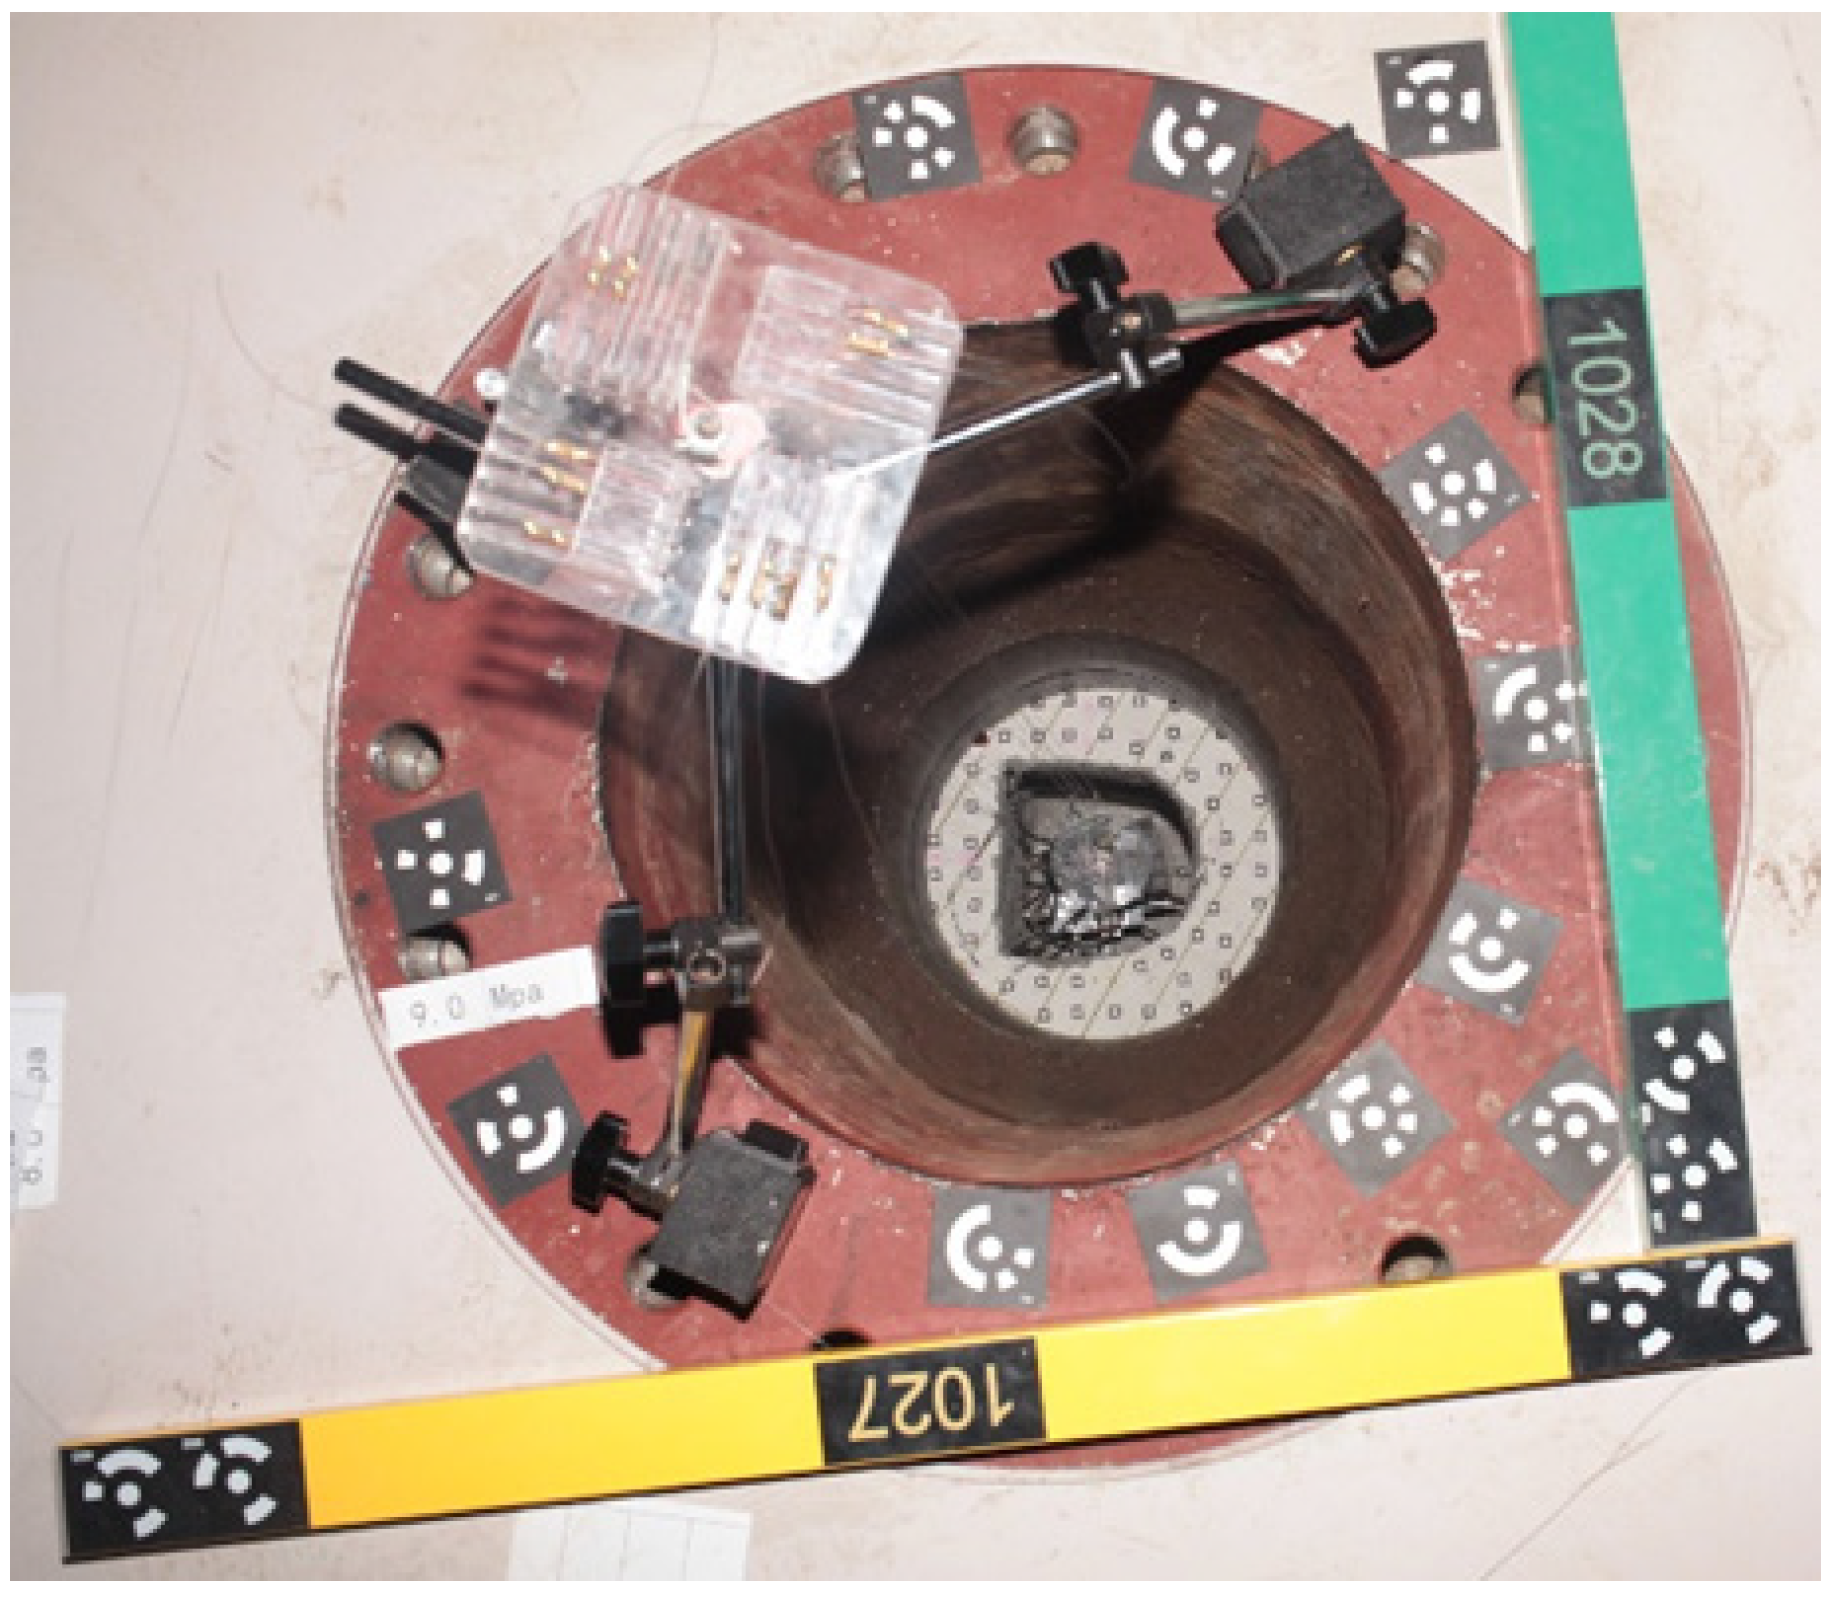
3.3. Experimental Data Acquisition
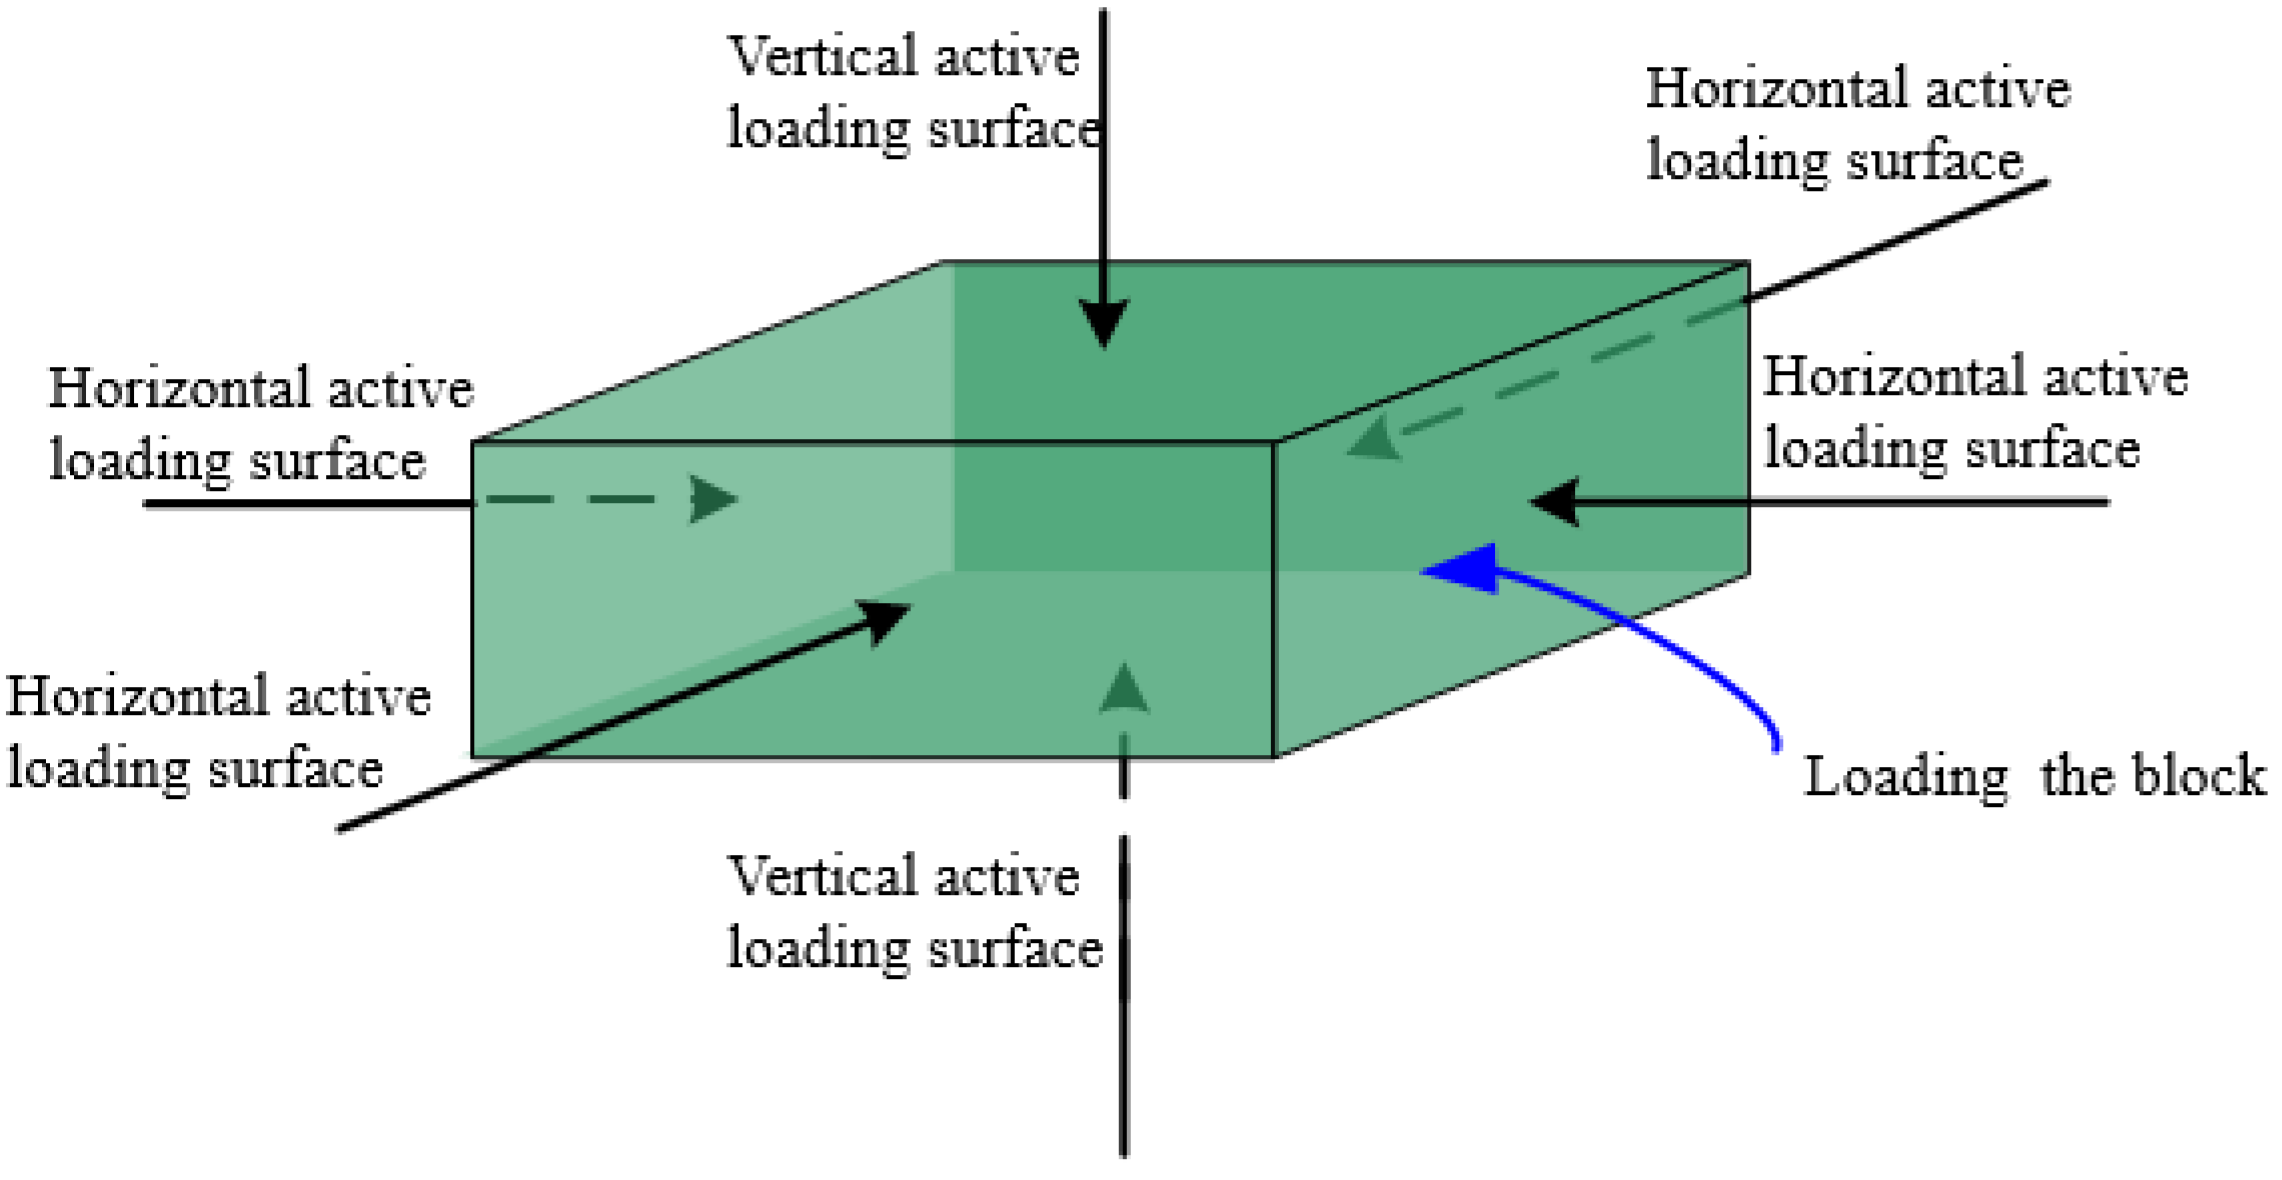
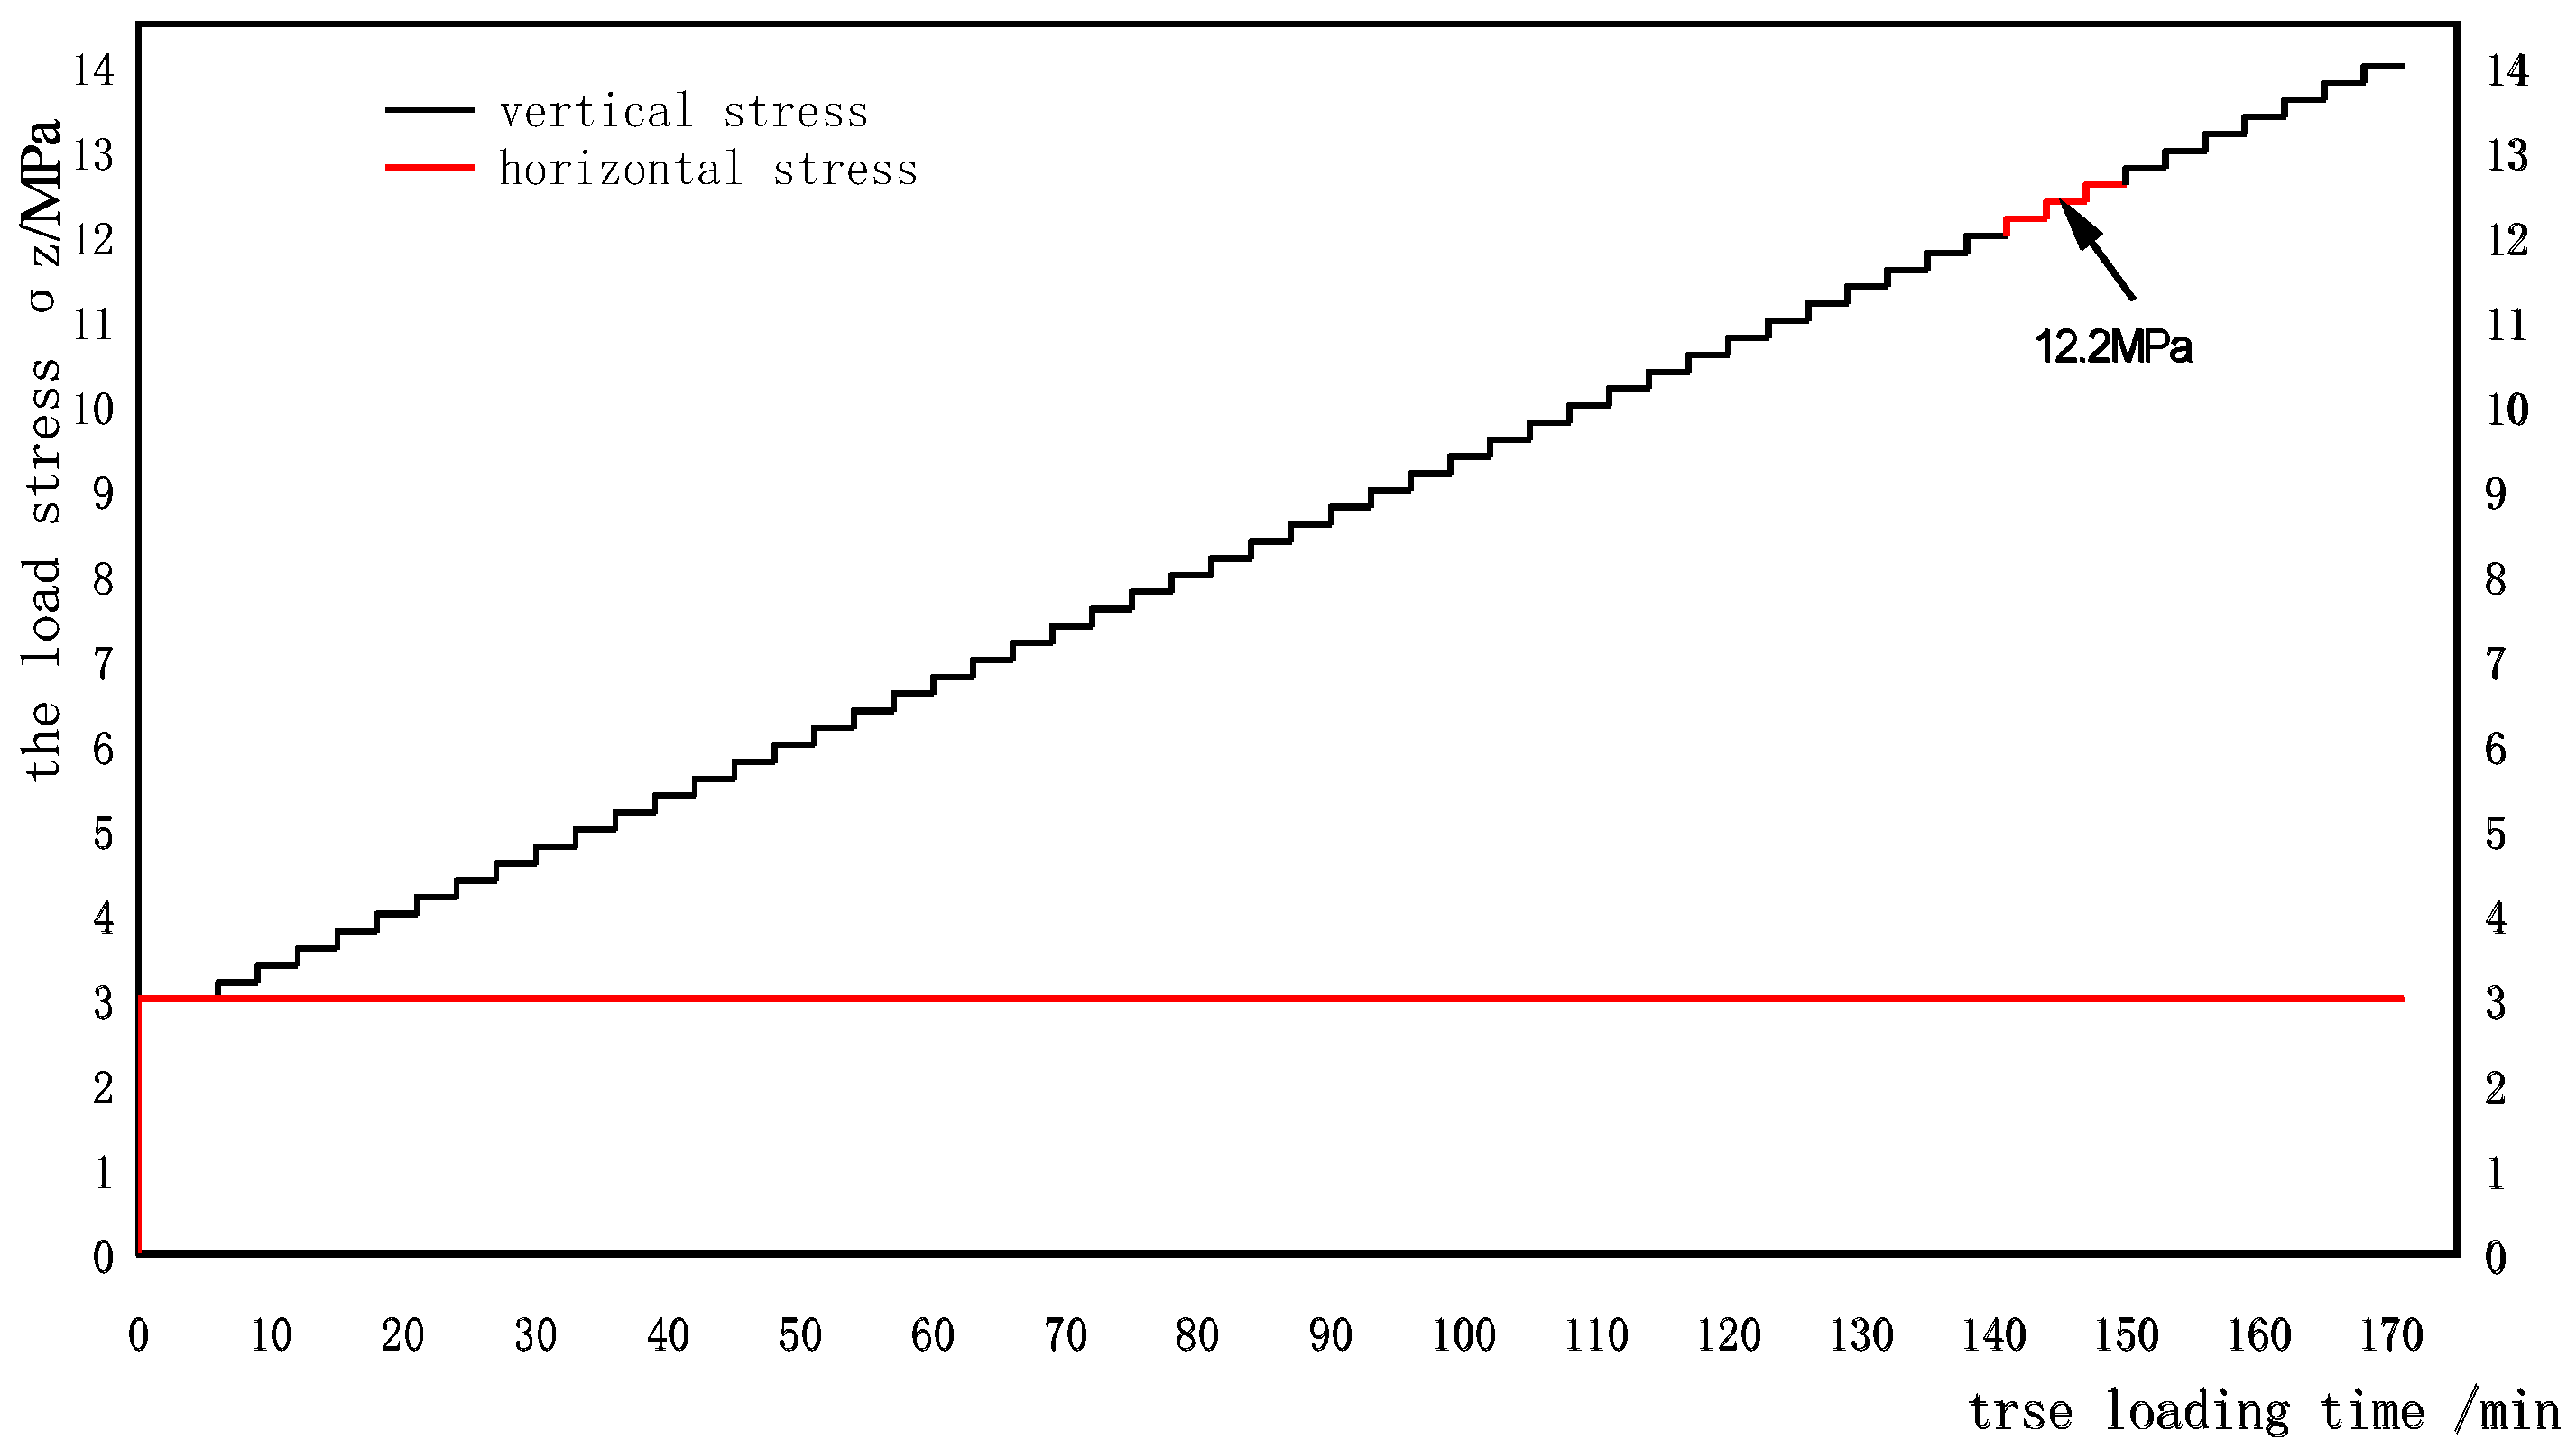
3.4. Experimental Stress-Loading Scheme
4. Analysis of Asymmetric Deformation Characteristics of Roadway-Surrounding Rock
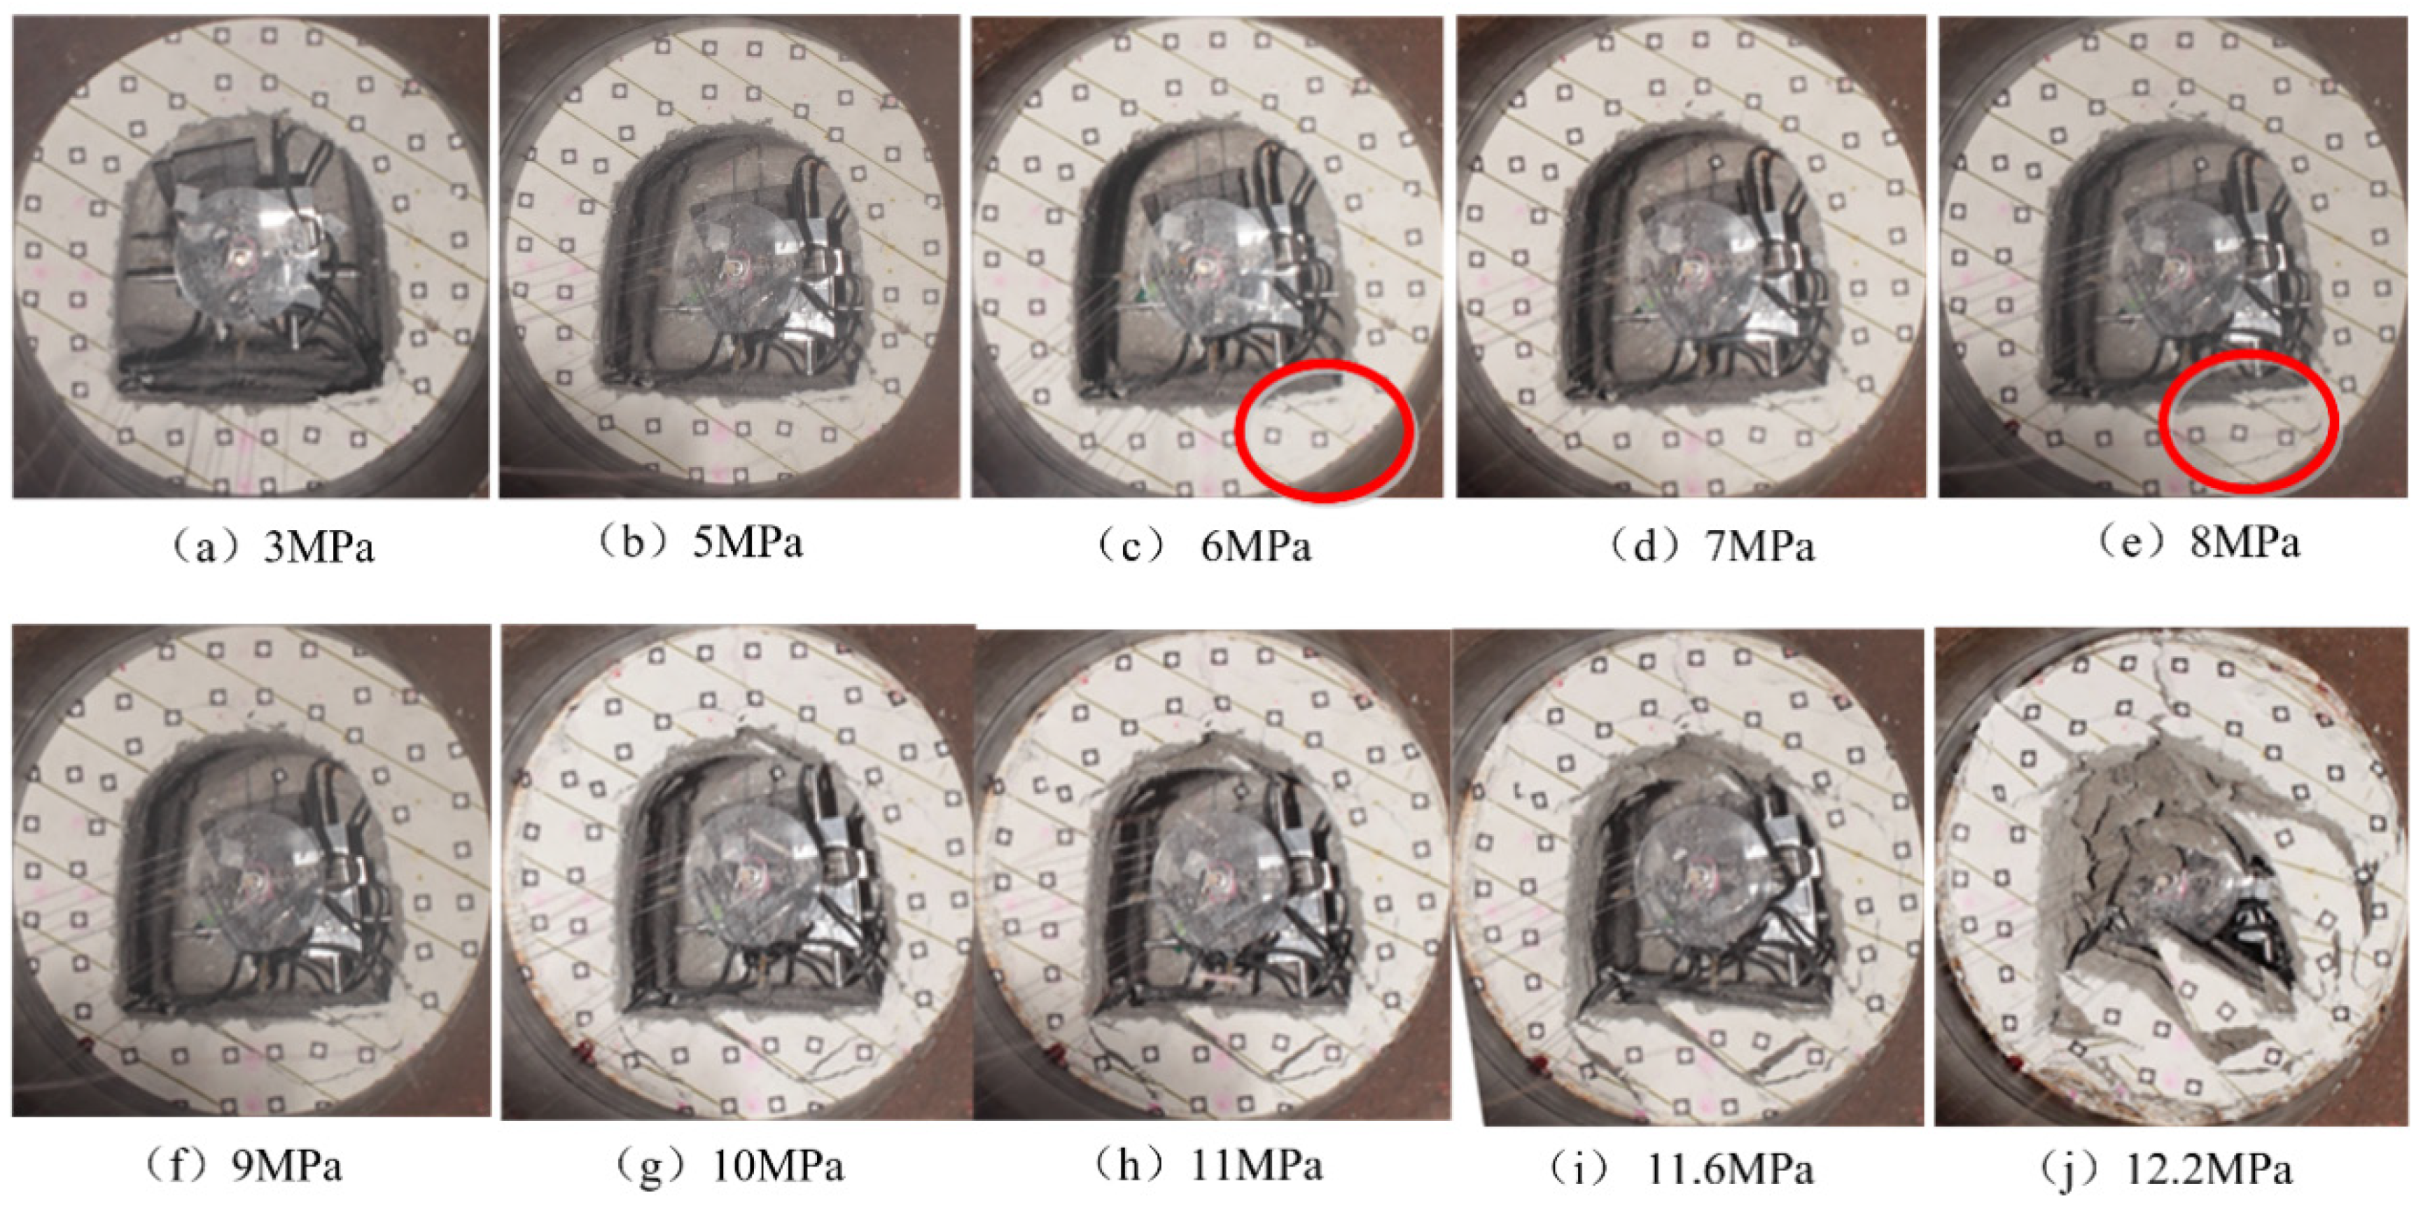
4.1. Characteristics of Roadway Surrounding Rock Deformation
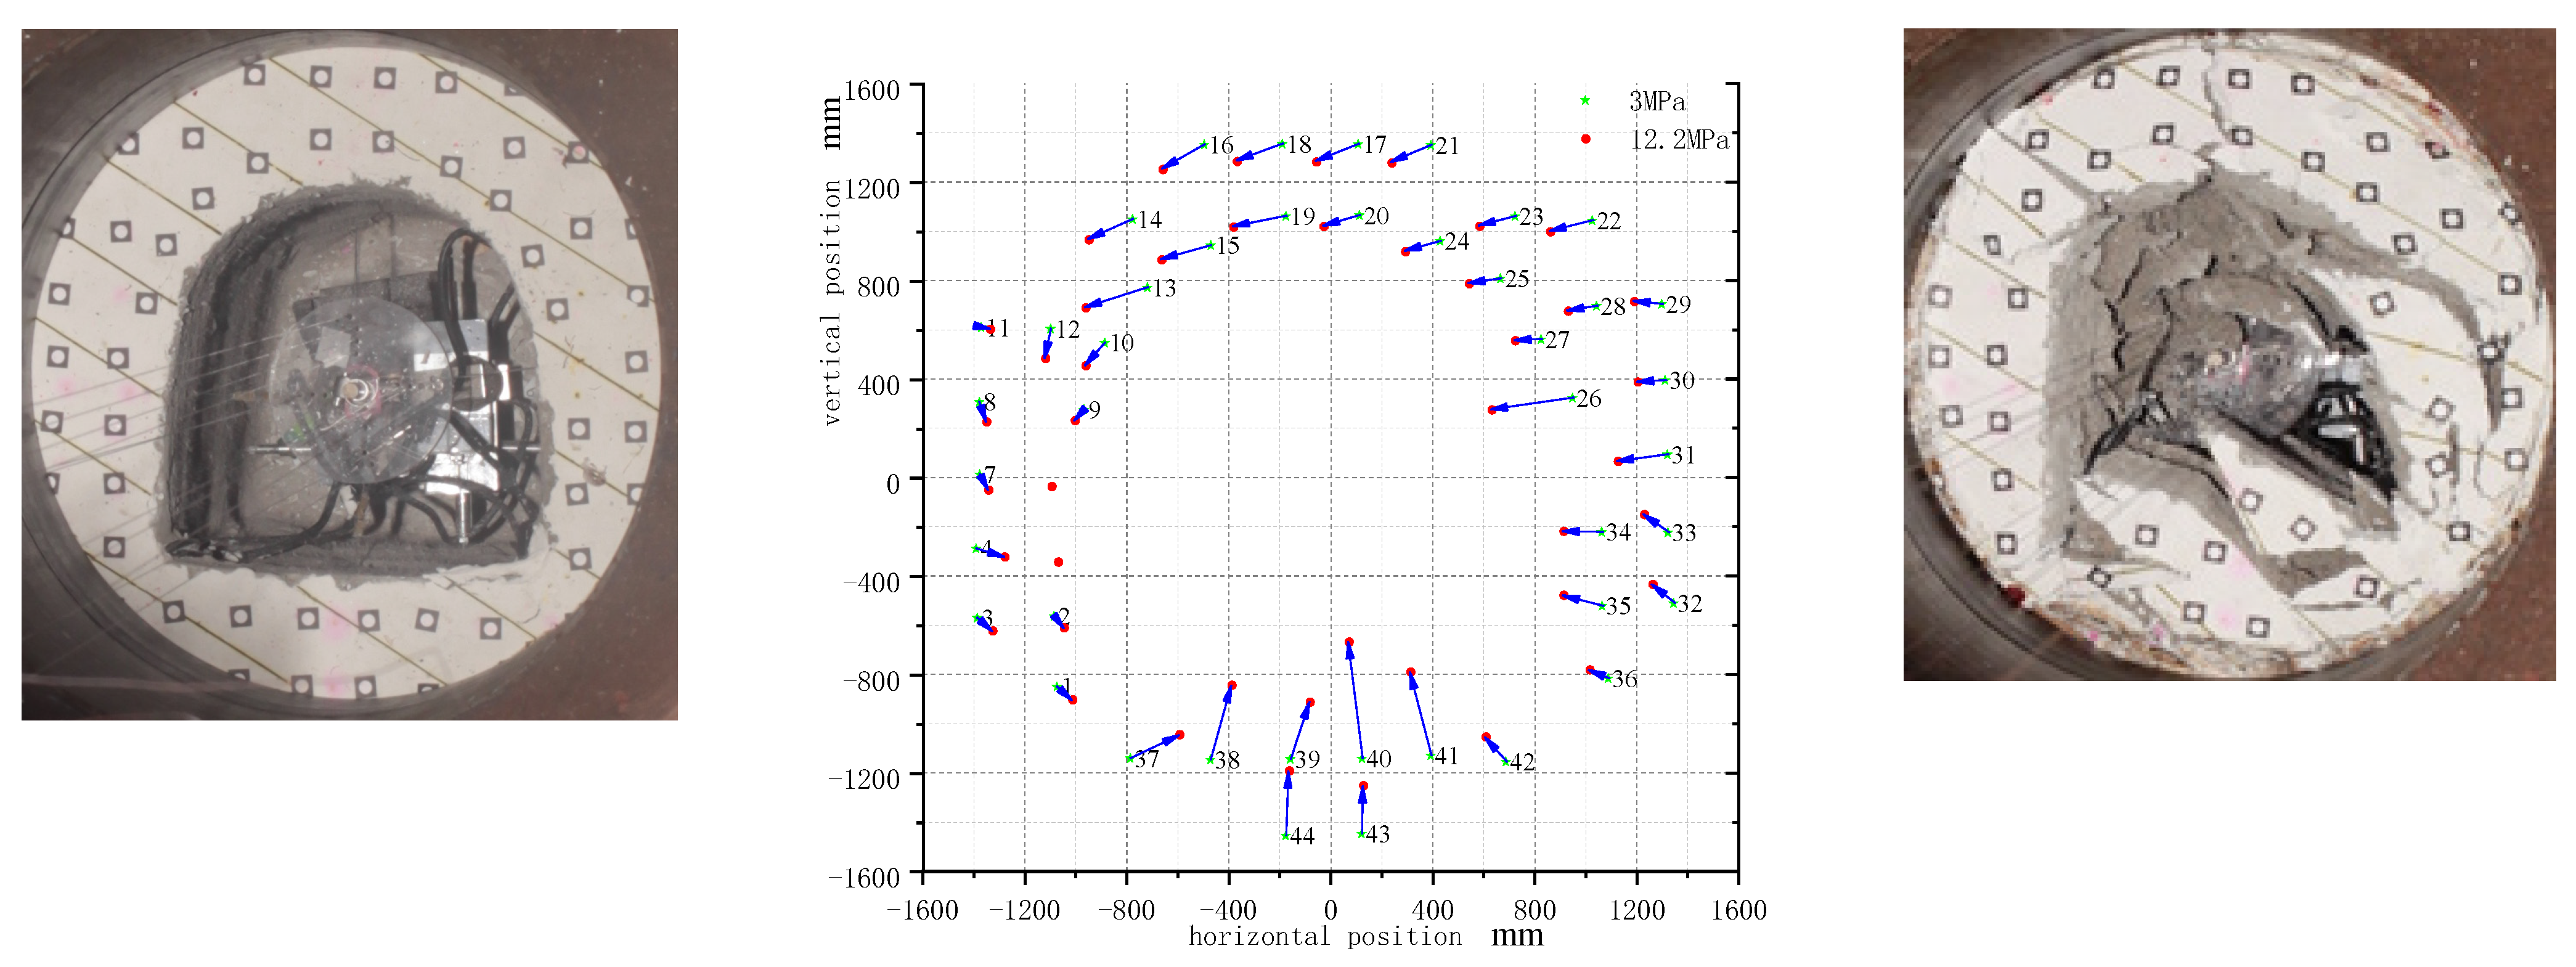
4.2. Spacial Deformation Displacement Distribution Characteristics of a Roadway
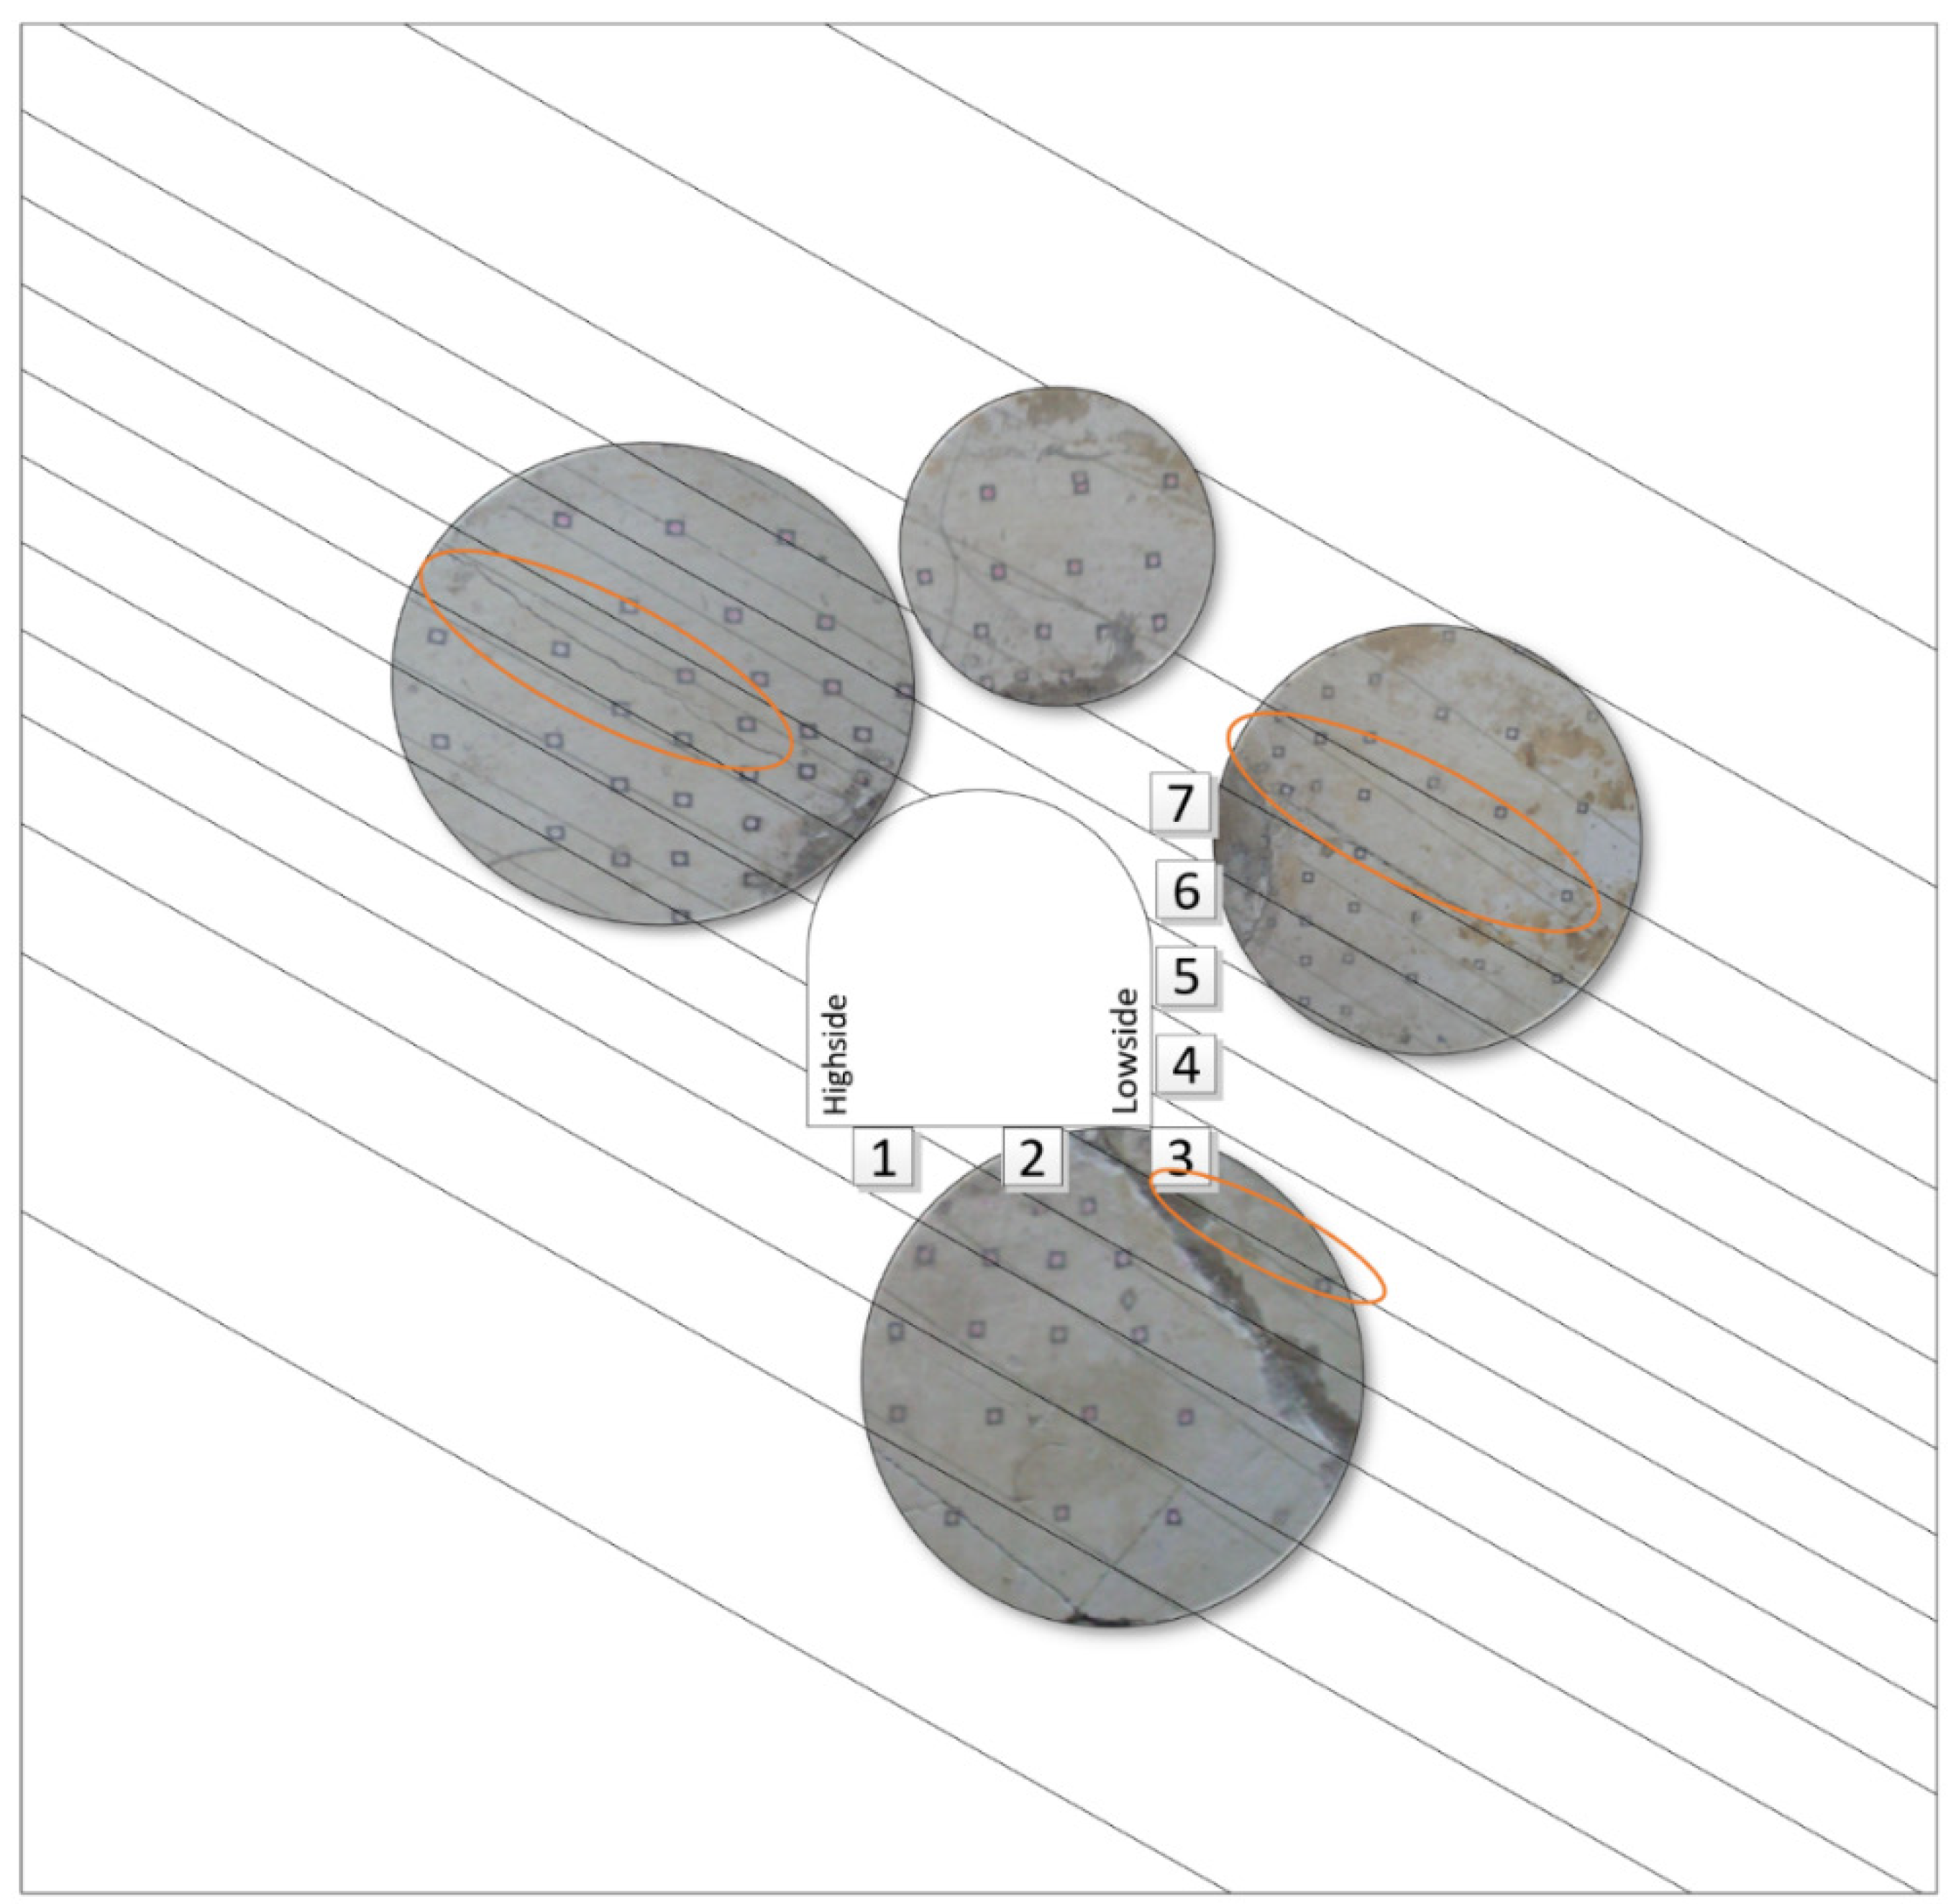
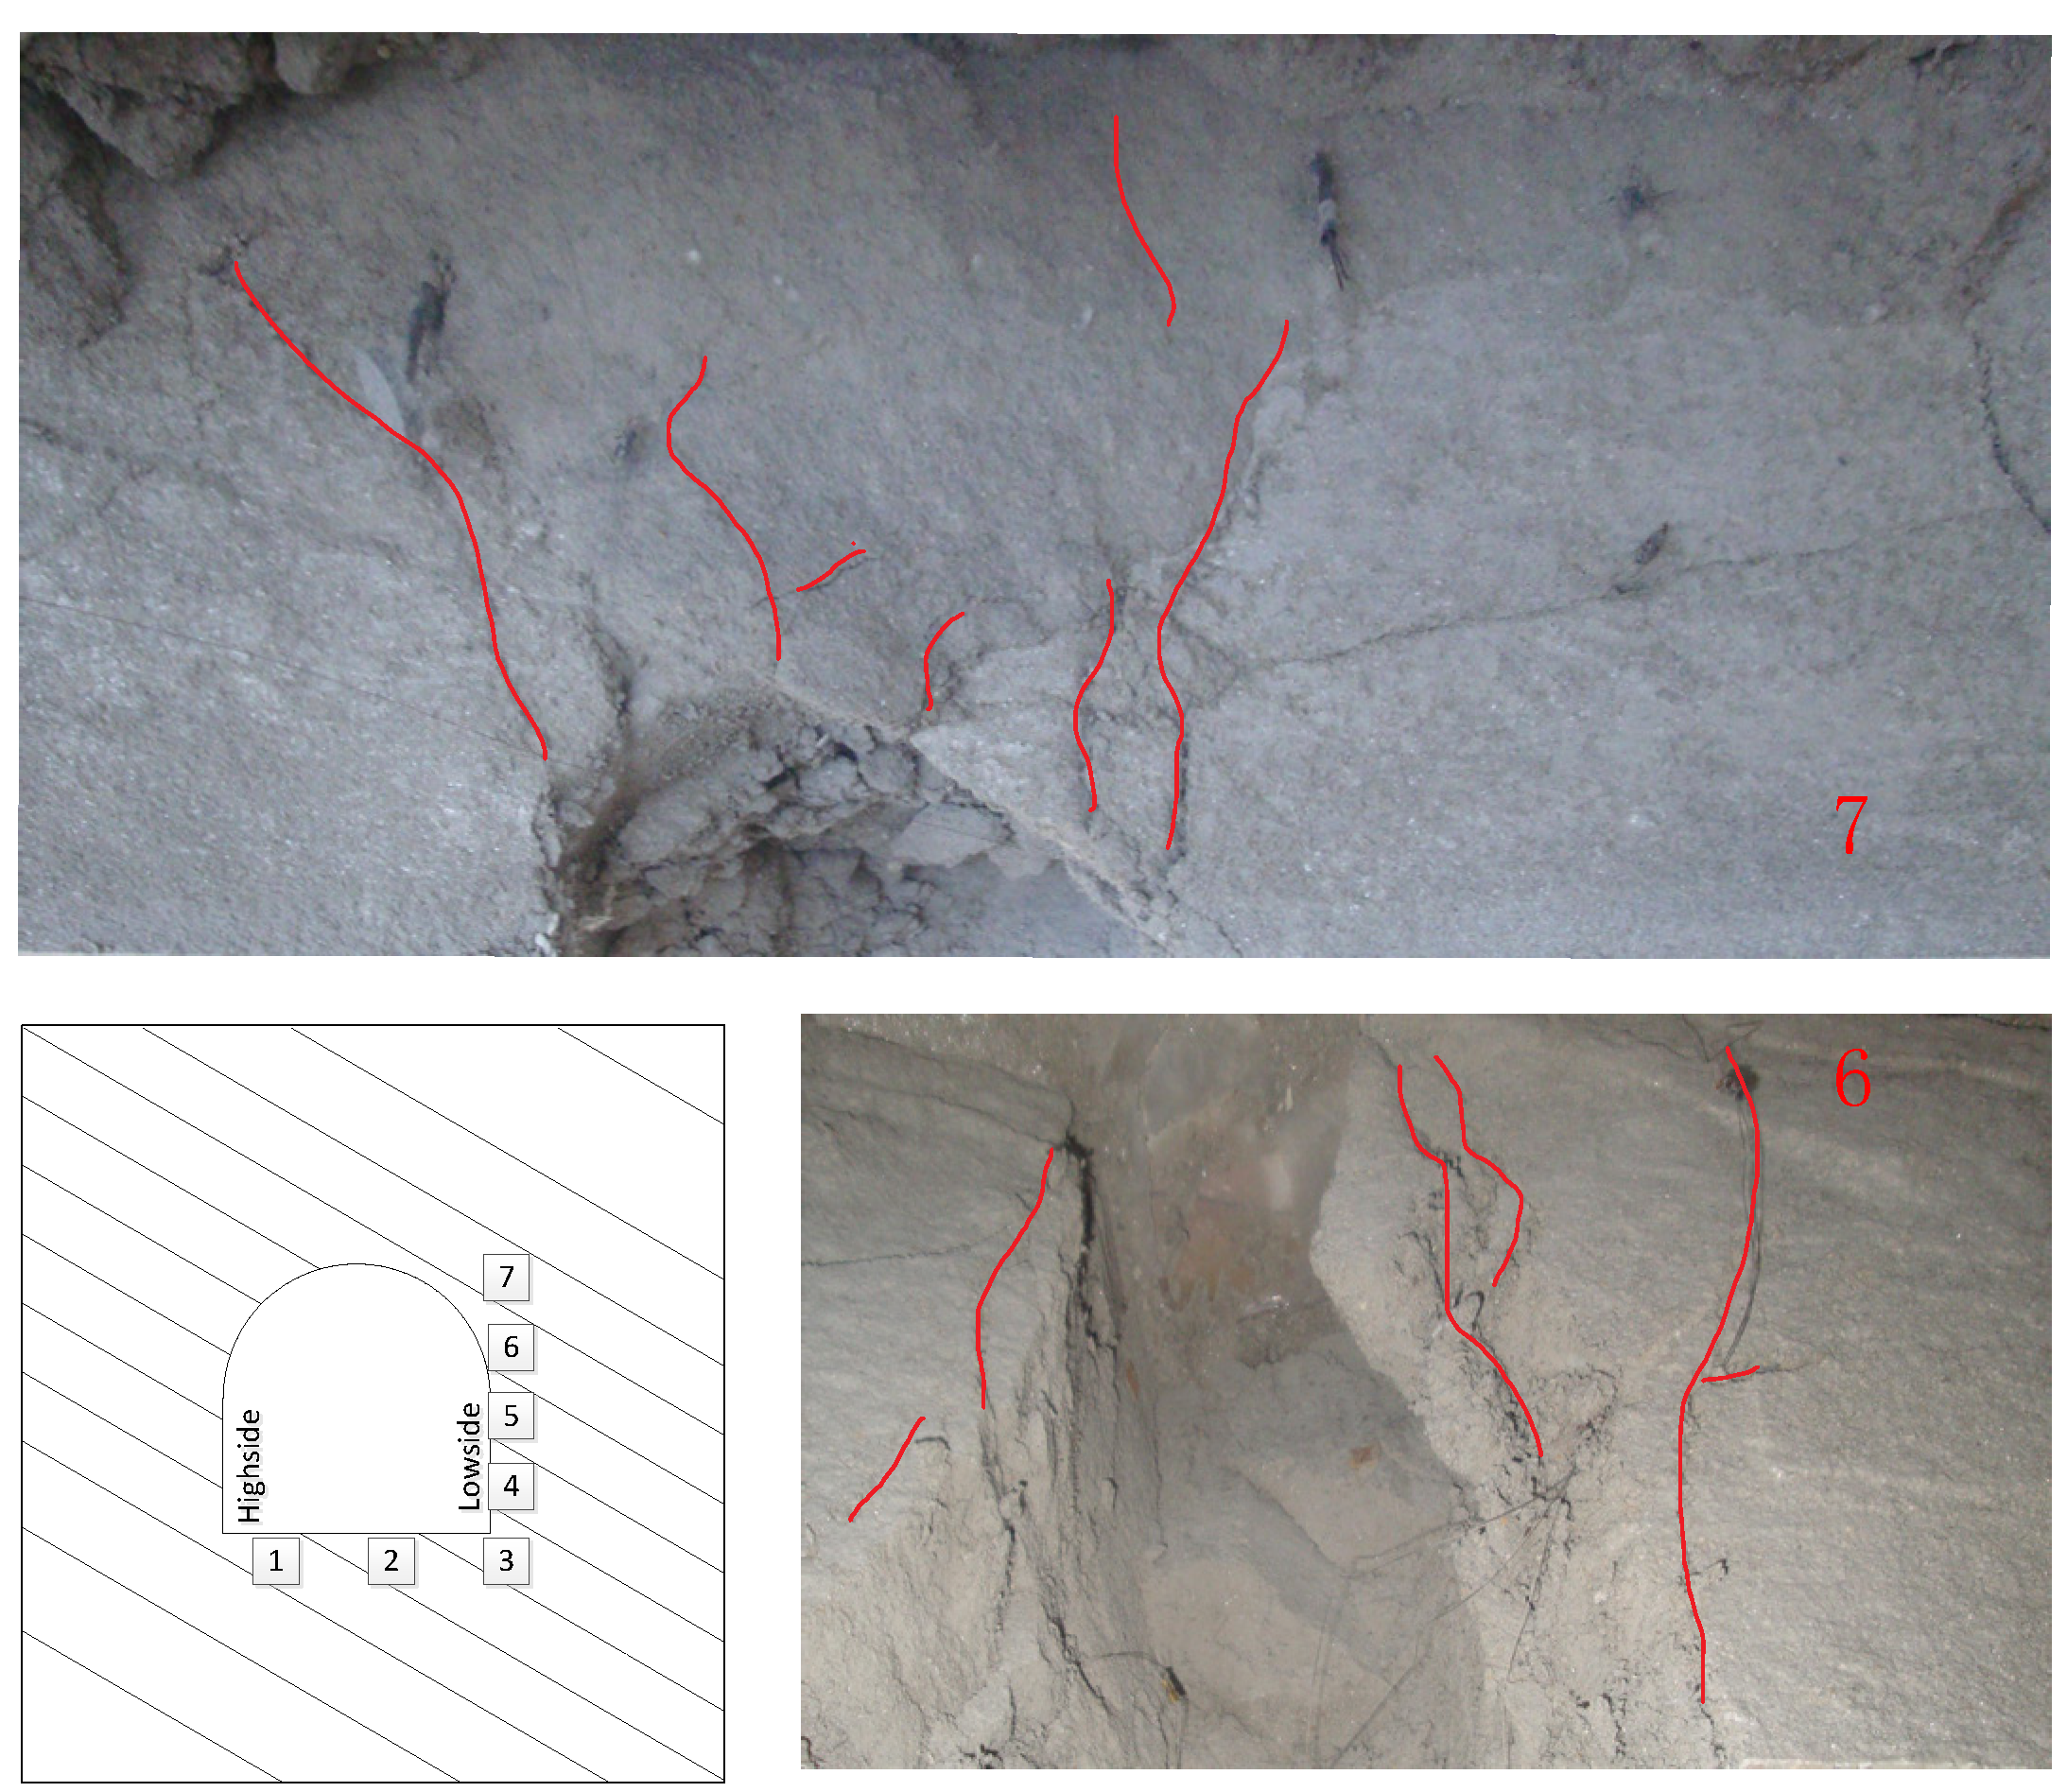
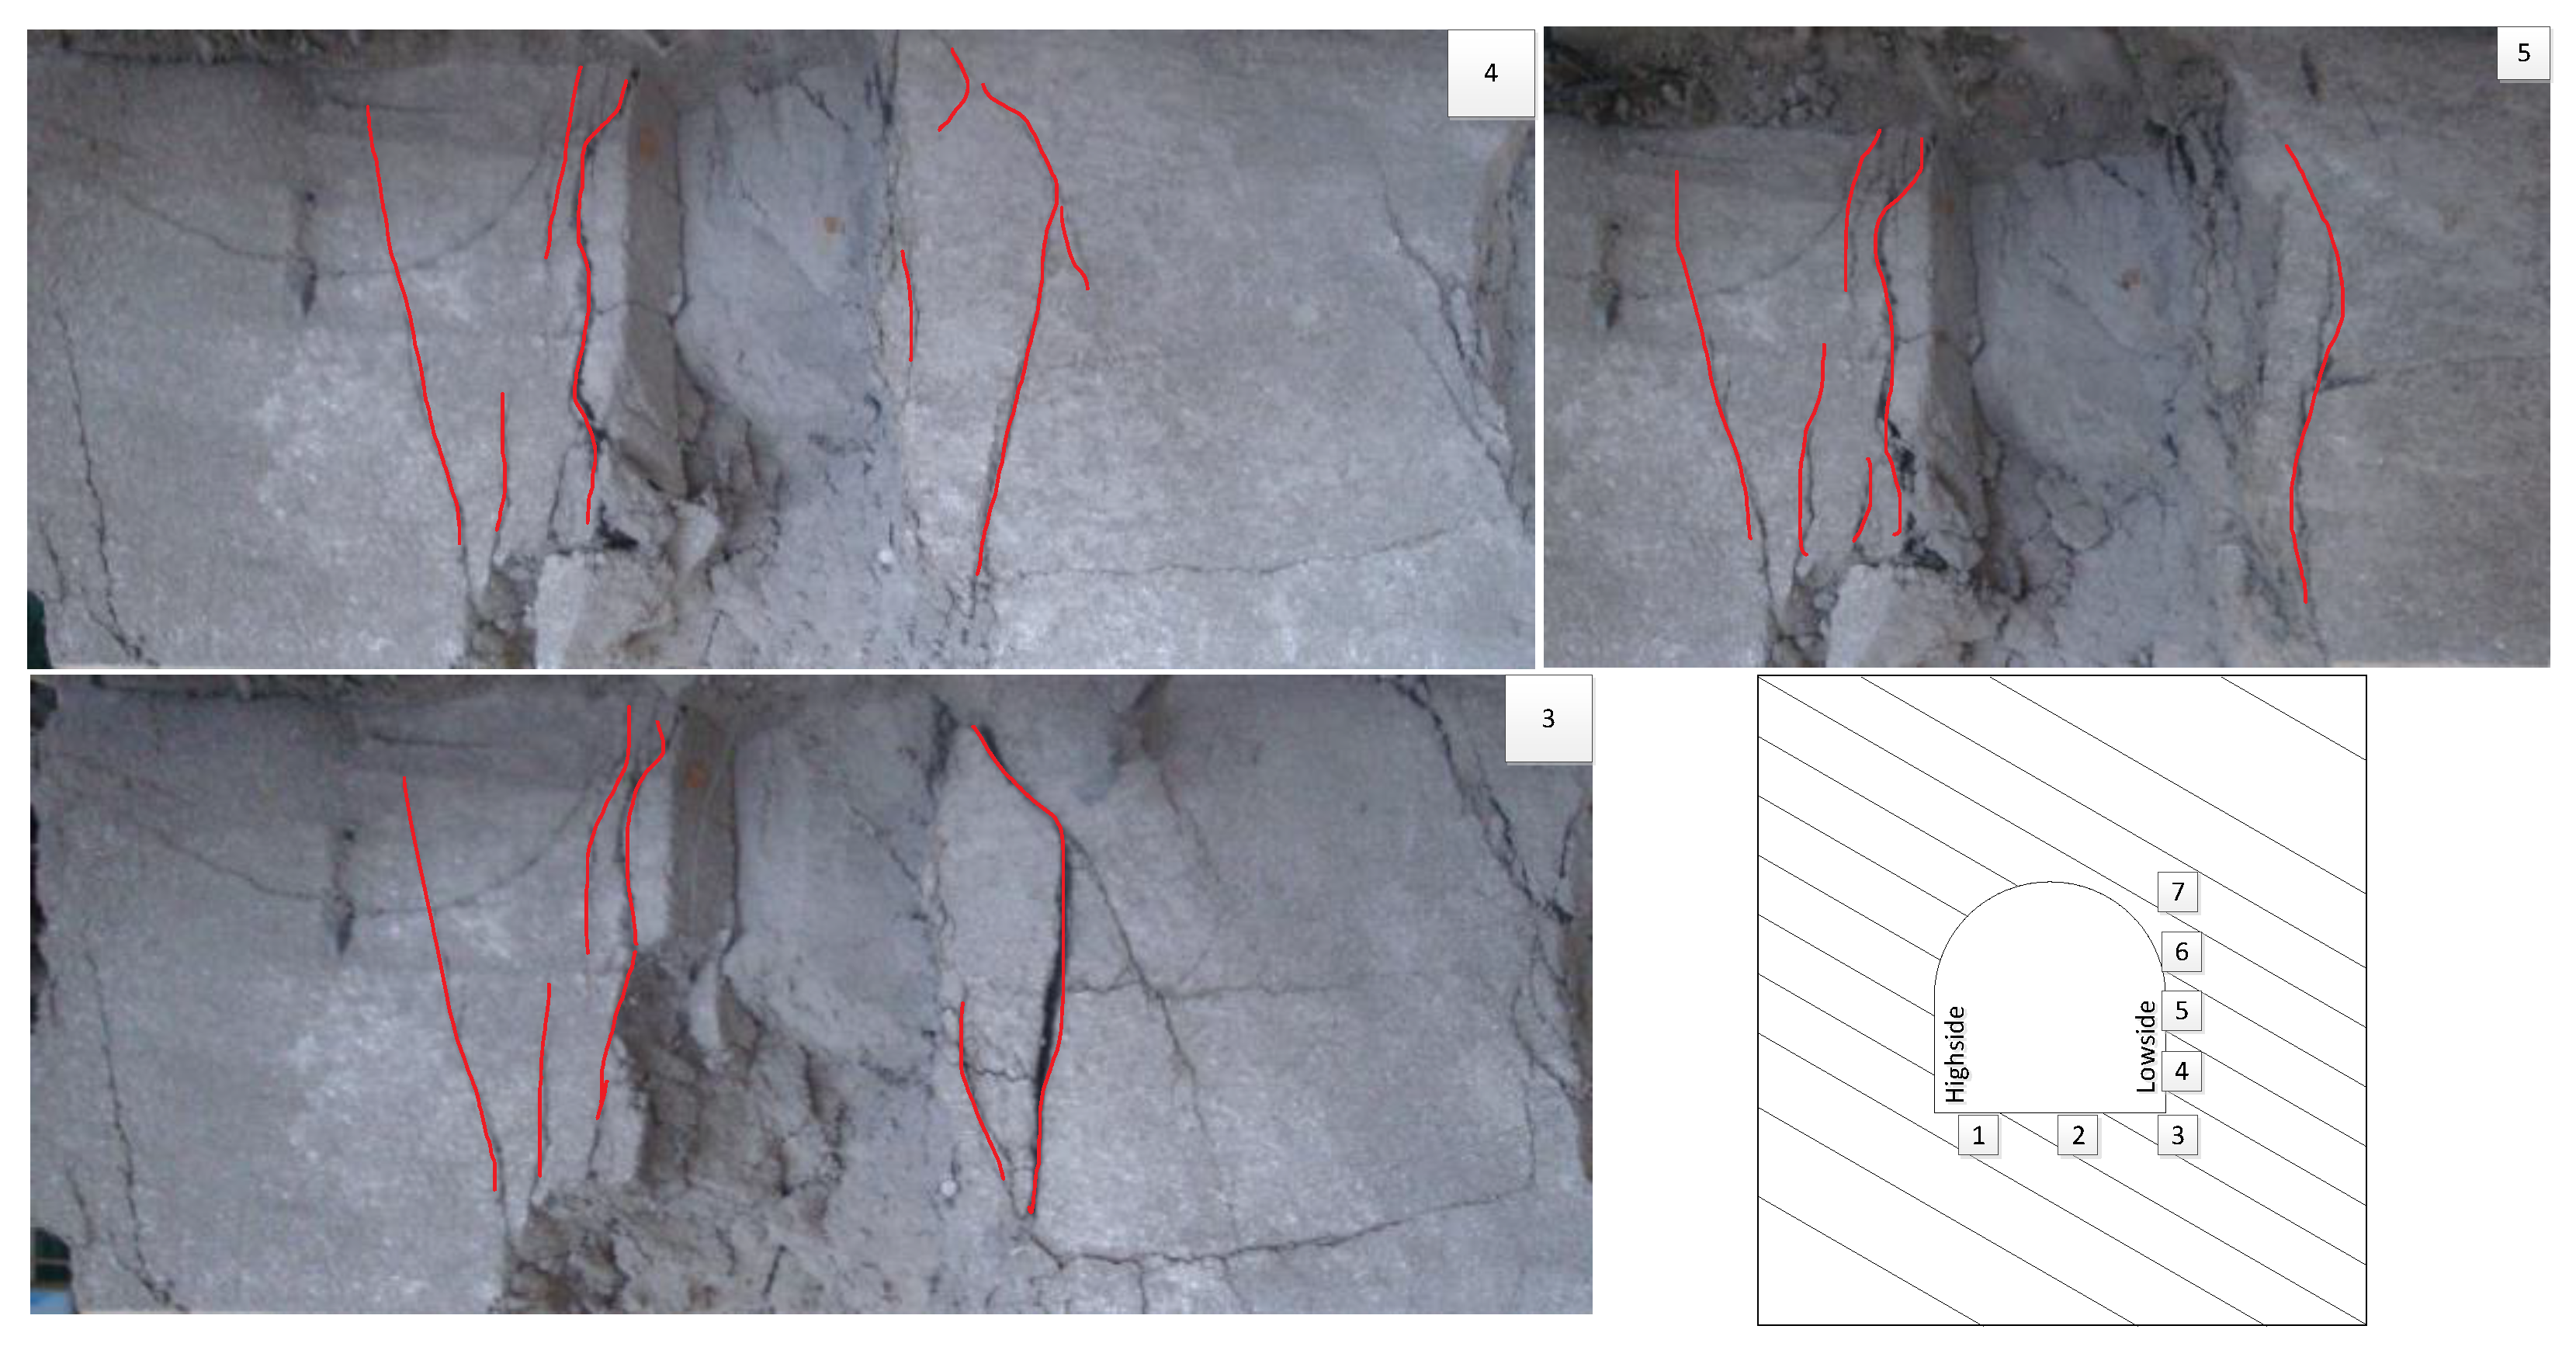
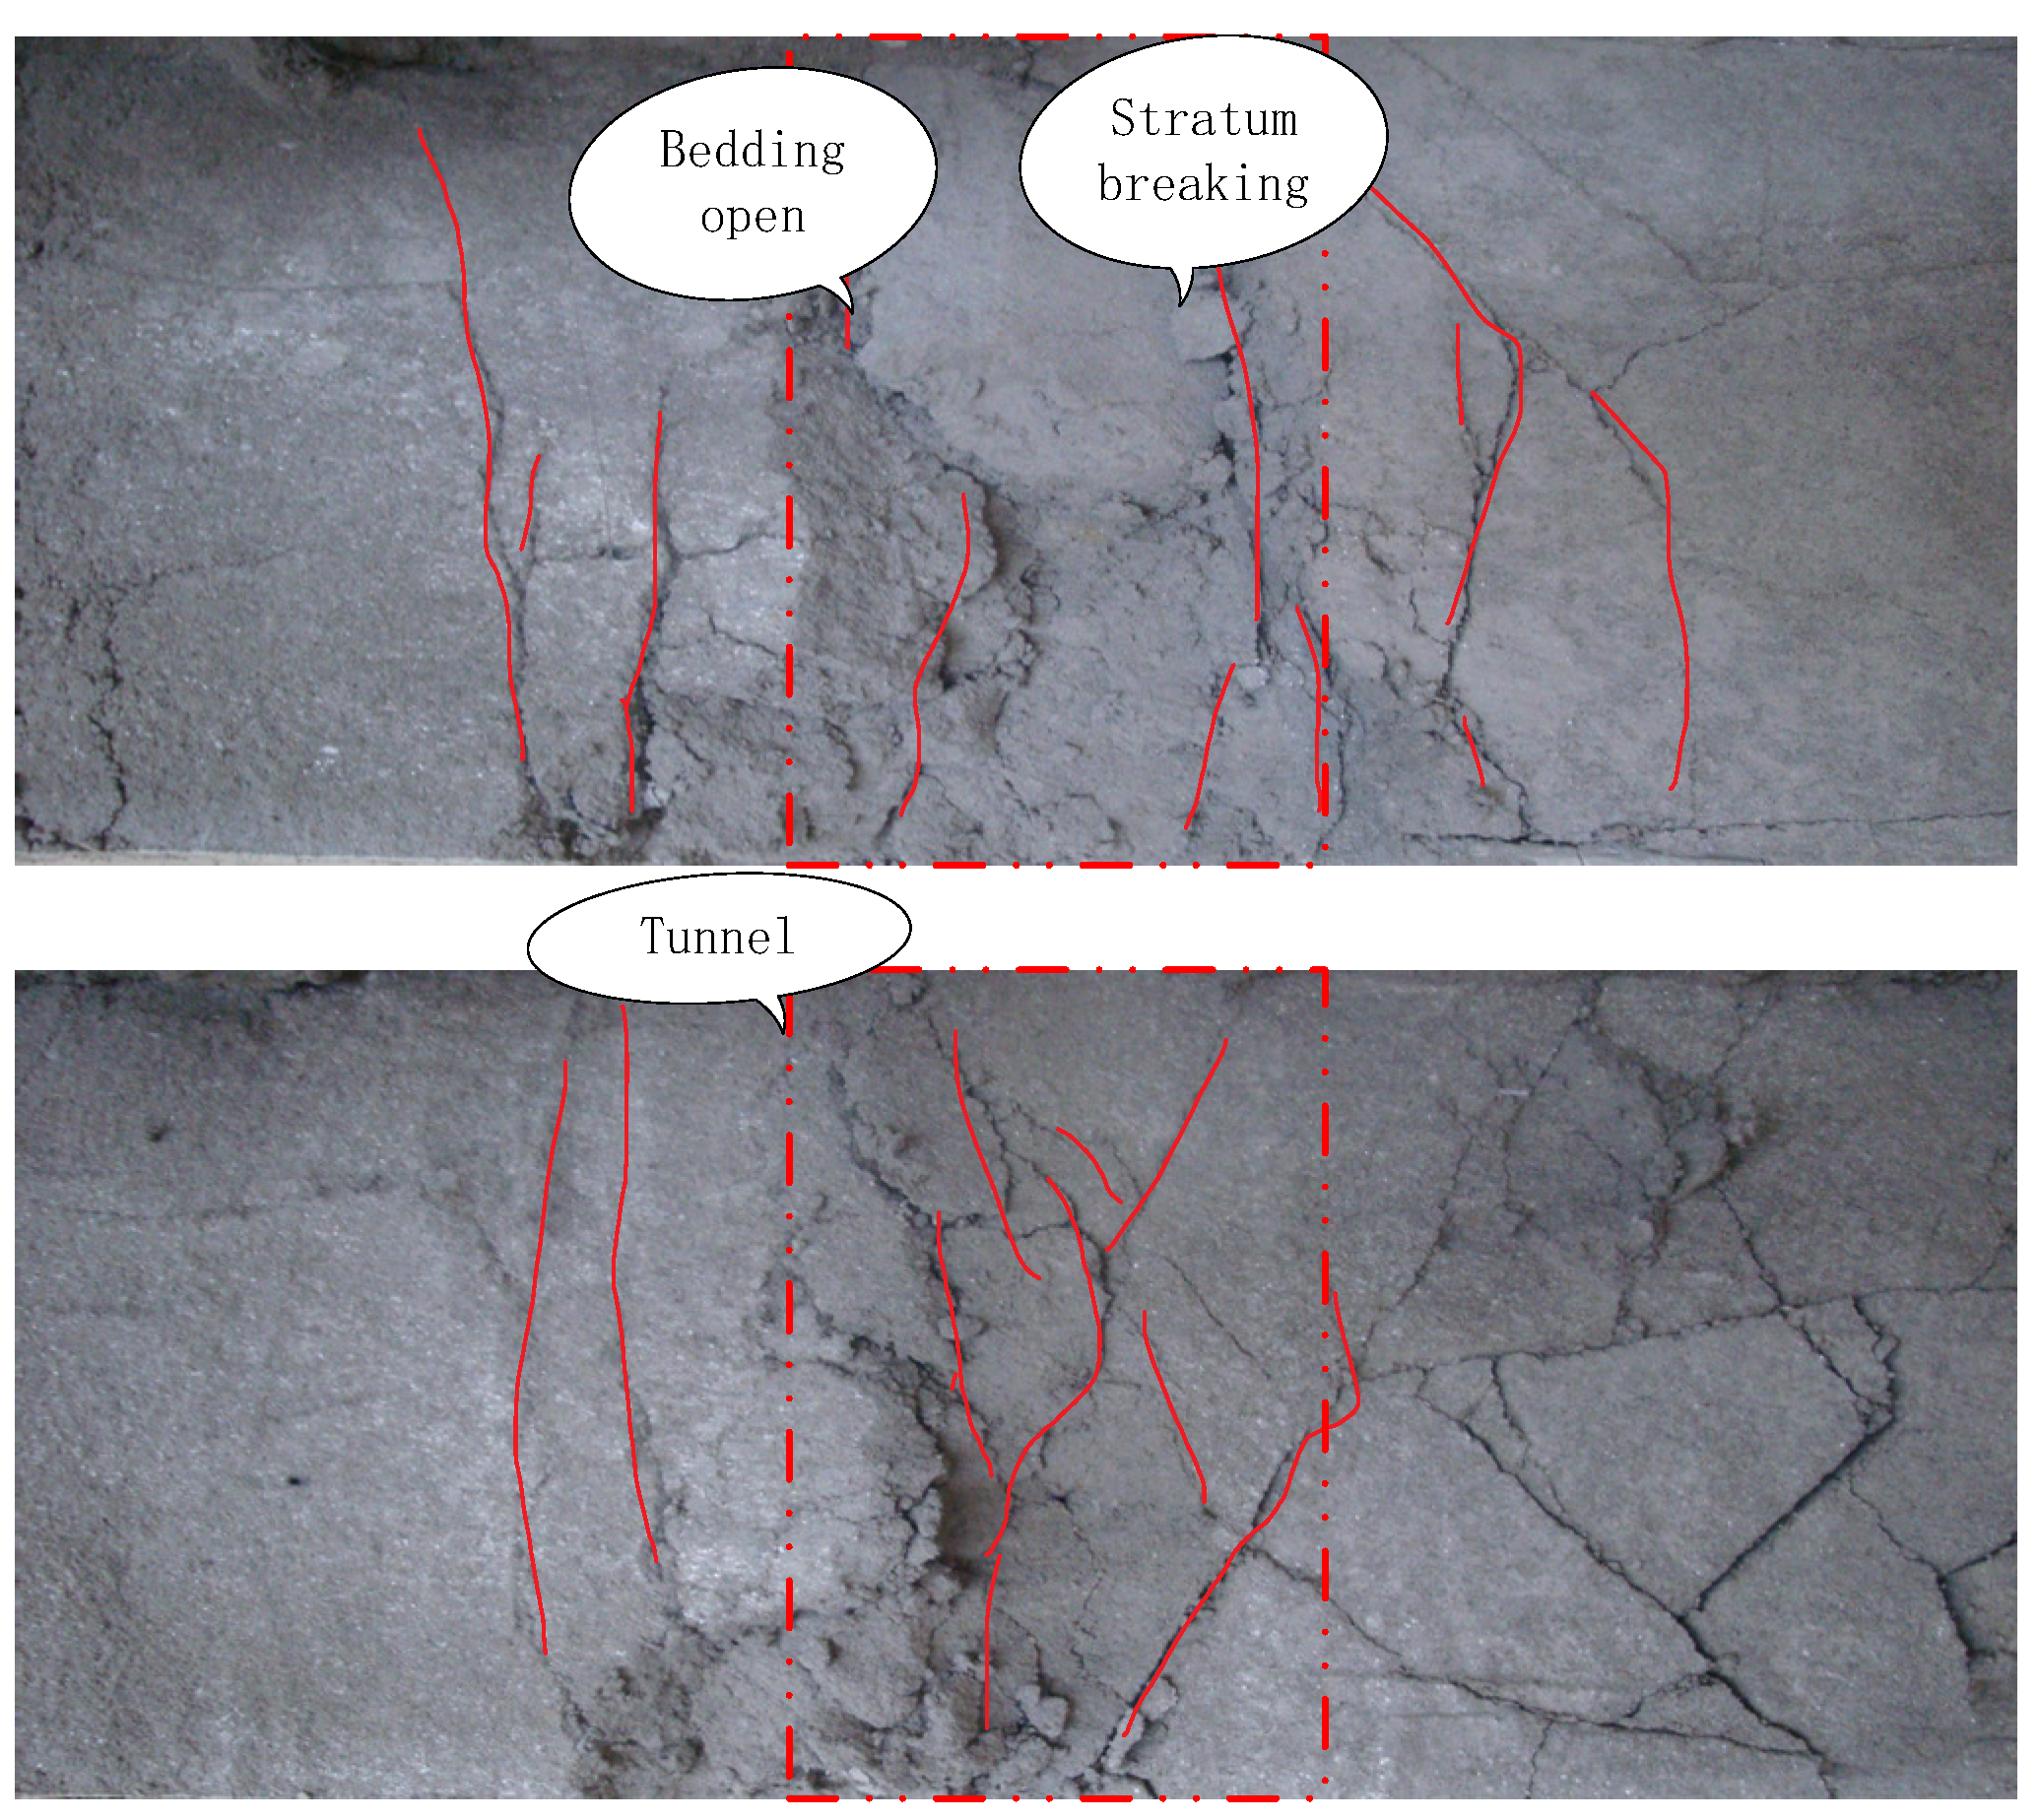
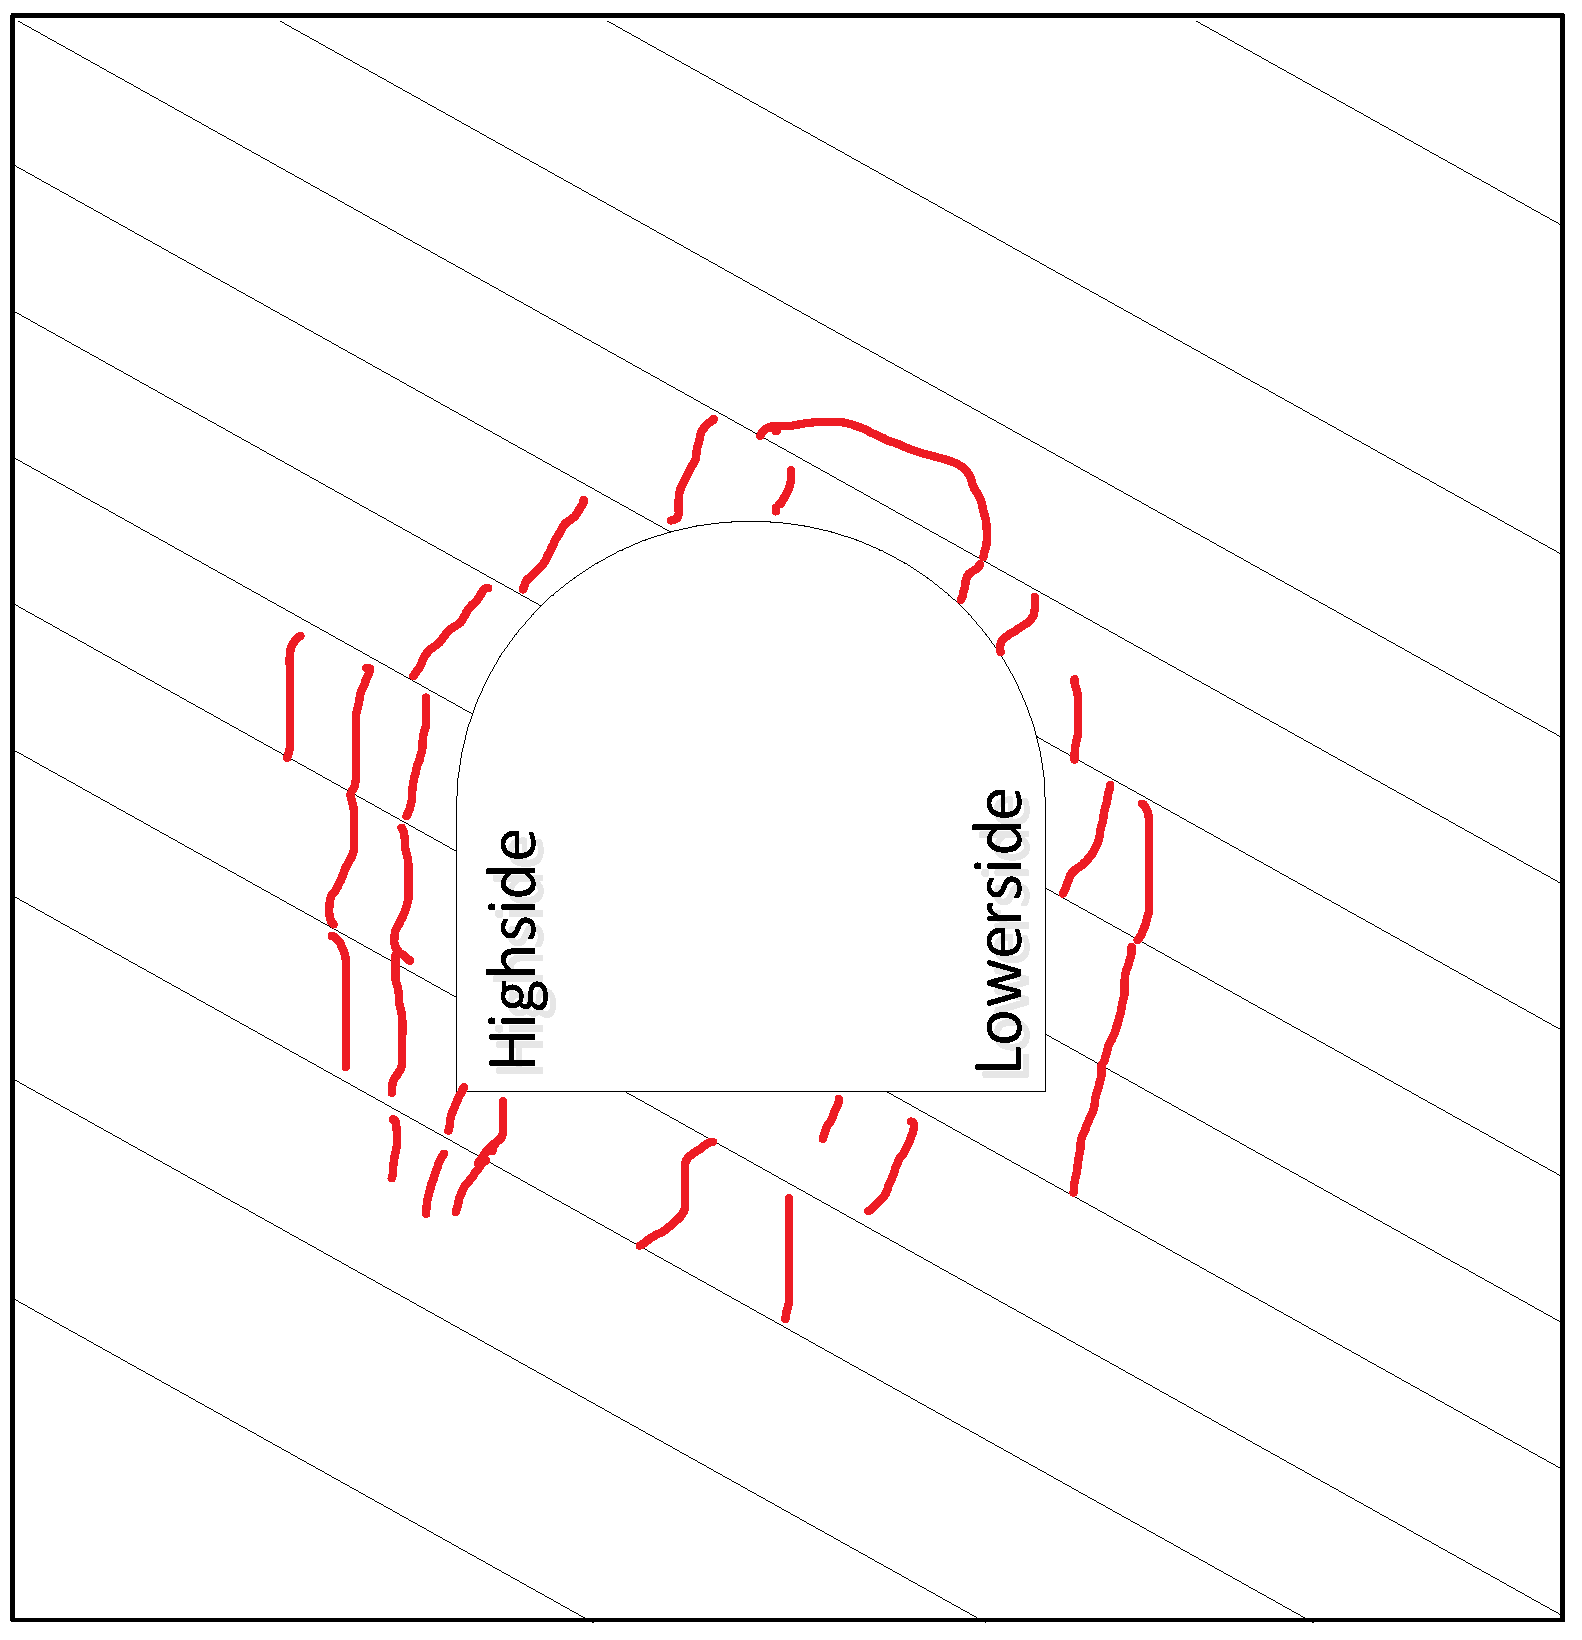
4.3. Analysis of Internal Crack Development Characteristics of Roadway-Surrounding Rock
5. Conclusions
Author Contributions
Funding
Conflicts of Interest
References
- Yu, Y.; Hong, X.; Chen, F. Study on load transmission mechanism and limit equilibrium zone of coal-wall in extraction opening. J. China Coal Soc. 2012, 37, 1630–1636. [Google Scholar]
- Zhang, B.; Cao, S.; Wang, L. Deformation Failure Mechanism and Support Measurements in Roadway of Steeply Inclined Coal Seam. J. Min. Saf. Eng. 2011, 28, 214–219. [Google Scholar]
- Li, S.; Pan, Z.; Wang, W. Analysis of Plastic Region of Sidewalls in Coal Drifts Reinforced by Association of Rock Bolt and Grouting. J. Hunan Univ. Sci. Technol. Nat. Sci. Ed. 2007, 2, 5–8. [Google Scholar]
- Zhang, N.; Li, B.; Li, G. Inhomogeneous damage and sealing support of roadways through thin-bedded coal-rock crossovers. J. Min. Saf. Eng. 2013, 30, 1–6. [Google Scholar]
- Zhang, M.; Gao, J.; Wei, S. Similarity Simulation Study of Failure Characteristics ofSurrounding Rocks of Titled Strata Roadway. J. Rock Mech. Eng. 2010, 29, 3259–3264. [Google Scholar]
- Zhang, Q.; Zhang, X.; Xiang, W. Model Test Study of Zonal Disintegration in Deep Rock mass Under Different Cavern Shapes and Loading Conditions. Chin. J. Rock Mech. Eng. 2013, 32, 1564–1571. [Google Scholar]
- Guo, J.; Yang, Z.; Tang, H. The Effect of Lateral Pressure Coefficient on Deformation and Stress Distribution Rules AroundRoadway. J. Min. Saf. Eng. 2011, 28, 566–570. [Google Scholar]
- Xue, D. Research on similarity simulation of soft rock entry deformation and destruction. China Coal 2010, 36, 58–61. [Google Scholar]
- Liu, J.; Zhao, Y.; Li, P. Study of size effect of deformation of rock mass surrounding tunnel. Rock Soil Mech. 2013, 34, 2165–2173. [Google Scholar]
- Sun, X.; Zhang, G.; Cai, F. Asymmetric Deformation Mechanical within Inclined Rock Strata Induced by Excavation in Deep Roadway and its Controlling Countermeasures. J. Rock Mech. Eng. 2009, 28, 1137–1143. [Google Scholar]
- Zhang, G.; He, M.; Jin, L. Deformation and Stability Lost Mechanism and Support Technology of Inclined Layer Roof in Seam Gateway. Coal Sci. Technol. 2011, 39, 1–5. [Google Scholar]
- Bao, H.; Meng, Y.; Wu, X. Numerical Simulation of Deformation Mechanism of Deep Inclined Roadway. J. Hefei Univ. Technol. Nat. Sci. Ed. 2012, 35, 673–677. [Google Scholar]
- Wang, W.; Feng, T. Study on Mechanism of Reinforcing Sides to Control Floor Heave of Extraction Opening. J. Rock Mech. Eng. 2005, 5, 808–811. [Google Scholar]
- Fan, G.; Cheng, K.; Lai, X. Acoustic Emission Characteristics of Surrounding Deformation of Shield Tunnel Based on 3D Physical Similar Simulation Experiment. Saf. Coal Mines 2018, 49, 50–54. [Google Scholar]
- Zhang, N.; Wang, X.; Kan, J. Extrusion Displacement Model and Displacement Quantization Method of Roadway Surrounding Rock. J. China Univ. Min. Technol. 2013, 42, 899–904. [Google Scholar]
- Gao, M.; Wang, M.; Xie, J. In-situ disturbed mechanical behavior of deep coal rock. J. China Coal Soc. 2020, 45, 2691–2703. [Google Scholar]
- Zhang, J.; Song, Z.; Fan, W. Experimental investigation on progressive damage mechanical behavior of sandstone under true triaxial condition. J. China Coal Soc. 2019, 44, 2700–2709. [Google Scholar]
- Yin, G.; Lu, J.; Li, X. Stability and plastic zone characteristics of surrounding rock under true triaxial stress conditions. J. China Coal Soc. 2018, 43, 2709–2717. [Google Scholar]
- Yin, G.; Lu, J.; Li, X. Influence of intermediate principal stress on dilation and strength characteristics of sandstone. J. China Coal Soc. 2017, 42, 879–885. [Google Scholar]
- Wang, M.; Zhu, Z.; Feng, R. Experimental study on THE failure behavior of cracked rocks around tunnels under true triaxial unloading. J. China Coal Soc. 2015, 40, 278–285. [Google Scholar]
- Zhang, H.; Adoko, A.C.; Meng, Z. Mechanism of the Mudstone Tunnel Failures Induced by Expansive Clay Minerals. Geotech. Geol. Eng. 2017, 35, 263–275. [Google Scholar] [CrossRef]
- Yang, X.; Wang, E.; Wang, Y. A Study of the Large Deformation Mechanism and Control Techniques for Deep Soft Rock Roadways. Sustainability 2018, 10, 1100. [Google Scholar] [CrossRef] [Green Version]
- Li, M.; Zhang, J.; Quan, K. Innovative Extraction Method for a Coal Seam with a Thick Rock-Parting for Supporting Coal Mine Sustainability. Sustainability 2017, 9, 1982. [Google Scholar] [CrossRef] [Green Version]
- Qin, D.; Wang, X.; Zhang, D. Study on Surrounding Rock-Bearing Structure and Associated Control Mechanism of Deep Soft Rock Roadway Under Dynamic Pressurey. Sustainability 2019, 11, 1892. [Google Scholar] [CrossRef] [Green Version]
- Wu, H. Research on Asymmetrical Deformation Laws and Stability Control of Deep Inclined Rock Strata Roadway; China University of Mining and Technology: Xuzhou, China, 2014. [Google Scholar]


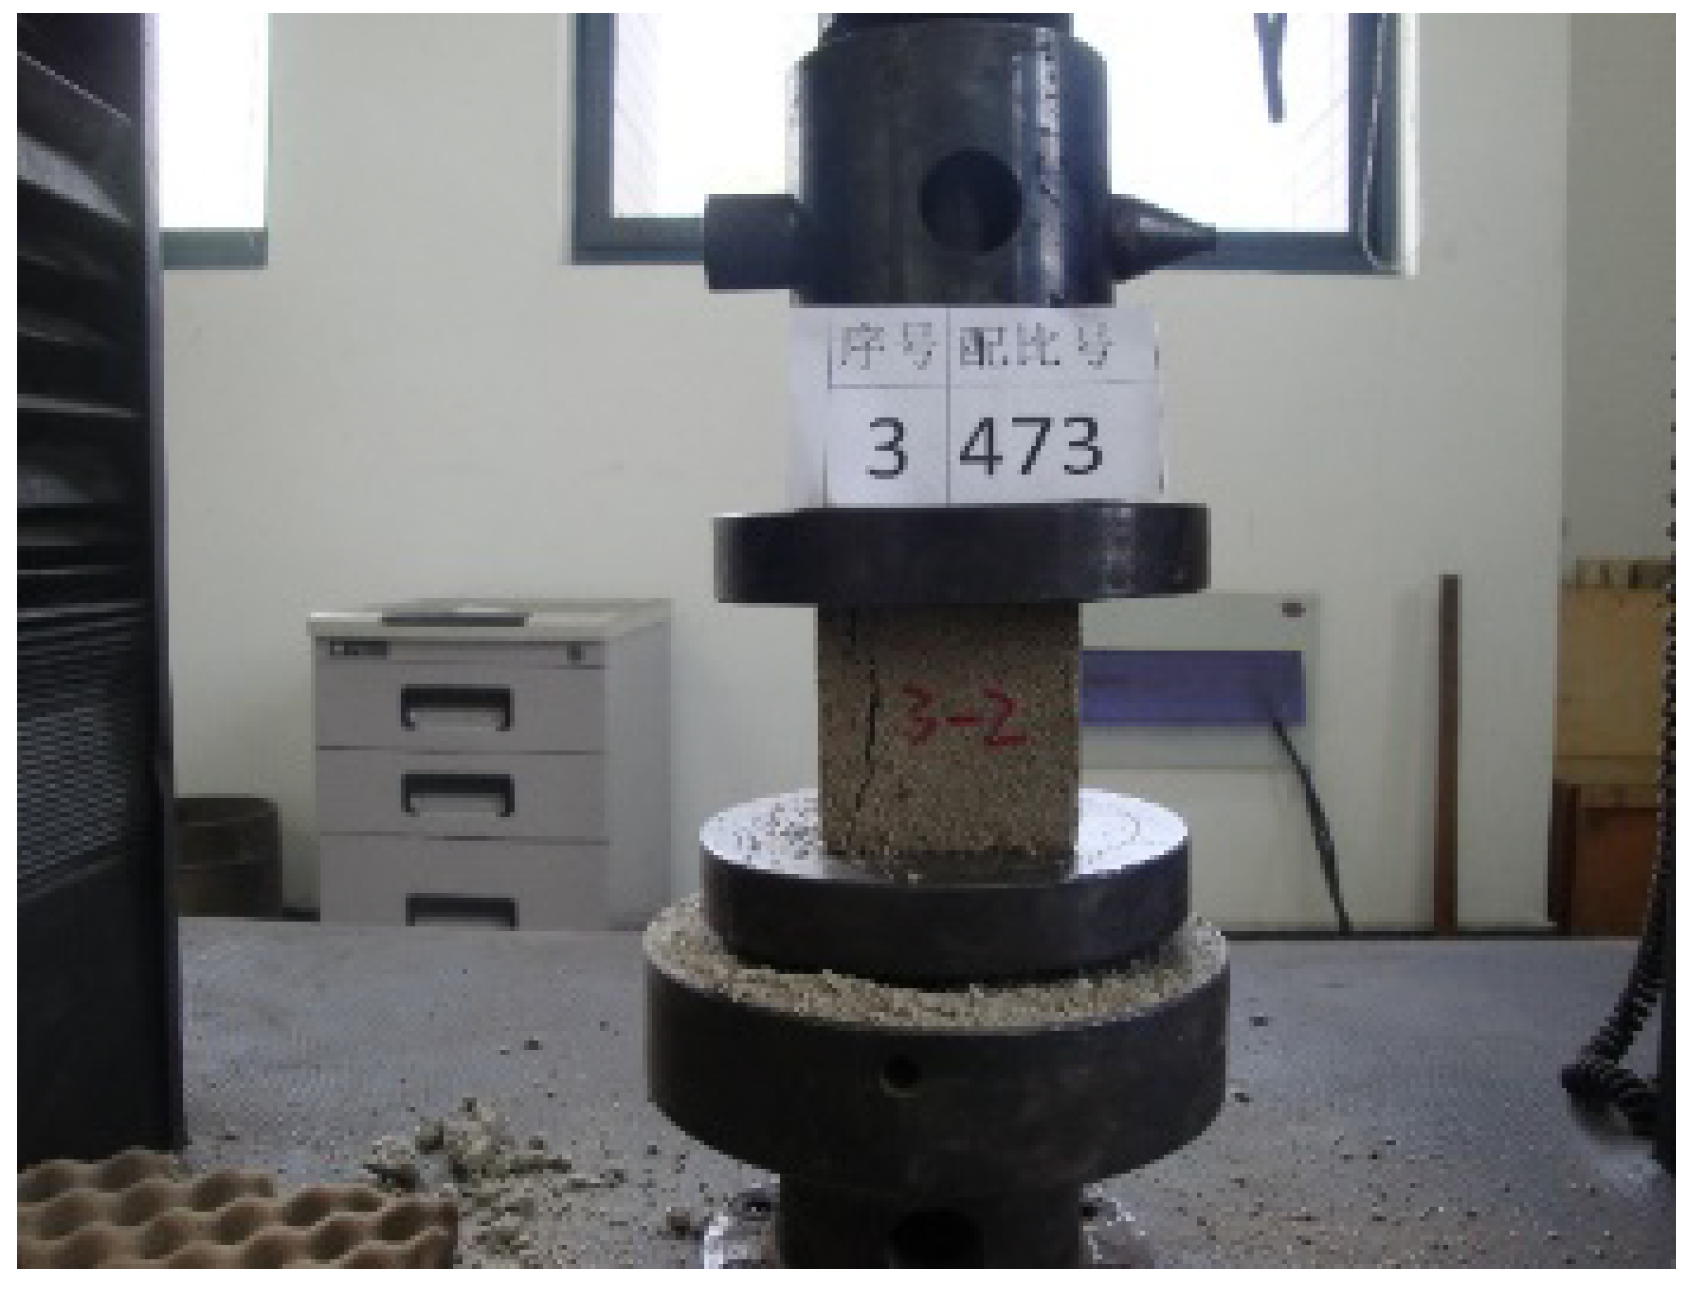
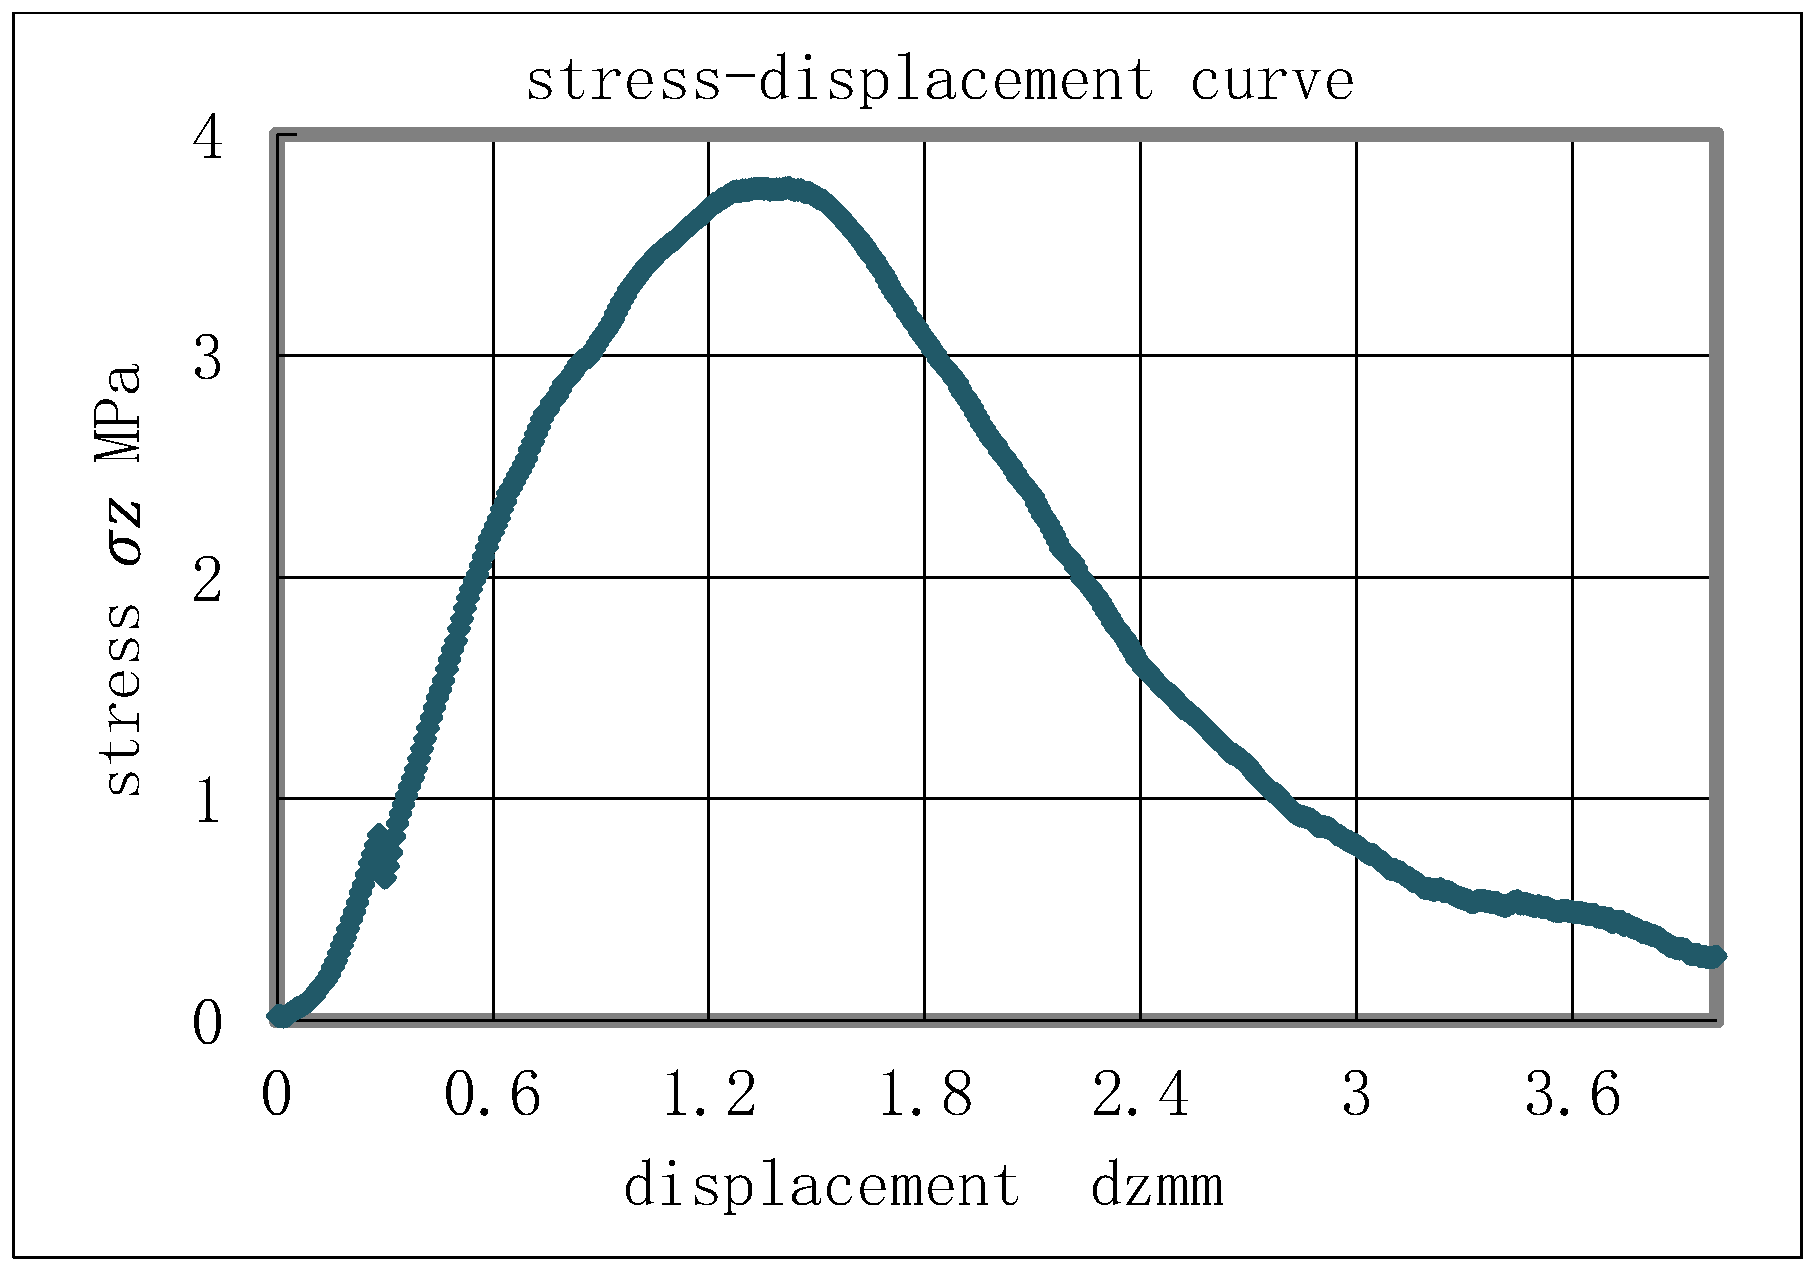
| Material Number | Density, g/cm3 | Compressive Strength, MPa |
|---|---|---|
| 473 | 2.20 | 2.77 |
| No. | Location | Displacement (cm) | Number | Location | Displacement (cm) | Number | Location | Displacement (cm) |
|---|---|---|---|---|---|---|---|---|
| 1 | high-level wall | 1.69 | 19 | roof | 4.53 | 36 | low-level wall | 1.80 |
| 2 | high-level wall | 1.30 | 20 | roof | 3.19 | 37 | floor | 4.46 |
| 5 | high-level wall | 1.24 | 24 | roof | 3.12 | 38 | floor | 6.54 |
| 6 | high-level wall | 1.13 | 25 | roof | 2.75 | 39 | floor | 5.04 |
| 9 | high-level wall | 1.24 | 26 | low-level wall | 6.88 | 40 | floor | 10.02 |
| 10 | high-level wall | 2.54 | 27 | low-level wall | 2.26 | 41 | floor | 7.31 |
| 13 | roof | 5.46 | 34 | low-level wall | 3.30 | 42 | floor | 2.71 |
| 15 | roof | 4.32 | 35 | low-level wall | 3.45 |
Publisher’s Note: MDPI stays neutral with regard to jurisdictional claims in published maps and institutional affiliations. |
© 2021 by the authors. Licensee MDPI, Basel, Switzerland. This article is an open access article distributed under the terms and conditions of the Creative Commons Attribution (CC BY) license (https://creativecommons.org/licenses/by/4.0/).
Share and Cite
Wu, H.; Jia, Q.; Wang, W.; Zhang, N.; Zhao, Y. Experimental Test on Nonuniform Deformation in the Tilted Strata of a Deep Coal Mine. Sustainability 2021, 13, 13280. https://doi.org/10.3390/su132313280
Wu H, Jia Q, Wang W, Zhang N, Zhao Y. Experimental Test on Nonuniform Deformation in the Tilted Strata of a Deep Coal Mine. Sustainability. 2021; 13(23):13280. https://doi.org/10.3390/su132313280
Chicago/Turabian StyleWu, Hai, Qian Jia, Weijun Wang, Nong Zhang, and Yiming Zhao. 2021. "Experimental Test on Nonuniform Deformation in the Tilted Strata of a Deep Coal Mine" Sustainability 13, no. 23: 13280. https://doi.org/10.3390/su132313280