
Optimized Support Vector Machines Combined with Evolutionary Random Forest for Prediction of Back-Break Caused by Blasting Operation


 ,
,  and
and 
Abstract
:1. Introduction
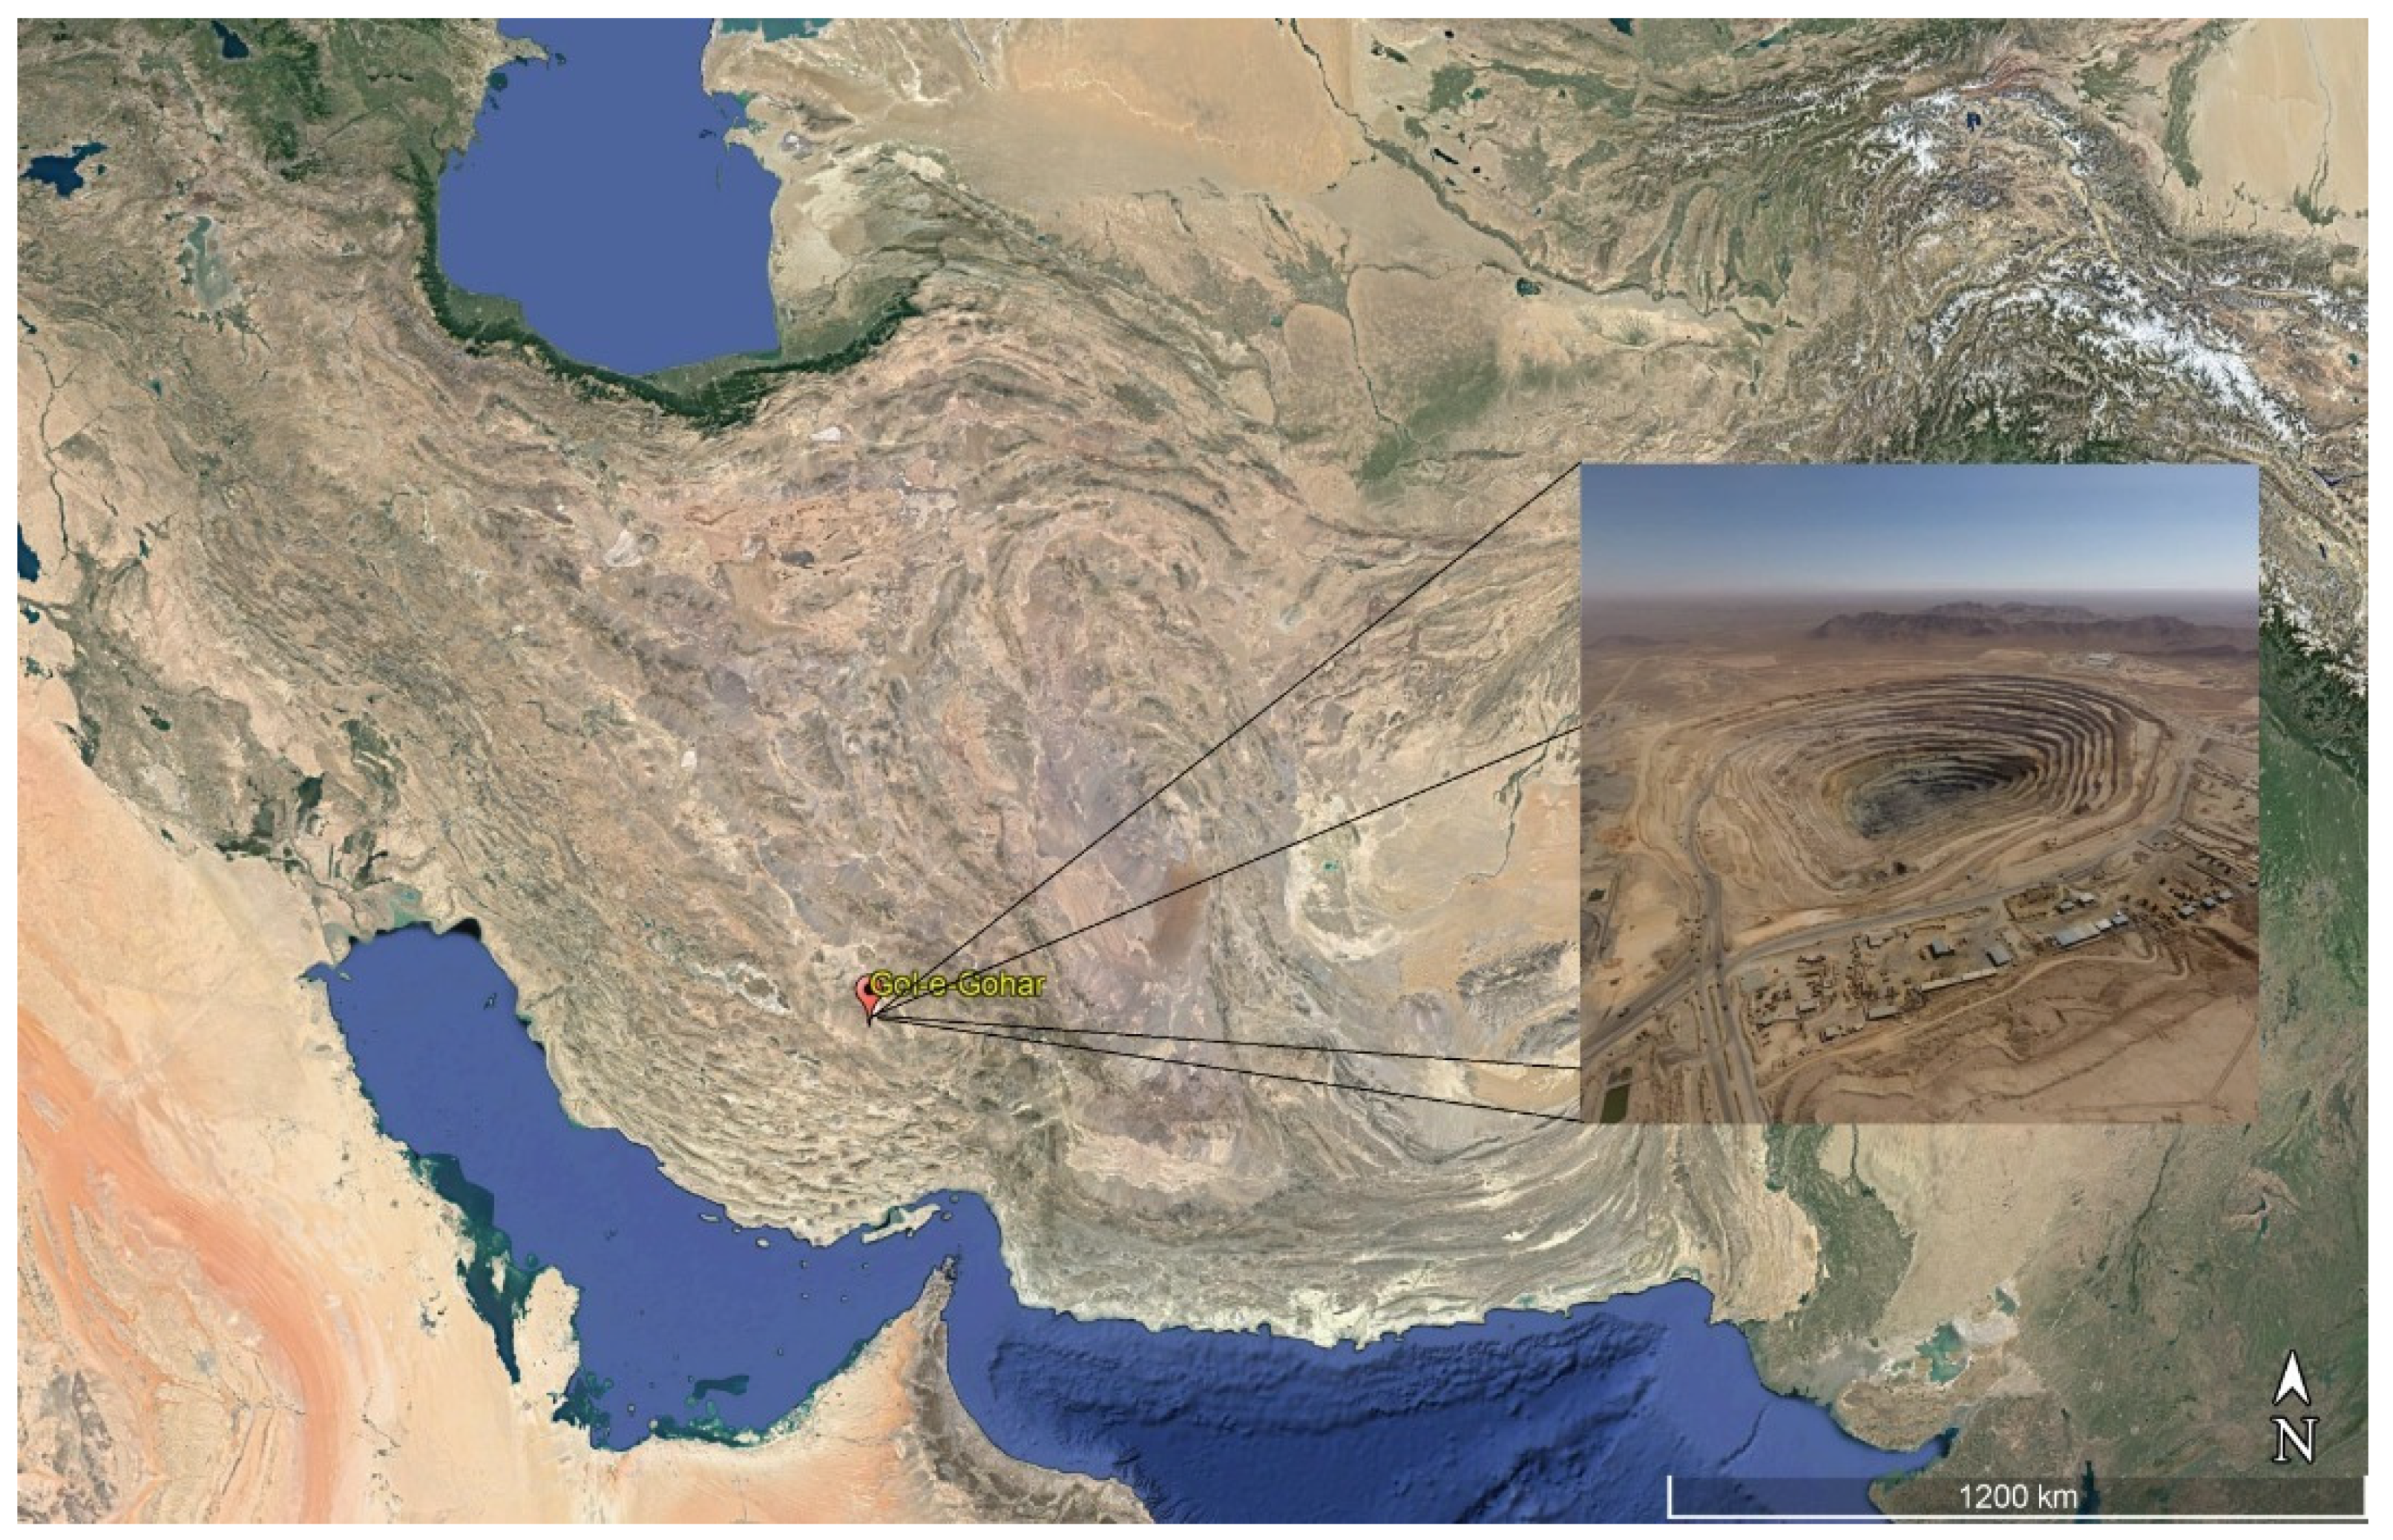
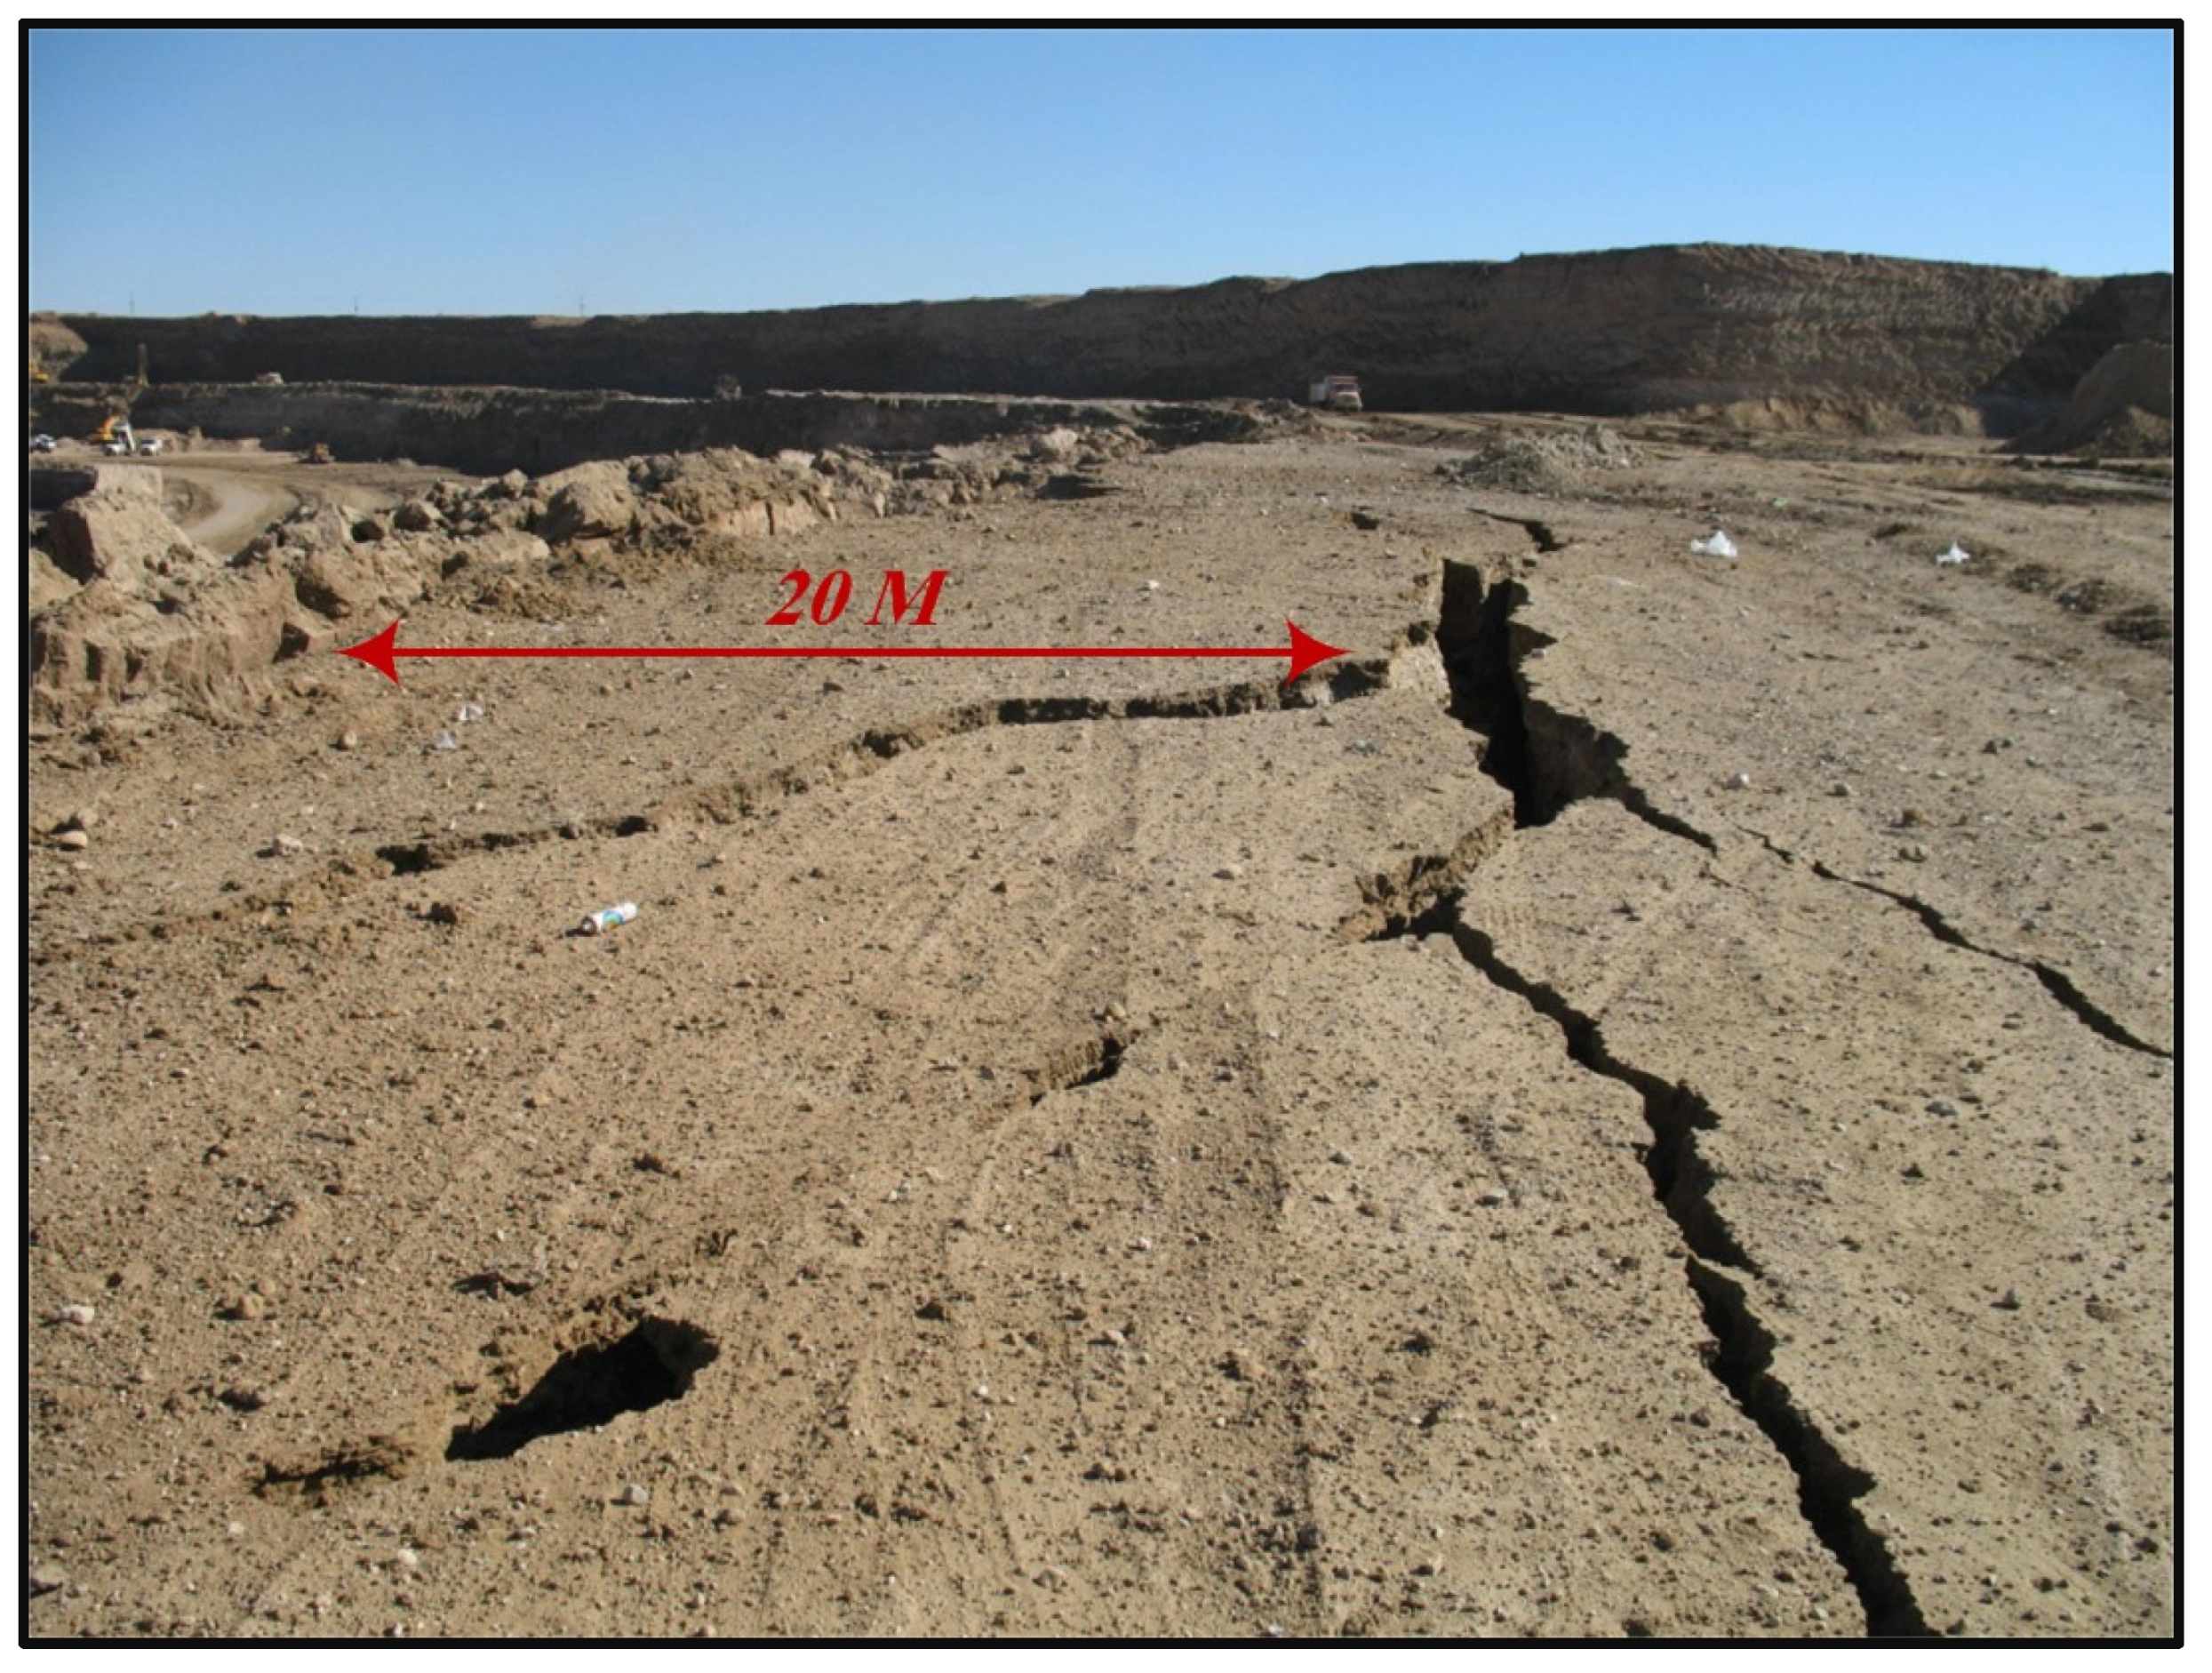
2. Field Observation and Measurement
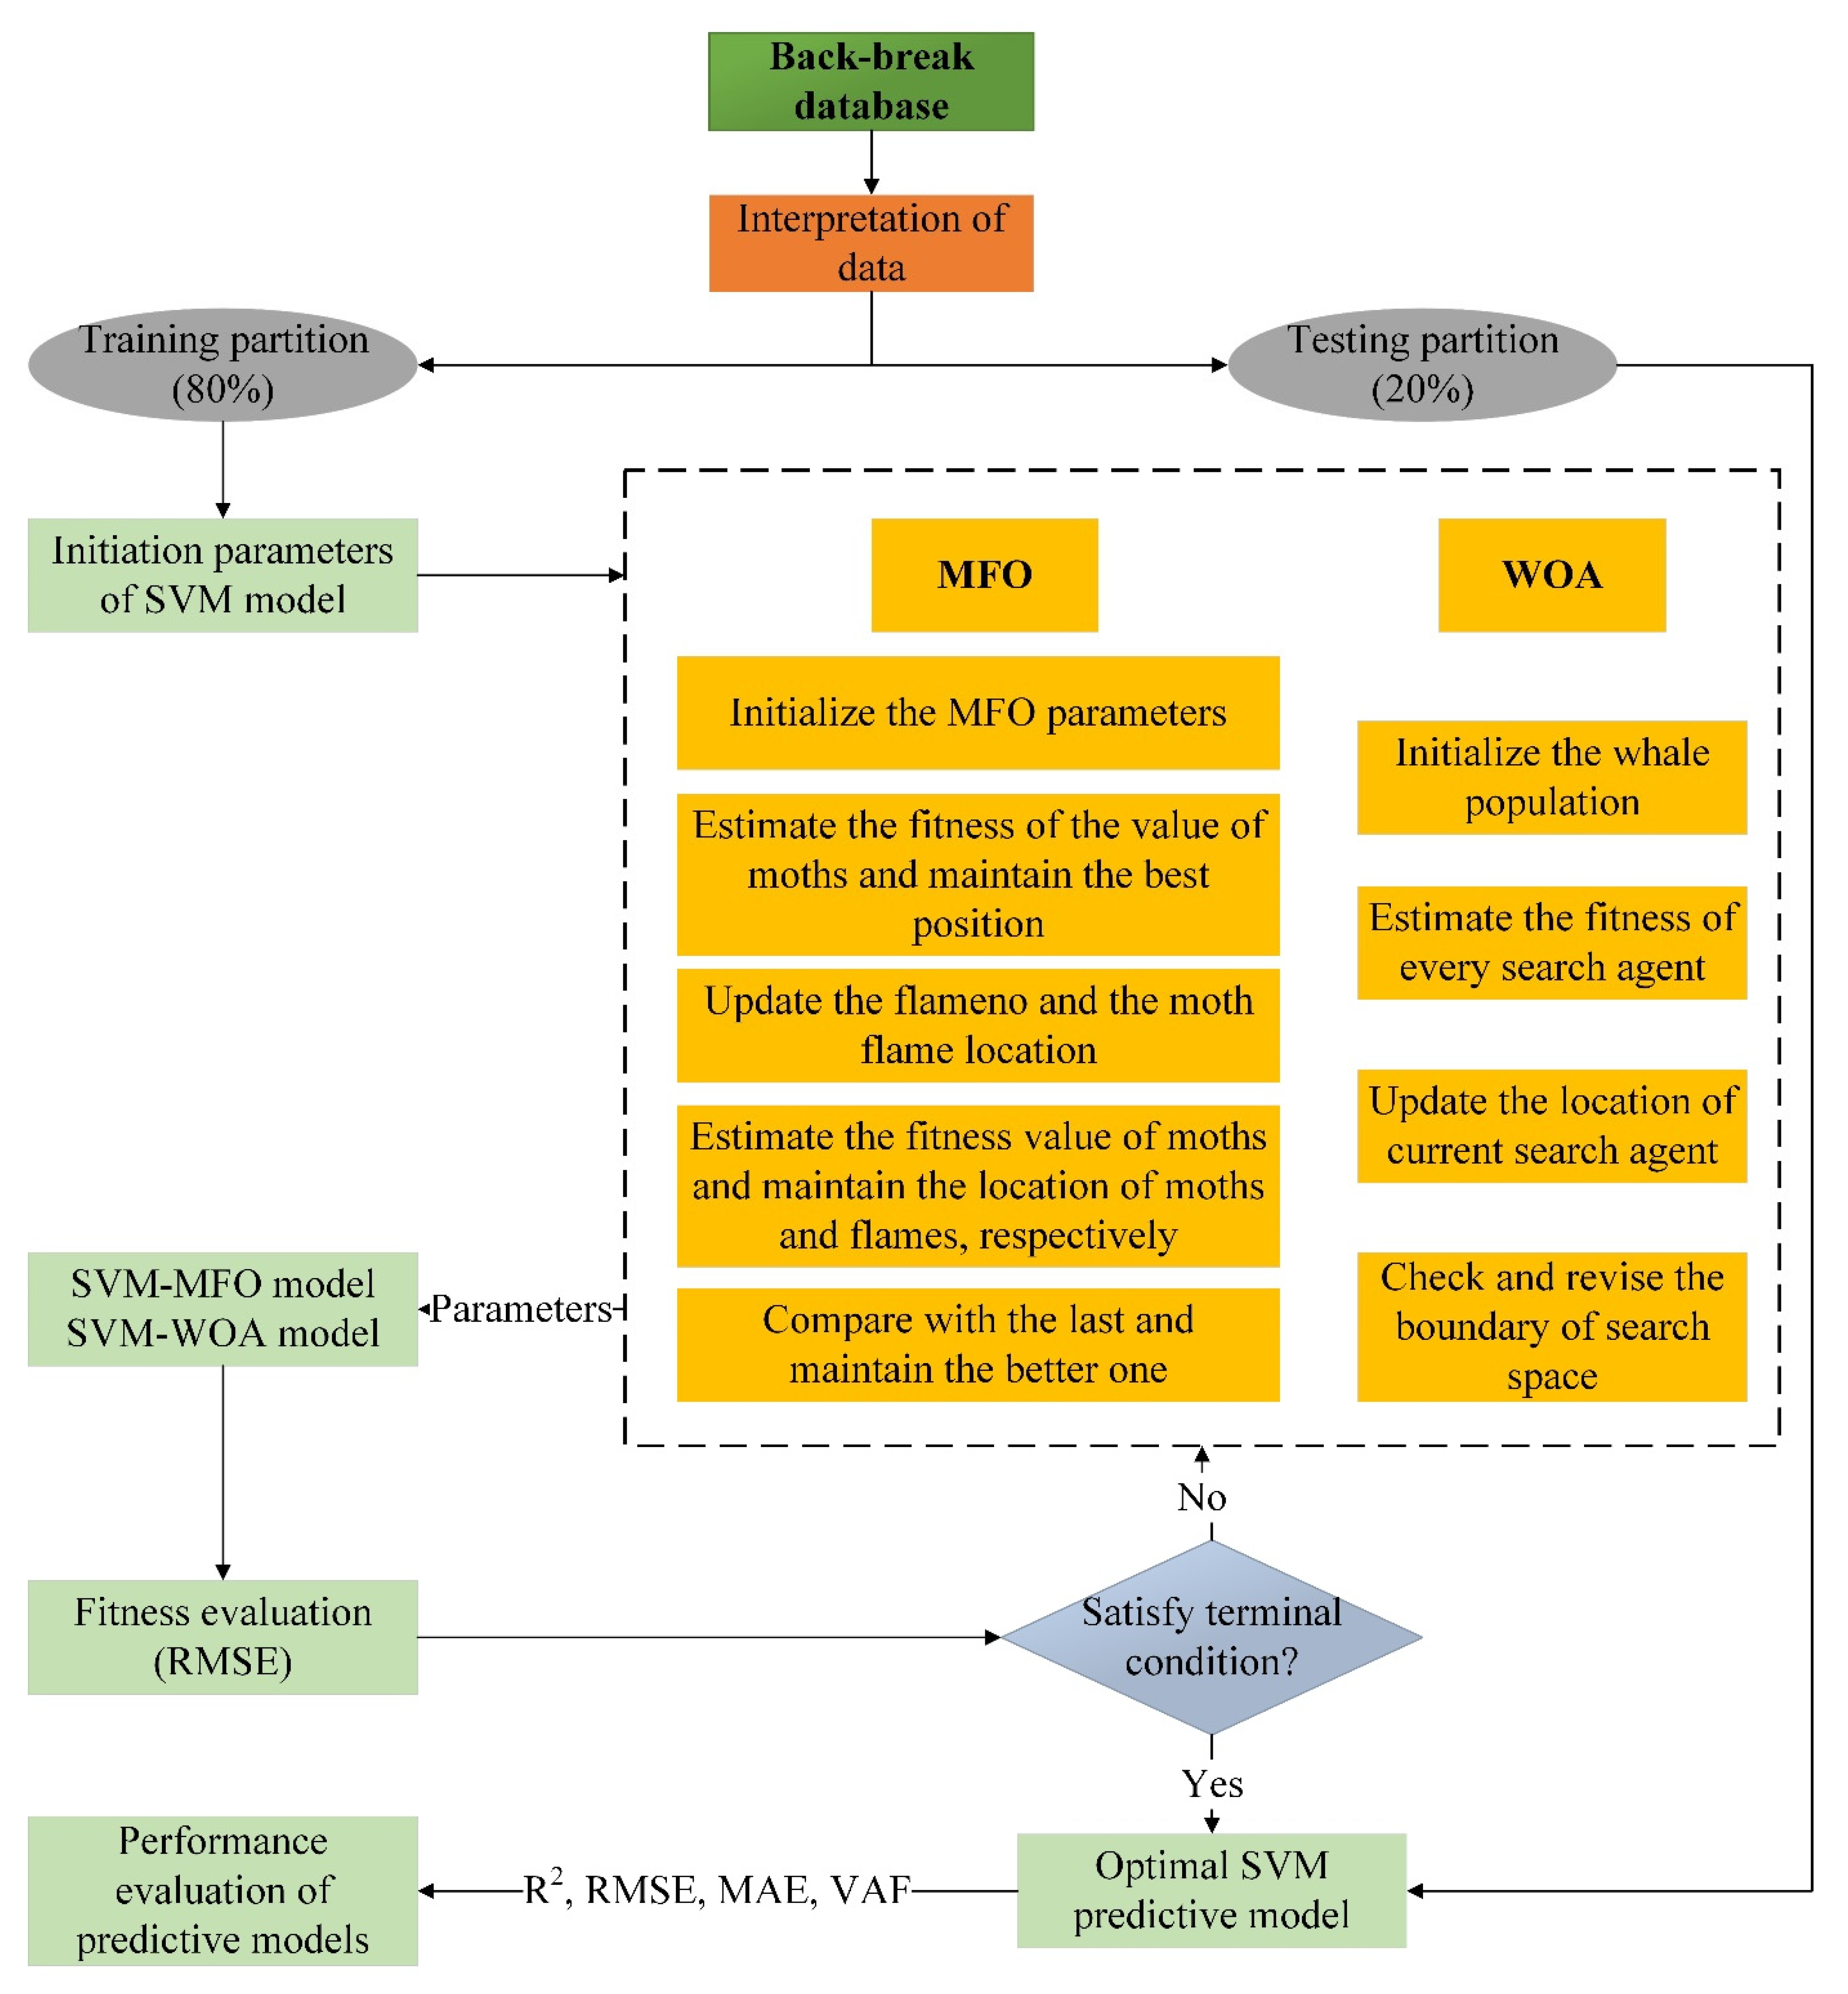
3. Methods
3.1. SVM
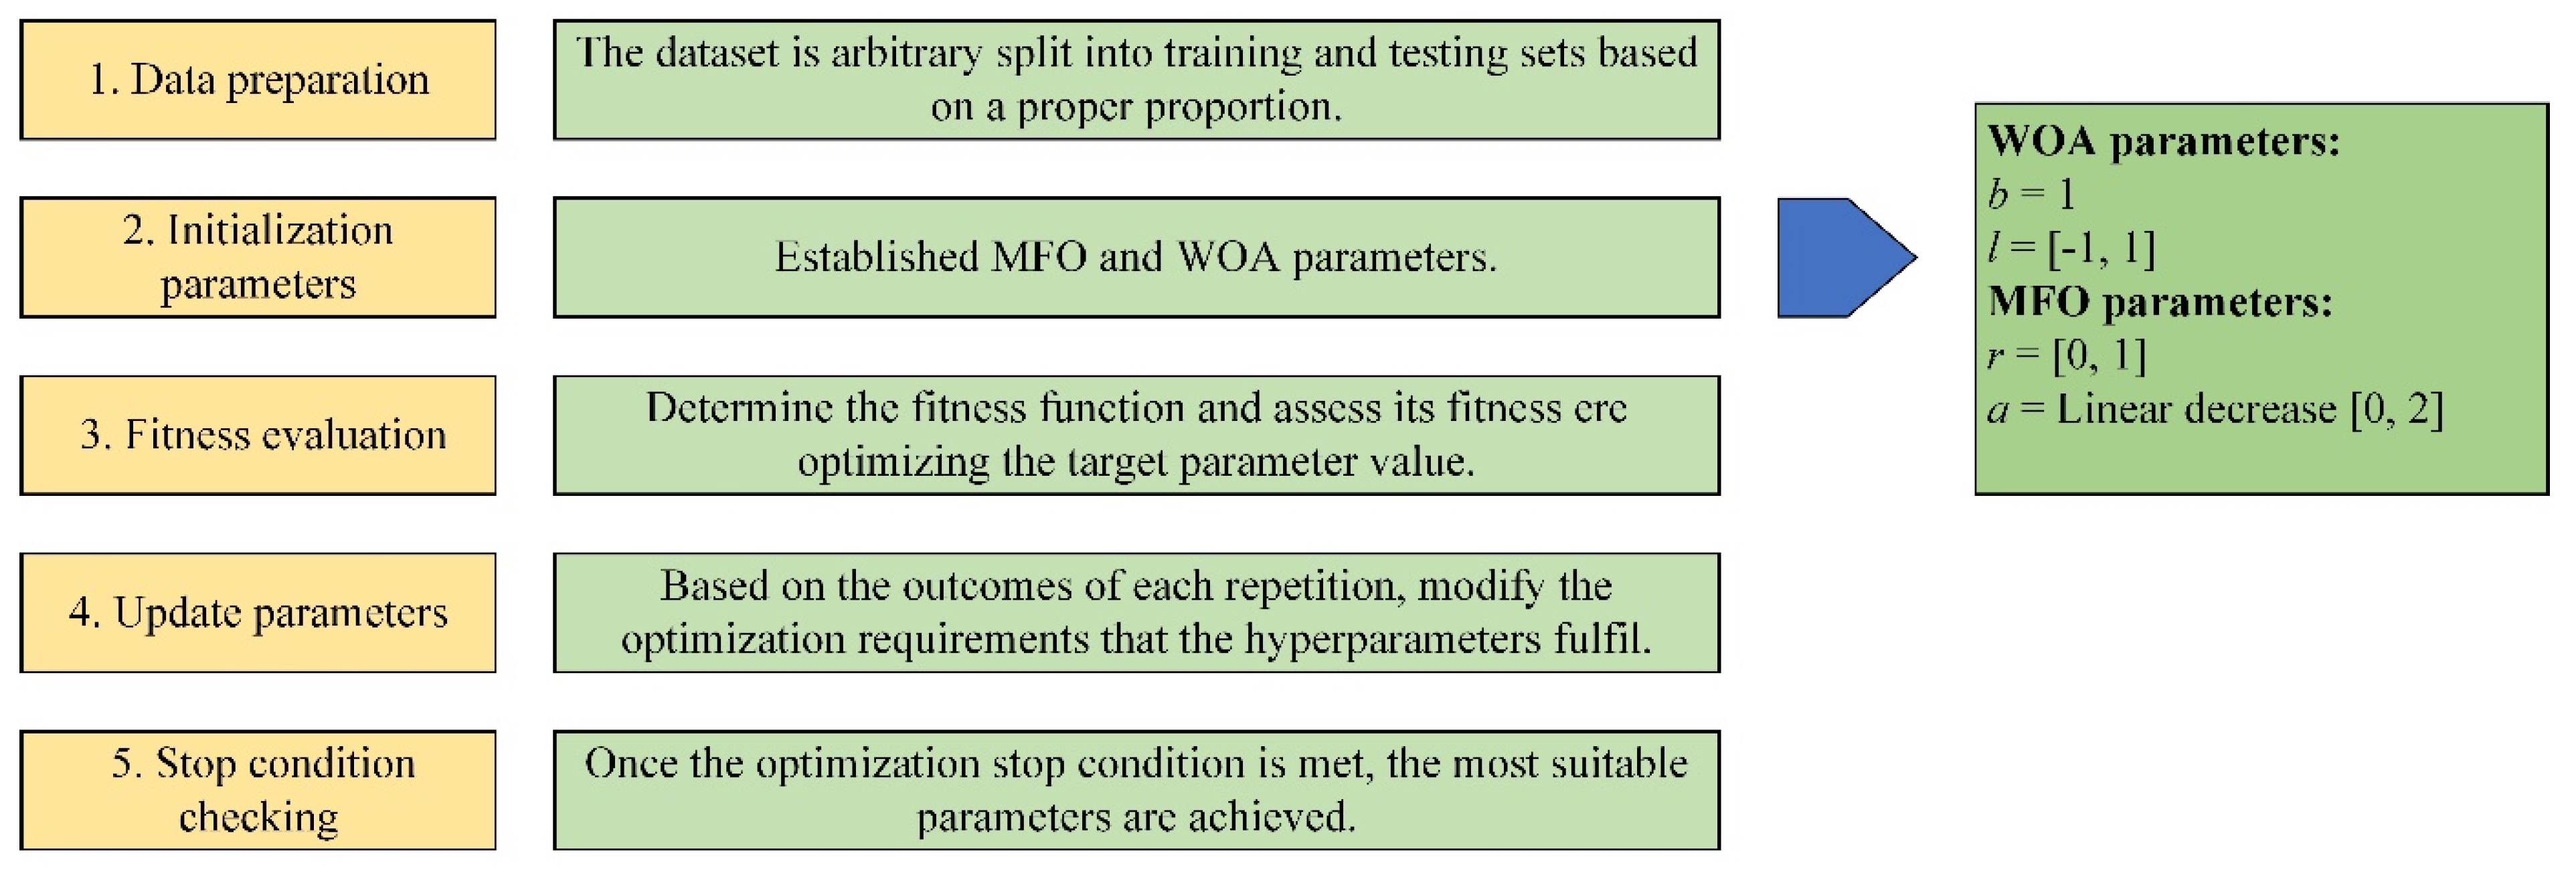
3.2. MFO
3.3. WOA
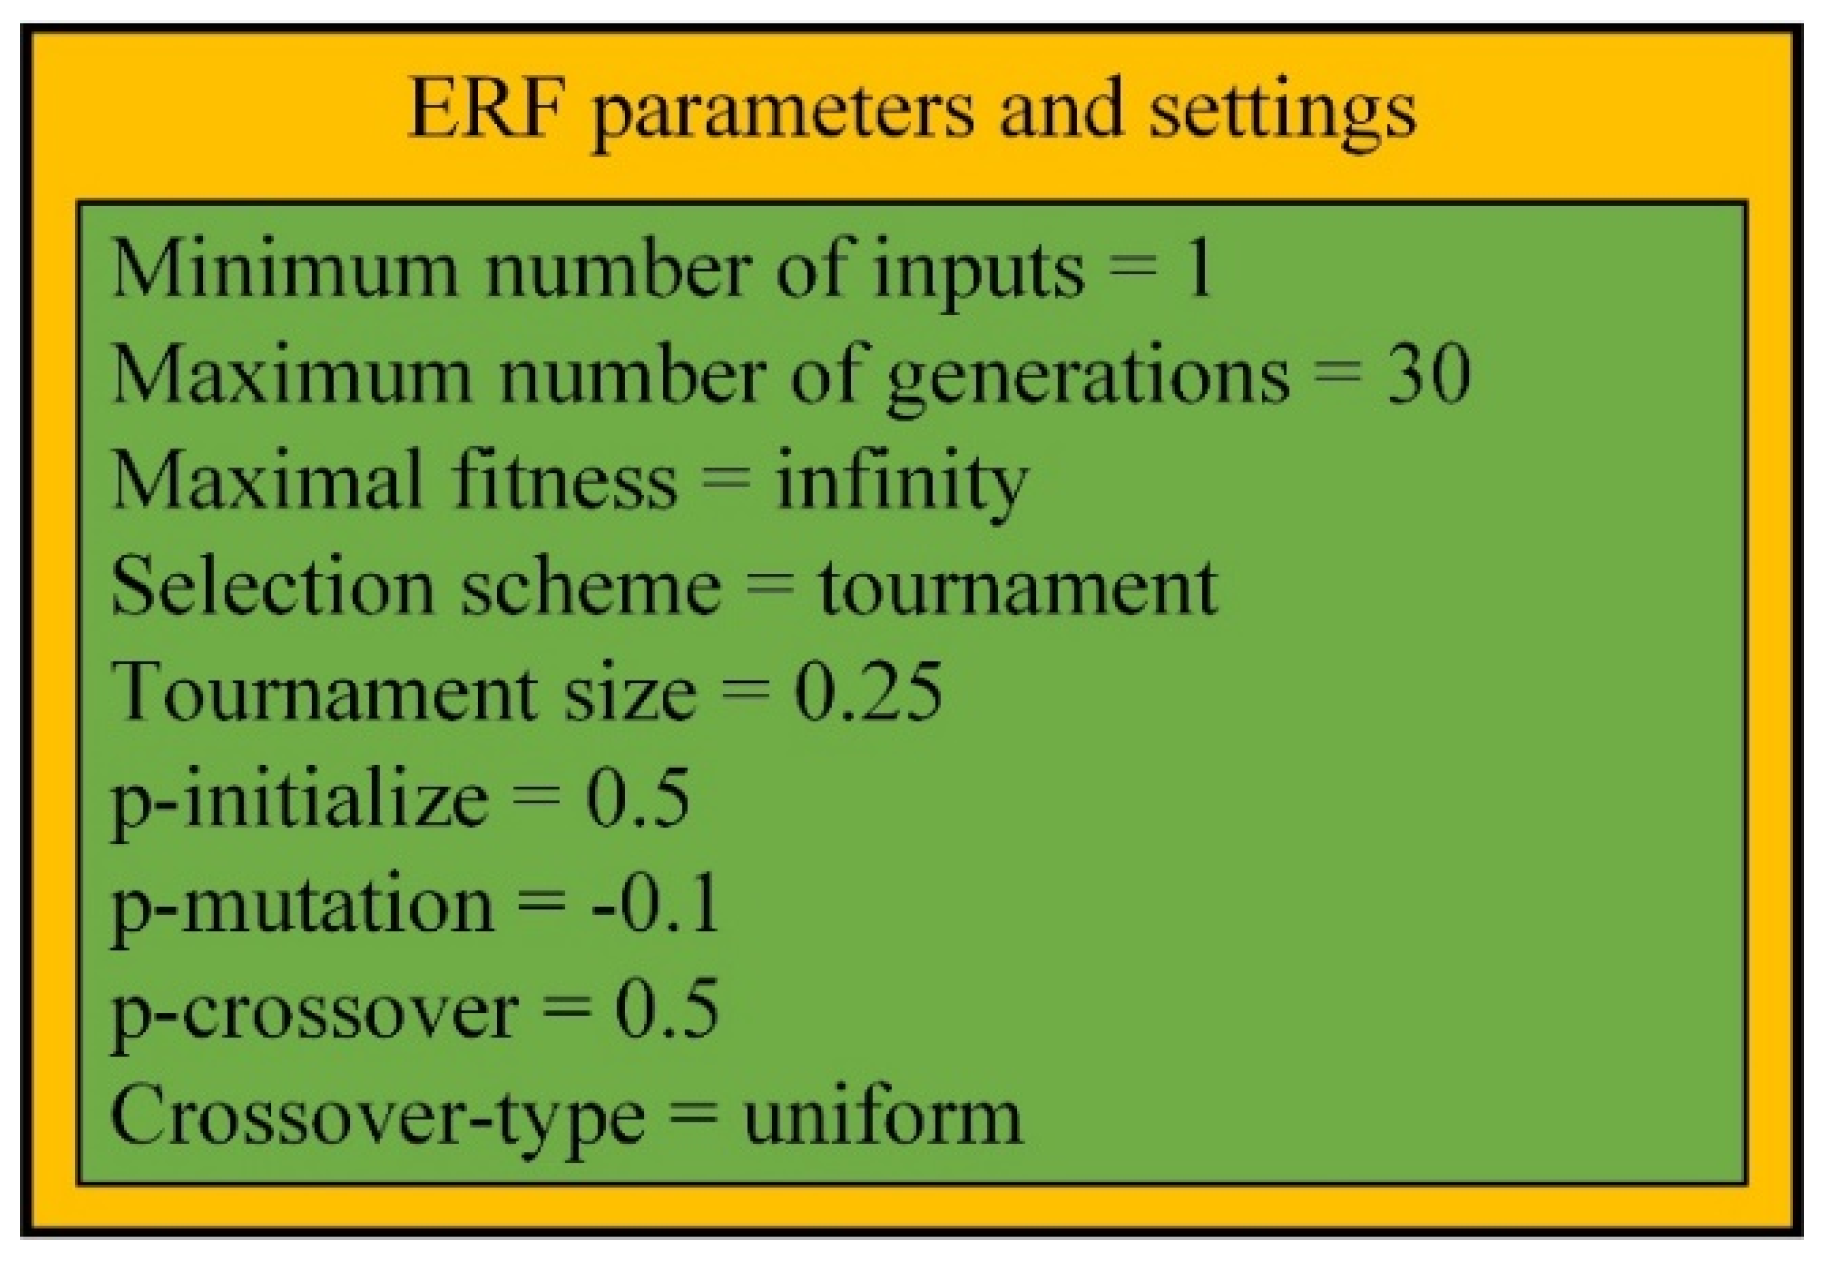
4. SVM Optimized Models
- C: 0.01–100;
- ε: 0.01–50.
5. Results and Discussions
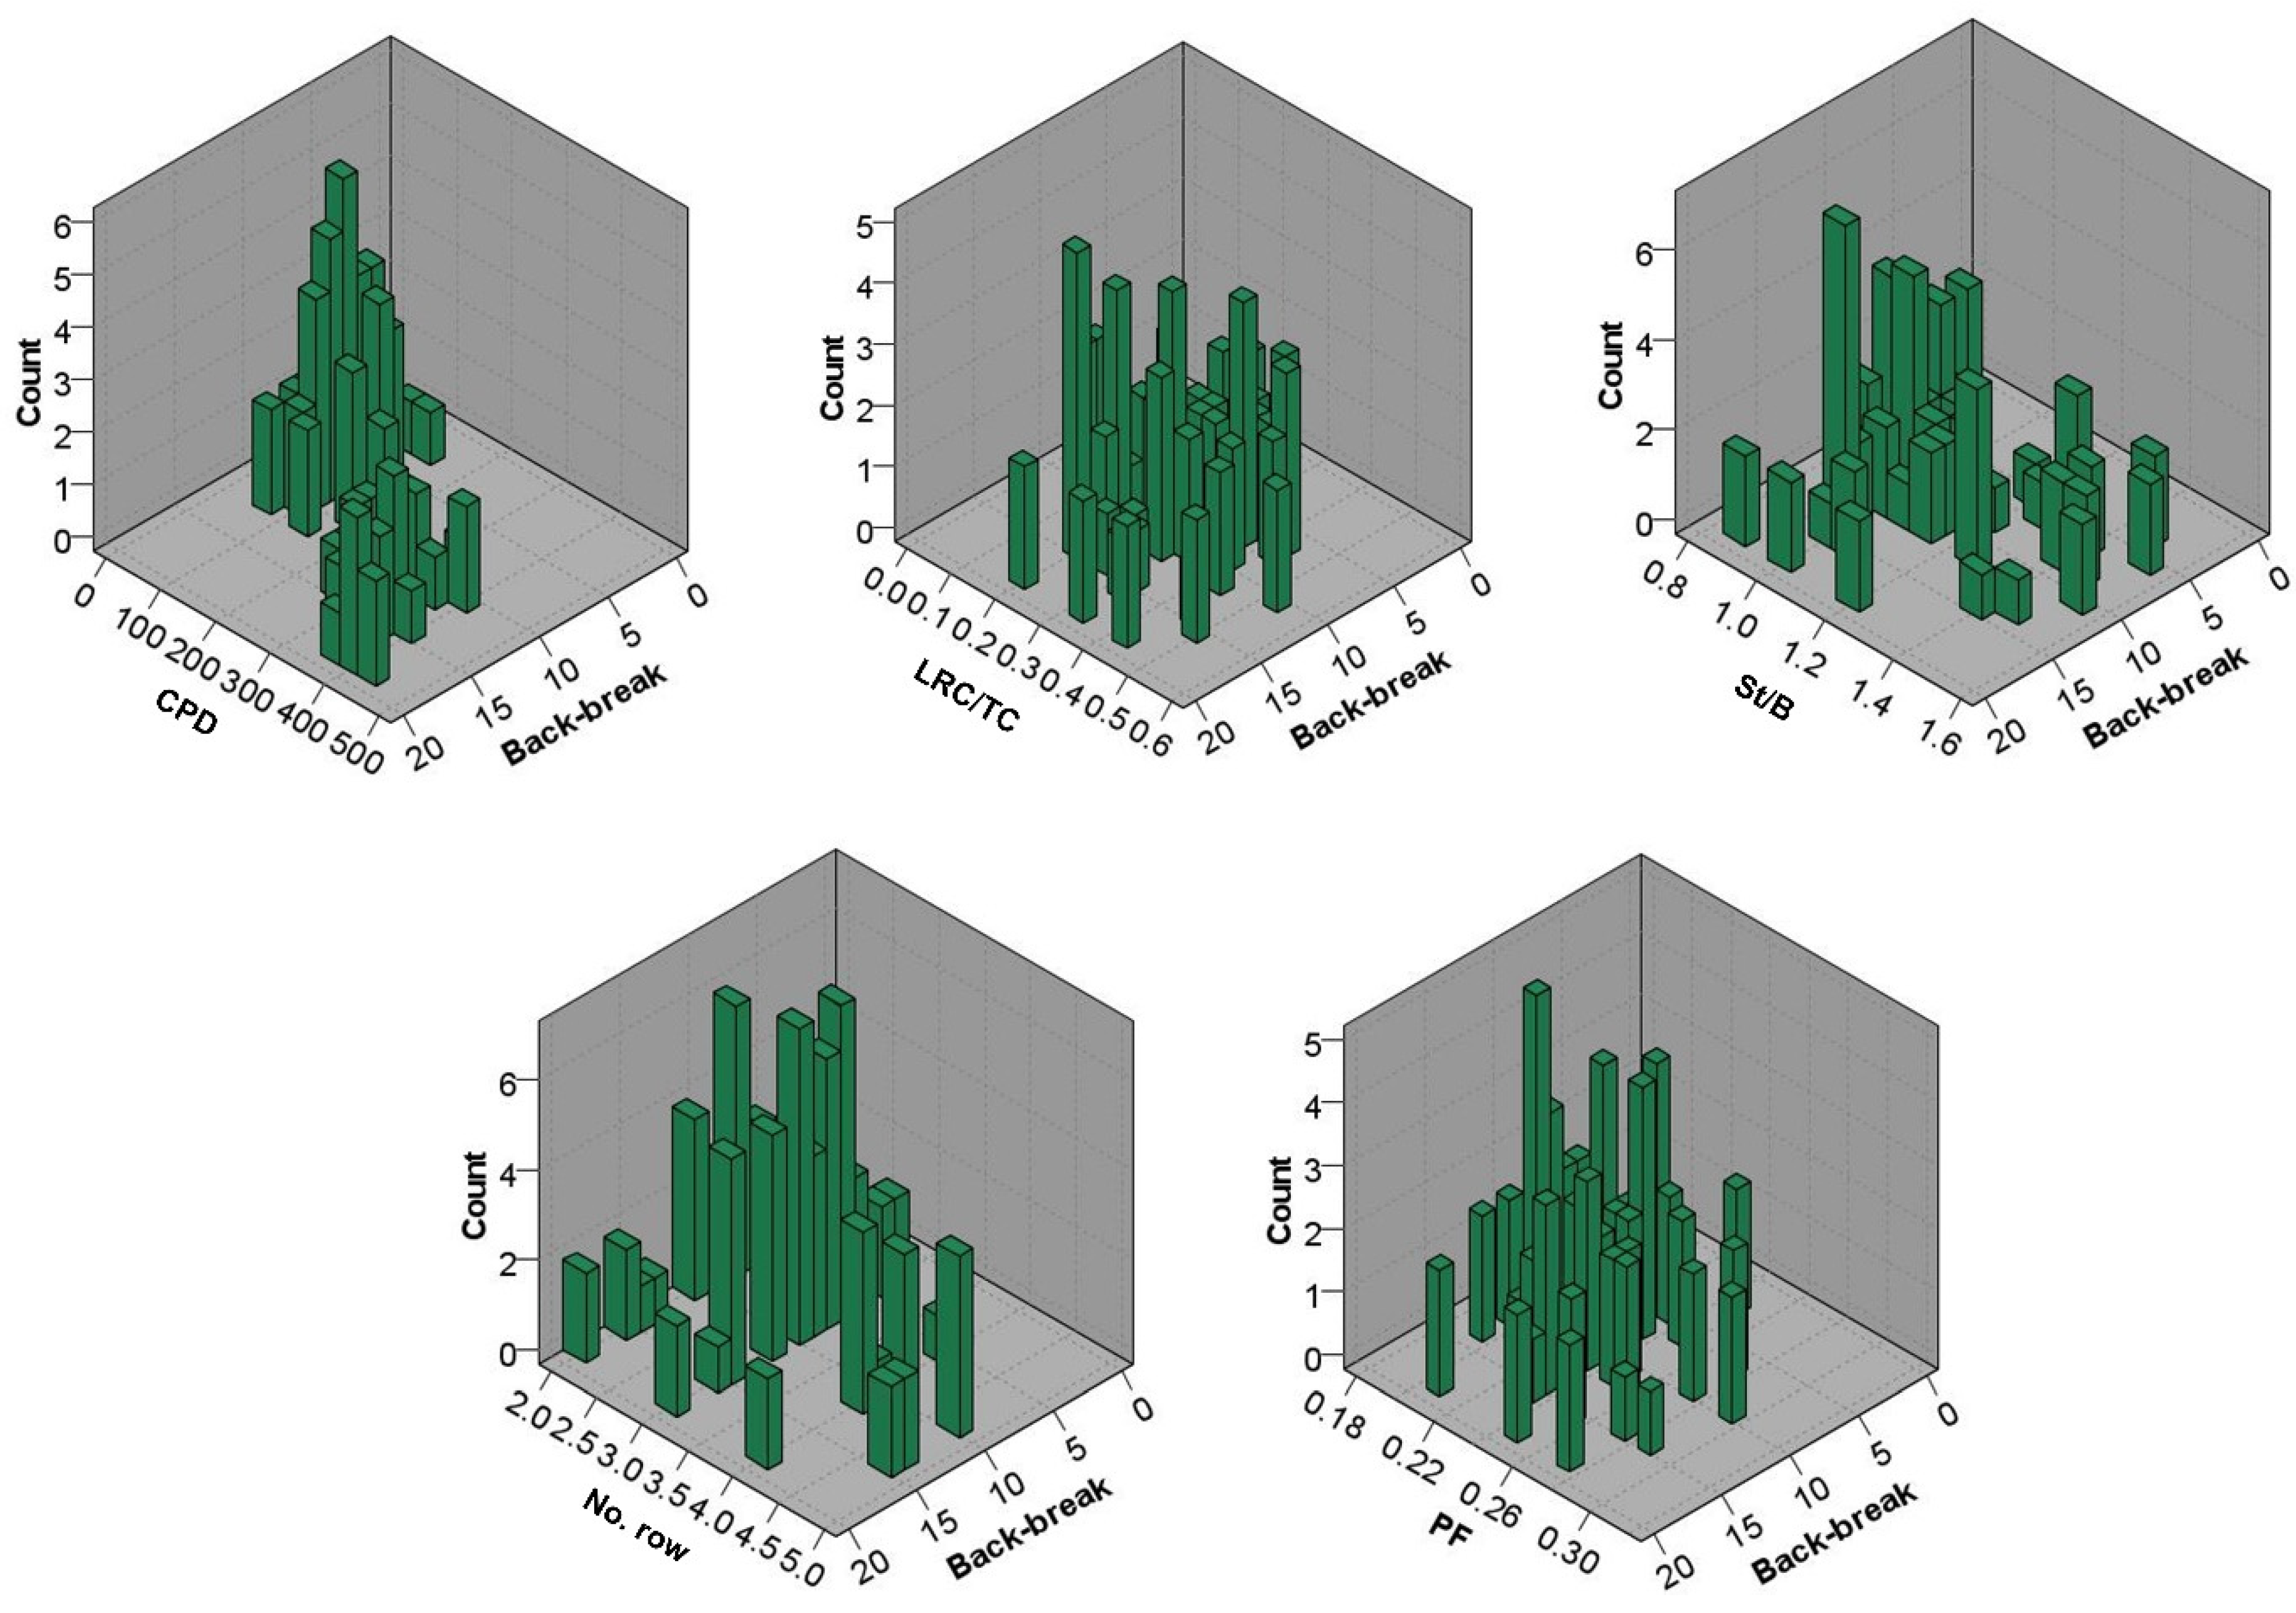
5.1. Feature Selection
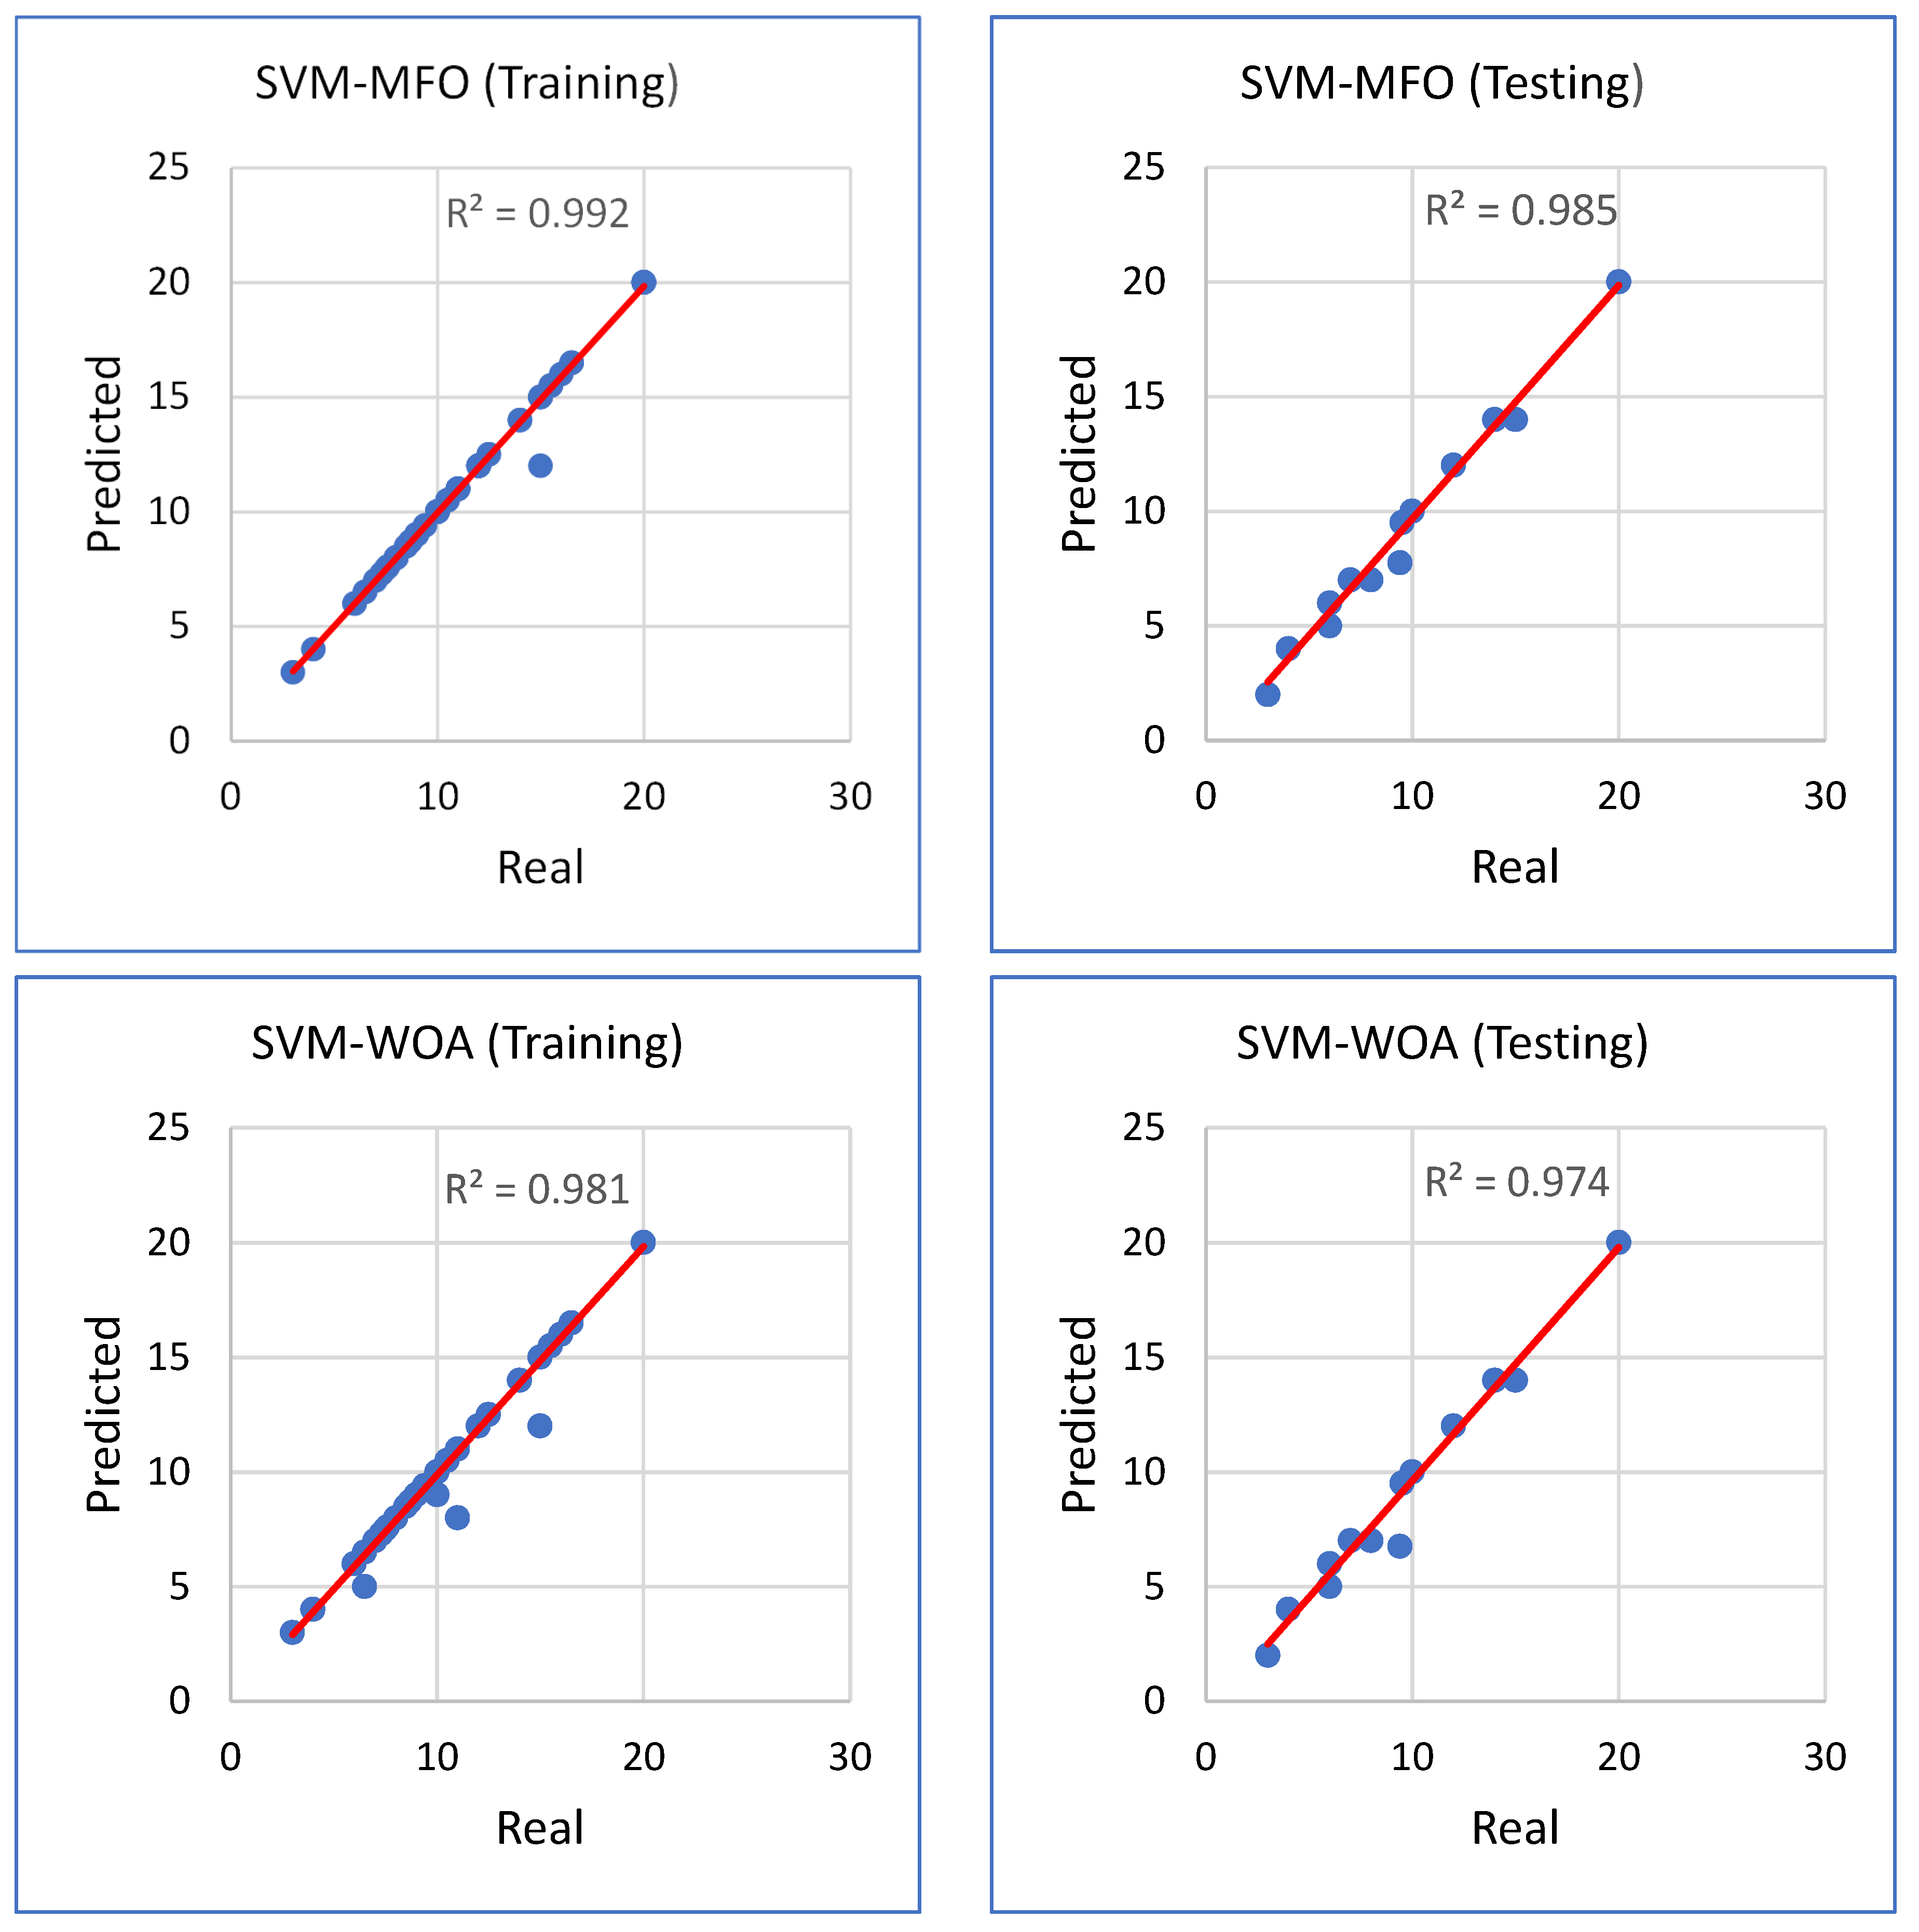
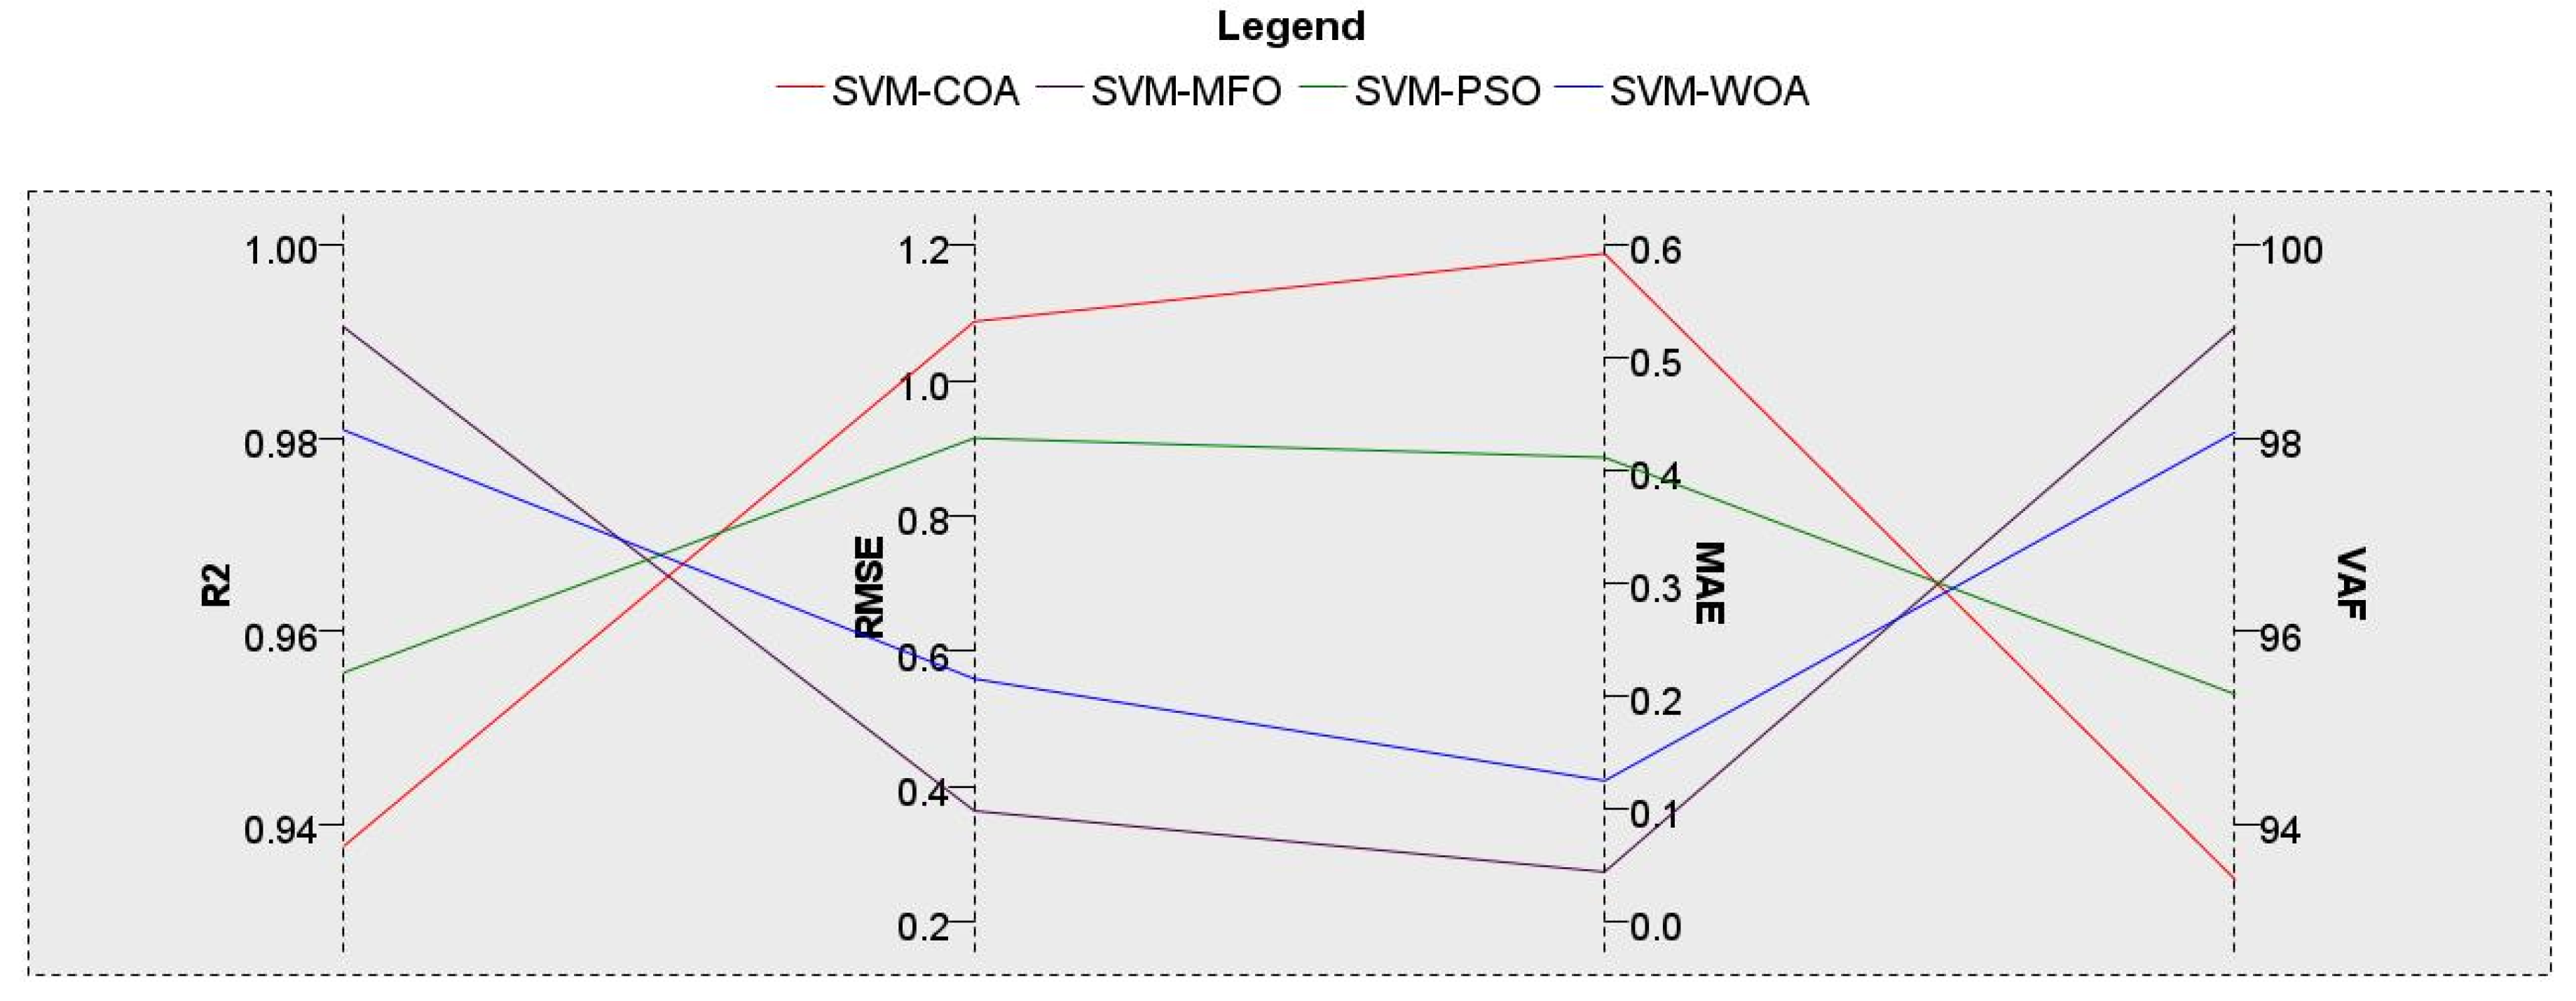
5.2. Models’ Development and Evaluation
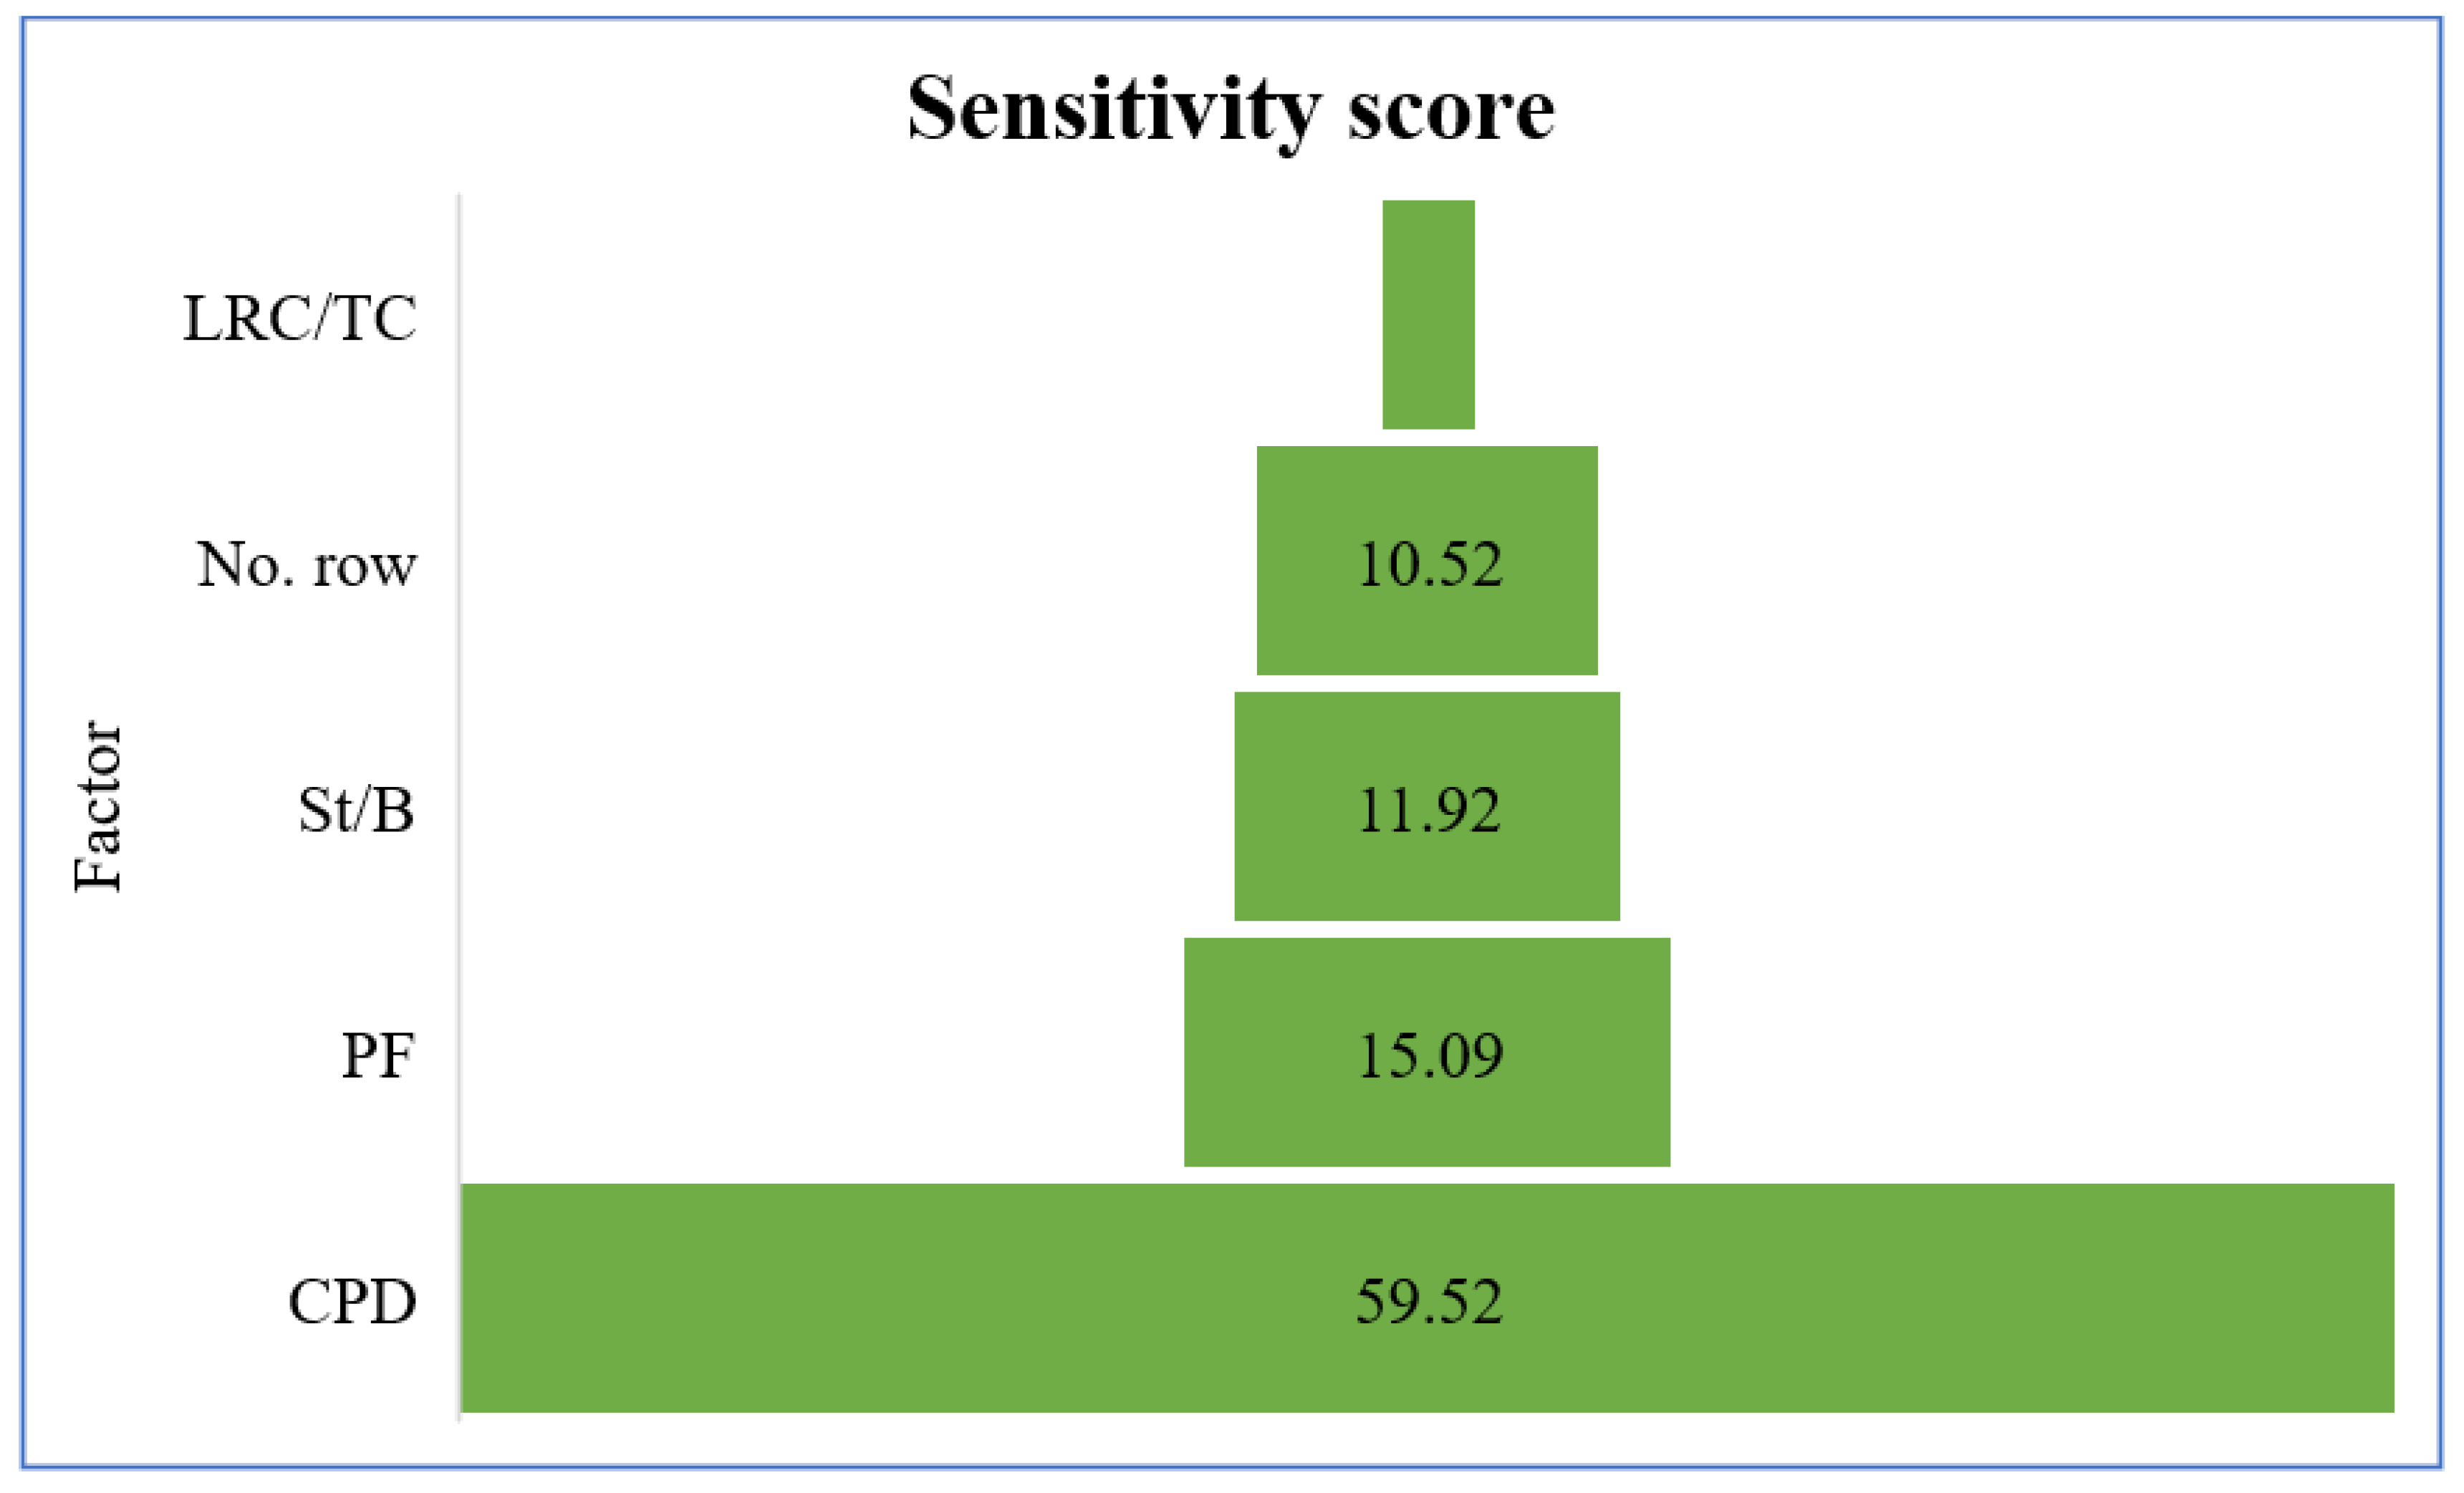
6. Analysis of Sensitivity
7. Conclusions
Author Contributions
Funding
Institutional Review Board Statement
Informed Consent Statement
Data Availability Statement
Conflicts of Interest
References
- Jimeno, C.L.; Jimeno, E.L.; Carcedo, F.J.A. Drilling and Blasting of Rocks; Balkema: Rotterdam, The Netherlands, 1995; pp. 183–184. [Google Scholar] [CrossRef]
- Mohammadnejad, M.; Gholami, R.; Sereshki, F.; Jamshidi, A. A new methodology to predict backbreak in blasting operation. Int. J. Rock Mech. Min. Sci. 2013, 60, 75–81. [Google Scholar] [CrossRef]
- Esmaeili, M.; Osanloo, M.; Rashidinejad, F.; Bazzazi, A.A.; Taji, M. Multiple regression, ANN and ANFIS models for prediction of backbreak in the open pit blasting. Eng. Comput. 2014, 30, 549–558. [Google Scholar] [CrossRef]
- Konya, C.J.; Walter, E.J. Surface Blast Design; Prentice Hall: Englewood Cliffs, NJ, USA, 1990. [Google Scholar]
- Bhandari, S. Engineering Rock Blasting Operations; A.A. Balkema: Rotterdam, The Netherlands, 1997. [Google Scholar]
- Agrawal, H.; Mishra, A. Modified scaled distance regression analysis approach for prediction of blast-induced ground vibration in multi-hole blasting. J. Rock Mech. Geotech. Eng. 2019, 11, 202–207. [Google Scholar] [CrossRef]
- Jayasinghe, B.; Zhao, Z.; Chee, A.G.T.; Zhou, H.; Gui, Y. Attenuation of rock blasting induced ground vibration in rock-soil interface. J. Rock Mech. Geotech. Eng. 2019, 11, 770–778. [Google Scholar] [CrossRef]
- Armaghani, D.J.; Koopialipoor, M.; Bahri, M.; Hasanipanah, M.; Tahir, M.M. A SVR-GWO technique to minimize flyrock distance resulting from blasting. Bull. Int. Assoc. Eng. Geol. Environ. 2020, 79, 4369–4385. [Google Scholar] [CrossRef]
- Gates, W.C.; Ortiz, L.T.; Florez, R.M. Analysis of rockfall and blasting backbreak problems, US 550, Molas Pass, CO. In Proceedings of the Alaska Rocks 2005 the 40th US Symposium on Rock Mechanics (USRMS), Anchorage, AK, USA, 25–29 June 2005. [Google Scholar]
- Kumar, R.; Choudhury, D.; Bhargava, K. Determination of blast-induced ground vibration equations for rocks using mechanical and geological properties. J. Rock Mech. Geotech. Eng. 2016, 8, 341–349. [Google Scholar] [CrossRef] [Green Version]
- Bhagade, N.V.; Murthy, V.M.S.R. Controlling backbreak and enhancing fragmentation in dragline bench blasting—A geo-engineering approach. Arab. J. Geosci. 2020, 13, 304. [Google Scholar] [CrossRef]
- Khandelwal, M.; Monjezi, M. Prediction of Backbreak in Open-Pit Blasting Operations Using the Machine Learning Method. Rock Mech. Rock Eng. 2012, 46, 389–396. [Google Scholar] [CrossRef]
- Monjezi, M.; Ahmadi, Z.; Varjani, A.Y.; Khandelwal, M. Backbreak prediction in the Chadormalu iron mine using artificial neural network. Neural Comput. Appl. 2013, 23, 1101–1107. [Google Scholar] [CrossRef]
- Monjezi, M.; Rezaei, M.; Yazdian, A. Prediction of backbreak in open-pit blasting using fuzzy set theory. Expert Syst. Appl. 2010, 37, 2637–2643. [Google Scholar] [CrossRef]
- Faramarzi, F.; Farsangi, M.A.E.; Mansouri, H. An RES-Based Model for Risk Assessment and Prediction of Backbreak in Bench Blasting. Rock Mech. Rock Eng. 2013, 46, 877–887. [Google Scholar] [CrossRef]
- Sari, M.; Ghasemi, E.; Ataei, M. Stochastic Modeling Approach for the Evaluation of Backbreak due to Blasting Operations in Open Pit Mines. Rock Mech. Rock Eng. 2014, 47, 771–783. [Google Scholar] [CrossRef]
- Hasanipanah, M.; Amnieh, H.B. Developing a new uncertain rule-based fuzzy approach for evaluating the blast-induced backbreak. Eng. Comput. 2021, 37, 1879–1893. [Google Scholar] [CrossRef]
- Zhou, J.; Dai, Y.; Khandelwal, M.; Monjezi, M.; Yu, Z.; Qiu, Y. Performance of Hybrid SCA-RF and HHO-RF Models for Predicting Backbreak in Open-Pit Mine Blasting Operations. Nat. Resour. Res. 2021, 30, 4753–4771. [Google Scholar] [CrossRef]
- Sharma, M.; Agrawal, H.; Choudhary, B.S. Multivariate regression and genetic programming for prediction of backbreak in open-pit blasting. Neural Comput. Appl. 2021. [Google Scholar] [CrossRef]
- Khandelwal, M.; Singh, T.N. Prediction of Blast Induced Air Overpressure in Opencast Mine. Noise Vib. Worldw. 2005, 36, 7–16. [Google Scholar] [CrossRef]
- Armaghani, D.J.; Momeni, E.; Abad, S.V.A.N.K.; Khandelwal, M. Feasibility of ANFIS model for prediction of ground vibrations resulting from quarry blasting. Environ. Earth Sci. 2015, 74, 2845–2860. [Google Scholar] [CrossRef] [Green Version]
- Qiu, Y.; Zhou, J.; Khandelwal, M.; Yang, H.; Yang, P.; Li, C. Performance evaluation of hybrid WOA-XGBoost, GWO-XGBoost and BO-XGBoost models to predict blast-induced ground vibration. Eng. Comput. 2021. [Google Scholar] [CrossRef]
- Rezaeineshat, A.; Monjezi, M.; Mehrdanesh, A.; Khandelwal, M. Optimization of blasting design in open pit limestone mines with the aim of reducing ground vibration using robust techniques. Géoméch. Geophys. Geo-Energy Geo-Resour. 2020, 6, 40. [Google Scholar] [CrossRef]
- Yu, Z.; Shi, X.; Miao, X.; Zhou, J.; Khandelwal, M.; Chen, X.; Qiu, Y. Intelligent modeling of blast-induced rock movement prediction using dimensional analysis and optimized artificial neural network technique. Int. J. Rock Mech. Min. Sci. 2021, 143, 104794. [Google Scholar] [CrossRef]
- Yang, H.; Zeng, Y.; Lan, Y.; Zhou, X. Analysis of the excavation damaged zone around a tunnel accounting for geostress and unloading. Int. J. Rock Mech. Min. Sci. 2014, 69, 59–66. [Google Scholar] [CrossRef]
- Yang, H.; Li, Z.; Jie, T.; Zhang, Z. Effects of joints on the cutting behavior of disc cutter running on the jointed rock mass. Tunn. Undergr. Space Technol. 2018, 81, 112–120. [Google Scholar] [CrossRef]
- Yang, H.; Xing, S.; Wang, Q.; Li, Z. Model test on the entrainment phenomenon and energy conversion mechanism of flow-like landslides. Eng. Geol. 2018, 239, 119–125. [Google Scholar] [CrossRef]
- Yang, H.; Wang, Z.; Song, K. A new hybrid grey wolf optimizer-feature weighted-multiple kernel-support vector regression technique to predict TBM performance. Eng. Comput. 2020. [Google Scholar] [CrossRef]
- Liu, B.; Yang, H.; Karekal, S. Effect of Water Content on Argillization of Mudstone During the Tunnelling process. Rock Mech. Rock Eng. 2020, 53, 799–813. [Google Scholar] [CrossRef]
- Zhou, J.; Shen, X.; Qiu, Y.; Li, E.; Rao, D.; Shi, X. Improving the efficiency of microseismic source locating using a heuristic algorithm-based virtual field optimization method. Géoméch. Geophys. Geo-Energy Geo-Resour. 2021, 7, 89. [Google Scholar] [CrossRef]
- Zhou, J.; Qiu, Y.; Khandelwal, M.; Zhu, S.; Zhang, X. Developing a hybrid model of Jaya algorithm-based extreme gradient boosting machine to estimate blast-induced ground vibrations. Int. J. Rock Mech. Min. Sci. 2021, 145, 104856. [Google Scholar] [CrossRef]
- Zhou, J.; Li, X.; Mitri, H.S. Classification of Rockburst in Underground Projects: Comparison of Ten Supervised Learning Methods. J. Comput. Civ. Eng. 2016, 30, 04016003. [Google Scholar] [CrossRef]
- Zhou, J.; Chen, C.; Wang, M.; Khandelwal, M. Proposing a novel comprehensive evaluation model for the coal burst liability in underground coal mines considering uncertainty factors. Int. J. Min. Sci. Technol. 2021, 31, 799–812. [Google Scholar] [CrossRef]
- Li, Y.; Hishamuddin, F.N.S.; Mohammed, A.S.; Armaghani, D.J.; Ulrikh, D.V.; Dehghanbanadaki, A.; Azizi, A. The Effects of Rock Index Tests on Prediction of Tensile Strength of Granitic Samples: A Neuro-Fuzzy Intelligent System. Sustainability 2021, 13, 10541. [Google Scholar] [CrossRef]
- Parsajoo, M.; Armaghani, D.J.; Mohammed, A.S.; Khari, M.; Jahandari, S. Tensile strength prediction of rock material using non-destructive tests: A comparative intelligent study. Transp. Geotech. 2021, 31, 100652. [Google Scholar] [CrossRef]
- Armaghani, D.J.; Harandizadeh, H.; Momeni, E.; Maizir, H.; Zhou, J. An optimized system of GMDH-ANFIS predictive model by ICA for estimating pile bearing capacity. Artif. Intell. Rev. 2021. [Google Scholar] [CrossRef]
- Al-Bared, M.A.M.; Mustaffa, Z.; Armaghani, D.J.; Marto, A.; Yunus, N.Z.M.; Hasanipanah, M. Application of hybrid intelligent systems in predicting the unconfined compressive strength of clay material mixed with recycled additive. Transp. Geotech. 2021, 30, 100627. [Google Scholar] [CrossRef]
- Mohammed, A.; Asteris, P.; Koopialipoor, M.; Alexakis, D.; Lemonis, M.; Armaghani, D. Stacking Ensemble Tree Models to Predict Energy Performance in Residential Buildings. Sustainability 2021, 13, 8298. [Google Scholar] [CrossRef]
- Briševac, Z.; Hrženjak, P.; Buljan, R. Models for estimating uniaxial compressive strength and elastic modulus. Građevinar 2016, 68, 19–28. [Google Scholar] [CrossRef] [Green Version]
- Briševac, Z.; Pollak, D.; Maričić, A.; Vlahek, A. Modulus of Elasticity for Grain-Supported Carbonates—Determination and Estimation for Preliminary Engineering Purposes. Appl. Sci. 2021, 11, 6148. [Google Scholar] [CrossRef]
- Briševac, Z.; Hrženjak, P.; Cotman, I. Estimate of Uniaxial Compressive Strength and Young’s Modulus of the Elasticity of Natural Stone Giallo d’Istria. Procedia Eng. 2017, 191, 434–441. [Google Scholar] [CrossRef]
- Monjezi, M.; Khoshalan, H.A.; Varjani, A.Y. Prediction of flyrock and backbreak in open pit blasting operation: A neuro-genetic approach. Arab. J. Geosci. 2012, 5, 441–448. [Google Scholar] [CrossRef]
- Sayadi, A.; Monjezi, M.; Talebi, N.; Khandelwal, M. A comparative study on the application of various artificial neural networks to simultaneous prediction of rock fragmentation and backbreak. J. Rock Mech. Geotech. Eng. 2013, 5, 318–324. [Google Scholar] [CrossRef] [Green Version]
- Monjezi, M.; Rizi, S.M.H.; Majd, V.J.; Khandelwal, M. Artificial Neural Network as a Tool for Backbreak Prediction. Geotech. Geol. Eng. 2014, 32, 21–30. [Google Scholar] [CrossRef]
- Ebrahimi, E.; Monjezi, M.; Khalesi, M.R.; Armaghani, D.J. Prediction and optimization of back-break and rock fragmentation using an artificial neural network and a bee colony algorithm. Bull. Int. Assoc. Eng. Geol. 2016, 75, 27–36. [Google Scholar] [CrossRef]
- Faradonbeh, R.S.; Monjezi, M.; Armaghani, D.J. Genetic programing and non-linear multiple regression techniques to predict backbreak in blasting operation. Eng. Comput. 2016, 32, 123–133. [Google Scholar] [CrossRef]
- Kumar, S.; Mishra, A.K.; Choudhary, B.S. Prediction of back break in blasting using random decision trees. Eng. Comput. 2021. [Google Scholar] [CrossRef]
- Saghatforoush, A.; Monjezi, M.; Faradonbeh, R.S.; Armaghani, D.J. Combination of neural network and ant colony optimization algorithms for prediction and optimization of flyrock and back-break induced by blasting. Eng. Comput. 2015, 32, 255–266. [Google Scholar] [CrossRef]
- Nguyen, H.; Bui, X.-N.; Choi, Y.; Lee, C.W.; Armaghani, D.J. A Novel Combination of Whale Optimization Algorithm and Support Vector Machine with Different Kernel Functions for Prediction of Blasting-Induced Fly-Rock in Quarry Mines. Nat. Resour. Res. 2021, 30, 191–207. [Google Scholar] [CrossRef]
- Guo, H.; Nguyen, H.; Bui, X.-N.; Armaghani, D.J. A new technique to predict fly-rock in bench blasting based on an ensemble of support vector regression and GLMNET. Eng. Comput. 2021, 37, 421–435. [Google Scholar] [CrossRef]
- Hasanipanah, M.; Monjezi, M.; Shahnazar, A.; Armaghani, D.J.; Farazmand, A. Feasibility of indirect determination of blast induced ground vibration based on support vector machine. Measurement 2015, 75, 289–297. [Google Scholar] [CrossRef]
- Armaghani, D.J.; Asteris, P.G.; Askarian, B.; Hasanipanah, M.; Tarinejad, R.; Van Huynh, V. Examining Hybrid and Single SVM Models with Different Kernels to Predict Rock Brittleness. Sustainability 2020, 12, 2229. [Google Scholar] [CrossRef] [Green Version]
- Khandelwal, M. Blast-induced ground vibration prediction using support vector machine. Eng. Comput. 2011, 27, 193–200. [Google Scholar] [CrossRef]
- Shi, X.-Z.; Zhou, J.; Wu, B.; Huang, D.; Wei, W. Support vector machines approach to mean particle size of rock fragmentation due to bench blasting prediction. Trans. Nonferrous Met. Soc. China 2012, 22, 432–441. [Google Scholar] [CrossRef]
- Rad, H.N.; Hasanipanah, M.; Rezaei, M.; Eghlim, A.L. Developing a least squares support vector machine for estimating the blast-induced flyrock. Eng. Comput. 2018, 34, 709–717. [Google Scholar] [CrossRef]
- Vapnik, V. The Nature of Statistical Learning Theory; Springer Science & Business Media: New York, NY, USA, 2013. [Google Scholar]
- Feng, Y.; Peng, Y.; Cui, N.; Gong, D.; Zhang, K. Modeling reference evapotranspiration using extreme learning machine and generalized regression neural network only with temperature data. Comput. Electron. Agric. 2017, 136, 71–78. [Google Scholar] [CrossRef]
- Mirjalili, S. Moth-flame optimization algorithm: A novel nature-inspired heuristic paradigm. Knowl.-Based Syst. 2015, 89, 228–249. [Google Scholar] [CrossRef]
- Mirjalili, S.; Lewis, A. The Whale Optimization Algorithm. Adv. Eng. Softw. 2016, 95, 51–67. [Google Scholar] [CrossRef]
- Armaghani, D.J.; Hajihassani, M.; Mohamad, E.T.; Marto, A.; Noorani, S.A. Blasting-induced flyrock and ground vibration prediction through an expert artificial neural network based on particle swarm optimization. Arab. J. Geosci. 2014, 7, 5383–5396. [Google Scholar] [CrossRef]
- Armaghani, D.J.; Mohamad, E.T.; Narayanasamy, M.S.; Narita, N.; Yagiz, S. Development of hybrid intelligent models for predicting TBM penetration rate in hard rock condition. Tunn. Undergr. Space Technol. 2017, 63, 29–43. [Google Scholar] [CrossRef]
- Armaghani, D.J.; Yagiz, S.; Mohamad, E.T.; Zhou, J. Prediction of TBM performance in fresh through weathered granite using empirical and statistical approaches. Tunn. Undergr. Space Technol. 2021, 118, 104183. [Google Scholar] [CrossRef]
- Parsajoo, M.; Armaghani, D.J.; Asteris, P.G. A precise neuro-fuzzy model enhanced by artificial bee colony techniques for assessment of rock brittleness index. Neural Comput. Appl. 2021. [Google Scholar] [CrossRef]
- Harandizadeh, H.; Armaghani, D.J.; Asteris, P.G.; Gandomi, A.H. TBM performance prediction developing a hybrid ANFIS-PNN predictive model optimized by imperialism competitive algorithm. Neural Comput. Appl. 2021, 33, 16149–16179. [Google Scholar] [CrossRef]
- Armaghani, D.J.; Mohamad, E.T.; Momeni, E.; Narayanasamy, M.S. An adaptive neuro-fuzzy inference system for predicting unconfined compressive strength and Young’s modulus: A study on Main Range granite. Bull. Int. Assoc. Eng. Geol. Environ. 2015, 74, 1301–1319. [Google Scholar] [CrossRef]
- Monjezi, M.; Dehghani, H. Evaluation of effect of blasting pattern parameters on back break using neural networks. Int. J. Rock Mech. Min. Sci. 2008, 45, 1446–1453. [Google Scholar] [CrossRef]
- Verron, S.; Tiplica, T.; Kobi, A. Fault detection and identification with a new feature selection based on mutual information. J. Process. Control 2008, 18, 479–490. [Google Scholar] [CrossRef] [Green Version]


| Method | Study | Input | Dataset Size |
|---|---|---|---|
| FIS | Monjezi, Rezaei and Yazdian [14] | Burden, charge per delay, hole depth, powder factor, rock density, spacing, specific drilling, stemming | - |
| ANN–GA | Monjezi et al. [42] | Burden, charge per delay, hole diameter, hole length, powder factor, rock mass rating, spacing, specific drilling | 195 |
| ANN | Monjezi, Ahmadi, Varjani and Khandelwal [13] | Burden, charge per delay, hole depth, hole diameter, powder factor, spacing, specific drilling, stemming, uniaxial compressive strength water content | 97 |
| ANN | Sayadi et al. [43] | Burden, hole depth, spacing, specific charge, specific drilling | 103 |
| SVM | Mohammadnejad, Gholami, Sereshki and Jamshidi [2] | Burden, hole depth, powder factor, spacing, specific drilling, stemming | 193 |
| SVM | Khandelwal and Monjezi [12] | Burden, hole length, powder factor, spacing, specific drilling, stemming | 234 |
| ANN | Monjezi et al. [44] | Burden, delay per burden, number of rows, powder factor rock factor, spacing, specific drilling, stemming | - |
| ANN, neuro-fuzzy | Esmaeili, Osanloo, Rashidinejad, Bazzazi and Taji [3] | Charge last row, number of rows, specific charge, stemming | 42 |
| ANN, ABC | Ebrahimi et al. [45] | Burden, hole depth, powder factor, spacing, stemming length | 34 |
| GP | Faradonbeh et al. [46] | Burden, powder factor, spacing, stemming, stiffness ratio | 175 |
| fuzzy RES–GA, fuzzy RES–ICA | Hasanipanah and Bakhshandeh Amnieh [17] | Burden, blast-hole inclination, burden to hole diameter ratio, charge per delay, hole diameter, spacing to burden ratio, stemming to burden ratio, velocity of detonation | 62 |
| RF | Kumar et al. [47]. | Spacing to burden ratio, P-wave, hole length to stemming ratio, density of explosive | 140 |
| SCA–RF, HHO–RF | Zhou, Dai, Khandelwal, Monjezi, Yu and Qiu [18] | Burden, hole length, powder factor, spacing, specific drilling, stemming | 234 |
| ANN, ACO | Saghatforoush et al. [48] | Burden, hole length, powder factor, spacing, stemming length | 97 |
| Parameter | Class | Unit | Acronym | Min | Max |
|---|---|---|---|---|---|
| Powder factor | Input | kg/ton | PF | 1.90 | 0.30 |
| Burden | Input | m | B | 5.00 | 6.50 |
| Spacing to burden ratio | Input | --- | S/B | 1.18 | 1.30 |
| Number of rows | Input | --- | No. row | 2.00 | 5.00 |
| Charge per delay | Input | Kg | CPD | 72.00 | 455.96 |
| Last row charge to total charge ratio | Input | --- | LRC/TC | 0.04 | 0.55 |
| Stemming to burden ratio | Input | --- | St/B | 0.80 | 1.60 |
| Joint condition | Input | --- | JC | 1.00 | 4.00 |
| Uniaxial compressive strength | Input | MPa | UCS | 55.00 | 90.00 |
| Water height to burden ratio | Input | --- | W/B | 0.00 | 2.00 |
| Back-break | Target | m | BB | 3.00 | 20.00 |
| Model | Training | Testing | ||||||
|---|---|---|---|---|---|---|---|---|
| R2 (rank) | RMSE (rank) | VAF (rank) | MAE (rank) | R2 (rank) | RMSE (rank) | VAF (rank) | MAE (rank) | |
| SVM | 0.885 (1) | 1.714 (1) | 88.404 (1) | 1.135 (1) | 0.844 (1) | 1.949 (1) | 82.391 (1) | 1.553 (1) |
| SVM–MFO | 0.992 (3) | 0.364 (3) | 99.150 (3) | 0.044 (3) | 0.985 (3) | 0.629 (3) | 98.371 (3) | 0.332 (3) |
| SVM–WOA | 0.981 (2) | 0.559 (2) | 98.064 (2) | 0.125 (2) | 0.974 (2) | 0.805 (2) | 97.168 (2) | 0.391 (2) |
| Training Rank | Testing Rank | Total Rank | |
|---|---|---|---|
| SVM | 4 | 4 | 8 |
| SVM–MFO | 12 | 12 | 24 |
| SVM–WOA | 8 | 8 | 16 |
Publisher’s Note: MDPI stays neutral with regard to jurisdictional claims in published maps and institutional affiliations. |
© 2021 by the authors. Licensee MDPI, Basel, Switzerland. This article is an open access article distributed under the terms and conditions of the Creative Commons Attribution (CC BY) license (https://creativecommons.org/licenses/by/4.0/).
Share and Cite
Yu, Q.; Monjezi, M.; Mohammed, A.S.; Dehghani, H.; Armaghani, D.J.; Ulrikh, D.V. Optimized Support Vector Machines Combined with Evolutionary Random Forest for Prediction of Back-Break Caused by Blasting Operation. Sustainability 2021, 13, 12797. https://doi.org/10.3390/su132212797
Yu Q, Monjezi M, Mohammed AS, Dehghani H, Armaghani DJ, Ulrikh DV. Optimized Support Vector Machines Combined with Evolutionary Random Forest for Prediction of Back-Break Caused by Blasting Operation. Sustainability. 2021; 13(22):12797. https://doi.org/10.3390/su132212797
Chicago/Turabian StyleYu, Qun, Masoud Monjezi, Ahmed Salih Mohammed, Hesam Dehghani, Danial Jahed Armaghani, and Dmitrii Vladimirovich Ulrikh. 2021. "Optimized Support Vector Machines Combined with Evolutionary Random Forest for Prediction of Back-Break Caused by Blasting Operation" Sustainability 13, no. 22: 12797. https://doi.org/10.3390/su132212797