Article

Will COVID-19 Threaten the Survival of the Airline Industry?

1
School of Business, Ningbo University, Ningbo 315211, China
2
College of Finance, Qilu University of Technology, Jinan 250353, China
3
School of Economics, University of Qingdao, Qingdao 266000, China
4
School of Economics and Management, Zhejiang Normal University, Jinhua 321004, China
*
Author to whom correspondence should be addressed.
Sustainability 2021, 13(21), 11666; https://doi.org/10.3390/su132111666
Submission received: 25 August 2021 / Revised: 16 September 2021 / Accepted: 23 September 2021 / Published: 21 October 2021
(This article belongs to the Collection Transportation Planning and Public Transport)

Abstract

:
The pandemic causes social distancing and lockdown, which impedes consumer confidence and contracts the economy. Hence, this study analyzes the corona (COVID-19) impact on the airline industry revenues (ALR) and forecast by the vector autoregression (VAR) method. The results indicate that gross domestic product (GDP) and air cargo are the best predictors of ALR. The forecasting outcomes explore if ALR will decline and expect to back to pre-COVID-19 in 2023. Our results resemble both the V-shaped and U-shaped, which suggests slow gradual recovery with longer lockdown and border disclosure. The government can restore confidence building by providing economic stimulus packages and can encourage the airline to return to travel. Furthermore, softening the passenger rules concerning the refund of unflown ticket, reducing taxes, and reducing overflight taxes, all reduce the costs. Similarly, the mutually recognized global standards are crucial for effective execution, and any temporary measures taken by the government should have a clear exit strategy. The study major limitation includes the lack of relevant research and data availability.

1. Introduction

The world is in the midst of the corona (COVID-19) shock, which is a dark time in history, causing significant economic implications for all segments of the economy [1]. Discussion of COVID-19 impact has become extremely important for policymakers. The pandemic has a great cost: bringing death, economic destruction, and changing every aspect of society. It is strangling the global economy, leading to layoffs, a tourism crisis, consumer spending, and plunging oil prices [2]. Similarly, the pandemic has changed consumer spending, unemployment, and the cost of living. It is predicted that economic growth will remain weak and dependent on government stimulus packages. Moreover, blockade and other measures have dampened consumer confidence and destroyed perishable products. The extent of effects is unknown, and severity varies from country to country, as it affects some areas more than others. The challenge is bigger than expected, and the situation will become clear at the end of the pandemic. However, it is extremely difficult to assess the comprehensive impact of the pandemic at the present point, which focuses on disease control.
The airline industry remains very fragile and one of the biggest casualties of the global COVID-19 pandemic [1,2,3]. Air traffic declines because of social isolation, and travel restrictions have grounded two-thirds of commercial airlines and deteriorate airline industry revenues (ARL). It is the worst kind of unrest, as 7.5 million flights are cancelled; customers demand refunds with no reservations. This is unprecedented in aviation history, and the greatest challenge when more planes are on the ground than in the air. The pandemic has disrupted the economy and hit tourism, which has led to ALR reduction because passenger demand closely follows GDP progression. It is predicted that COVID-19 can cost airlines a $320 billion loss in worldwide revenues, risking 25 million jobs directly and indirectly [4]. The member countries of the International Air Transport Association (IATA) lose $230 million on average per day and halve annual revenues from $838 million to $419 in 2020—the largest decline in recent history. According to the International Civil Aviation Organization [5], the current pandemic results in an overall reduction of 80% of passengers as compared to 2019. It is projected that the world’s GDP contracts by 3%, which influences trade and tourism and squeezes the passenger’s revenues by 48%. Air traffic is expecting to back to the pre-COVID-19 position in 2023.
The countries in this study include Australia, Brazil, Canada, China, France, Germany, Italy, India, South Korea, Japan, Netherlands, Spain, Russia, the United Kingdom (UK), and the U.S., which are amongst the top destinations of tourism and important economies of the world that contribute to employment and economic development [6]. However, these countries are the most affected by the disease, feeling the strain of rigorous nationwide lockdowns, international bans on nonessential travel, and a dramatic drop in passengers. The airline industry has lost $89 billion, and passenger demand is 55% below 2019 levels. The air traffic has collapsed to 90%, risking 6.7 million jobs, which harms the GDP by US$452 billion. Notably, France, the U.S., China, and Spain have shown bigger decreases in the number of scheduled flights compared to last year. In addition, India, Italy, and Germany are not far behind, where the major airlines will lose 50% revenues and passengers in 2020 compared to 2019. The social distancing leads to filling only two-thirds of the aircraft, resulting in revenue loss and bankruptcy of dozens of airlines. The industry’s outlook grows darker, and recovery can be U-shaped, as domestic travel improves faster than the international market. Most of the top airlines have cut capacity, which means a decline in flights and the number of seats. Likewise, most airlines are applying cost-cutting budgets to curtail the effect of the pandemic. Countries have employed stimulus packages to control the impact of the crisis and help in the recovery.
The current study is a useful contribution to the existing literature as follows: First, the study offers insightful evidence about the pandemic in the airline industry. It is one of the first study to analyze the COVID-19 impact on airline revenues because air transport is more affected by the pandemic. Second, the study covers the major countries of the world with leading factors that impact airline revenues and delivers useful inputs to the stakeholders to handle the situation. Last, forecasting is a useful procedure to evaluate the influence of COVID-19 and helps in developing effective policies by the governments and airline industry to minimize the shock impact. This study forecasts the effect of COVID-19 on ALR in these countries. The underlying countries are playing an important role in world economic affairs and observe huge air transports over the years. Thus, a successful resumption of the industry is vital for the economic recovery which requires to be examined. It is a useful tool for the concerned industries, policymakers, and governments to plan effective policies and mitigate the losses. In addition, this study considers the impact of exogenous variables, such as economic policy uncertainty, exchange rate, tourism, oil prices, economic growth, and air cargo on ALR [7].
We order the rest of the paper as follows: We begin with a review of the literature in Section 2; Section 3 explains scenario analysis and methodology. Section 4 describes the data. Section 5 comprises results and illustrates forecasting, discussion, and policy implications, and the last section concludes the study.

2. Literature Review

Dodson et al. [8], Cortez et al. [9], and Lutte and Bartle [10] show that sustainable practice implementation improves international air transportation in several dimensions. Bonser [11] and López Pascual et al. [12] confirm that the aviation industry is extremely vulnerable to uncertainty. Albers and Rundshagen [13] examine the European airline response strategies to COVID-19. The finding reveals that airlines have varying responses because of the greater government impact on these carriers. Similarly, the strategic alignment and business model will change in the long term. Goslings [14] finds that COVID-19 has grounded their fleets and halted long-haul destinations, and many have gone bankrupt. Sun et al. [3] evaluate the COVID-19 impact on the global airline industry and conclude that aviation is suffering the most. It shows that airline response was delayed, which has provided an opportunity to spread the pandemic at the global level. Nižetić [15] explains that many restrictions have affected the airline industry in Europe. It declines the number of flights and air cargo in the region. Agrawal [16] expresses that the pandemic has disrupted and threatened the airline industry because of lockdowns, and weak tourism condensed income. The industry is vulnerable to oil prices and monetary shocks and declining currency. Monmousseau et al. [17] study the influence of travel restriction due to COVID-19 on the U.S. air industry. The results show different airline has responded differently to COVID-19 from the passengers’ perspective.
Lau et al. [18] investigate the air traffic volume and COVID-19 and confirm a strong connection between the domestic case and passenger volume. Similarly, the relationship is significant between international COVID-19 cases and passengers’ volume, Budd et al. [19]. Rahman et al. [20] find that global airline revenues are projected to decline because of the COVID-19 decline in demand flights in Europe. The border closure by the governments resulted in disappeared passengers which altered the flight operation and reducing the staff 113 billion. Moreover, the pandemic has affected the air freight business due to flight cancellations. Li [21] analyzes the COVID-19 effect on China’s civil aviation and concludes that the air cargo outlook is optimistic. The air cargo sector can recover easily as compared to passenger transport. Serrano and Kazda [22] show that pandemic has restricted traveling, which has affected aviation badly, and airlines have ceased flights. However, the recovery can be expected at a slower rate, as V-shape and U-shape depend on the economic outlook. McKibbin and Fernando [1] confirm that the pandemic outbreak has significantly affected air transport. They show that the pandemic has far-reaching effects on the economy, interrupts production, and limited transport has further slowed down economic activities. Brauer and Dunne [23] show a decline in the international passengers’ traffic and ALR during 2002–2003, and the most palpable reasons are terrorist attacks, the Iraq war in 2003, and the spread of severe acute respiratory syndrome (SARS). Suau-Sanchez et al. [24] find that the airline industry is one of the hardest hit by the pandemic, which will change the aviation industry. This unexpected crisis is putting airlines under unprecedented strain. The COVID-19 pandemic is not only squeezed the airline industry but also disrupts the economic activities that considerably influence air transport demand and ALR. Bal and Varol [25] suggest that the airline industry plays a contributing role in the employment and trades between countries that are experiencing a crisis because of the COVID-19 outbreak. It has wiped out business, customers’ plan and restrictions on free travel, which has devastated the airline industry and ALR around the world.
The above literature related to the COVID-19 pandemic and its impact on the airline industry can be summarized in the following ways. First, as the pandemic crisis is evolving, it is uncertain when the calamity will end. Thus, the current literature has no adequate studies which shed light on pandemic shocks and their impact on the airline industry revenues. Second, the current literature about this topic lacks data testing and considering the other contributing factors such as economic policy uncertainty, exchange rate, oil prices, air cargo, and tourism. Third, the existing studies do not include research on future forecasting about the airline industry in the response of COVID-19. As the situation is still ongoing and will take time to recover. The postpandemic condition will turn out more difficult, which needs to be forecasted. Thus, this study attempts to cover the gap between the previous studies and the current ones and provide comprehensive knowledge about the future scenario. It considers the main macroeconomic determinants of the airline revenues and forecast. This can help in the proactive policy formulation in the postpandemic period. Our sample comprises major countries around the world. Thus, our study is extremely important to answer such questions regarding the airline industry’s response to the pandemic.

3. Scenario Analysis and Methodology

Some argue the COVID-19 shock and its contributing factors affect the airlines industry. The Boston Consulting Group (BCG) [26] presents several scenarios about the airline industry recovery in the postpandemic situation when demand recovers from the highly uncertain future [27]. First, the V-shaped scenario implies rapid recovery, which can take 3–6 months, with the virus being contained and fresh cases dropping rapidly, and the government possibly taking effective policies to contain the virus, and the economic activities recover. Leisure and businesses bounce back quickly, which has a positive impact on the airline industry. Second, the U-shaped situation means that recovery is a slow, gradual decrease in new cases. The lockdown can be longer, and there can be border disclosure and visa restrictions. Third, a prolonged U-shaped recovery suggests a slow gradual recovery that may take 12–18 months, as well as the slow decrease in new cases with longer lockdown and border disclosure. Fourth, L-shaped structural changes take 12 months to stabilize the economic activities and to reopen the border and relaxation of visa. Last, the W-shaped shows a rapid decrease in the virus followed by a rapid increase. The reemergence of a pandemic takes 12–18 months for recovery in the medium run. The finding suggests both V-shaped and the U-shaped recovery of the airline industry in these countries because of the gradual decrease in fresh cases and deaths. The lockdown can be longer, and there can be border disclosure and visa restrictions.
We use the VAR to analyze the pandemic impact and forecasting. The model provides more accurate forecast results as compared to the simple and general linear statistical model [28]. The VAR model is closer to economic reality because of its explanatory and exogenous variables interactions. The model may offer more accurate forecasting results by considering the components simultaneously and including fewer lags. Compared to structural simultaneous equations, the VAR does not require prior and "arbitrary" constraints to ensure identification [29]. There are several endogenous variables such as economic policy uncertainty, exchange rate, economic growth, oil prices, tourist arrival, and air cargo that can play a contributing role relationship between COVID-19 shock and ALR. We have used the following steps in building the VAR model. First, statistic M (i) and the Akaike information criterion (AIC) have been used to identify the order and then estimate the specified model by using the least-squares method (if parameters statistically insignificant, reestimate model by removing these parameters), and finally use the Qk (m) statistic of the residuals to check the adequacy of a fitted model.
The vector autoregression model (VAR) is a multivariate time series model used for forecasting. The first-order VAR (1) model is given below;
R t = α 0 + α R t 1 + ε t , V a r ( ε t ) = Σ
where R t is a k by 1 vector of variables.
The bivariate case is simply
R 1 , t = α 0 , 1 + α 11 R 1 , t 1 + α 12 R 2 , t 1 + ε t , 1
R 2 , t = α 0 , 2 + α 21 R 1 , t 1 + α 22 R 2 , t 1 + ε t , 2
Σ = [ σ 2 1 σ 21 σ 12 σ 2 2 ]
where R1,t, and R2,t in VAR are contemporaneously related by their covariance σ12 = σ21. The AR and VAR modelling methods depend on the lagged values and are, therefore, very useful for forecasting. Thus, the classical form of the VAR model is represented as follows:
A L R i t = α 0 + α 1 E P U i t 1 + α 2 G D P i t 1 + α 3 E X R i t 1 + α 5 O P i t 1 + α 6 T A i t 1 + α 7 A C i t 1 + ε i t
We obtain the forecasting results using the VAR (1) model.
A L R ( i t + 1 ) / t = E ( A L R i t + 1 / A L R i t , A L R i t 1 ............ ) = b 1 A L R i t + b p A L R i t p + 2
We can obtain forecasting for more than one period as follows:
A L R ( i t + 2 ) / t = b 1 A L R ( i t + 1 ) t + b p A L R i t p + 2
To find out the best predictor, we run each variable with dependent variables, and the highest value of R2 helps in deciding the best predictors for ALR. The outcomes in Table 2 confirm that GDP and air transport freight are the best predictors of ALR based on said criteria. Therefore, this study predicted ALR values based on lagged values of ALR, GDP, and air transport freight.
The fixed effects (FE) method is suitable for analyzing the influence of time-varying variables. It explores the relationship between predictor and outcome variables in an entity. Each entity has its characteristics, which may or may not affect the predictor variables. The FE approach assumes that the outcome can deviate due to bias predictors which need to be controlled. However, the random effect assumes that the error term of the entity is not correlated with the predictor variable, which allows time-invariant variables to serve as explanatory variables.
The panel fixed effect is based on Equation (1), while we test the random effect using Equation (8).
ALRit = α0 + β1EPU + β2GDP + β3EXR + β4OP + β5TA + β6AC + υit + εit
where EXR is the exchange rate, OP denotes oil prices, TA expresses tourist arrival, and AC is air cargo. Similarly, υit and εit are between and within entity error.
This estimates the forecasting results from 2020 to 2023 in the major economies of the world. Thus, these countries are most affected by COVID-19, and forecasting is highly recommended for the future outlook which can help in devising effective policies by the various stakeholders in the airline industry.

4. Data

This study was undertaken to assess the COVID-19 shock influence on the airline industry in Australia, Brazil, Canada, China, France, Germany, Italy, India, South Korea, Japan, Netherlands, Spain, Russia, the UK, and the USA. The sample period is from 1998 to 2019, which was retrieved from the world development indicators database (WDI). Table 1 highlights the summary statistics of these countries. The USA recorded the highest mean value for the ALR followed by Japan, Germany, and France, implying that aviation is a big industry in these countries and contributes to economic activity. However, China had the highest GDP rate followed by India, respectively, implying that both emerging and populous countries are important contributors to the airline industry. It recorded the highest standard deviation of ALR for China, followed by the USA The skewness values are positive for all countries except France and Germany. The kurtosis values of the GDP rate for all the countries are greater than 3, which is labelled as a leptokurtic distribution, suggesting higher volatility. Likewise, the kurtosis values of tourism arrival for most of the countries are leptokurtic distribution, and the remaining countries are the platykurtic distribution and representing less instability. All variables are normally distributed according to the Jarque–Bera test, but the GDP rate is non-normally distributed.

5. Empirical Results

5.1. Vector Autoregression Model

Table 2 highlights the VAR model results and reveals that economic growth, economic policy uncertainty, and air cargo have a positive impact on ALR in these countries. The results are like the work of Baltaci et al. [30], which states that ALR and economic growth have a strong correlation. It is well established that economic activities play an important role in consumption, international trade, tourism, and oil prices, which ultimately reflects in the higher air transport demand [31,32]. These countries observe greater economic activities, trade, and tourism [7] which are the effective factors to describe airline transport and their revenue pattern. In the same way, the rising economic uncertainty has a significant impact on the macroeconomic variables, which have a profound effect on economic activities [33,34] and can cause a large swing to ALR. The 9/11 terrorist attacks increase the uncertainty level and security concerns, which make air travel difficult and time consuming. The air travel demand declined, and the industry recorded a decreasing trend because of the increasing geopolitical uncertainty that is replicated in the falling ARL [35,36]. The economic uncertainty is at the highest level during the financial crisis in 2008 because of stagnant economic activities and dwindling tourism and international business travel. Tourism plays a greater role in economic growth and job creation in these countries, which are sensitive to economic and political uncertainties, creating a fear factor that influences decision making [21,37,38,39,40,41,42]. These countries are the top destinations of tourism, and substantial tourist arrival is the major contributor to ALR and economic activities. The prevailing condition has considerably declined tourism due to low disposable income, which in the end drops the passenger demand and ALR. These countries’ citizens are the most passionate travelers that have pushed the passenger demand up because of stable economic growth. However, the pandemic has paused tourism in these countries because of social distancing and visa restrictions that influence the air travel industry. The recession cuts the business travel by the companies to reduce their cost and keep the liquidity, which is reflected in the falling ARL [43,44].
However, the finding reveals that oil prices and exchange rates have a negative effect on ALR [45]. Fuel prices are the largest cost in airlines, and rising oil prices slash ALR. It has suffered economic crises related to oil prices and stagnation produced by pandemic war and security threats. Similarly, air cargo is one of the main contributors to ALR and is expected to be a bright spot for airlines in 2020. The decline in passenger demand pushes the air cargo up, which can contribute a significant portion to the revenues and substantially reduce their losses [46]. The economic slowdown results in the decline of trade, which negatively affects air cargo. However, air cargo is efficiently used for medical supplies and relief goods during the peak of the pandemic, which can minimize the overall loss of the airlines. The exchange rate has a negative impact, which implies that ALR decreases with rising fluctuation in EXR [47,48]. The exchange rate risk is extremely critical because of the globalization of the airline market and affects the operating profit in the competitive global market.

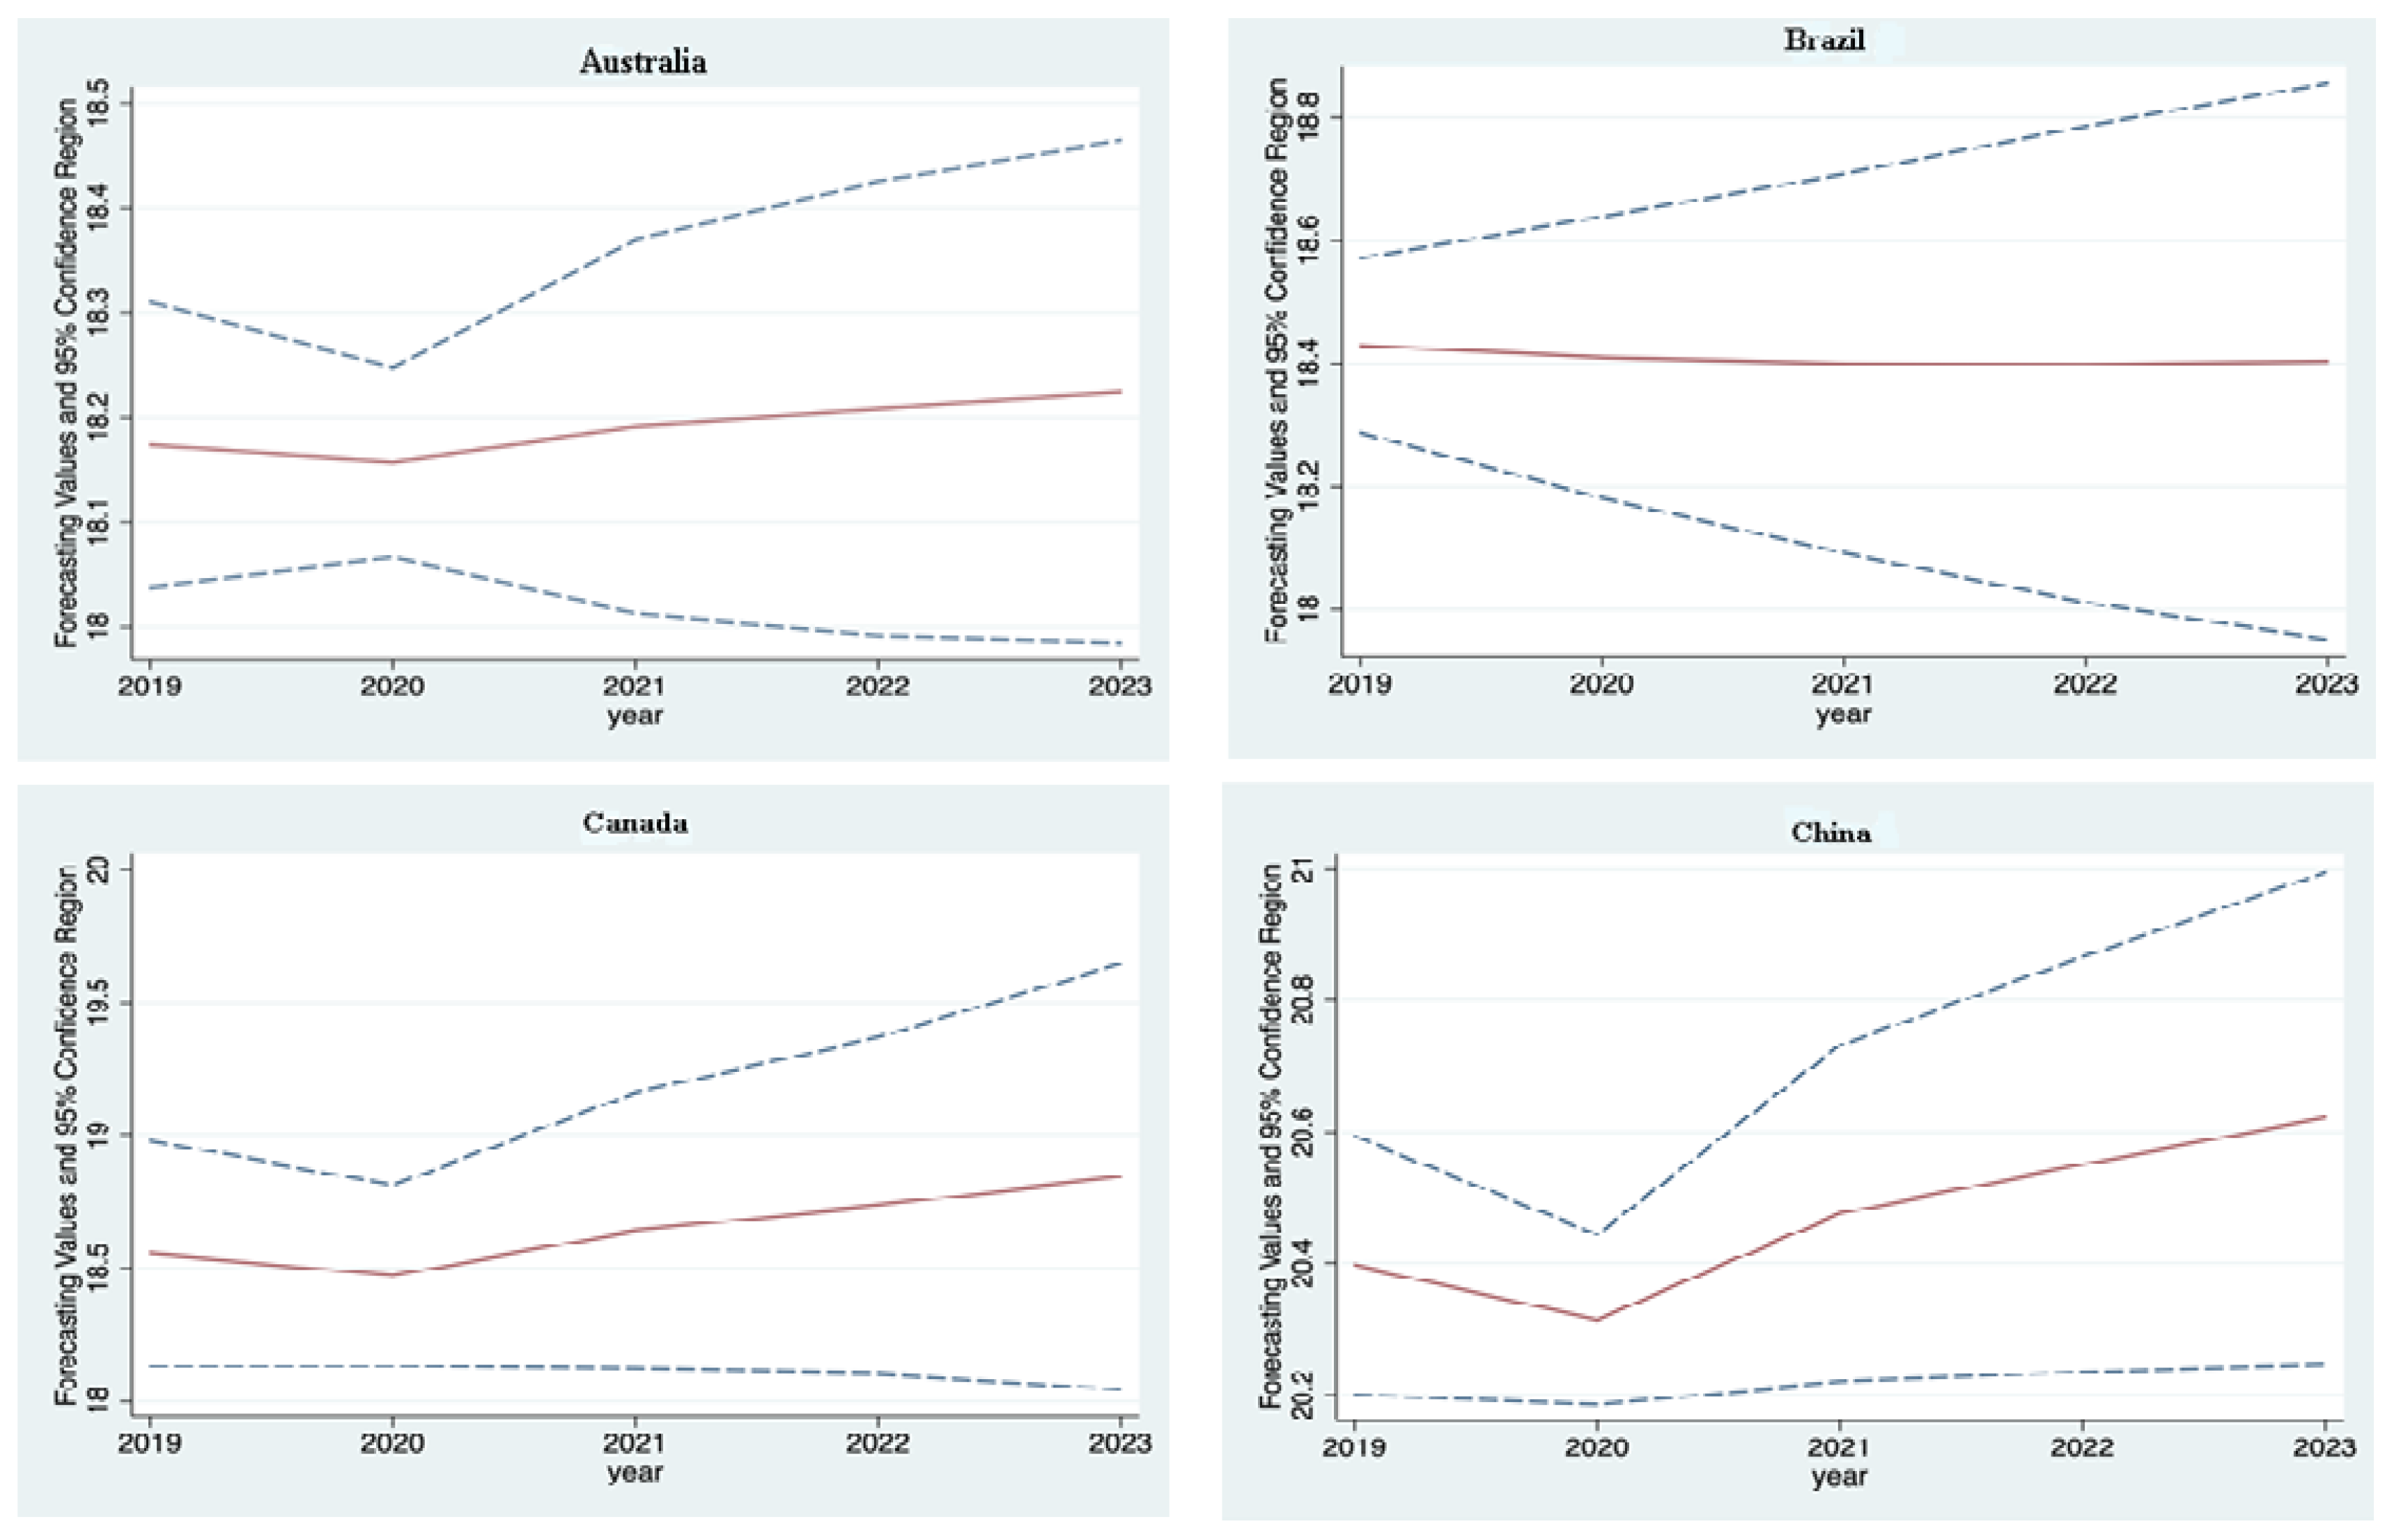
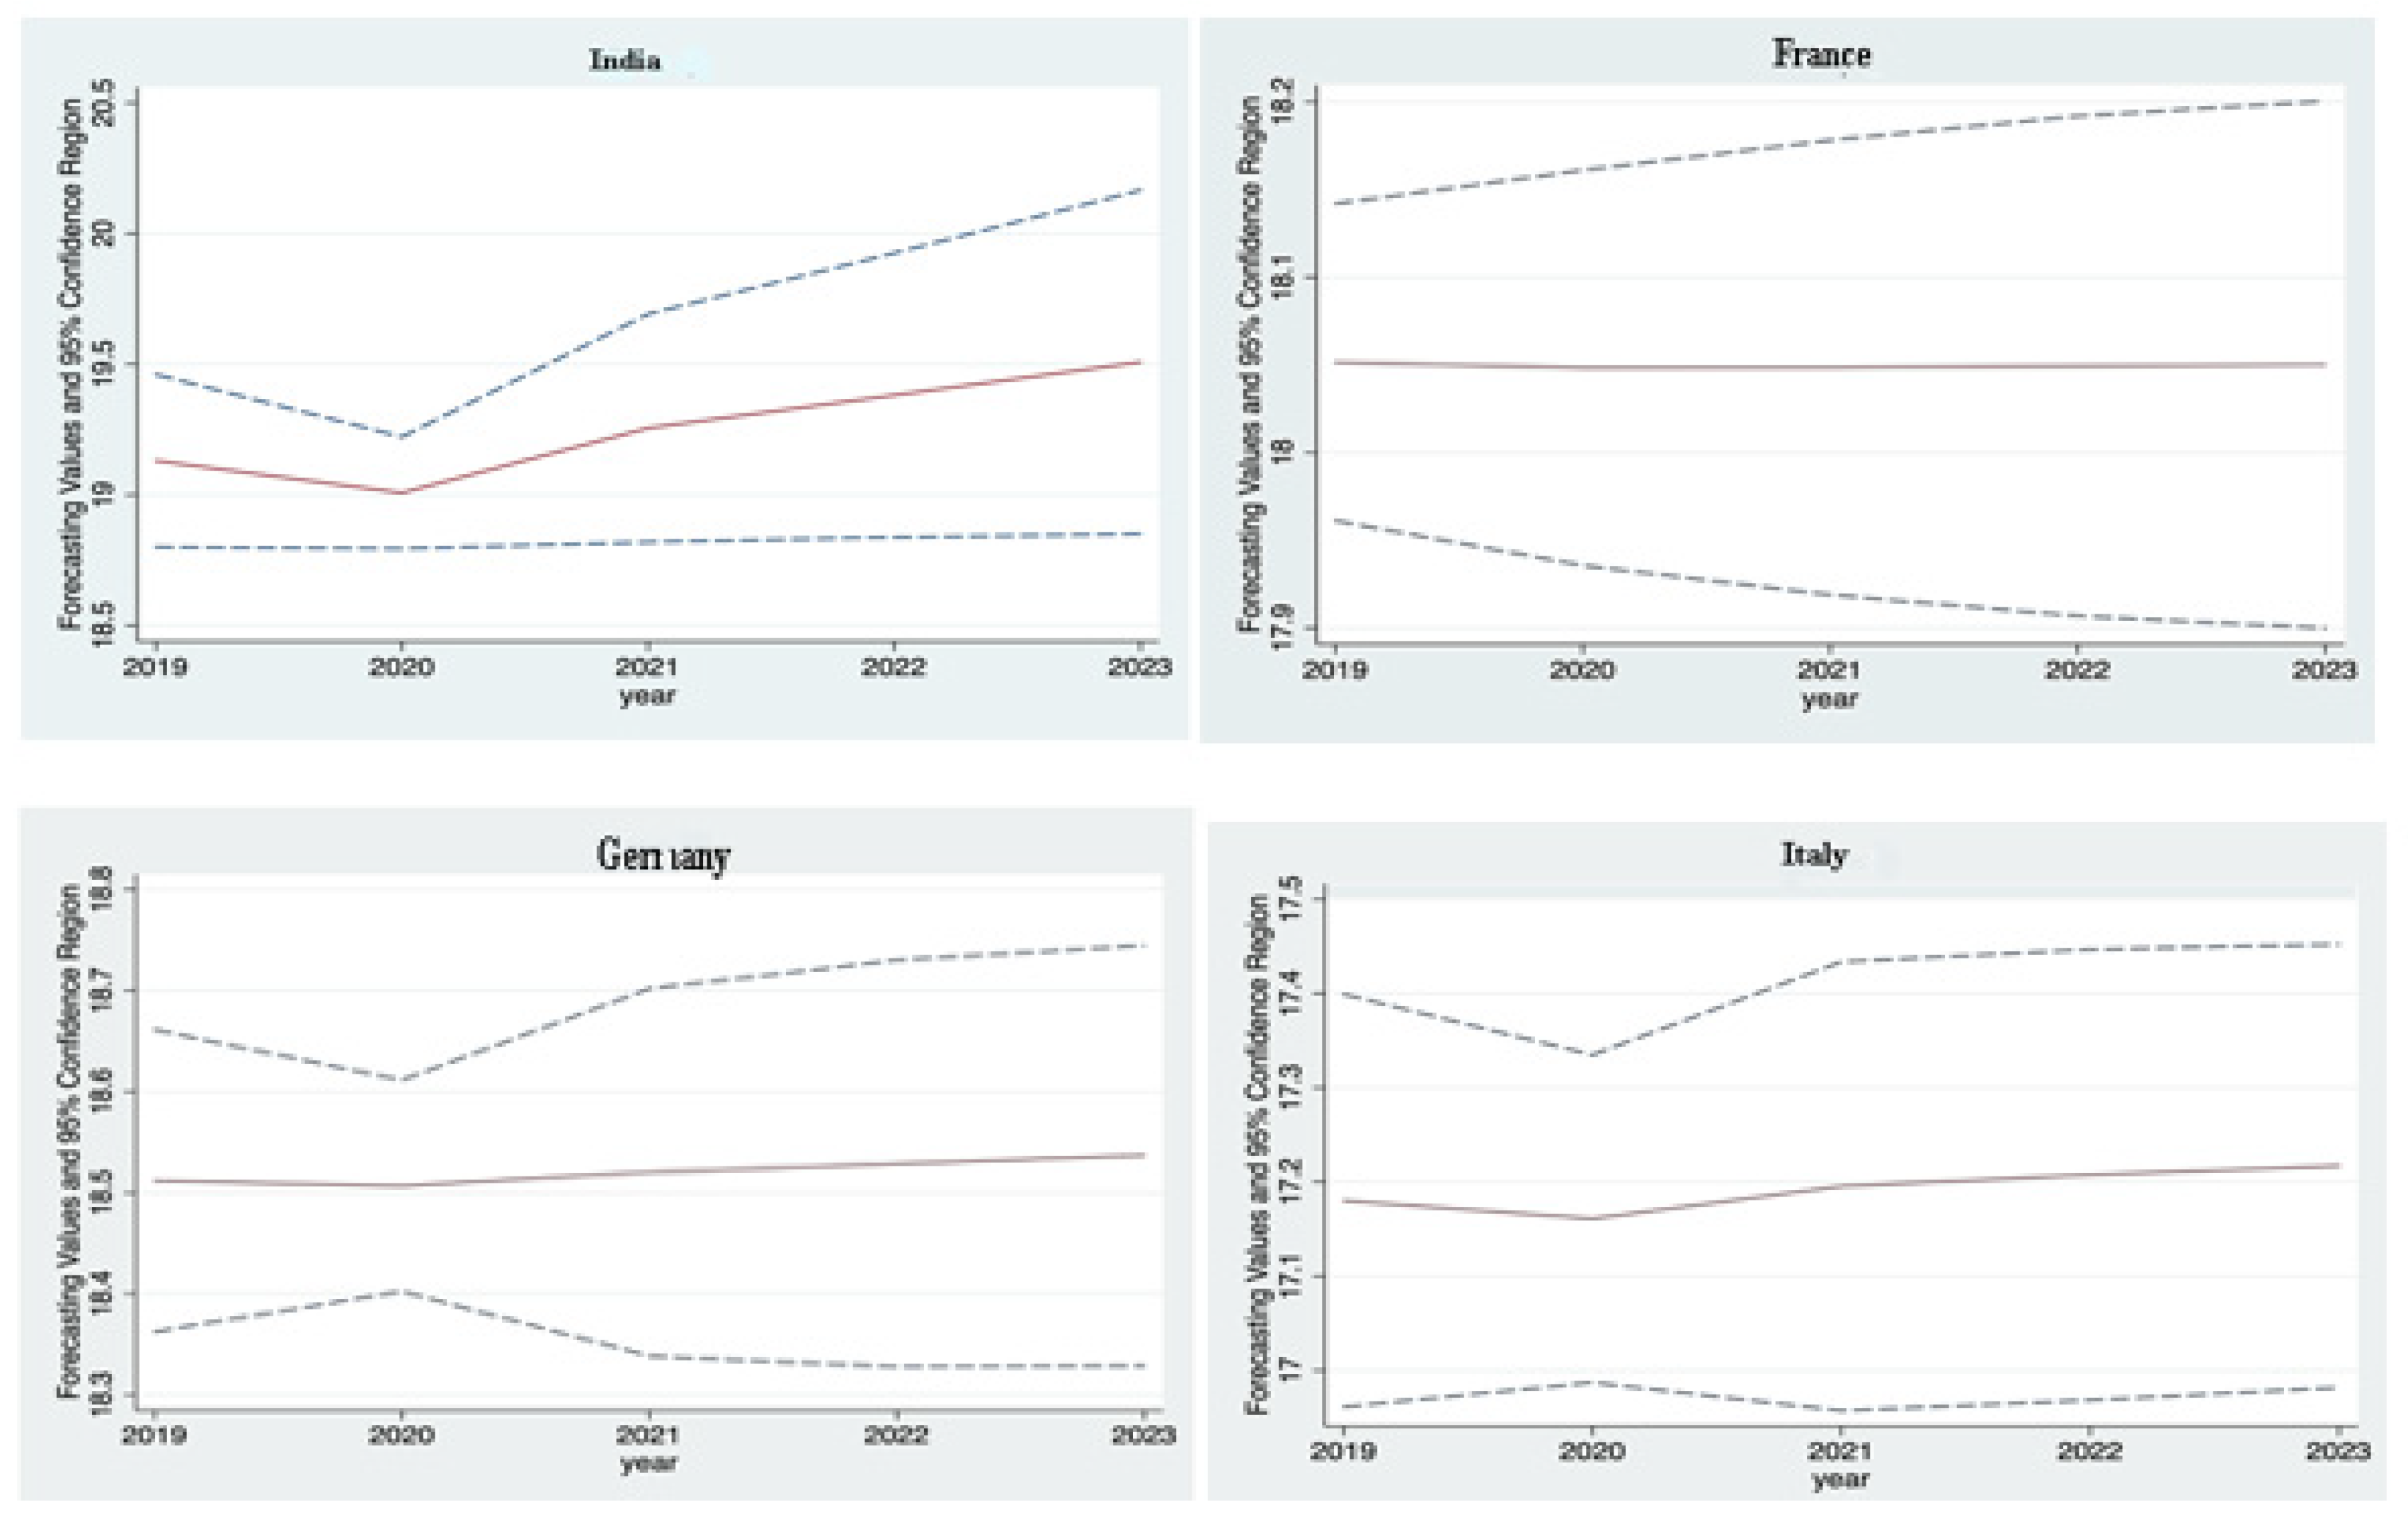
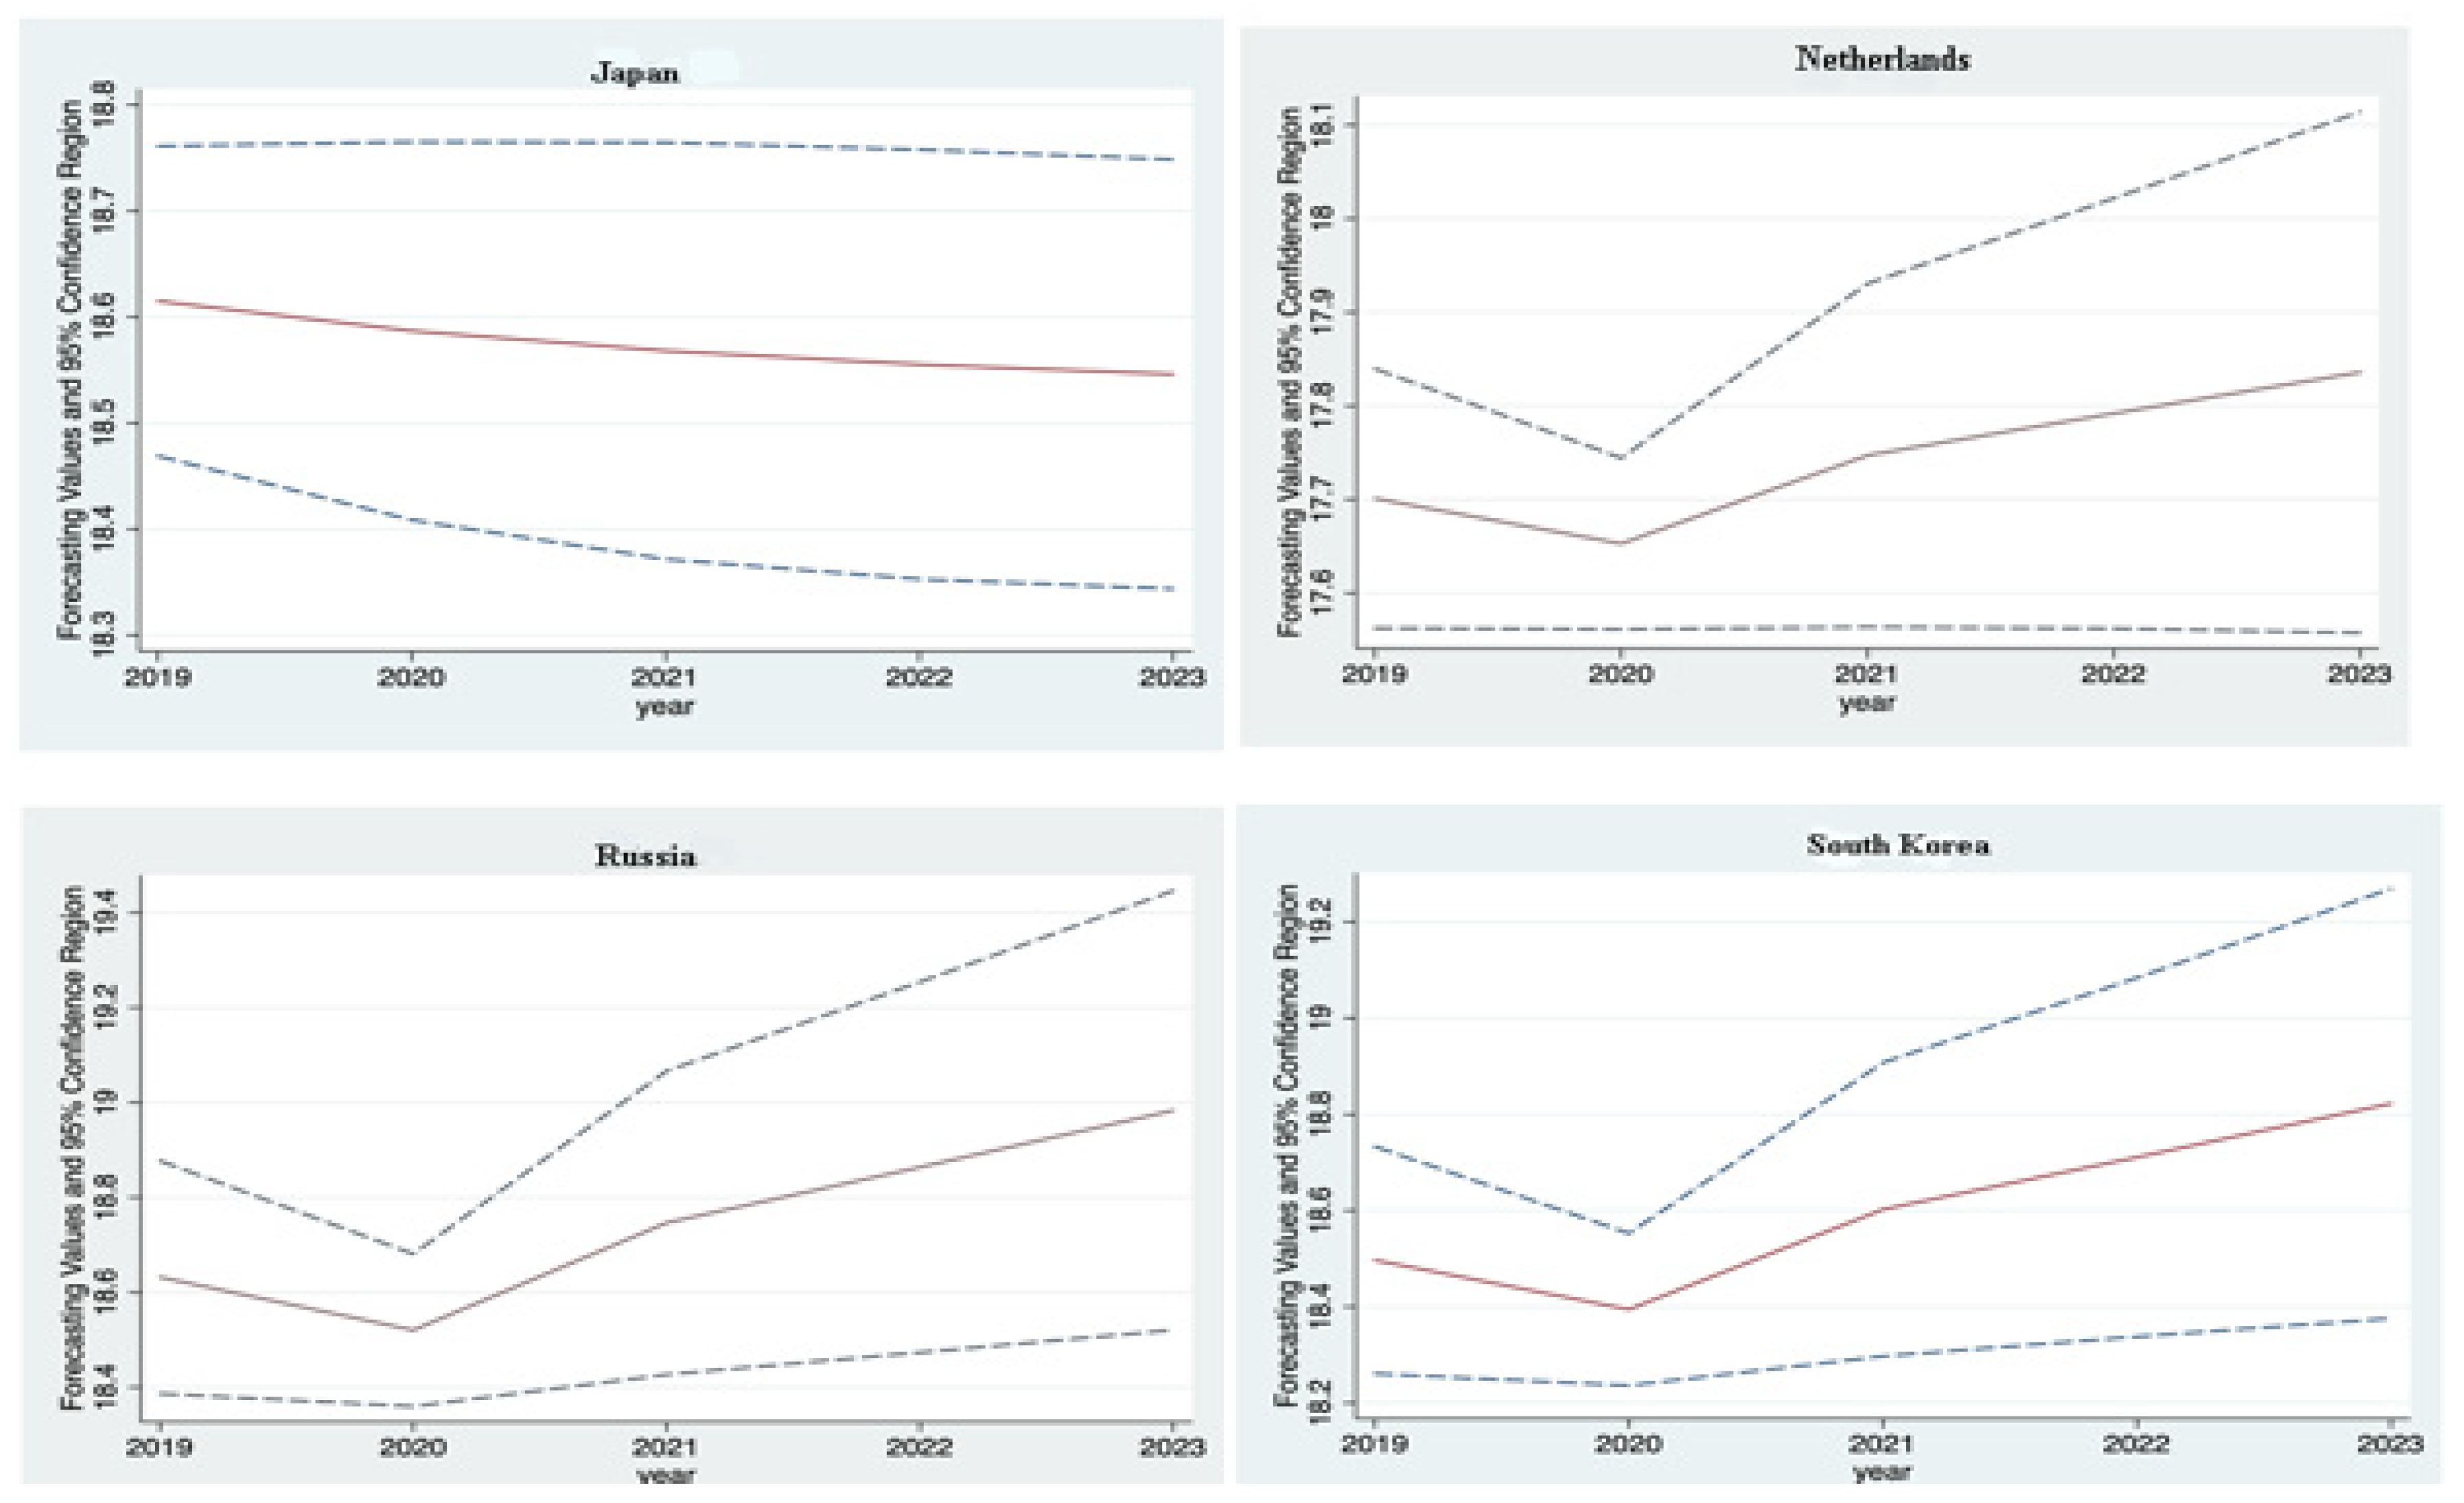
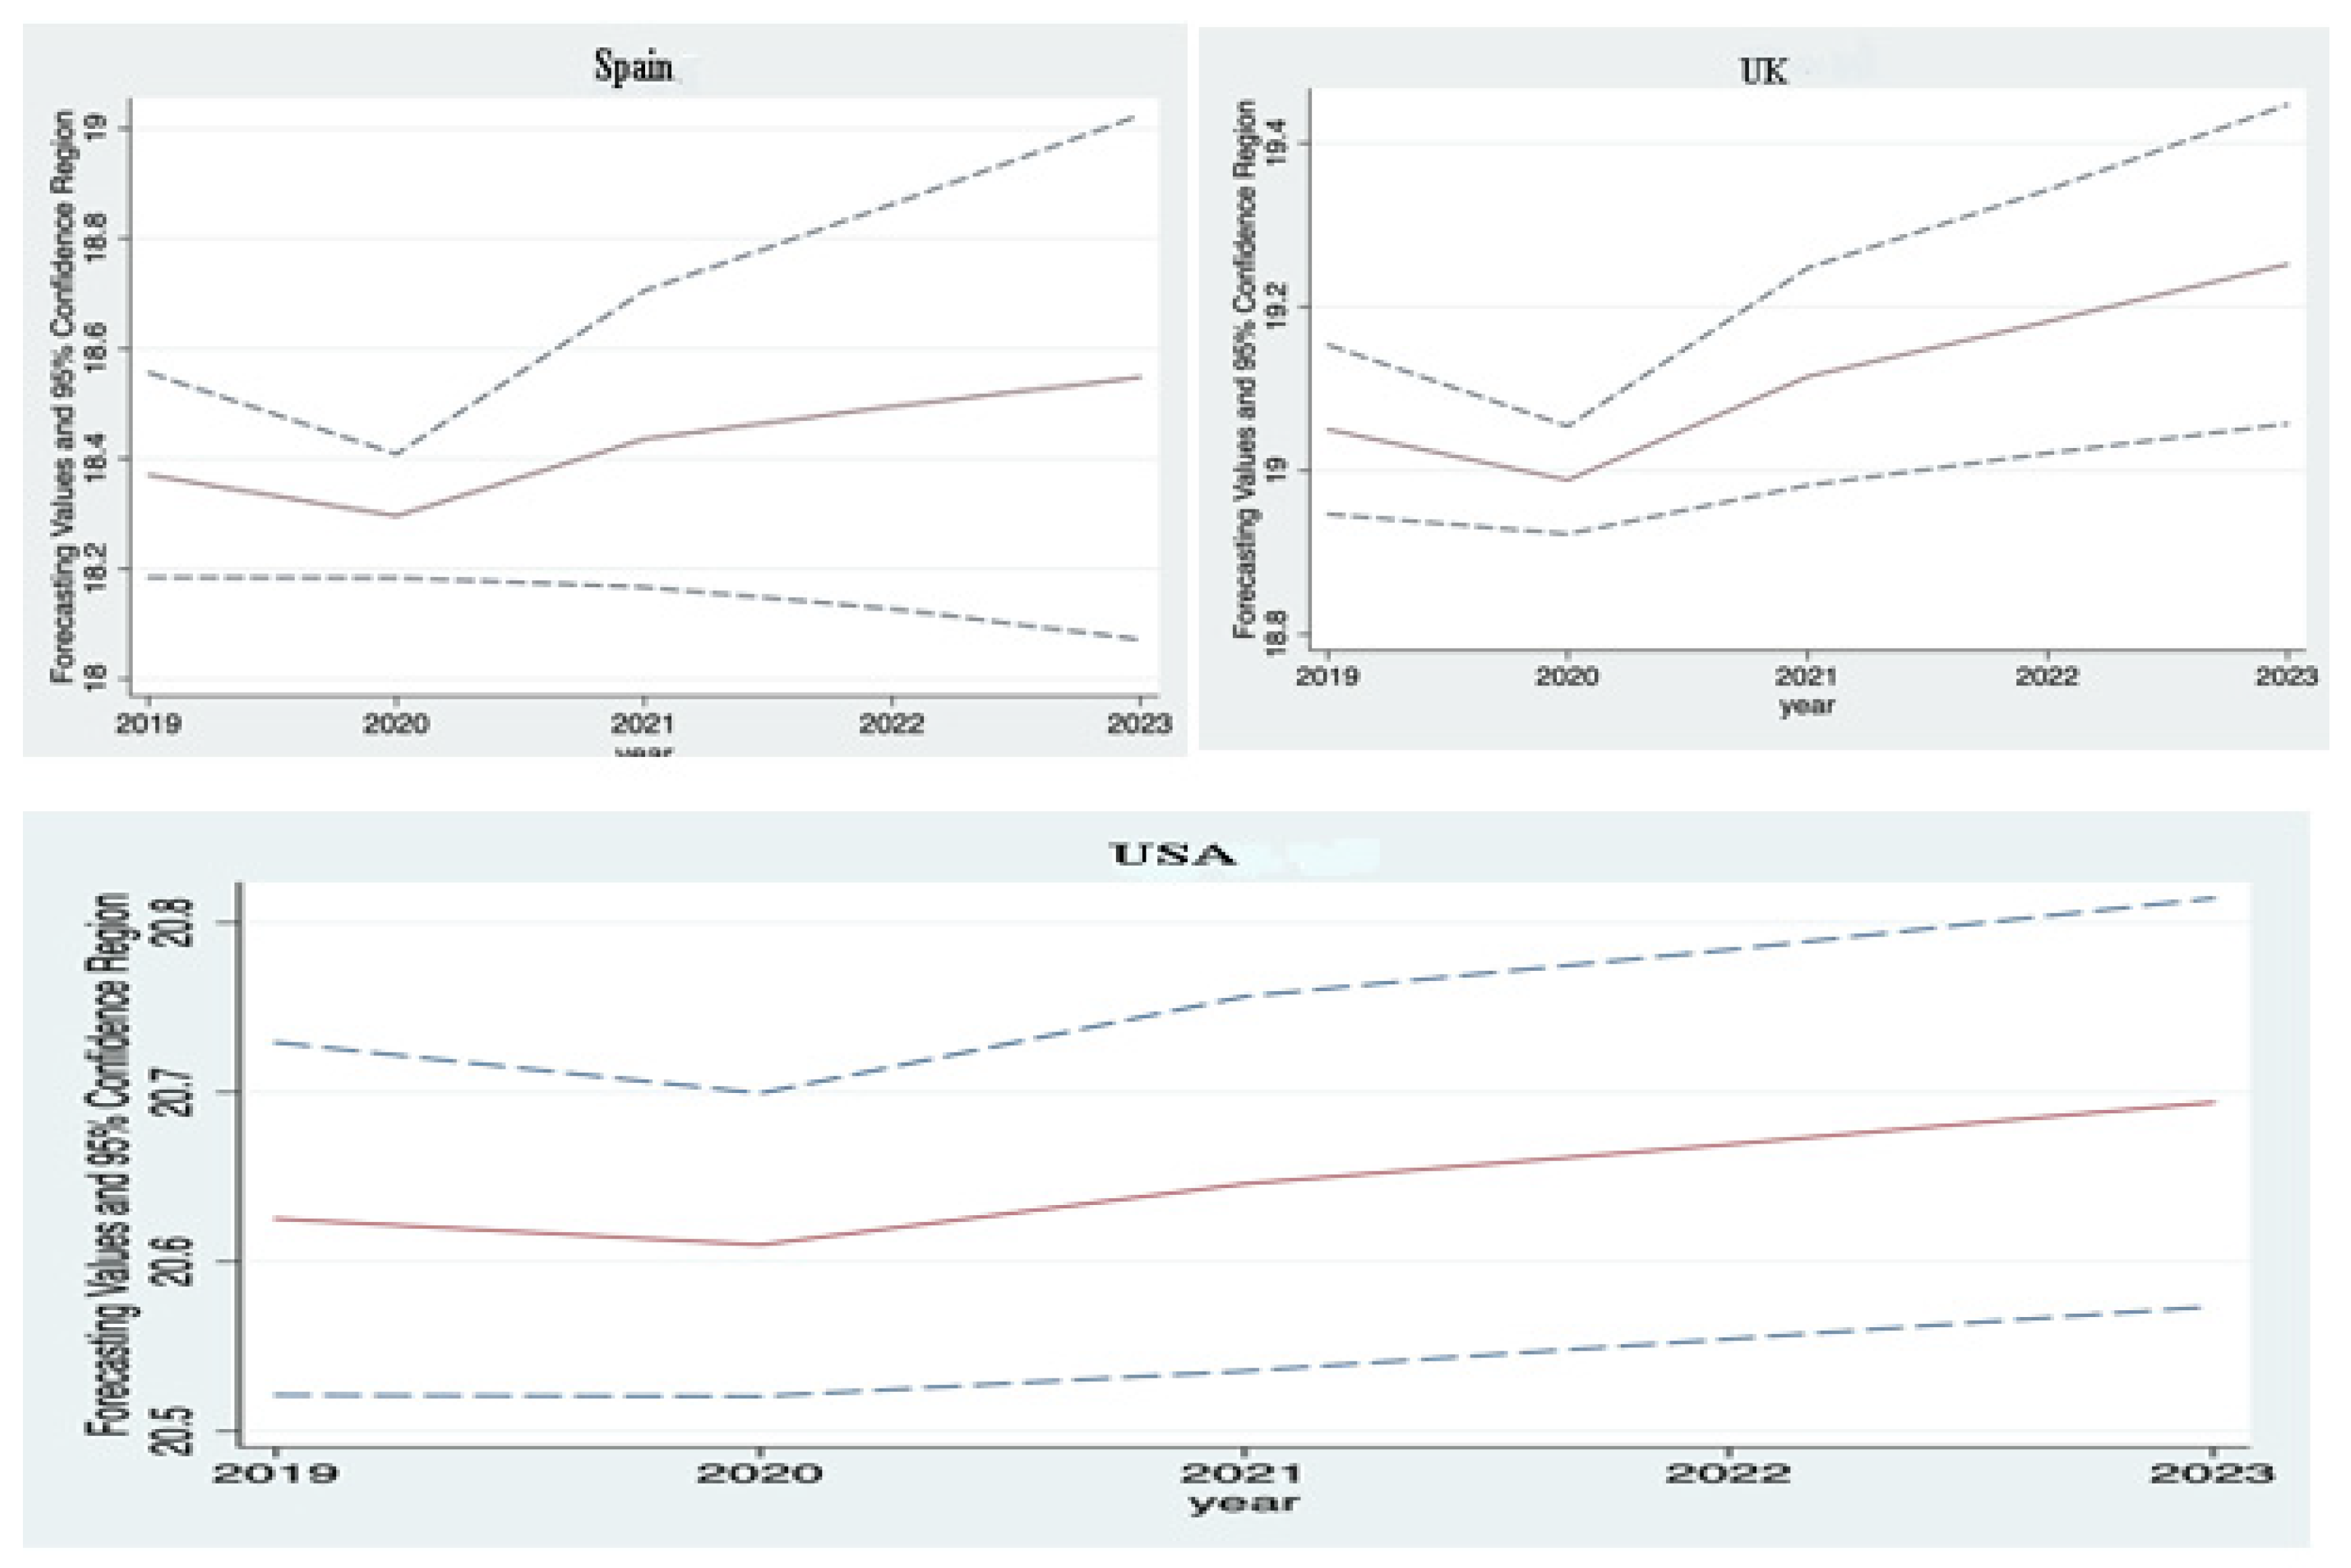
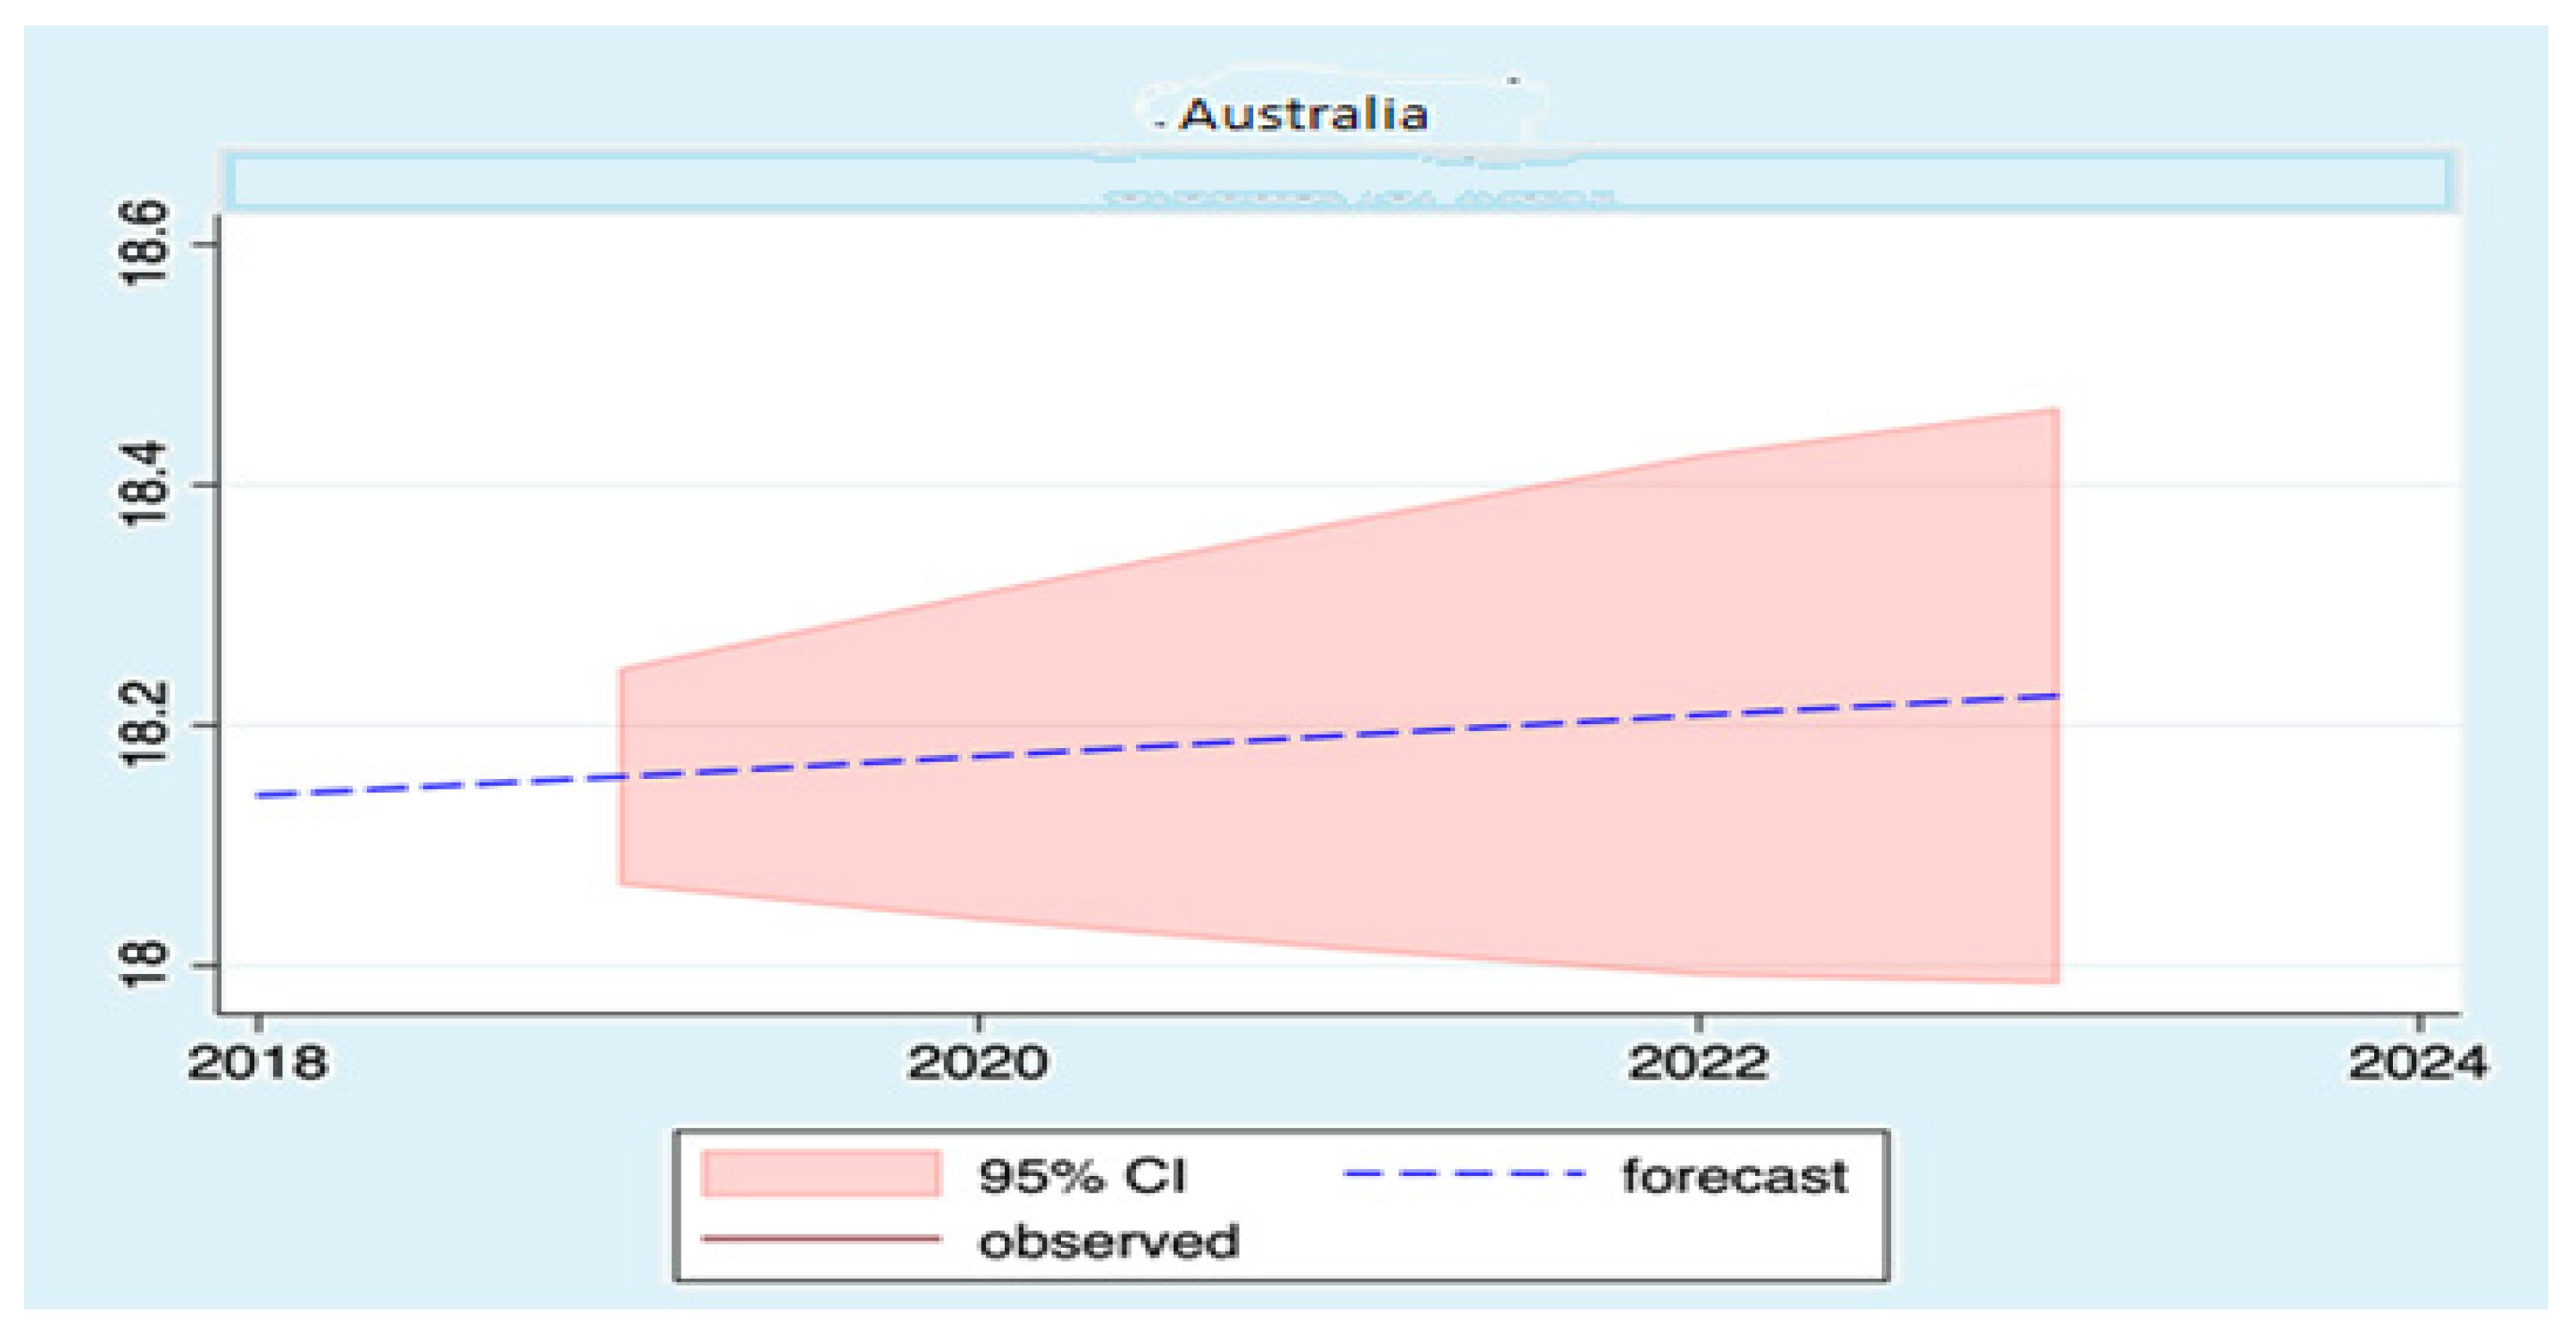
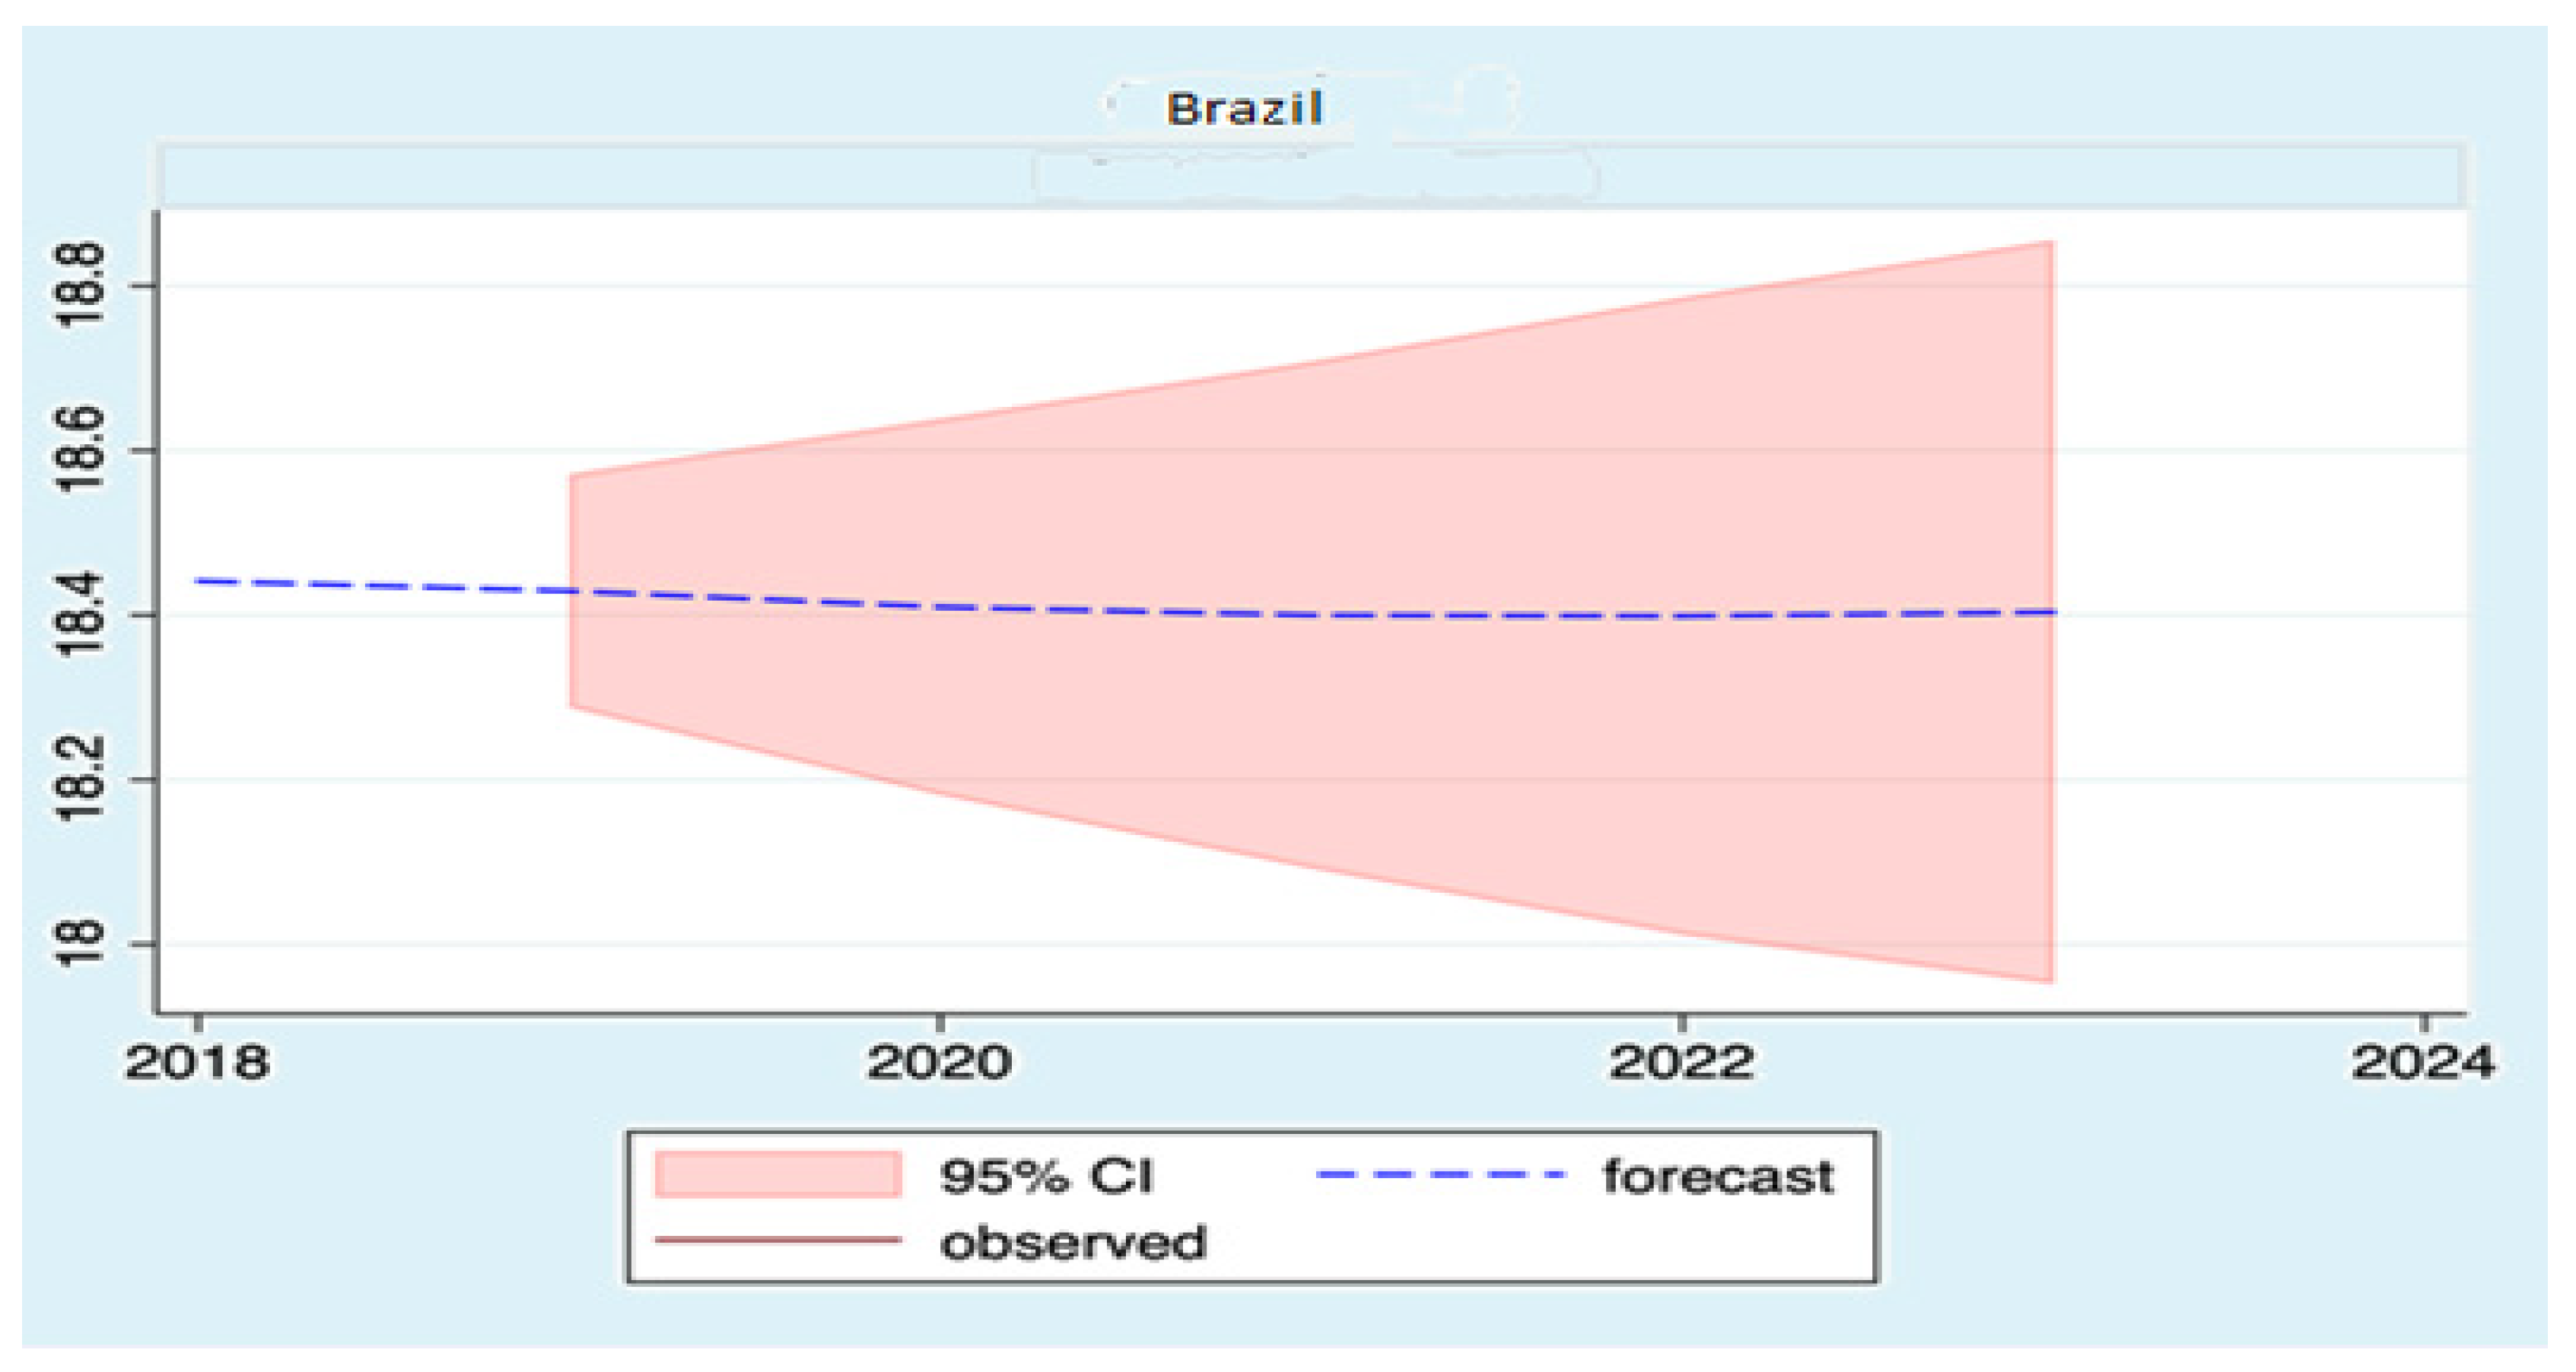
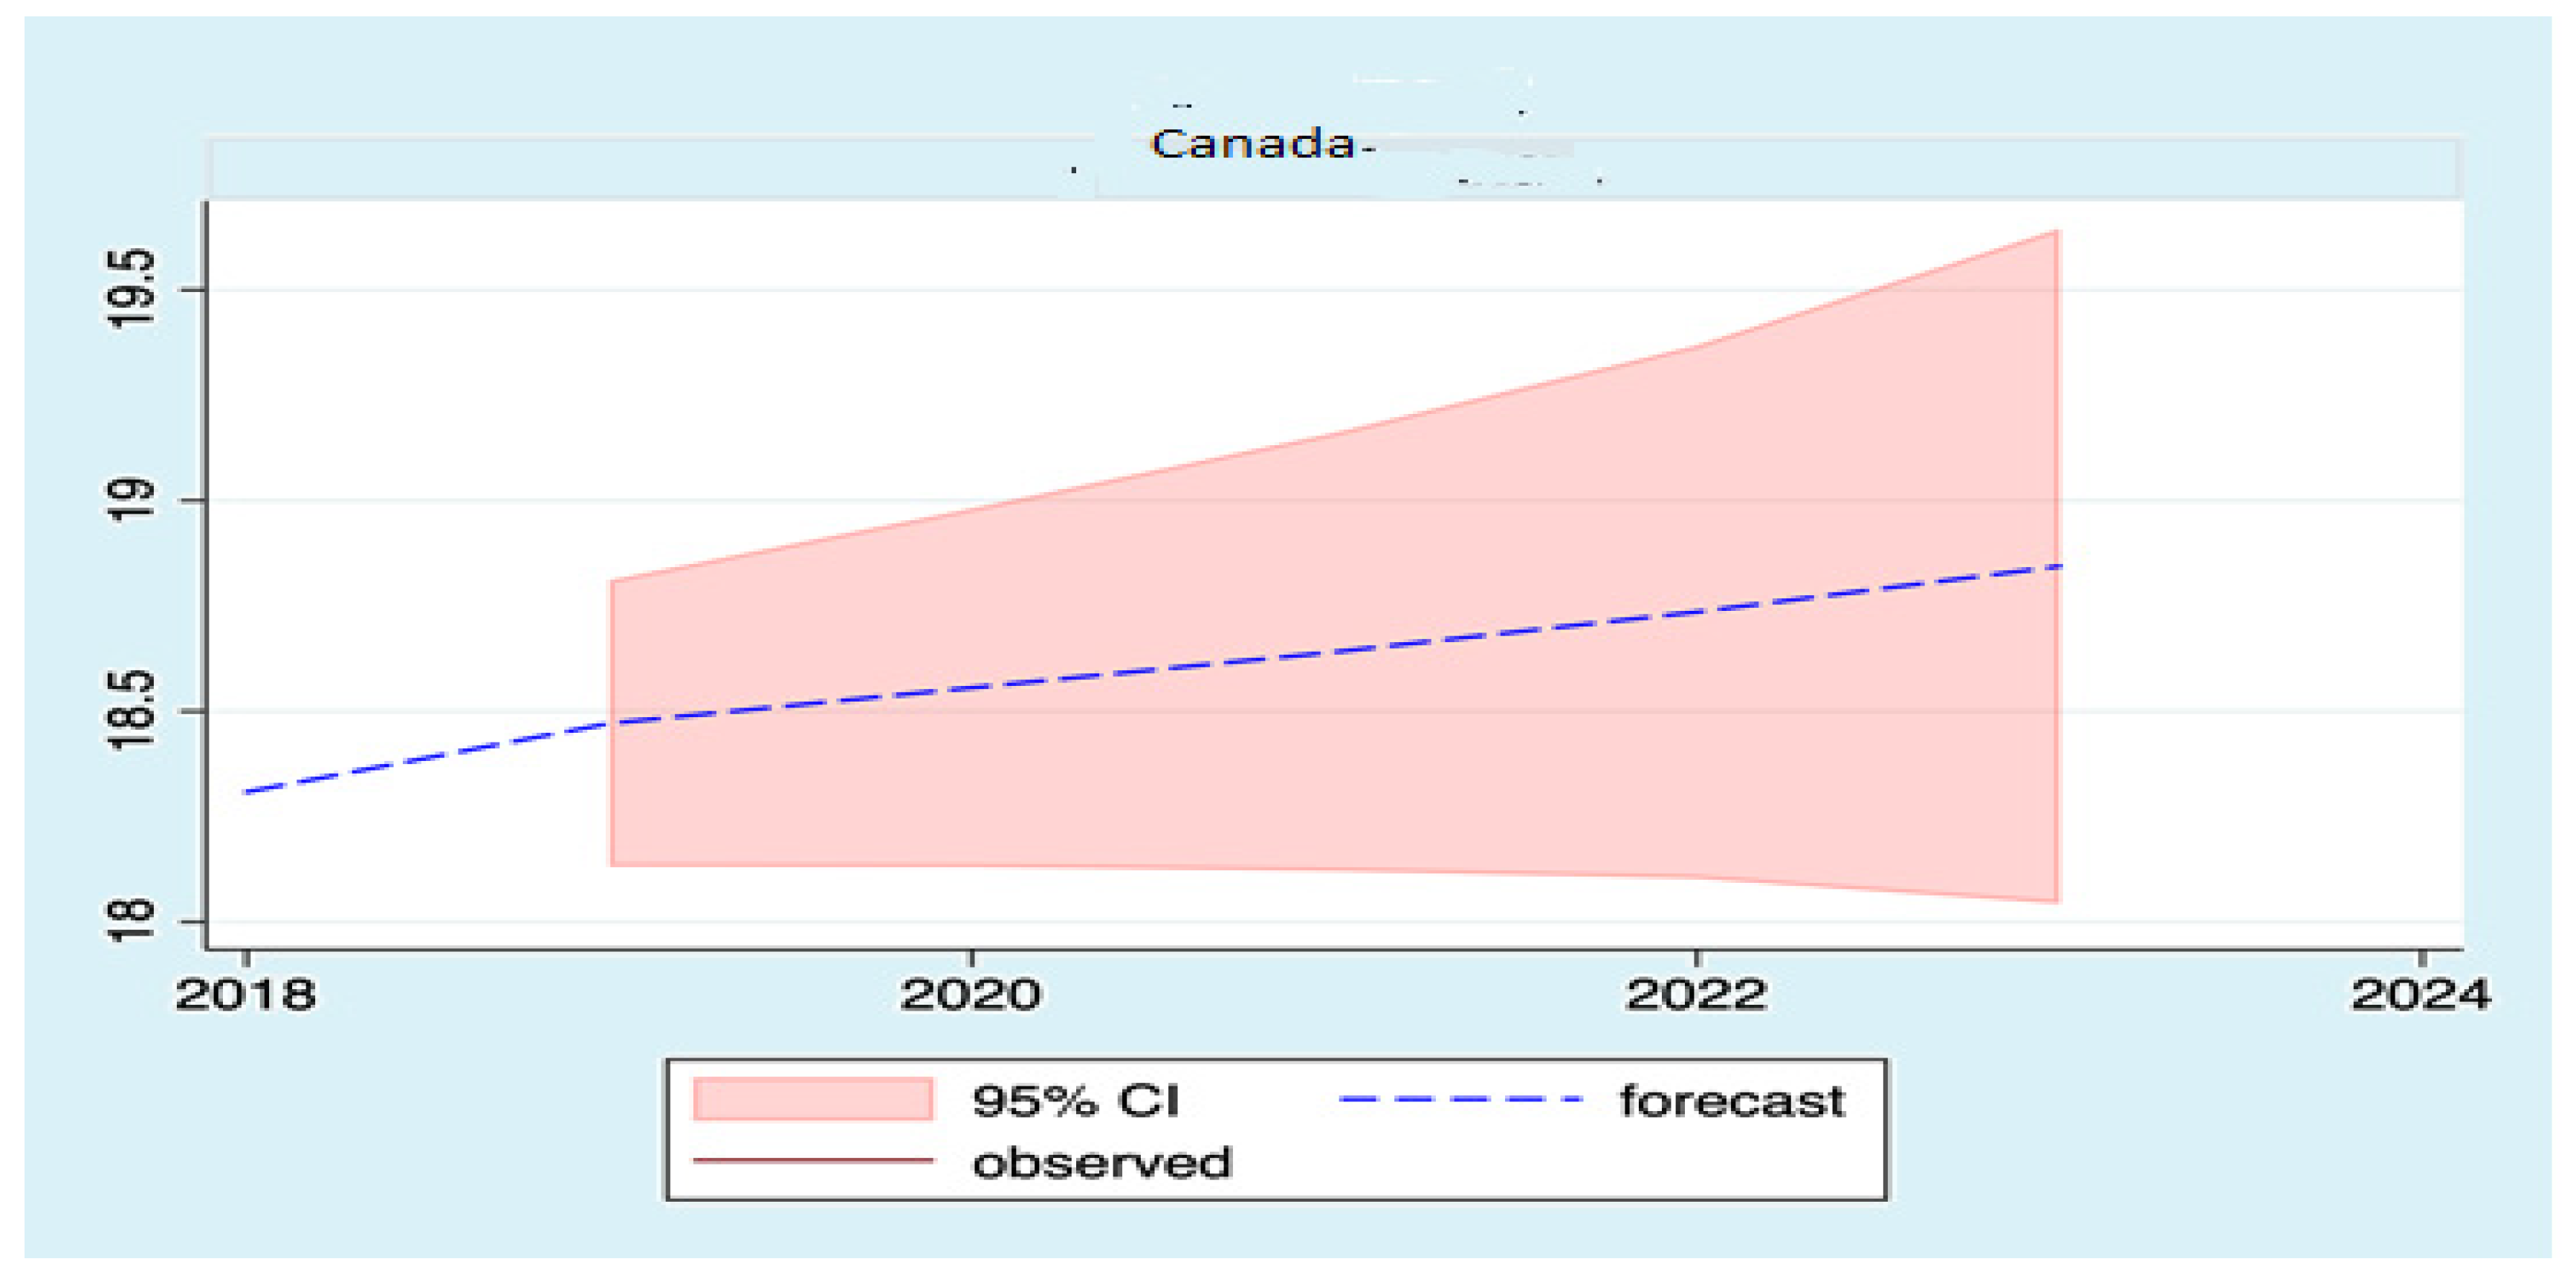
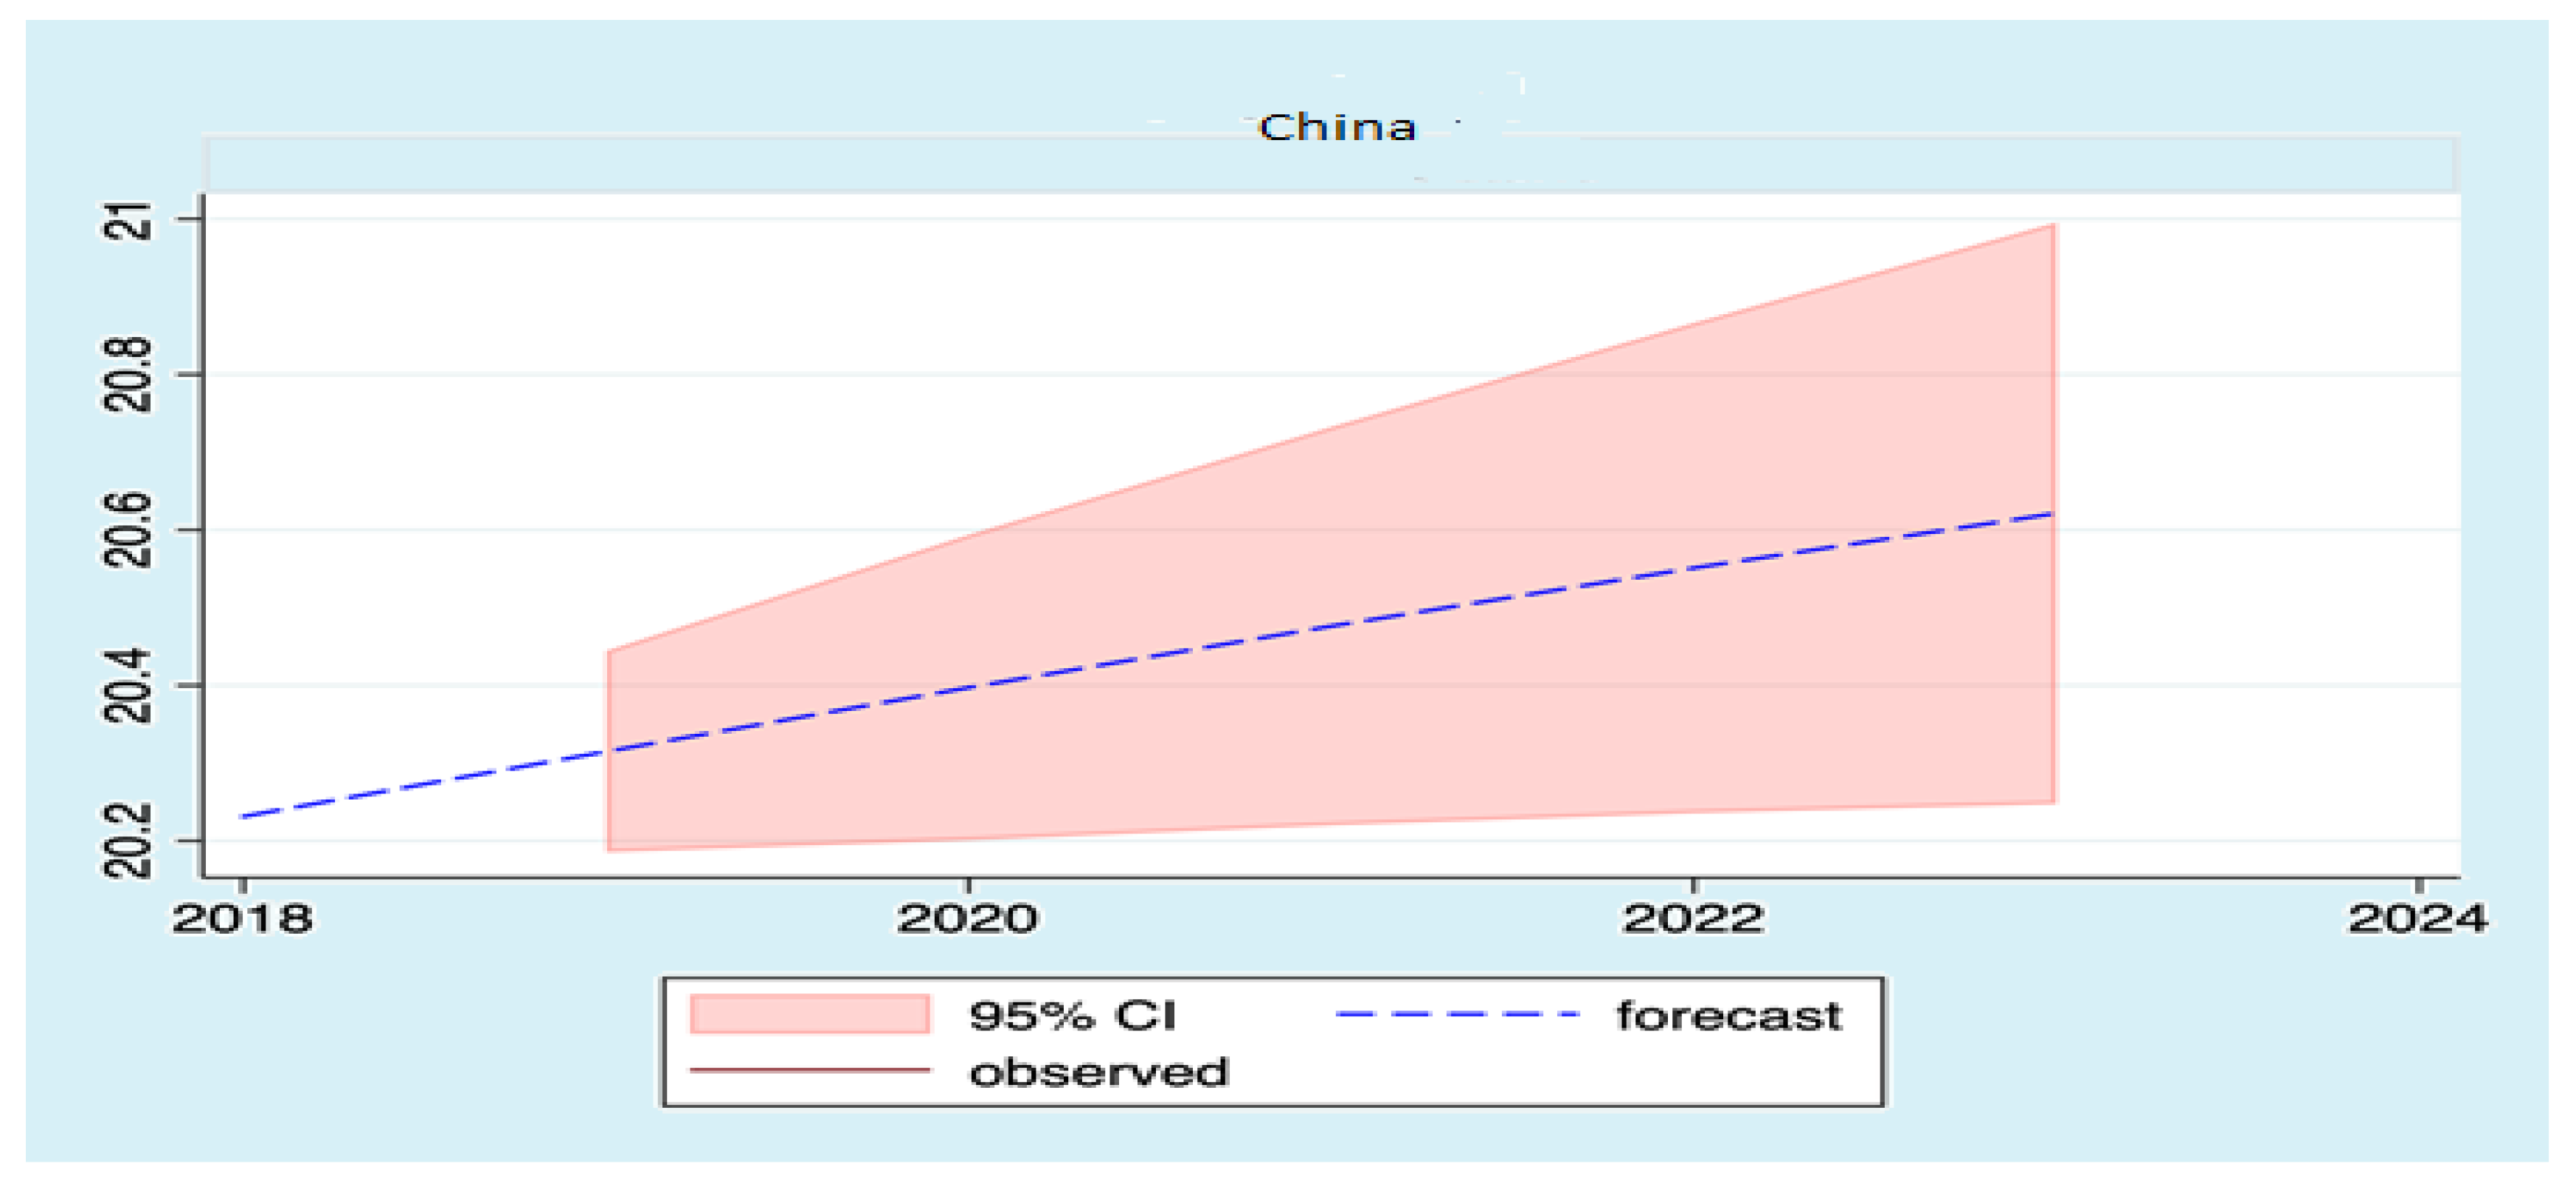
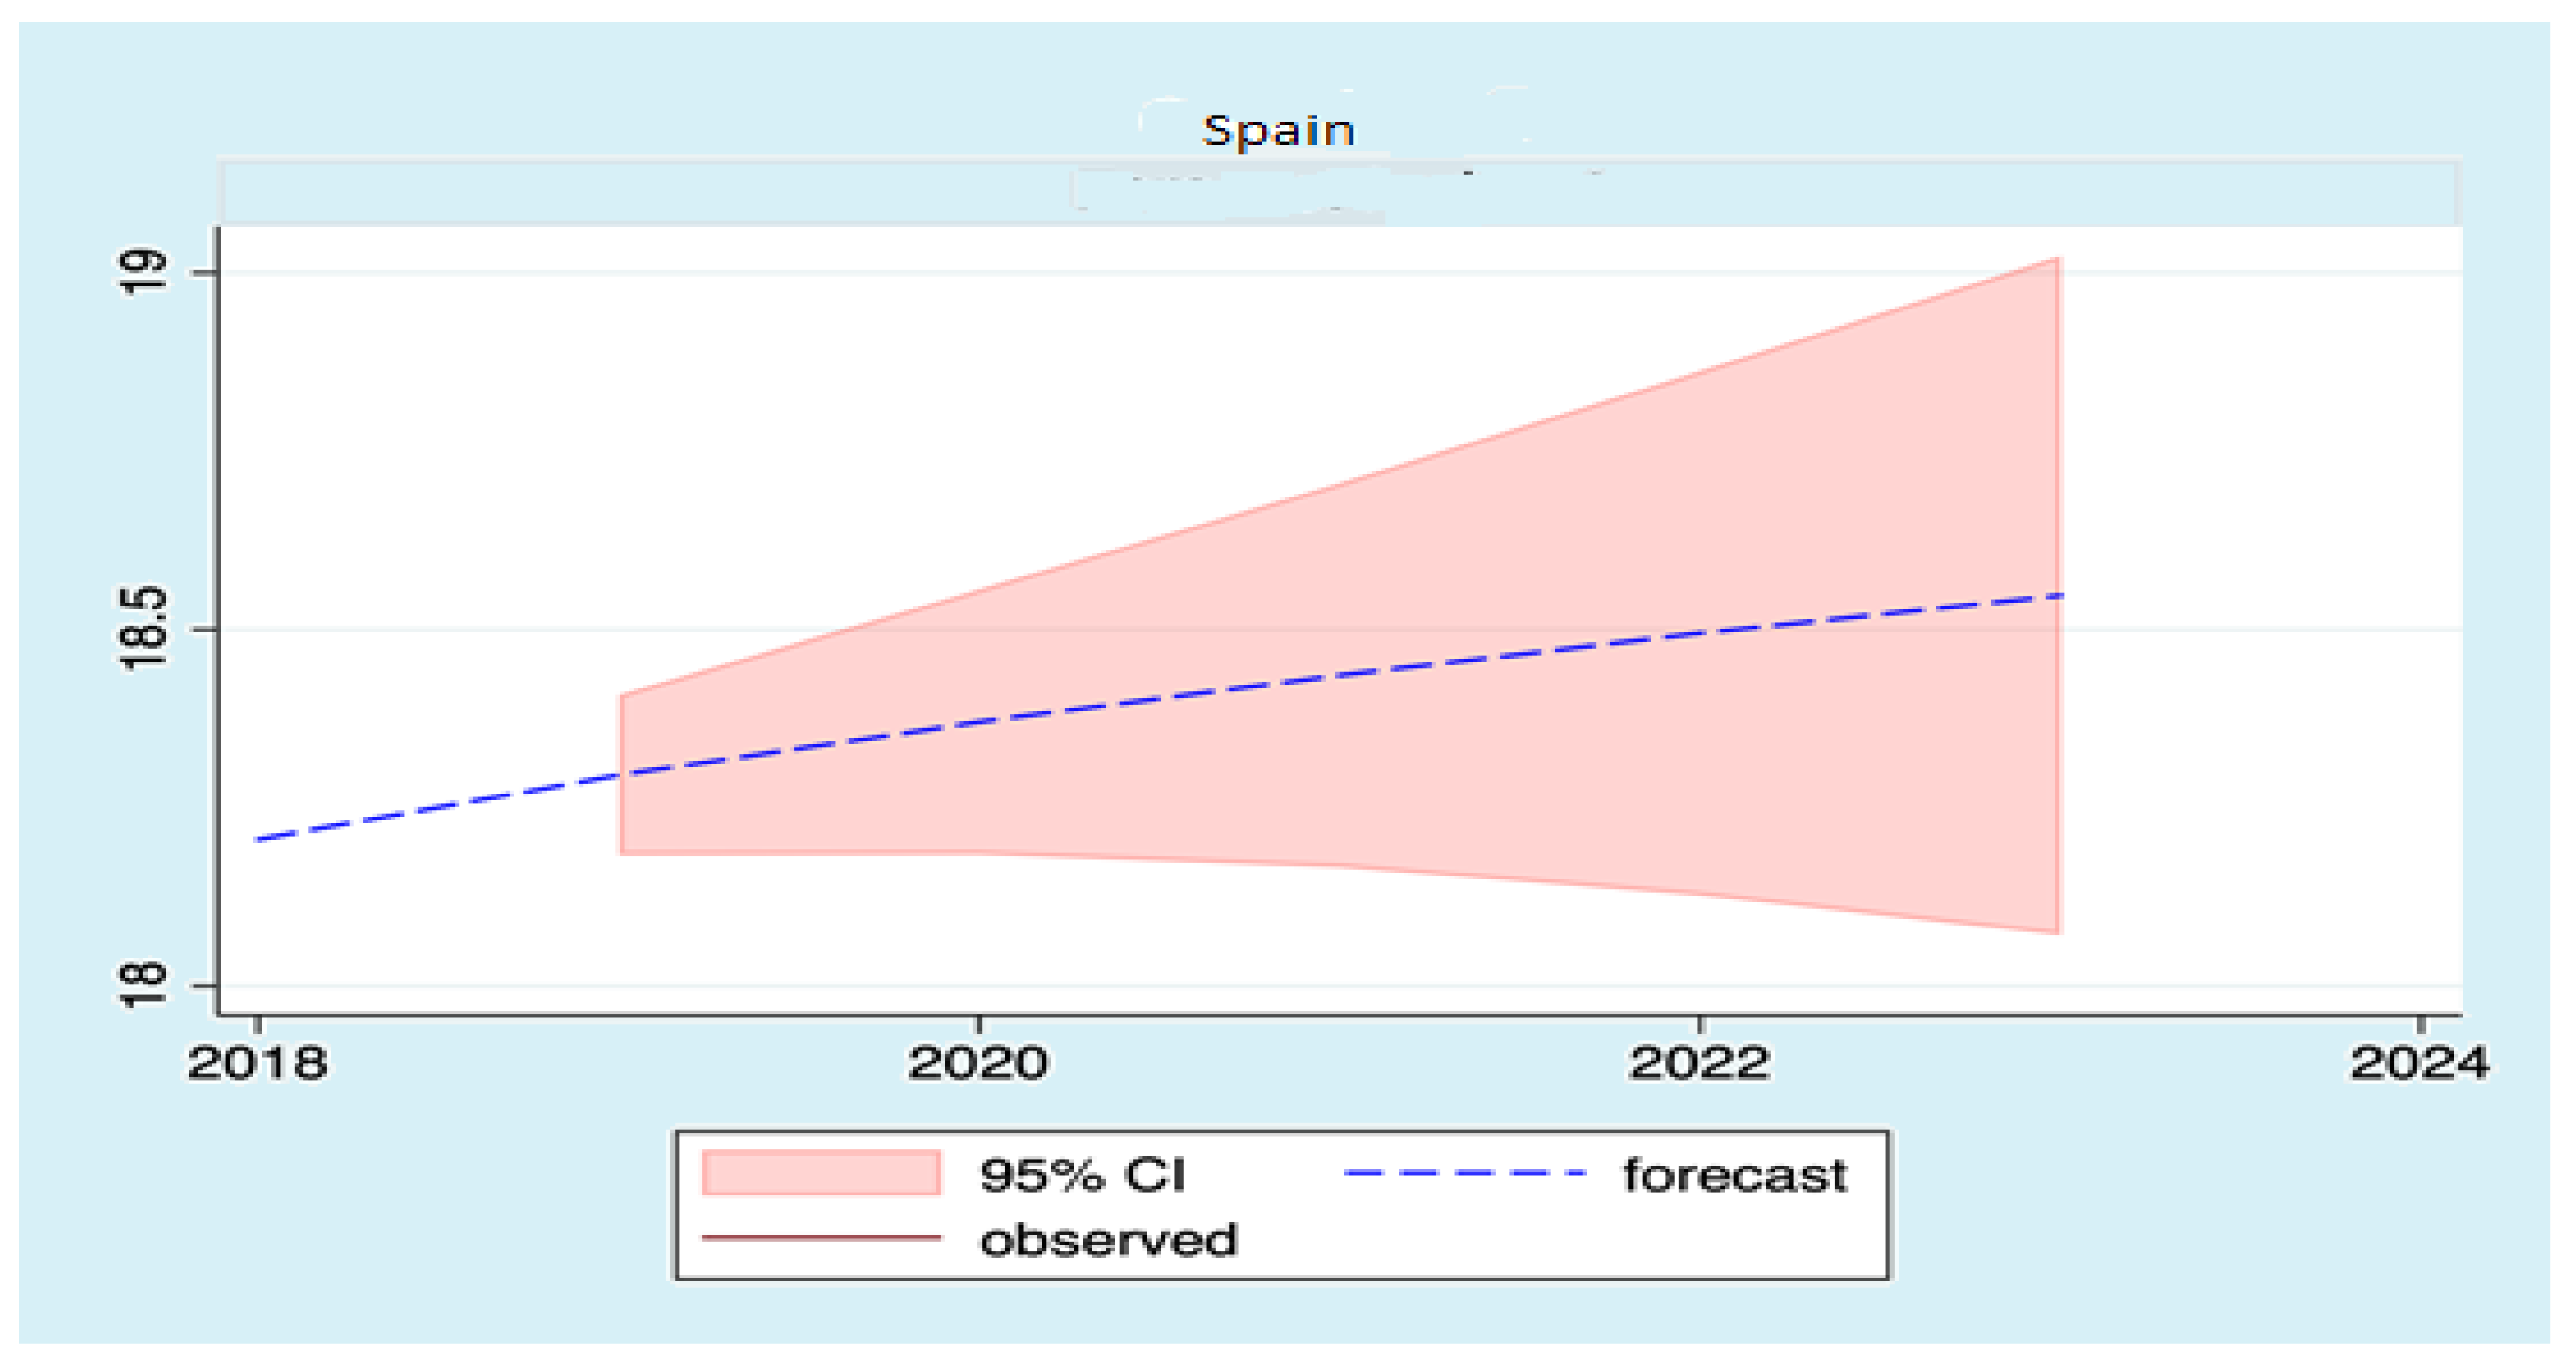
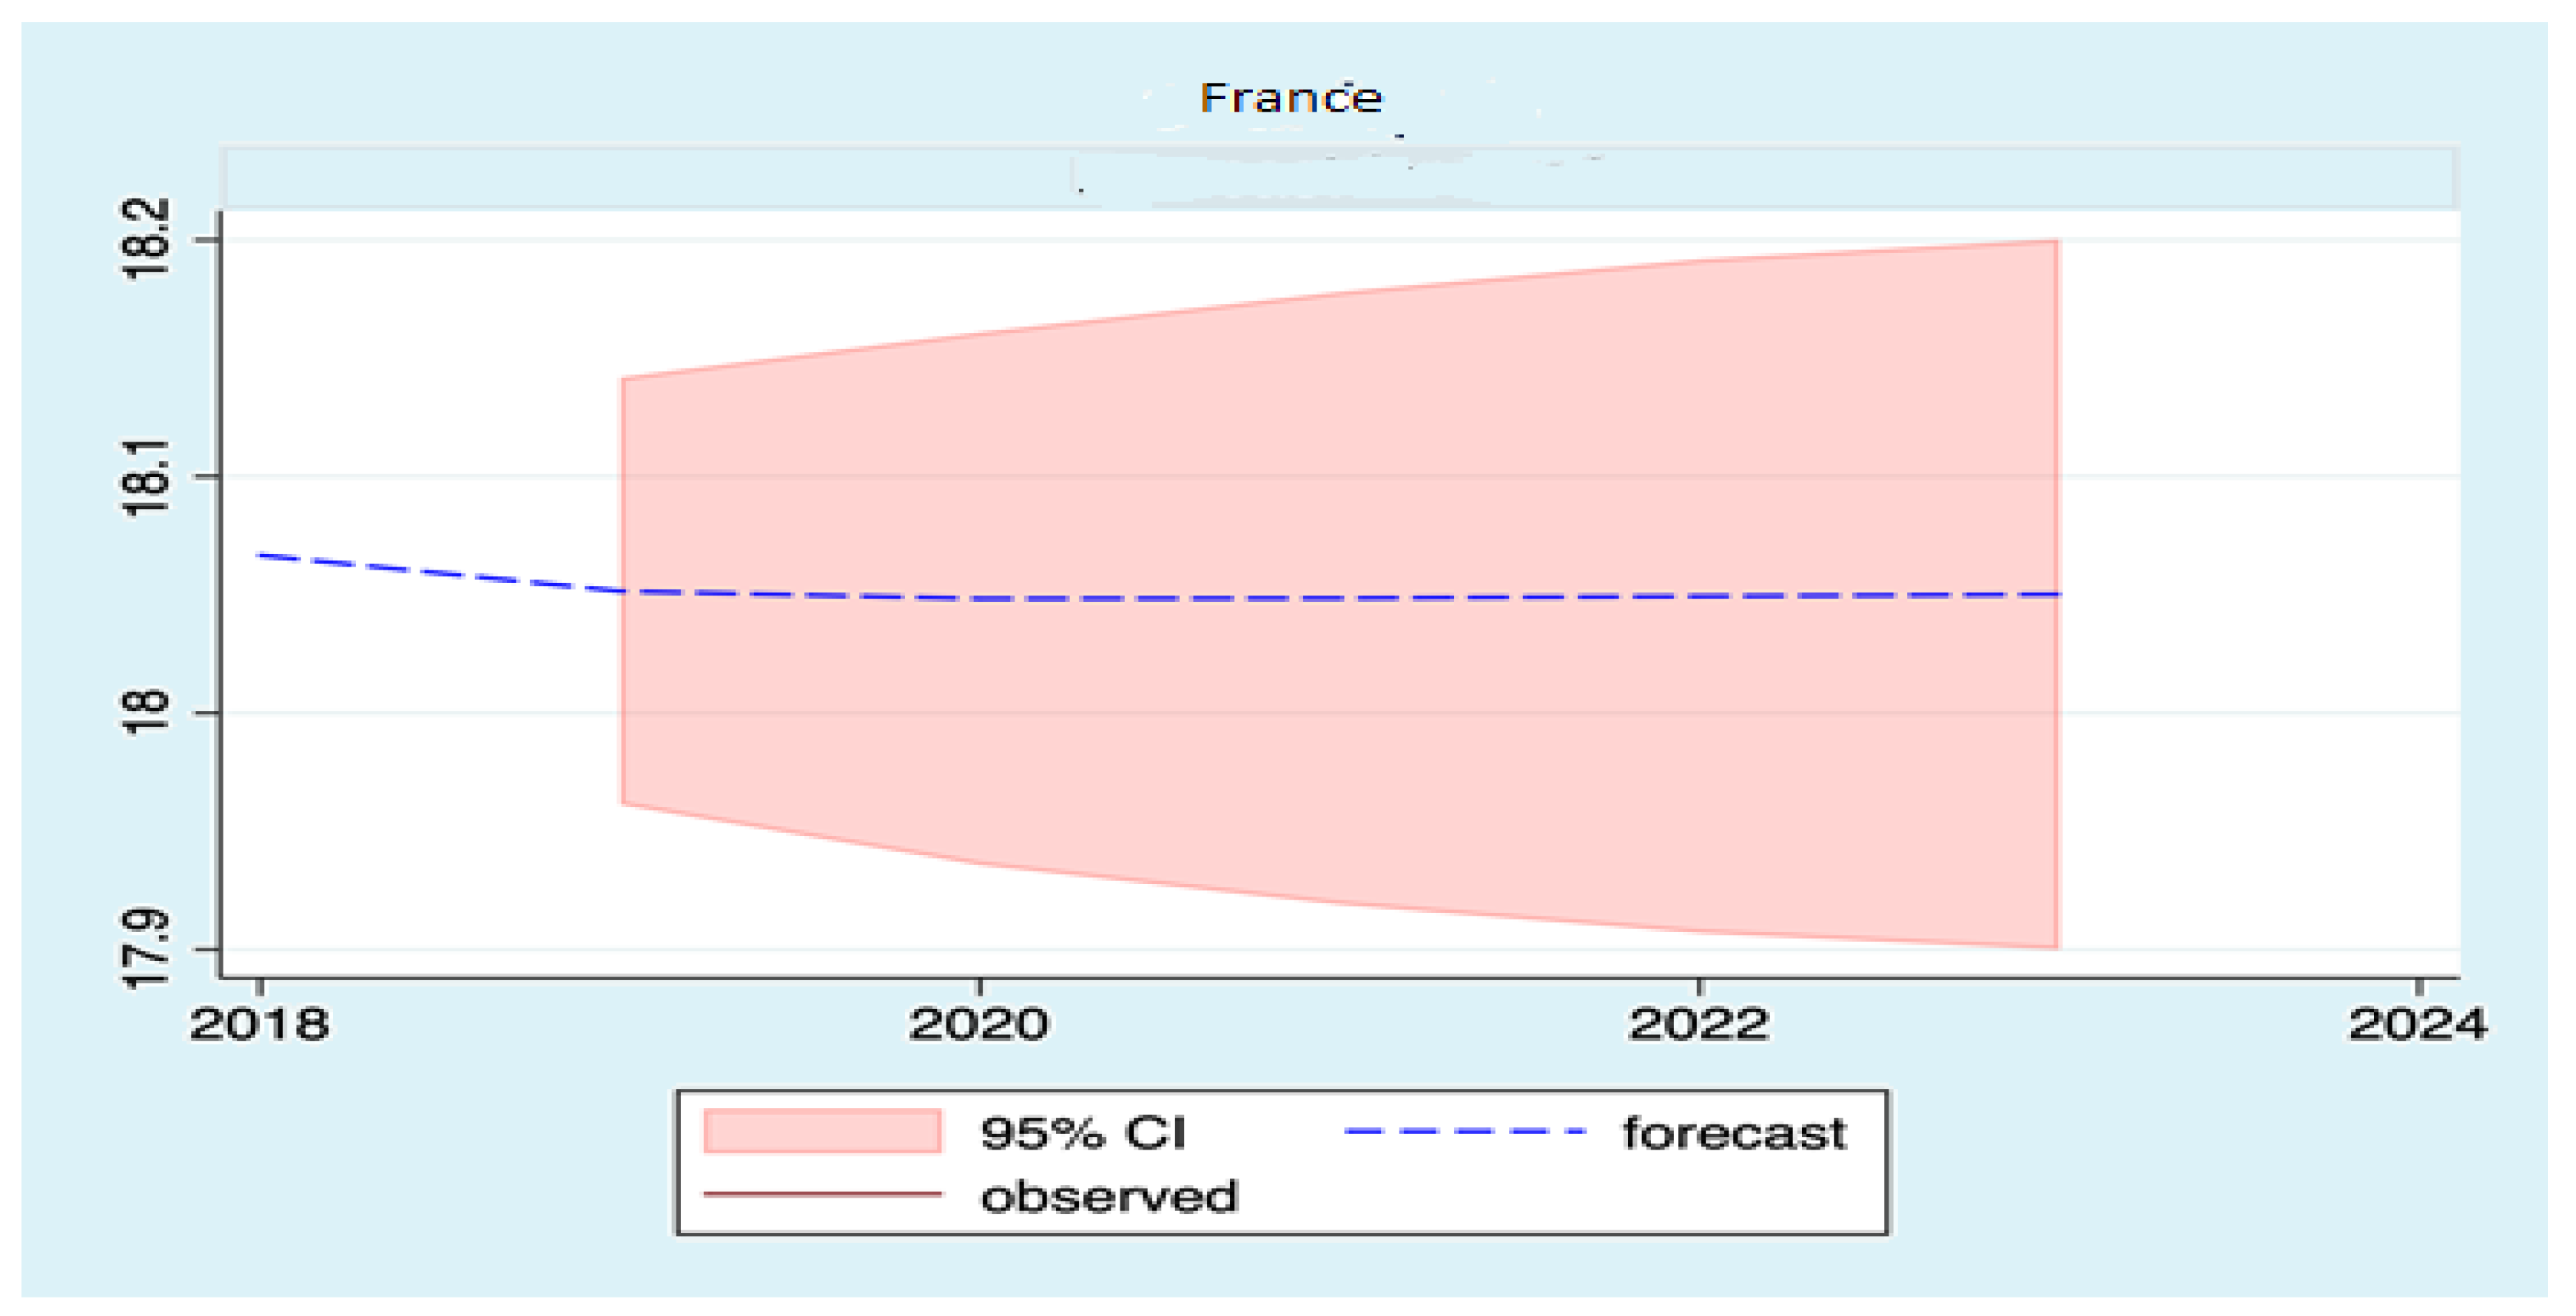
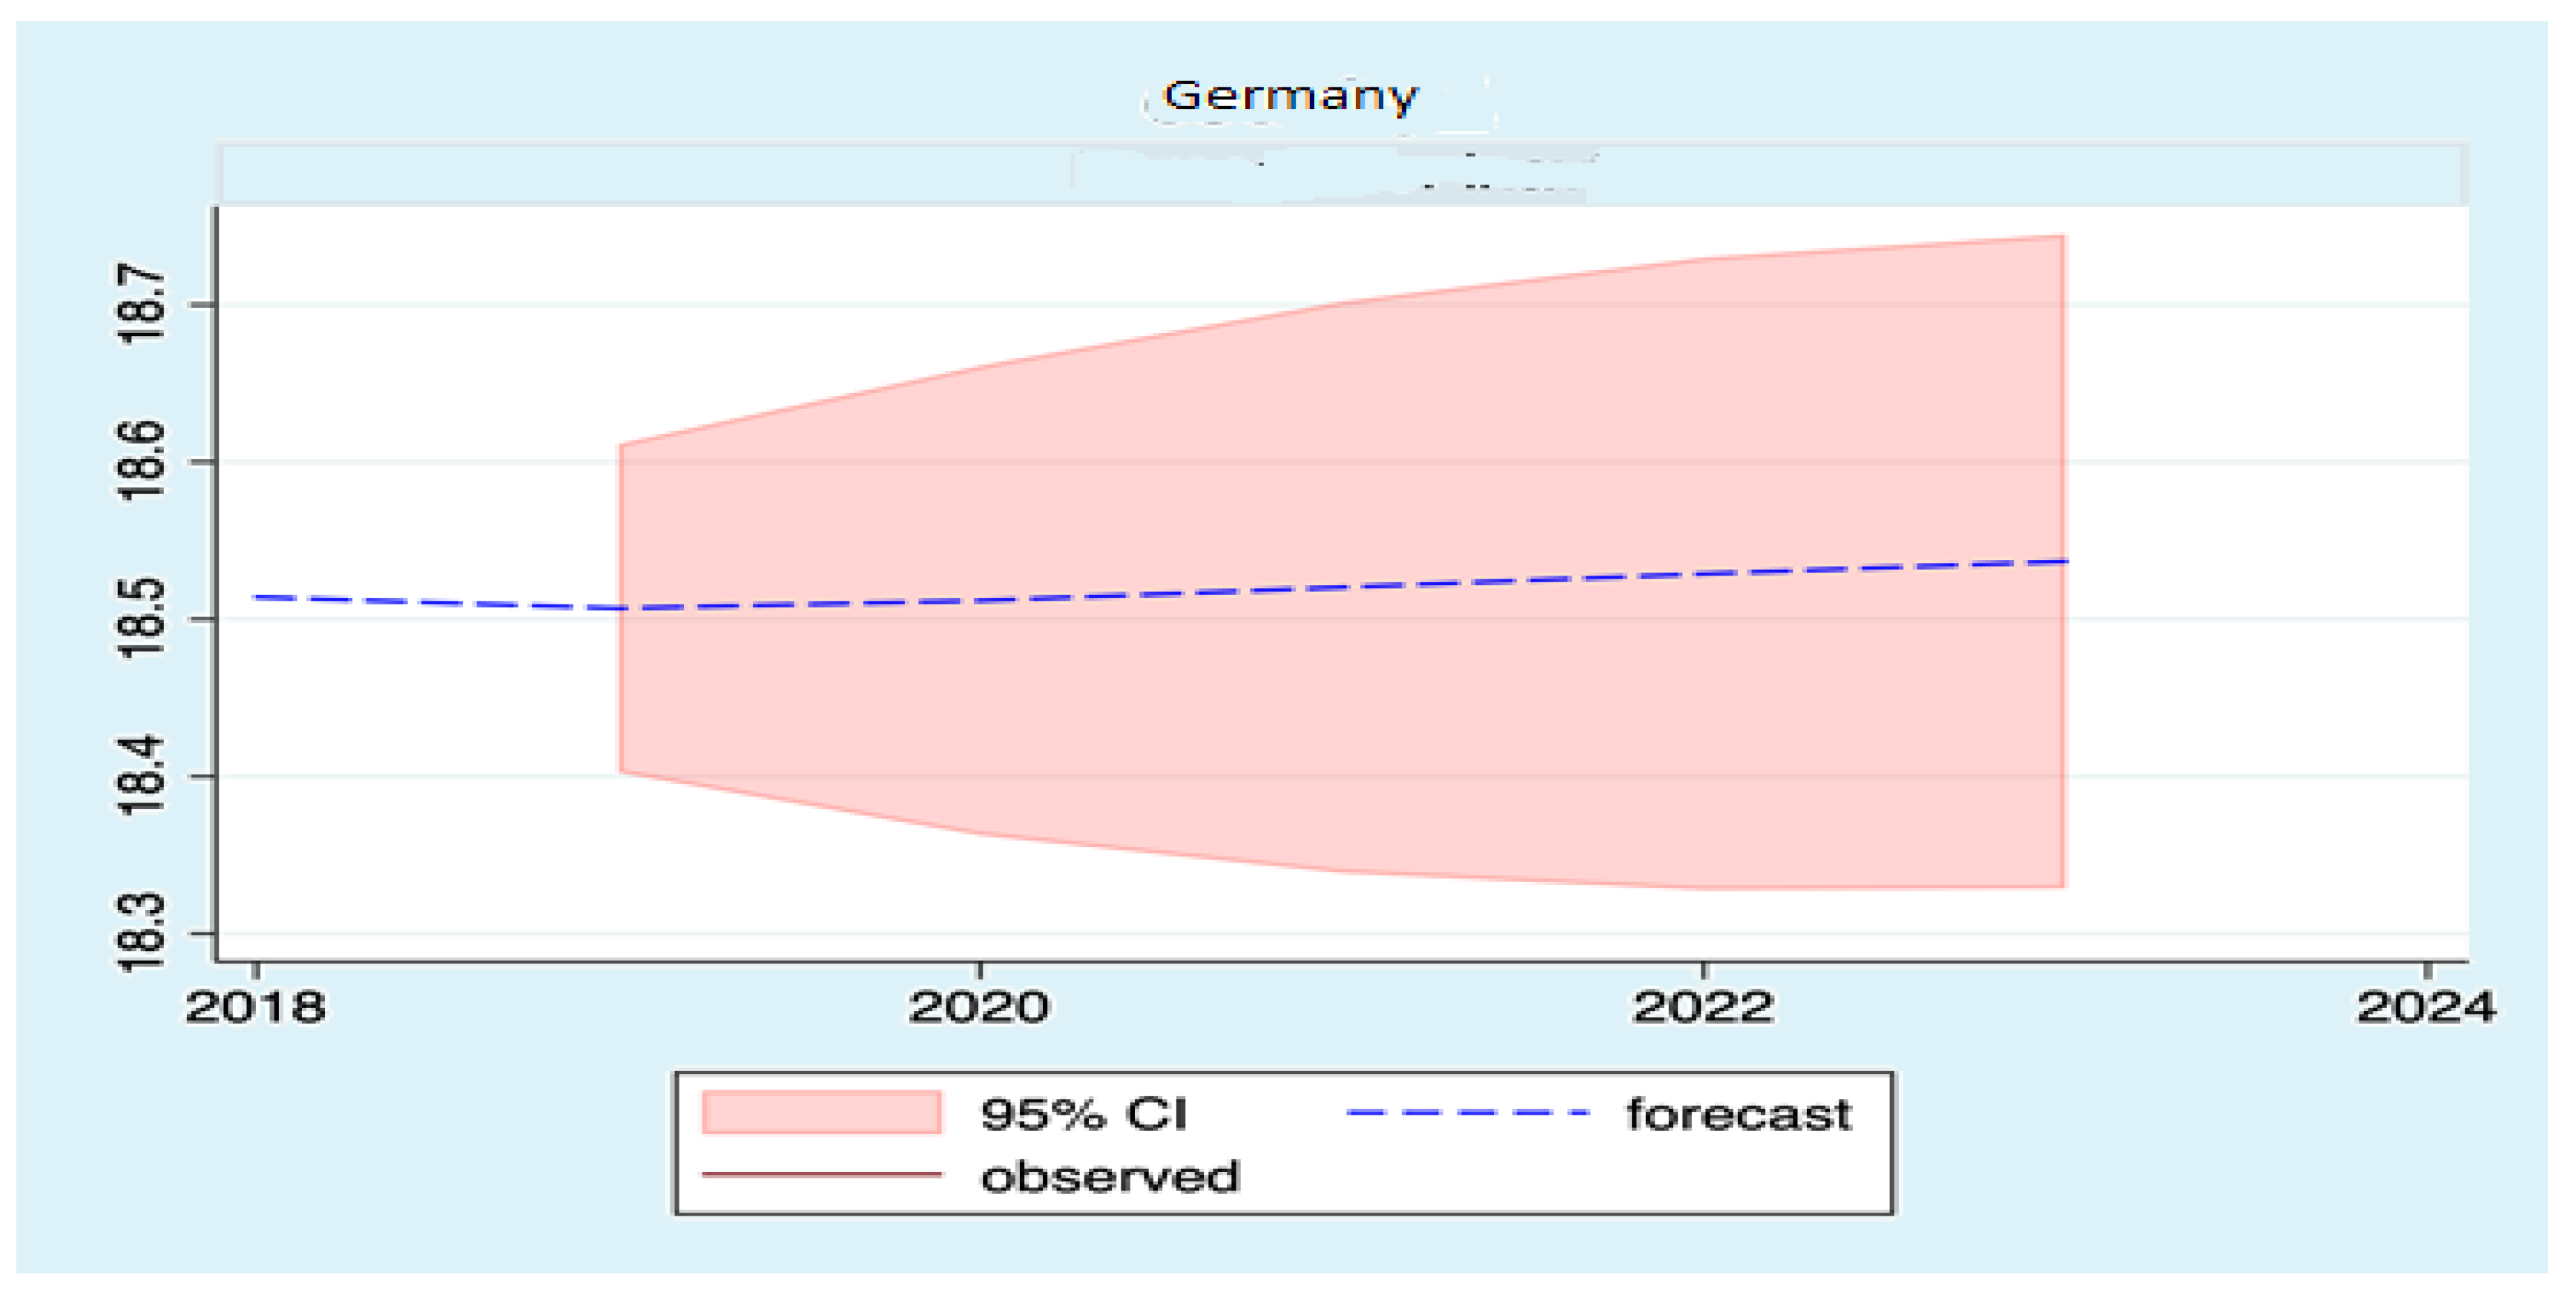
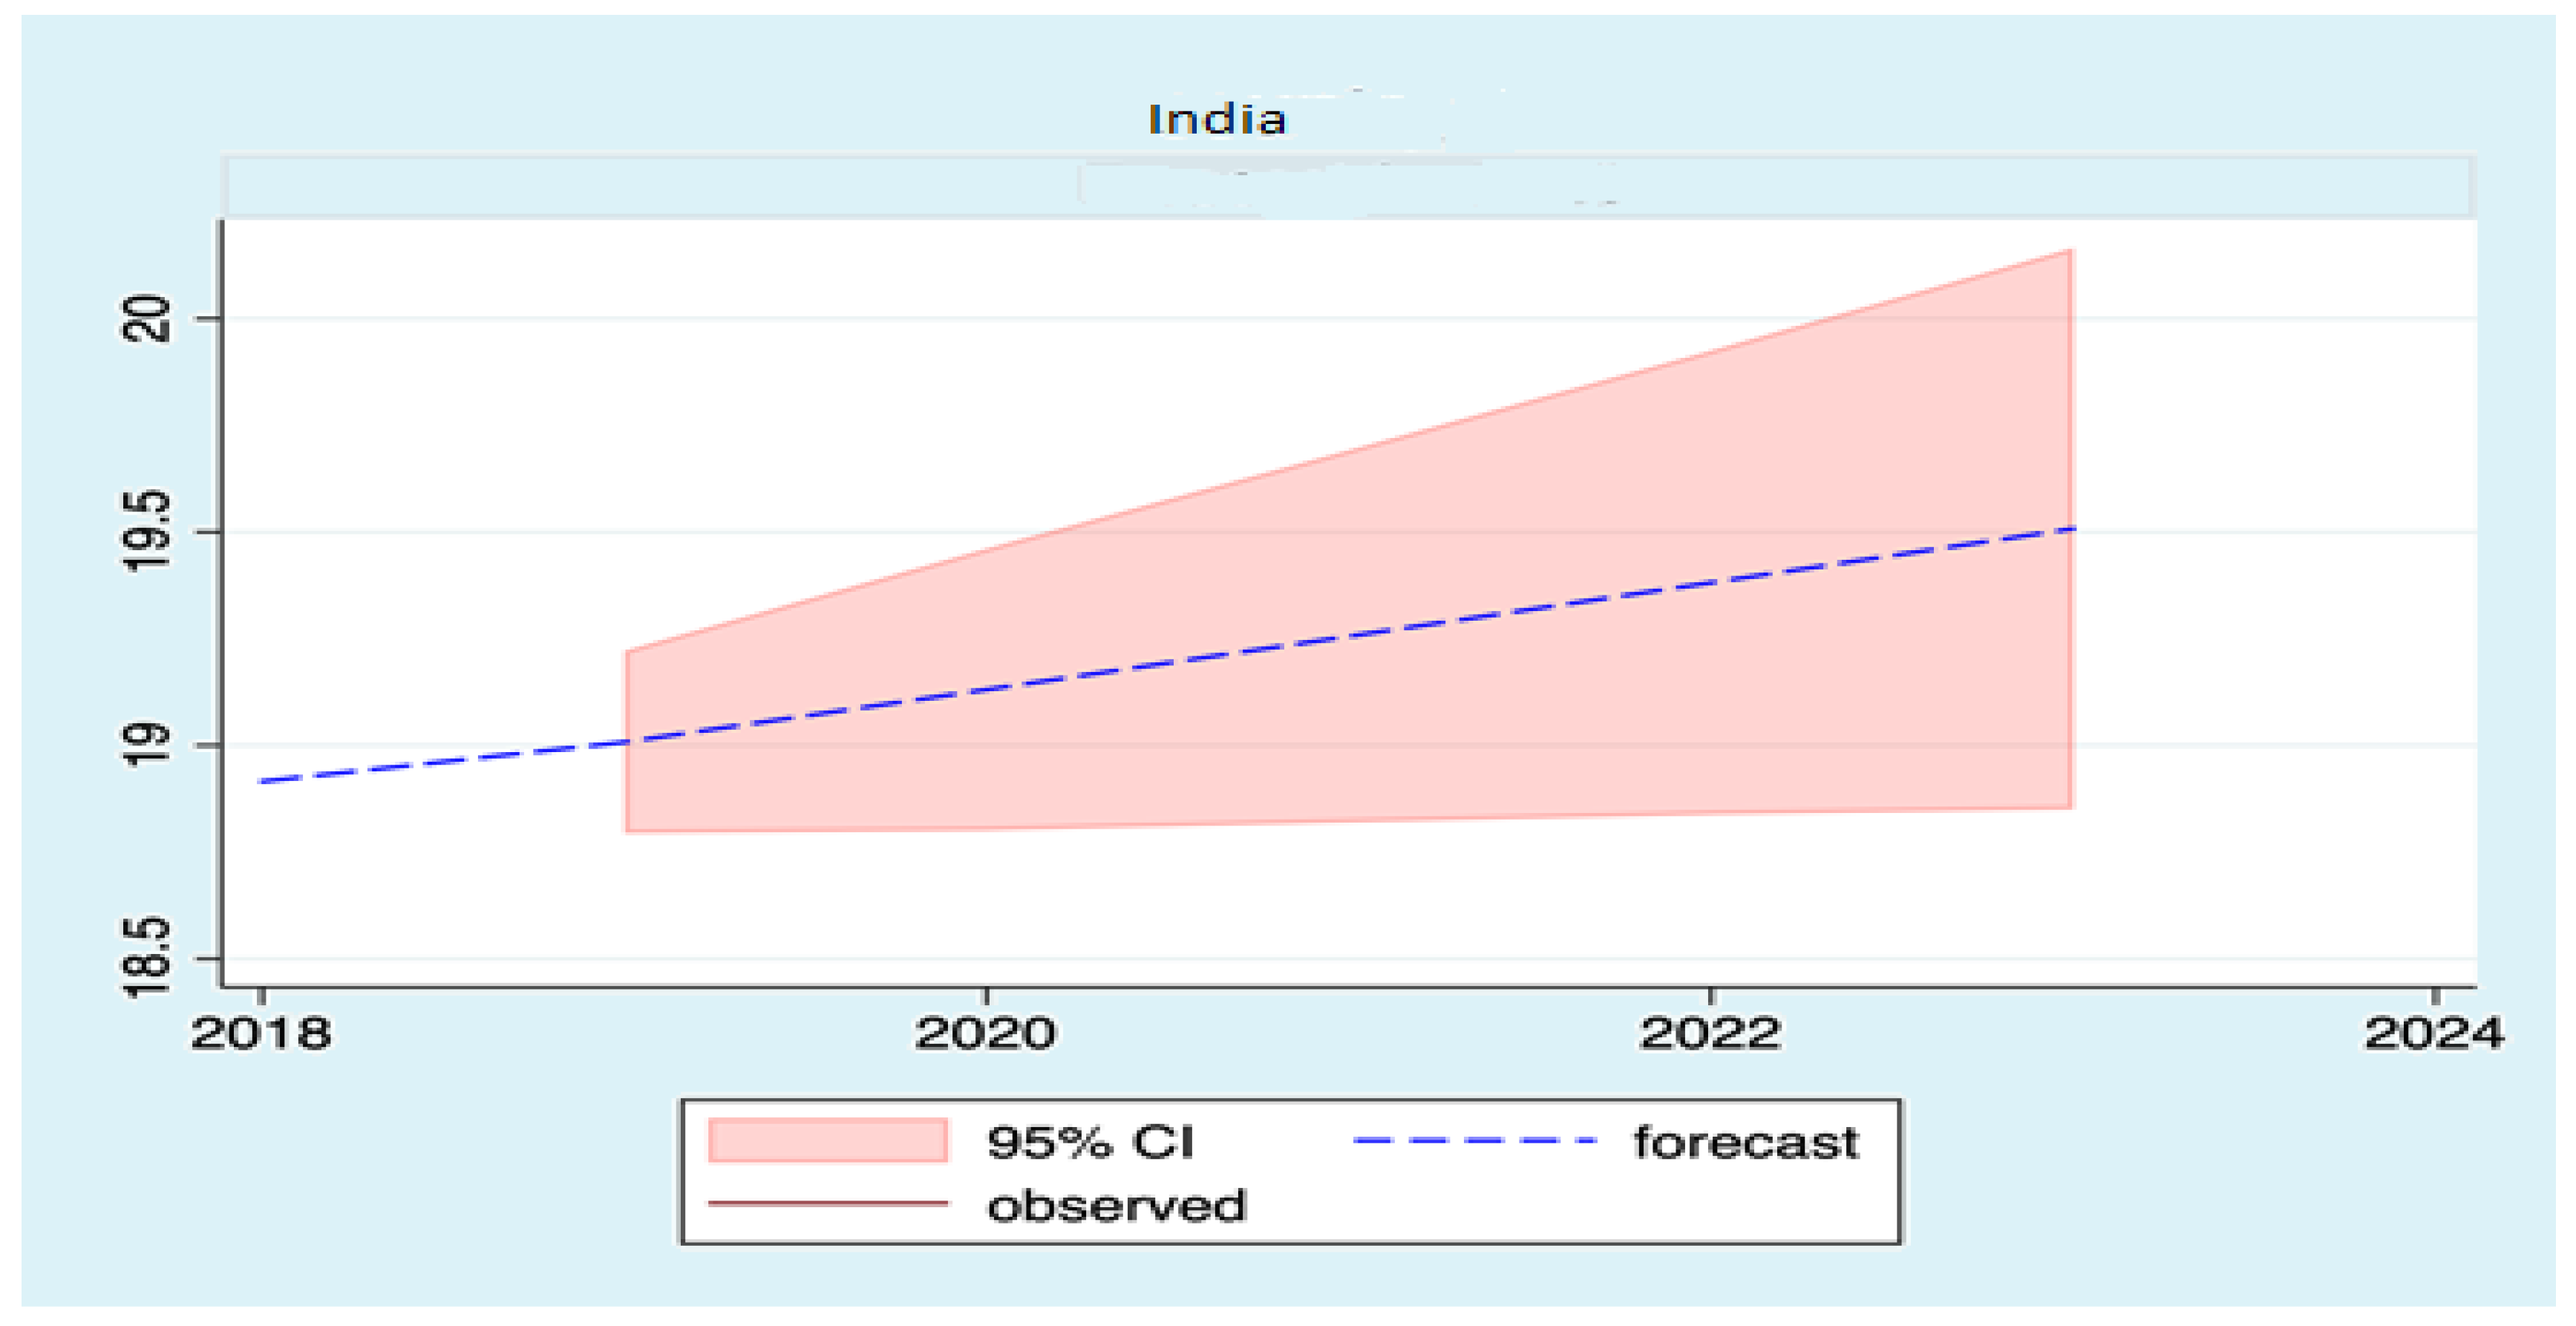
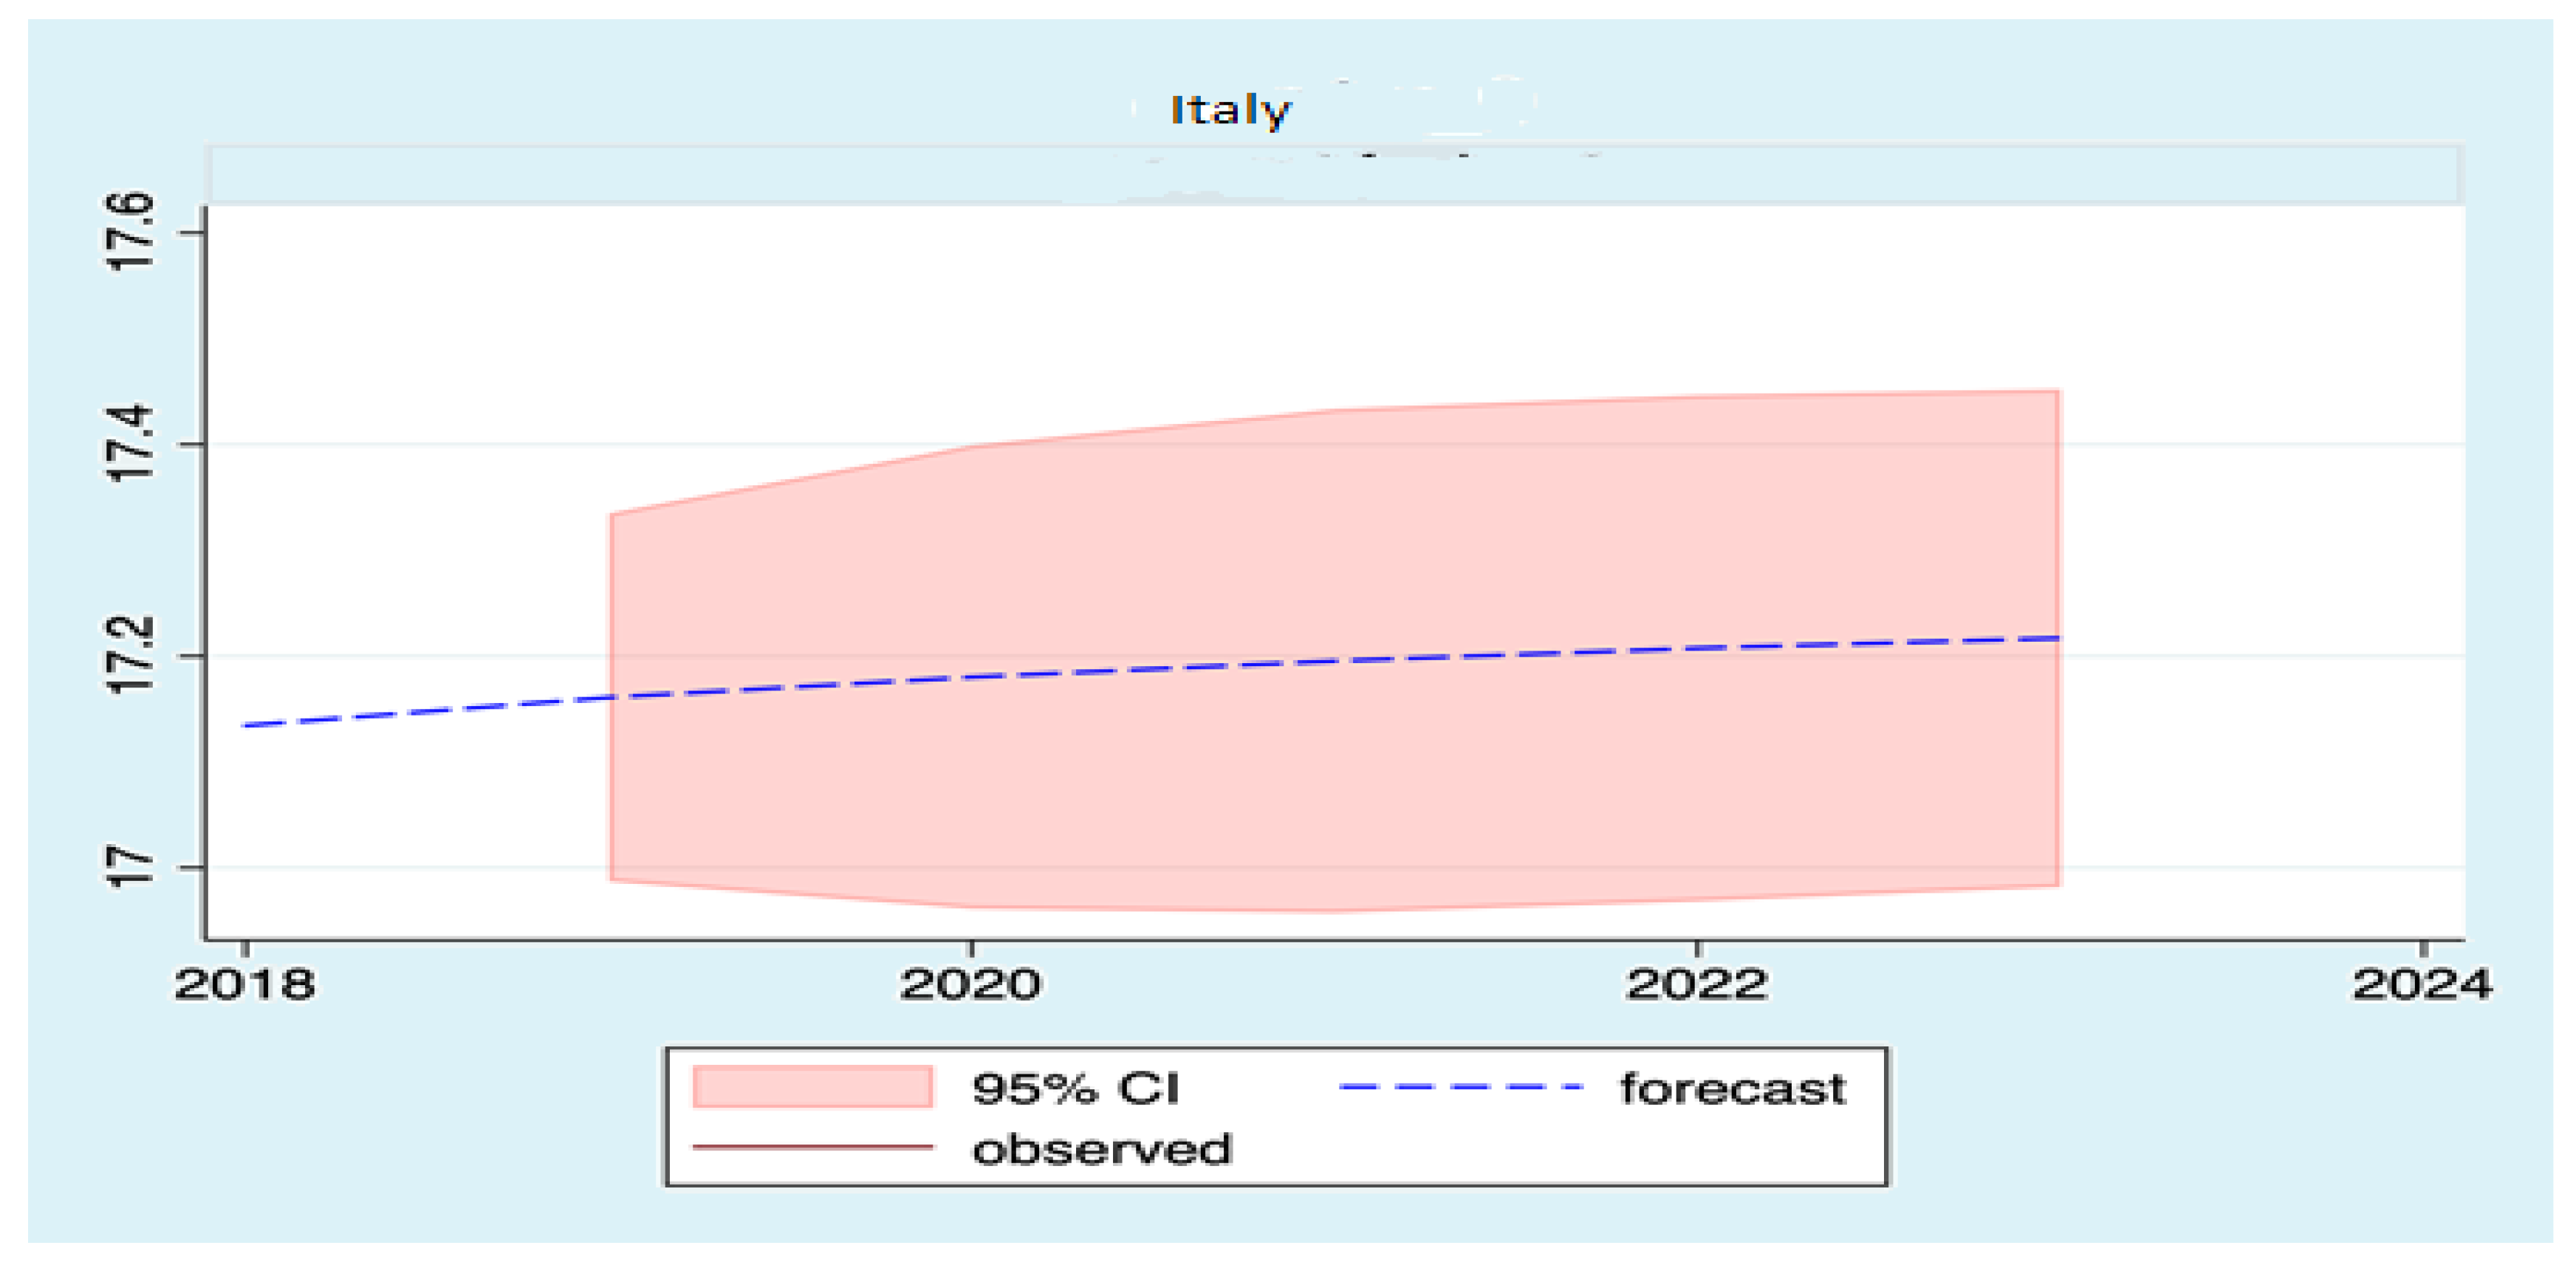
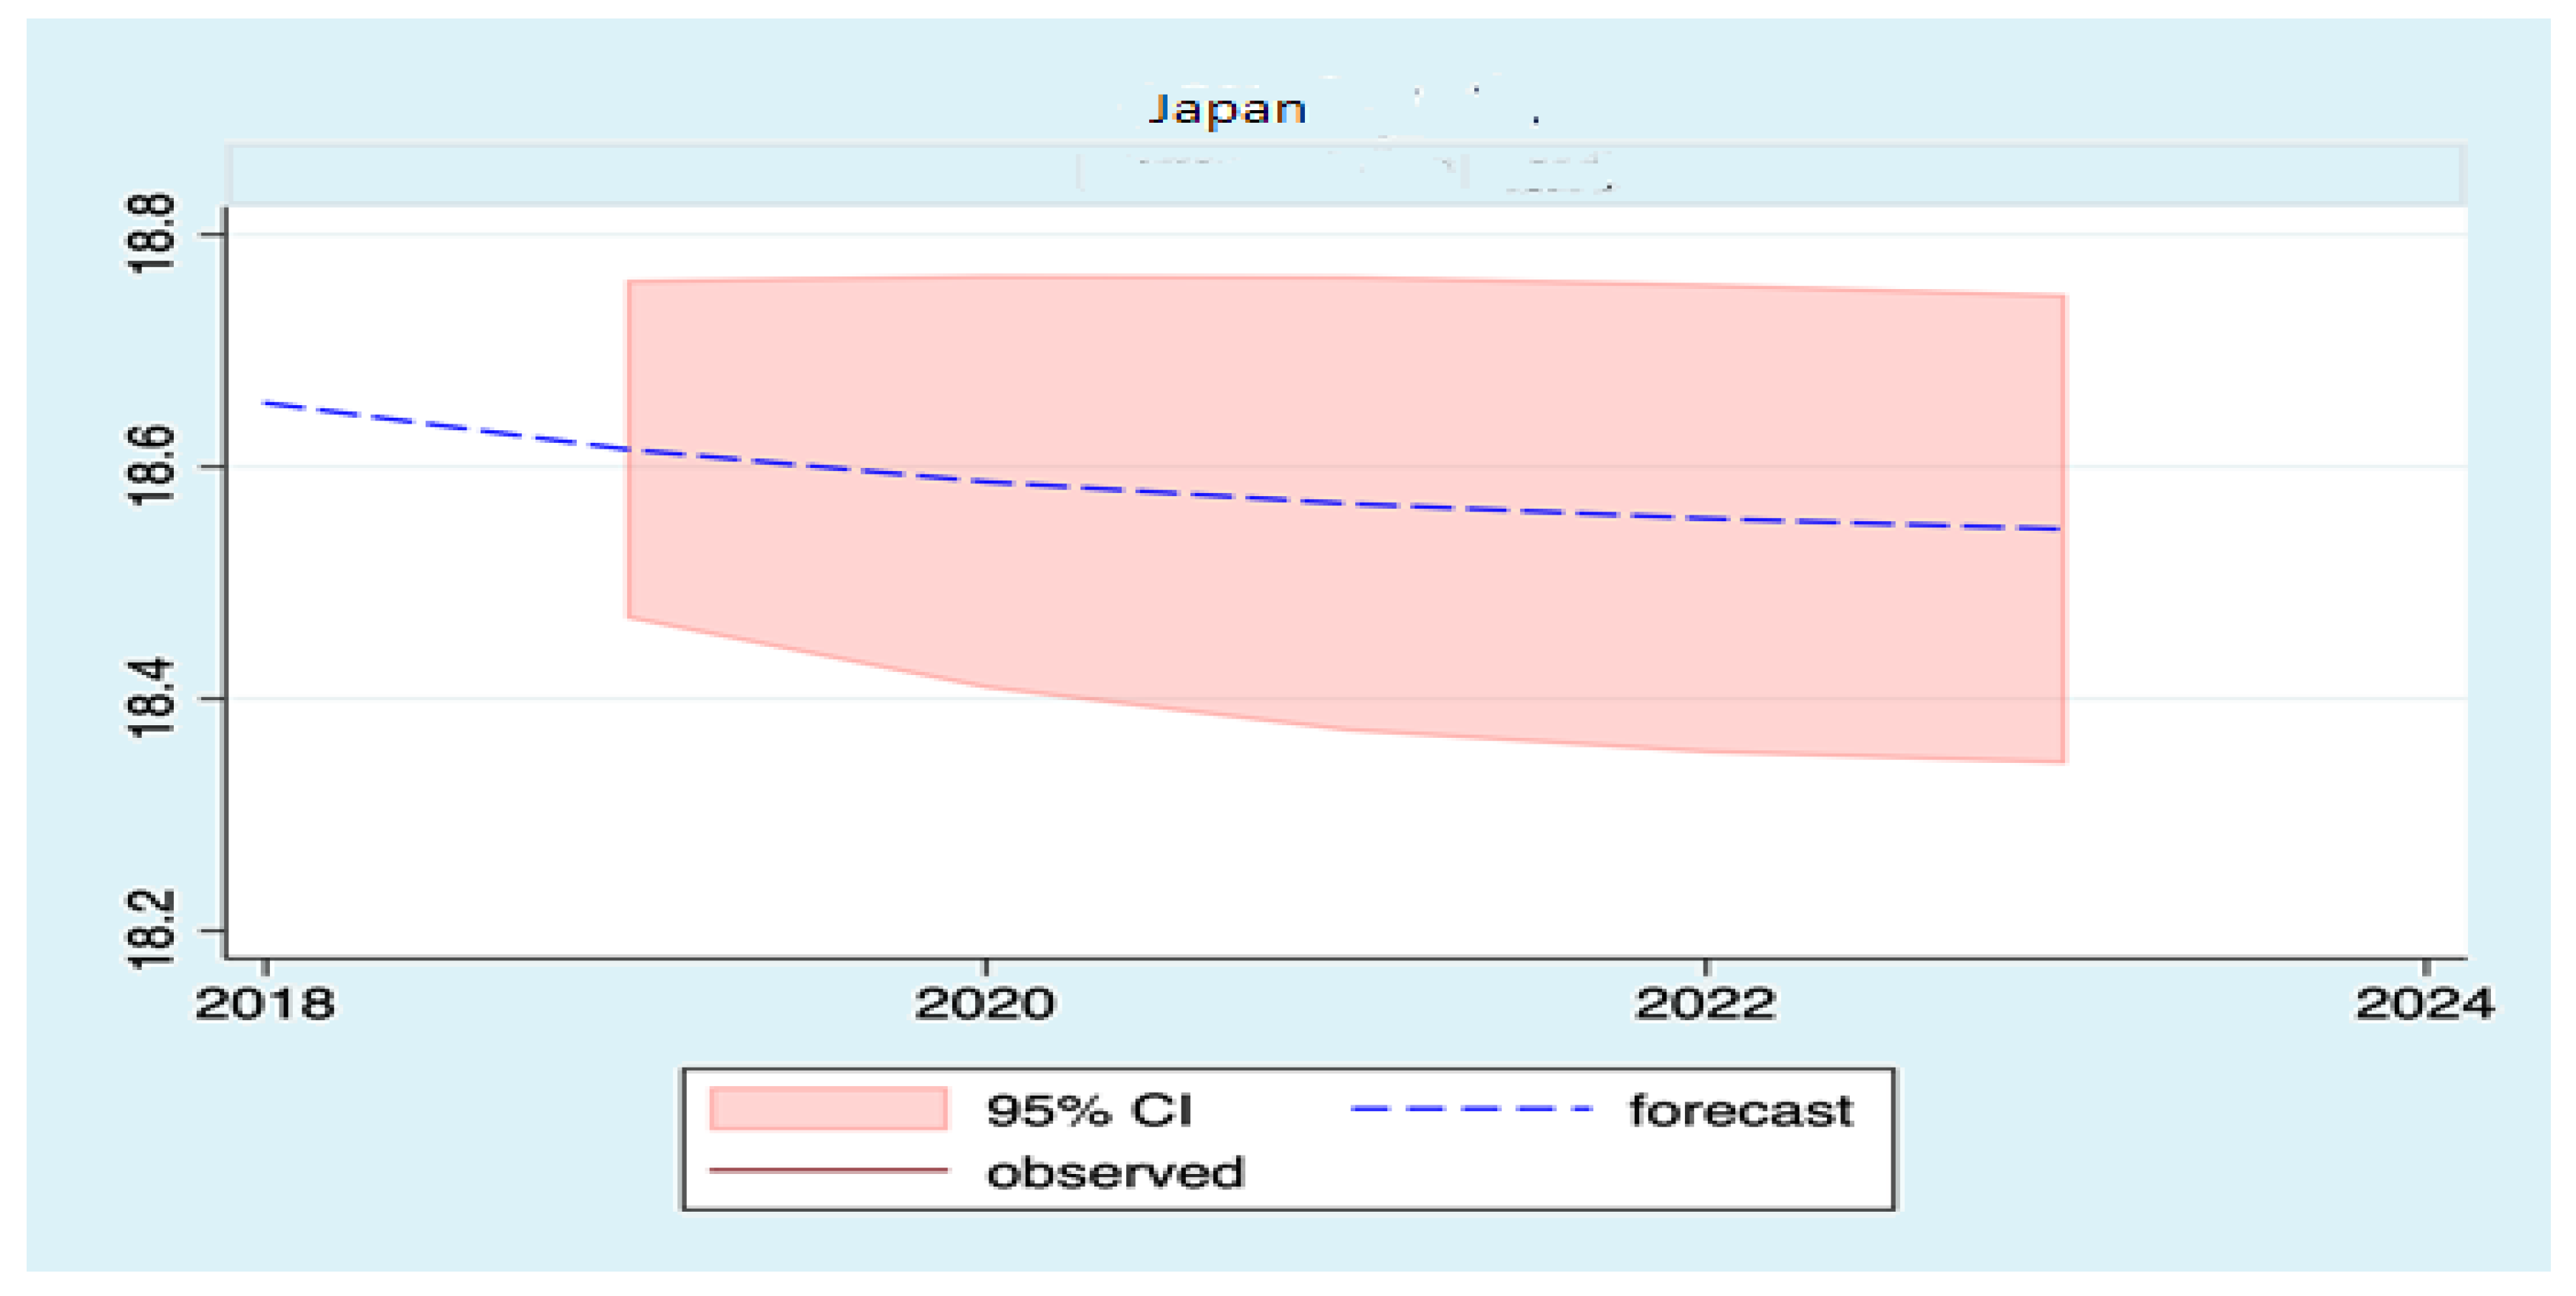
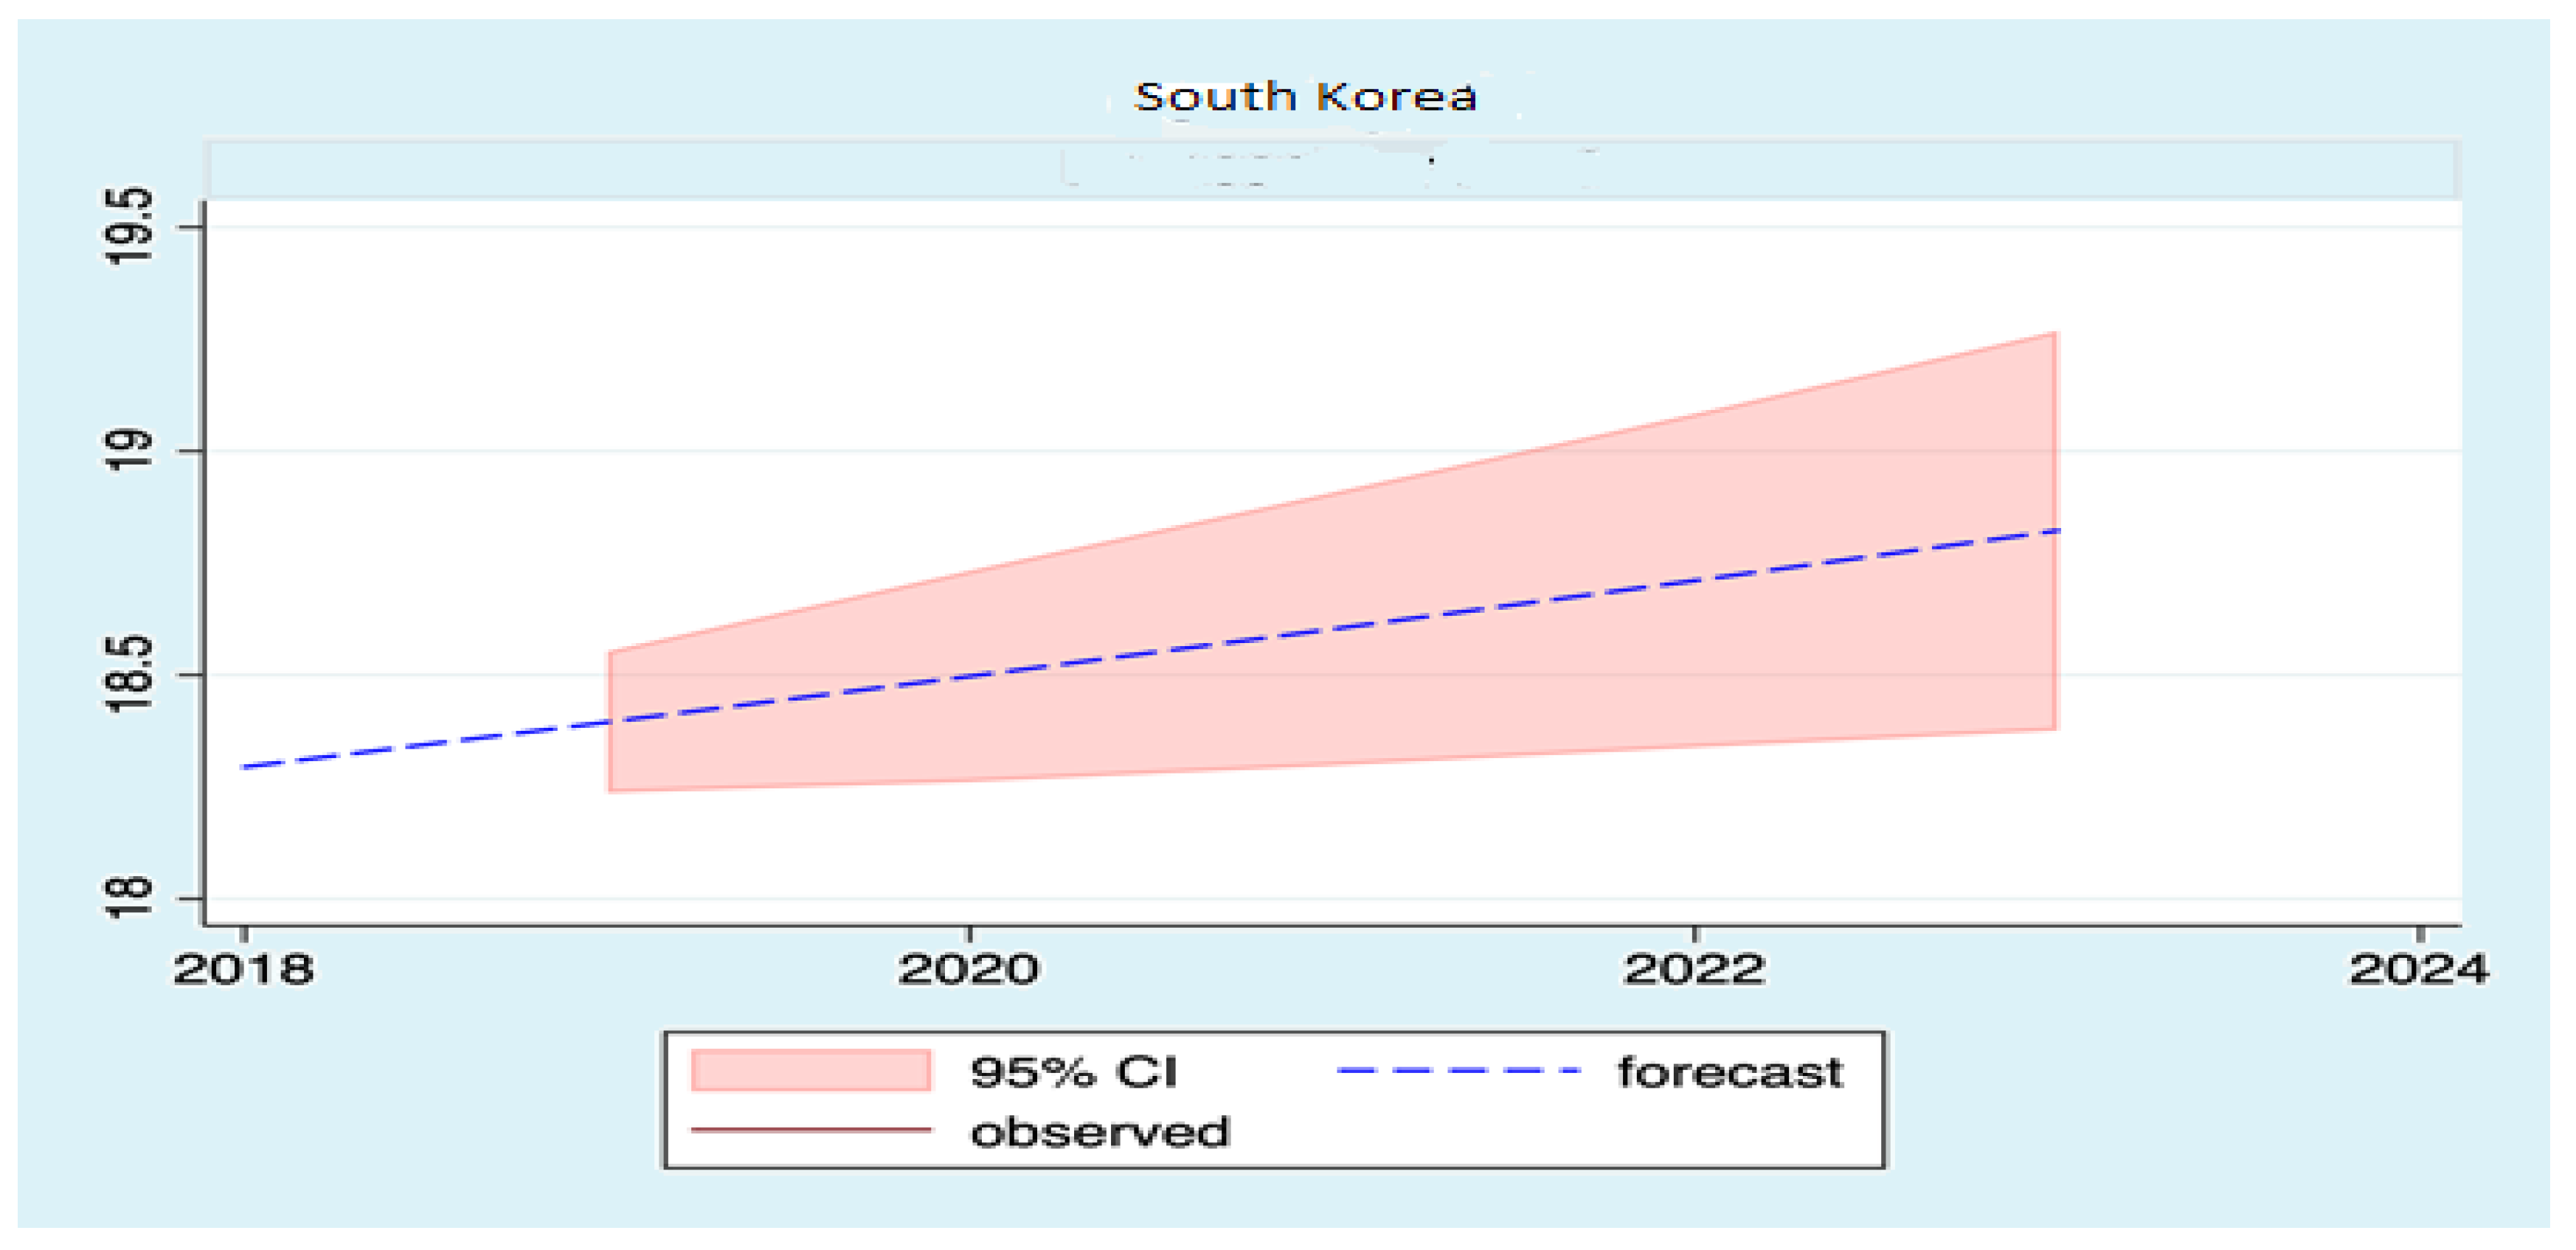
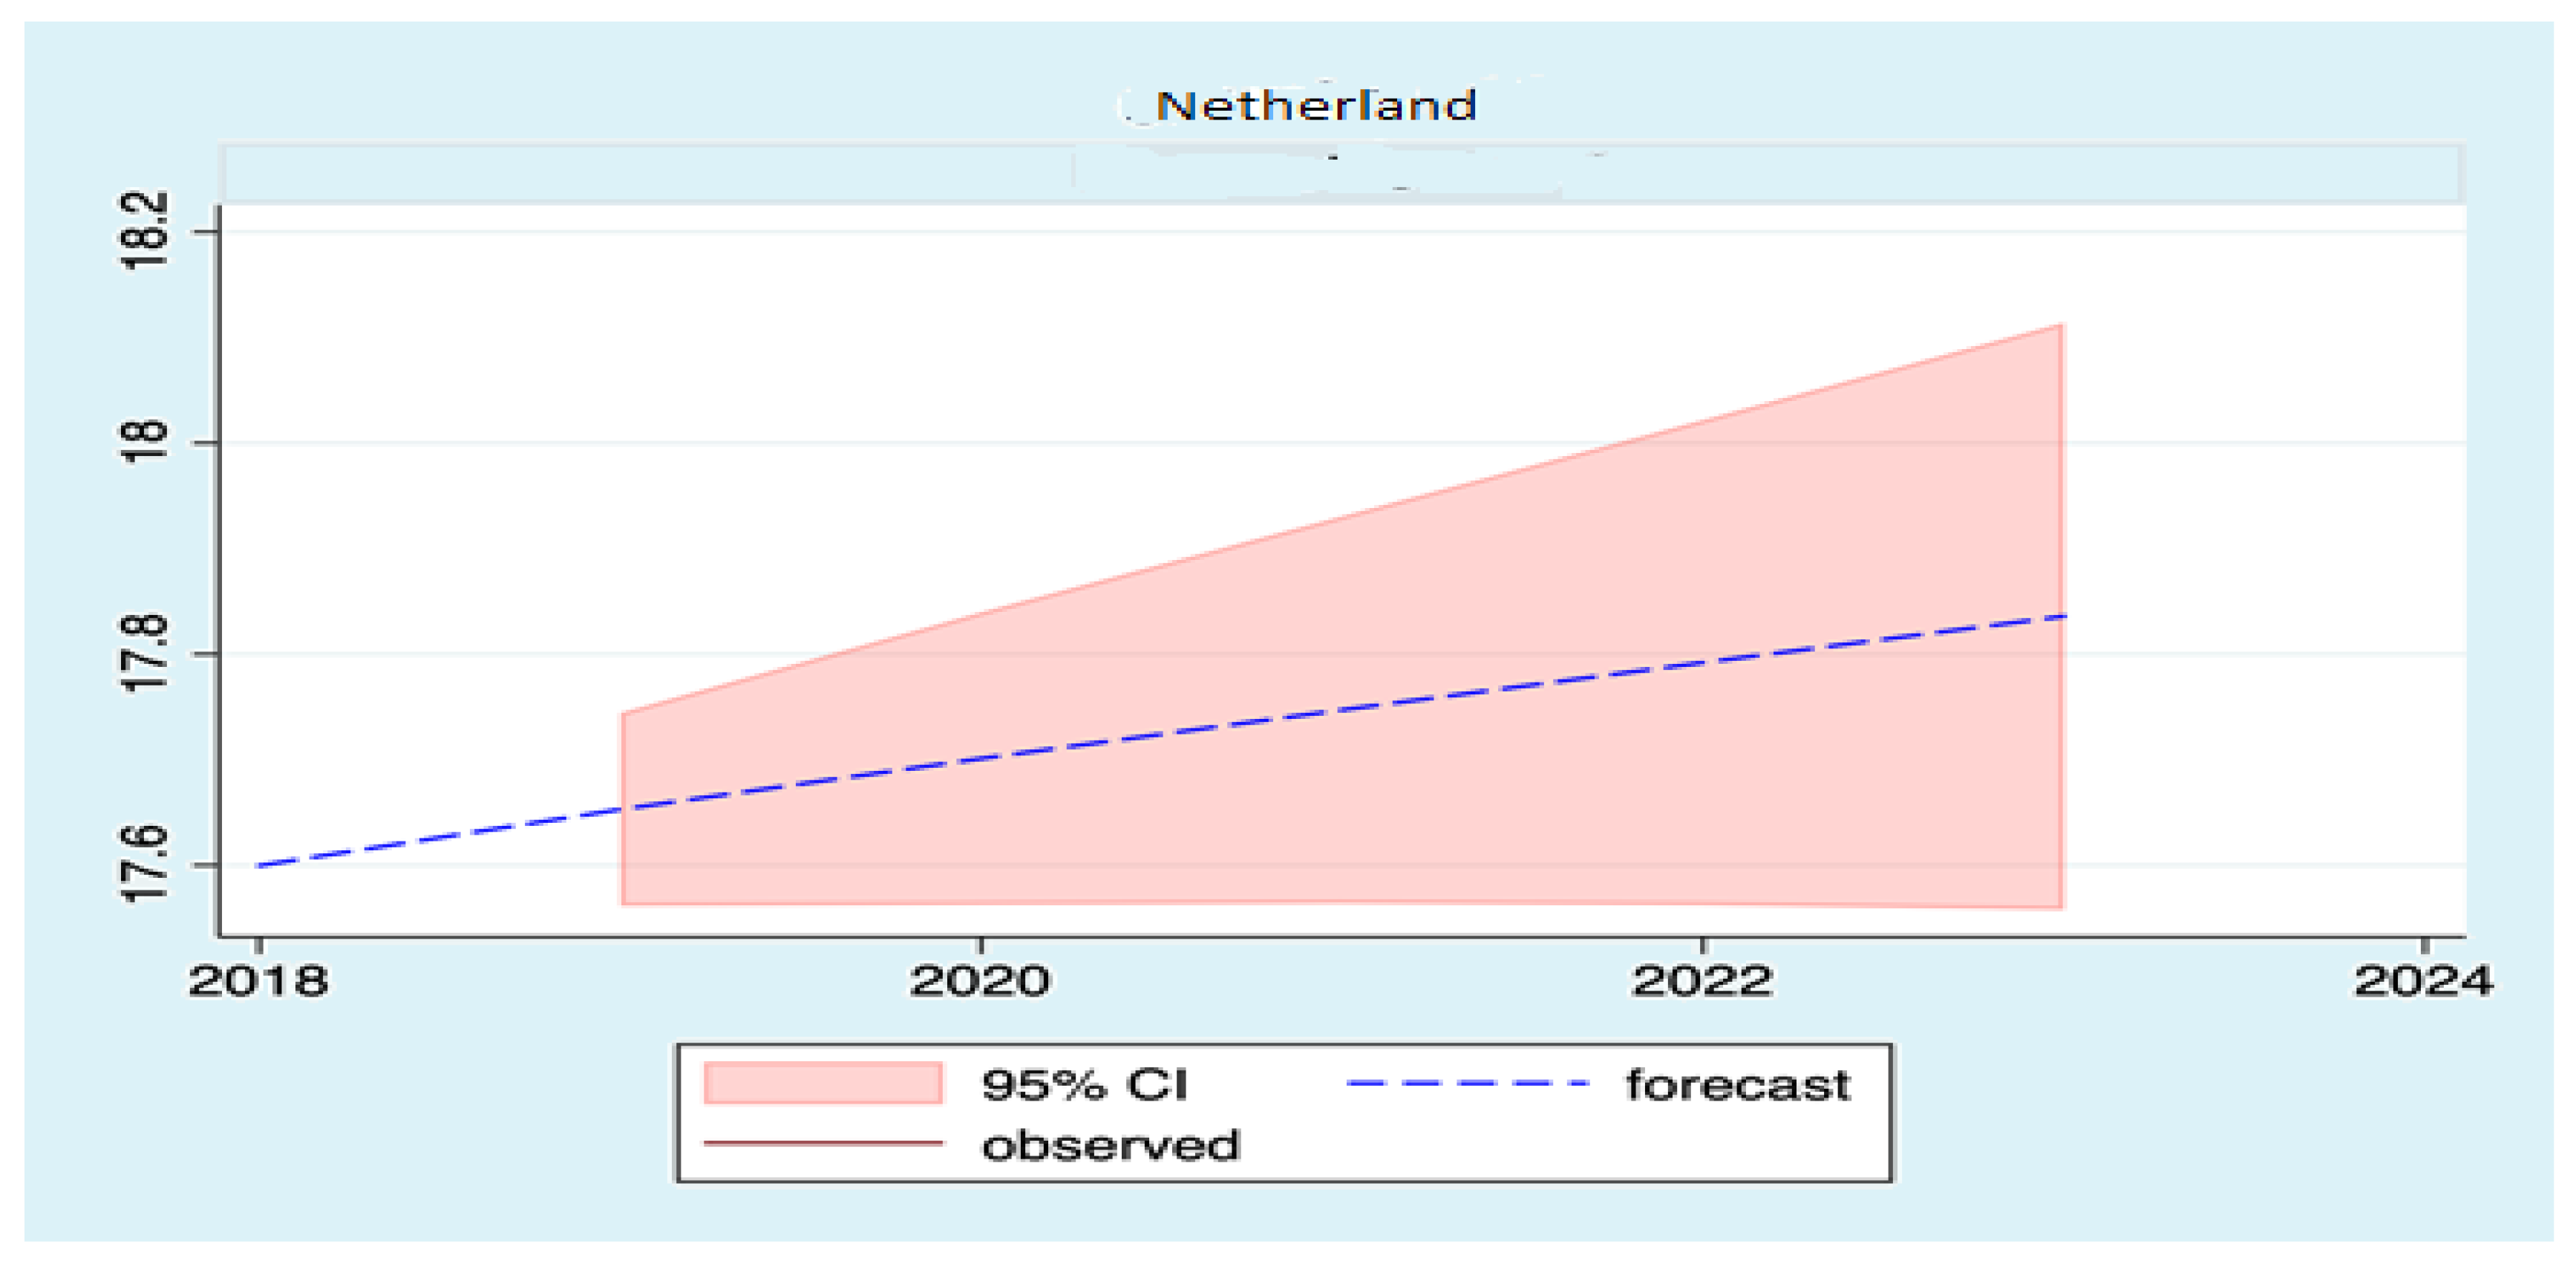
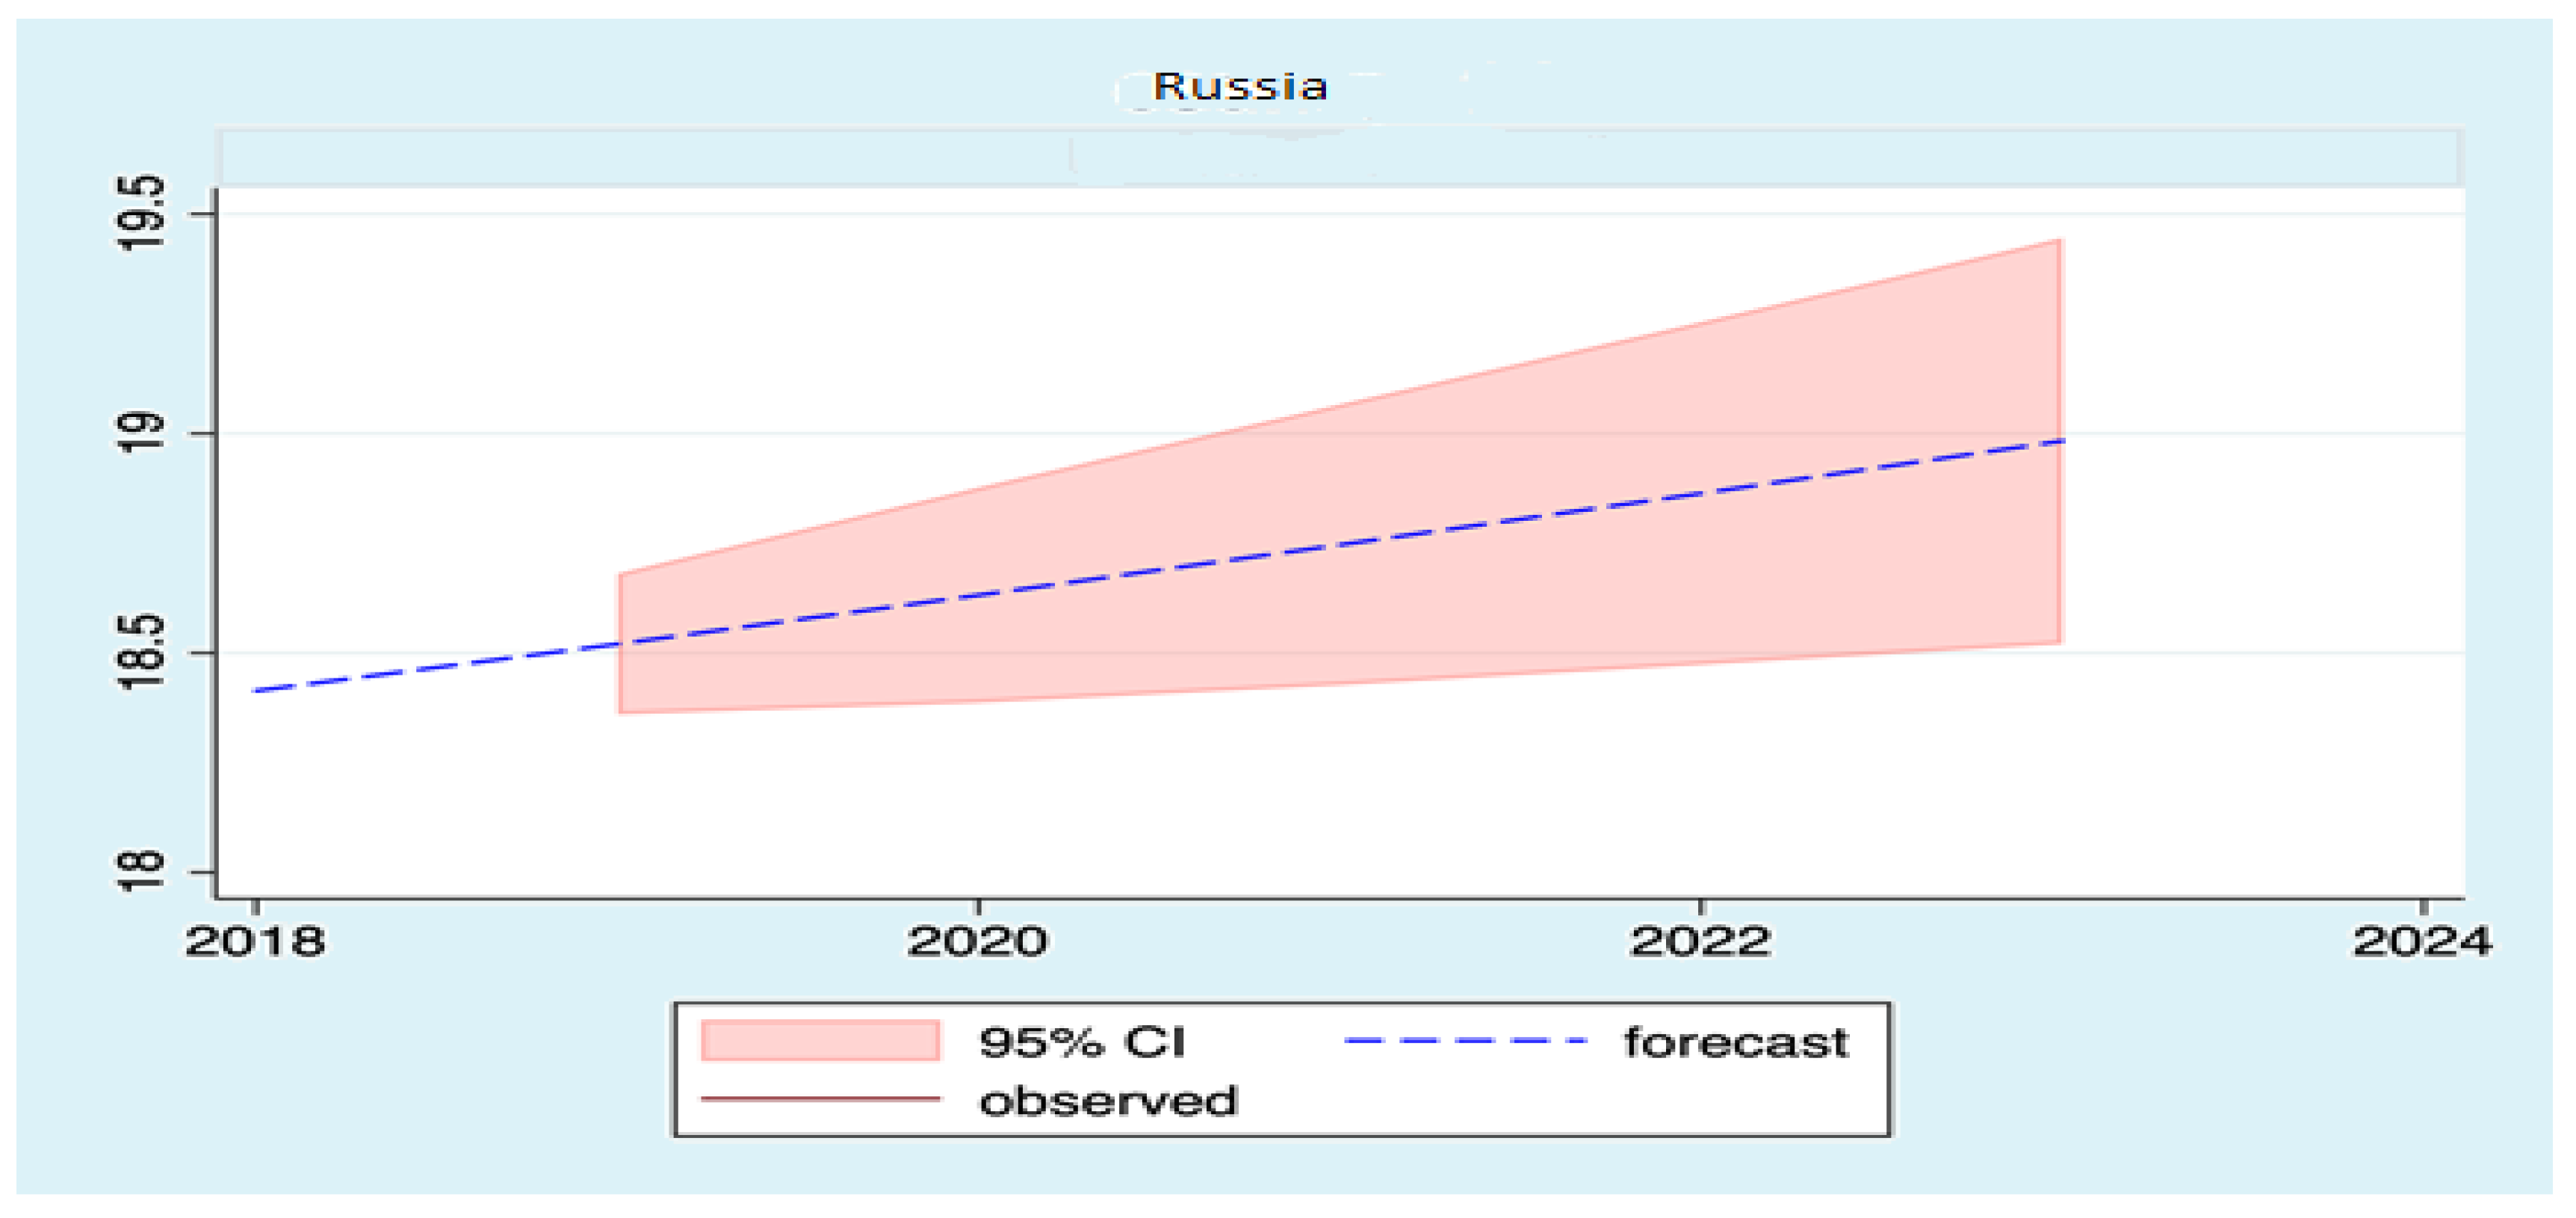
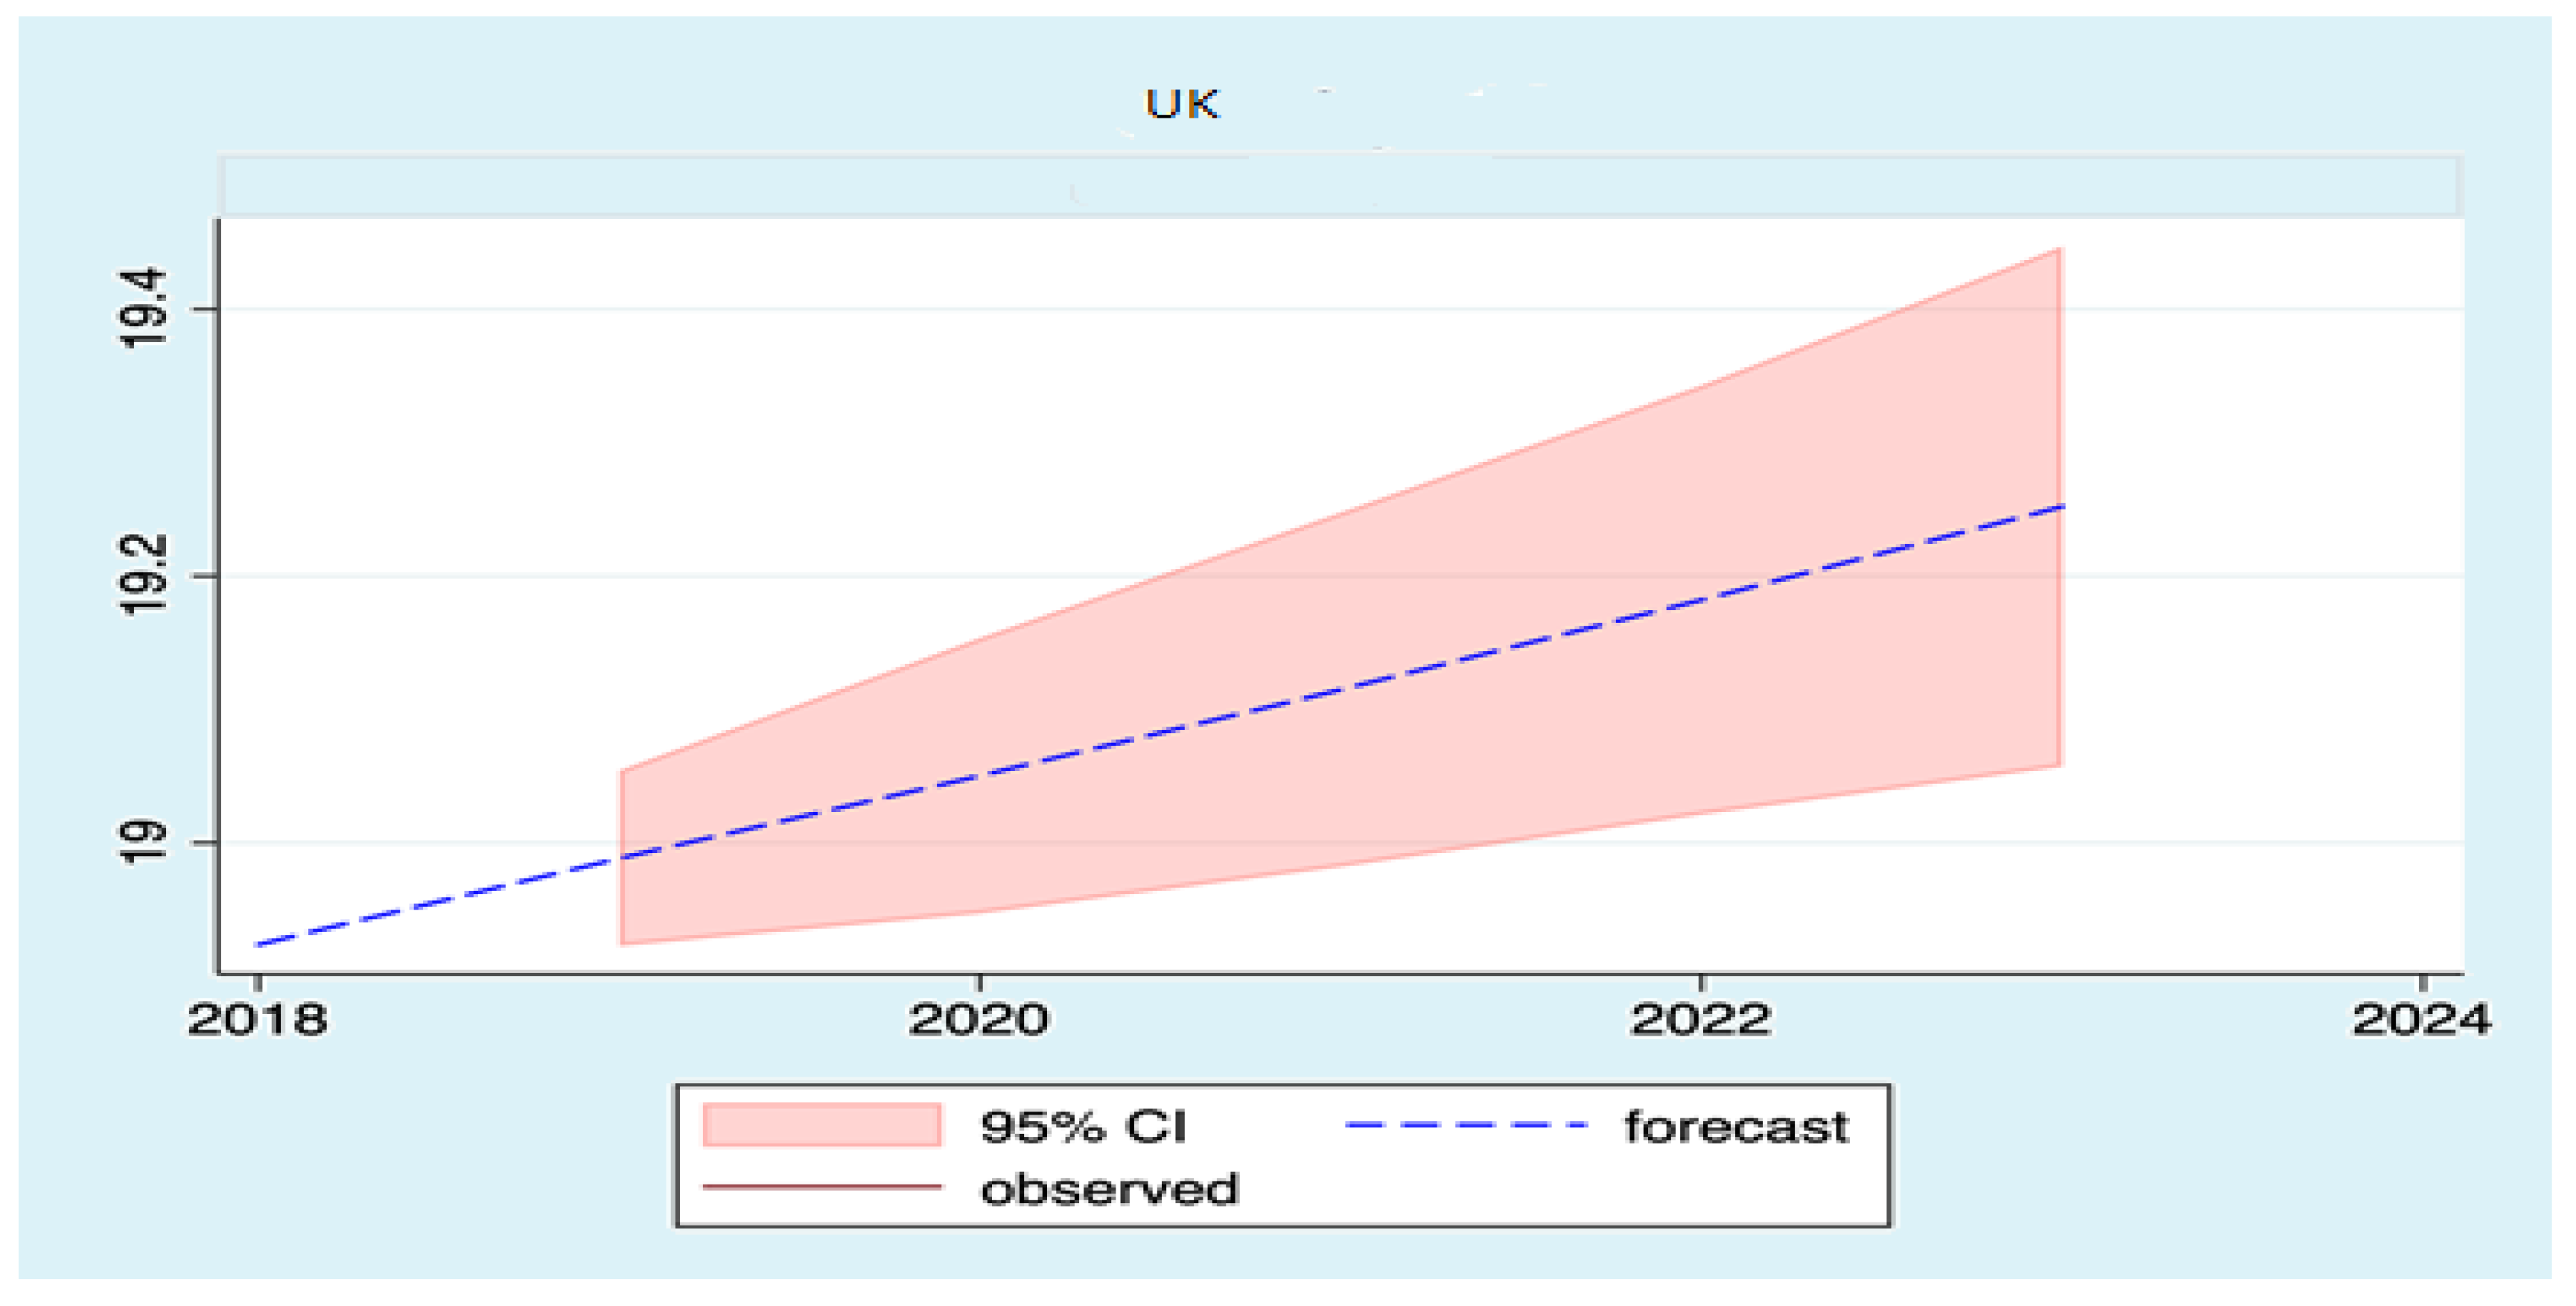
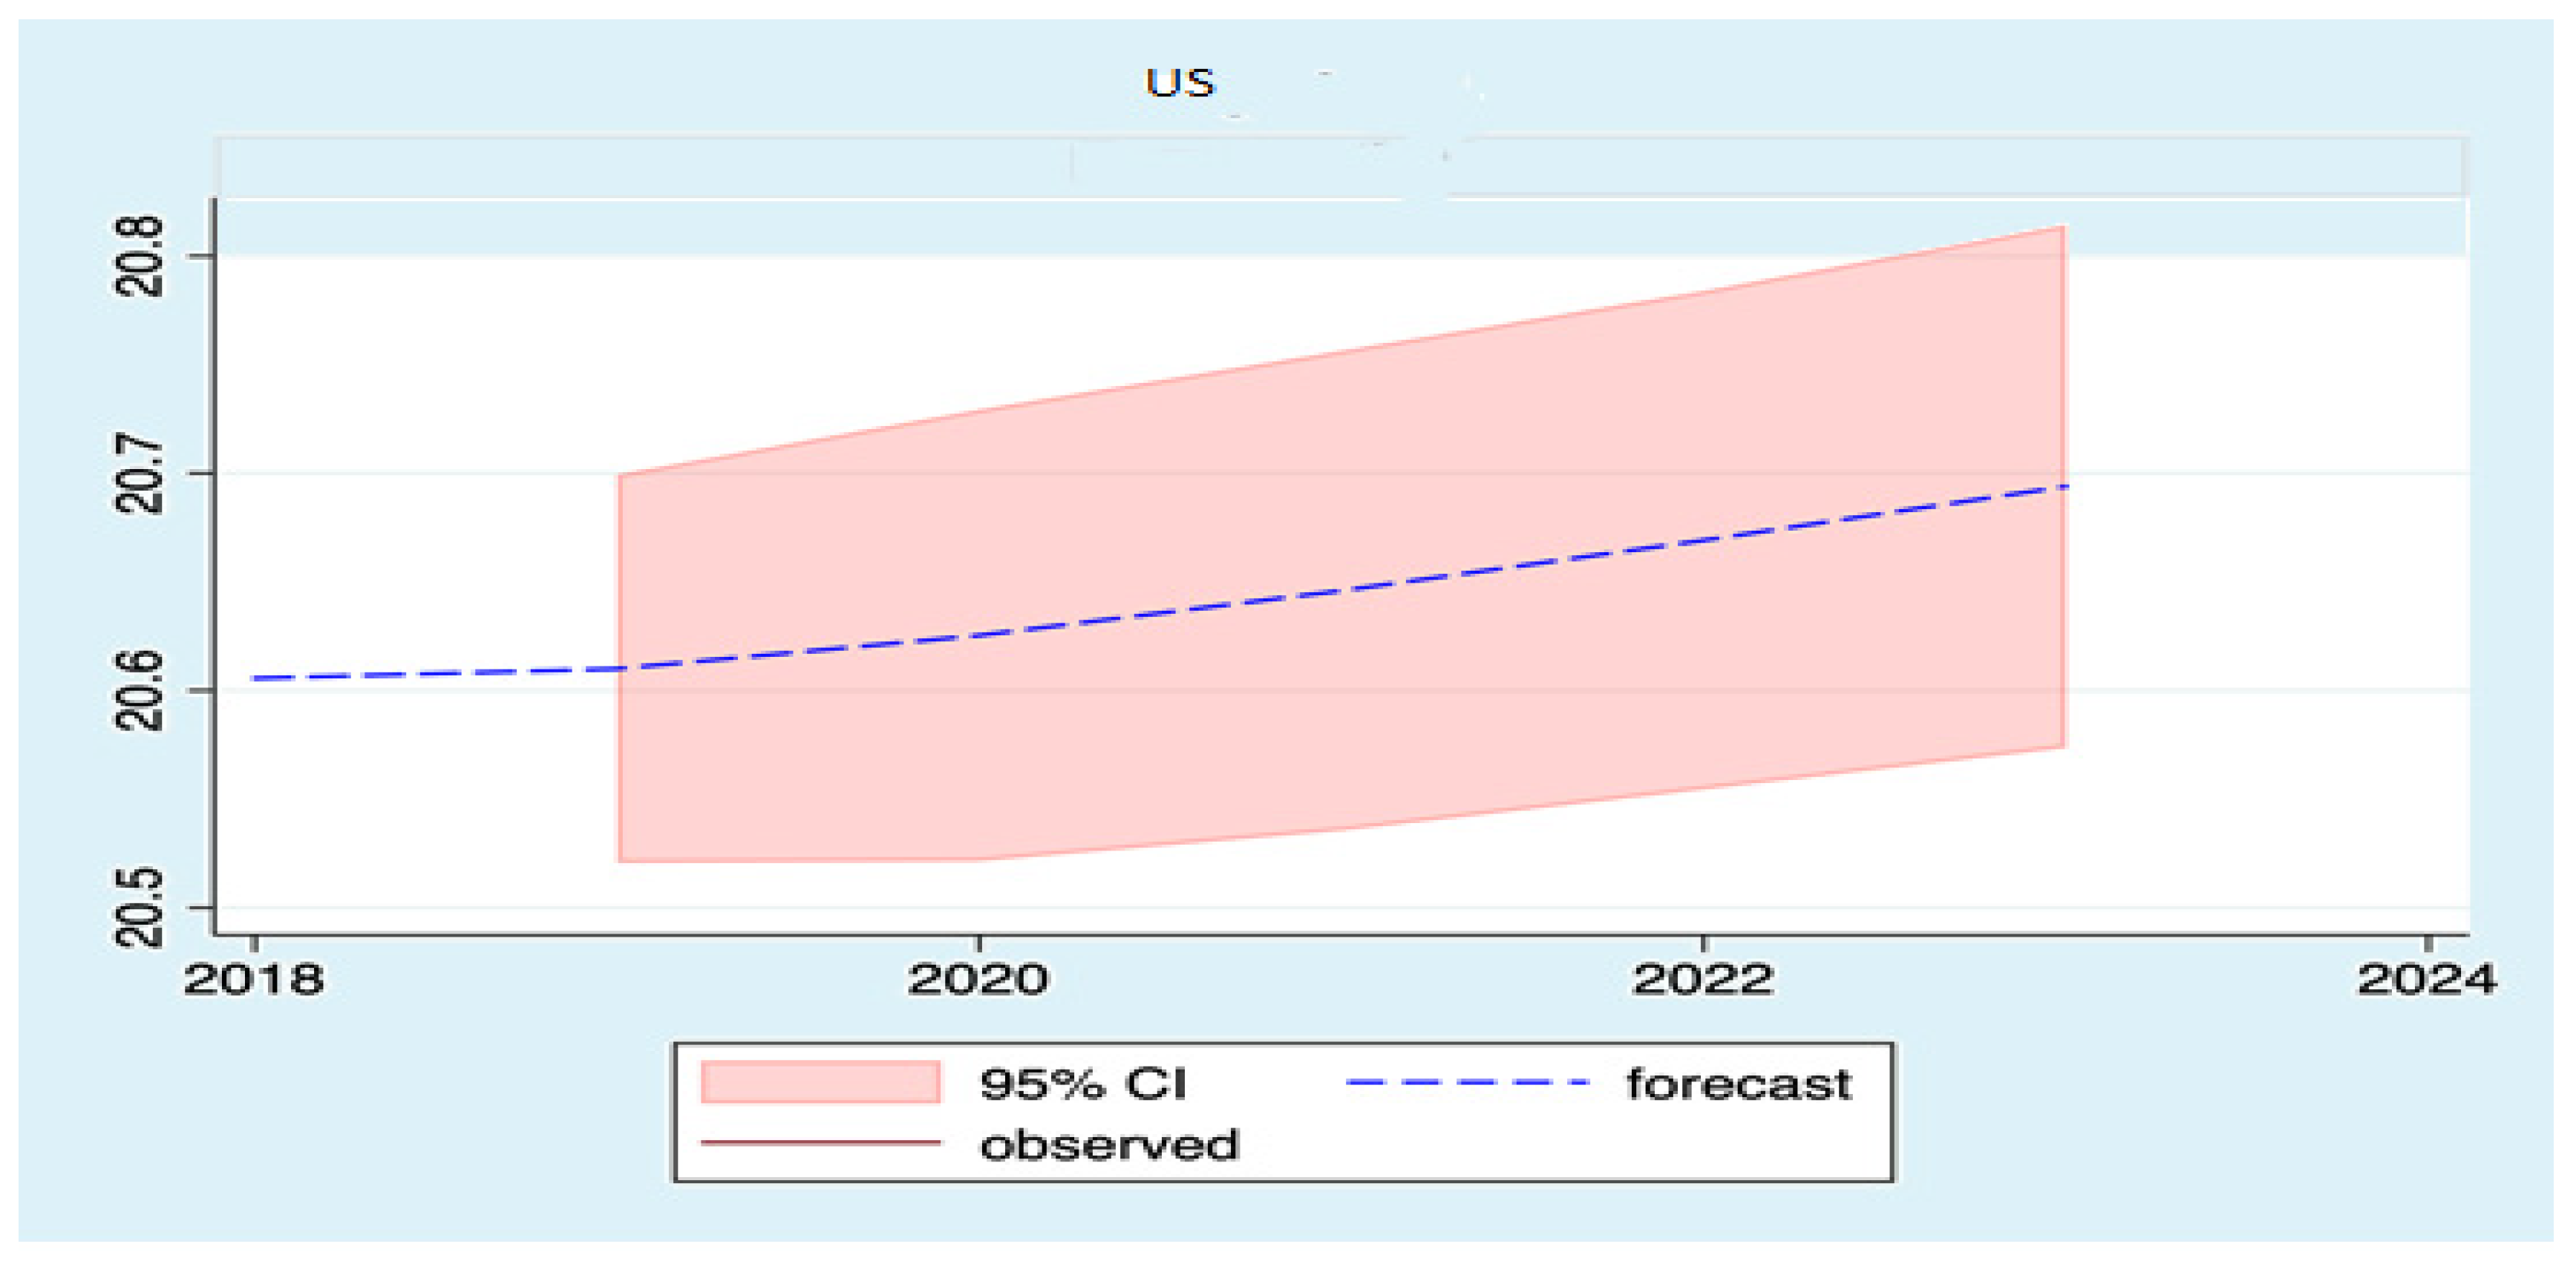
5.2. Forecasting Results

We use GDP and AC to create a VAR (1) model of ALR forecasting. Thus, the study forecasts COVID-19 shock on ALR until 2023 through the VAR model. Table 3 reveals that GDP and air cargo are the best predictors for ALR in these countries. It implies that economic growth and ALR are strongly correlated because of their contribution to employment, adding value to the economy, and enabling trade. The higher economic activity enables a conducive environment, higher income per capita, boosting tourism, and business [49], which turns into higher traveling and ALR. Air cargo is one of the primary sources of ALR, which declines because of the economic slowdown. Air cargo demand increases because of restrictions on the passenger’s flights, which are used for medical supplies and relief goods during a pandemic and minimizes the overall loss of the airlines [46].
Figure 1 illustrates the forecasting results. It shows that Australia’s national carrier revenues are devastated because of the collapse of global air travel. It is expected that the airline will receive smaller revenues in the next three years, which can make it hard to survive. The forecasting results are in line with the V-shaped recovery scenario in these countries, signifying that the virus will be contained by effective policies and the economic activities recover. The Brazilian airline industry depends on domestic demand, which declined by 52.7% because of the pandemic. However, the industry is in a better position because of COVID-19 shocks. The forecasting results show that recovery will be quick with substantial support from the government. The pandemic pushes the Canadian government to support the airline industry’s survival. The ARL will decline by 43.2%, risking 250,000 jobs and $25.4 billion to GDP, and the recovery scenario is V-shaped. The airline industry in China suffers a colossal financial impact because of COVID-19. However, the country has largely recovered from the epidemic, but the number of passengers are below the pre-COVID-19 level. According to the Civil Aviation Administration of China (CAAC) that passenger drops by 48.5% and 33.62-billion-yuan ALR in the first quarter of 2020. The forecasting result presents a V-shaped recovery from 2021 onward. Appendix A illustrates the robustness results.
Figure 2 displays the forecasting results for France, Germany, India, and Italy. The result shows that India is one of the largest aviation markets in the world, which has been severely affected by the pandemic outbreak. The passengers demand contracted by 49% in India, revenues declined by 11.6%, and recovery can be V-shaped. The COVID-19 shock suppresses the economic growth in France and GDP per capita drop by 6.73% in 2020. The travel ban sternly affects the tourism sector, which has a significant contribution to ALR. The pandemic will reduce the number of passengers by 80 million, a revenue loss of $14.3 billion, endangering 392,500 jobs, and $35.2 billion to GDP. The forecast results imply that the airline industry may recover and support a U-shaped scenario, in which the virus will be contained gradually and new cases will drop slowly.
In the case of Germany, the epidemic shock affects all sectors and shrinks the economic growth, and GDP per capita will decline by 6.55% in 2020 [50]. It leads to travel restrictions and will drop international and domestic travel during 2020. The declining trends will continue in 2021 because of the fear and economic downfall, which ultimately is reflected in the failure of ALR. It will reduce the number of passengers by 103 million, lost 17.9 billion dollars, endangered 483,600 jobs, and caused $34 billion in economic losses [4]. The forecasting values show that recovery will take the V-shaped course. The lifeline of the airlines depends on government supports, which ultimately offers the help of $10 billion to airlines in Germany. Similarly, Italy is the first country in Europe that is immersed in the pandemic outbreak and goes into lockdown, which leads to paralyzing economic activities. According to the IATA, the number of passengers dropped by 83 million, resulting in a loss of income of $11.5 billion and risking 310,400 jobs and $21.1 billion of the GDP. The forecast outcomes infer that the airline industry will recover, which supports a U-shaped scenario.
Figure 3 shows the forecasting results of Japan, the Netherlands, Russia, and South Korea. It shows that Japan receives a huge number of visitors from China, South Korea, Malaysia, Hong Kong, and Taiwan—most affected by the pandemic which has squeezed ARL [42,51]. In the case of the Netherlands, the finding of the forecasting shows the U-shaped scenario, implying that the effect of the pandemic will exist in the long term and normalcy will prevail until 2021. The spread of the COVID-19 has a negative impact on tourist flow, and the air travel market can experience one of its largest declines in Russia. Furthermore, rubble depreciation worsens the situation and may restrict international transportation. The forecasting results show that ALR will decrease until 2020–2021, and recovery can start afterwards. The results are in line with the prolonged U-shaped scenario, which suggests a slow gradual recovery that may take 12–18 months and a slow decrease in fresh cases with longer lockdown and border disclosure. Likewise, the South Korean airline industry witnessed a decreasing trend in passenger revenues by 29.5% because of a fall in demand, and the future outlook can be a gradual recovery and easing the travel restrictions [42].
Figure 4 exhibits the forecasting results for Spain, the UK, and the USA The pandemic reduces the economic activity, which has a significant impact on the consumer spending pattern in Spain and eventually contracts ALR. It is one of the biggest tourist destinations which contributes a substantial portion of 14.9% to the GDP. The COVID-19 shrinks’ tourism, which results in the decline of ALR because of the interconnection between transportation and tourism. According to IATA, 114 million fewer passengers will cost $15.5 billion in revenues, 901,300 jobs, and a $59.4 billion loss to the economy. The forecast results suggest that the airline industry may recover and support a U-shaped scenario; therefore, recovery is a slow, gradual decrease in new cases and deaths.
Because of the pandemic, the number of passengers landing in the UK has dropped sharply, resulting in a loss of $26.1 billion in income, putting nearly 661,200 jobs at risk, and approximately $50.3 billion loss to GDP. As compared to the same month in 2019, the passenger’s arrivals declined by 99%. International business travel has halted, which is an important economic driver, and fewer planes have resulted in reducing ALR. The figure shows ALR will decline in 2020 and recover afterwards, which supports the U-shaped scenario. The U.S. is the most affected country by COVID-19, and it forecasts the economic loss to be equivalent to $519 billion, which reflects an aggregate $1.2b trillion contraction in total economic effect. The country’s travel industry was heavily affected by COVID-19 and a decline of 81% in revenues. The findings of the forecasting express a V-shaped recovery.

6. Conclusions

This study examines COVID-19 impact on the airline industry and forecasts by using the VAR model. The results show that GDP and air cargo are the best predictors of the airline industry. Similarly, economic growth, economic uncertainty, and air cargo have positive effects on ALR. However, oil prices and exchange rates have a negative impact on ALR. Likewise, the forecasting outcomes reveal that ALR will decline until 2020–2021 and recover subsequently, and the result supports the V-shaped and U-shaped recovery scenarios in these countries. The study offers useful policy implications for the airline industry. First, the government can restore confidence building by providing economic stimulus packages that can encourage the airline to return to travel and ensure safety. Furthermore, softening the passenger rules regarding the refund of the unflown tickets, reducing taxes and reducing overflight taxes, decreases the costs and can lift the industry. Second, to ease the repayment conditions of cancelled flights, regulatory relief is also crucial to both the airline industry and the passengers. It can help to restore customer confidence and the industry to return to the skies. Similarly, mutual recognition of global standards is important for effective application, and any temporary measures taken by the government should have a clear exit strategy. Last, air traffic experiences a huge impediment due to quarantine measures, and the majority cannot travel if it is in place. Thus, the governments of these countries need an alternative coordinated strategy consistent with health measures to manage air travel in COVID-19 and make the industry functional and safe for traveling. This study can be extended in future to evaluate the impact of lockdown and restrictions on the airlines passenger numbers and revenues. Moreover, the study can be expanded to analyze various airlines and their overall management during the pandemic.

Author Contributions

Conceptualization, X.X. and K.K.; methodology, A.K.; software, A.K.; validation, C.-W.S., X.X. and K.K.; formal analysis, K.K.; investigation, C.-W.S.; resources, X.X.; data curation, A.K.; writing—original draft preparation, K.K.; writing—review and editing, X.X.; visualization, A.K.; supervision, C.-W.S. All authors have read and agreed to the published version of the manuscript.

Funding

This research is not supported by any funding.

Data Availability Statement

Not applicable.

Conflicts of Interest

The authors declare no conflict of interest.

Appendix A. AR Model Forecasting

We have used the autoregressive model to examine the validity of the time series forecasting of our main results. The results validate the robustness of the results. Figure A1, Figure A2, Figure A3, Figure A4, Figure A5, Figure A6, Figure A7, Figure A8, Figure A9, Figure A10, Figure A11, Figure A12, Figure A13, Figure A14 and Figure A15 illustrates the graphical representations of the robustness result of the AR model. It implies that ALR declines until 2020–2021 and recovers subsequently, and the result supports the V-shaped and U-shaped recovery scenarios in these countries. Thus, the results support the main findings of our study.
Figure A1. The AR model forecasting Australia.
Sustainability 13 11666 g0a1
Figure A2. The AR model forecasting for Brazil.
Sustainability 13 11666 g0a2
Figure A3. The AR model forecasting for Canada.
Sustainability 13 11666 g0a3
Figure A4. The AR model forecasting for China.
Sustainability 13 11666 g0a4
Figure A5. The AR model forecasting for Spain.
Sustainability 13 11666 g0a5
Figure A6. The AR model forecasting for France.
Sustainability 13 11666 g0a6
Figure A7. The AR model forecasting for Germany.
Sustainability 13 11666 g0a7
Figure A8. The AR model forecasting for India.
Sustainability 13 11666 g0a8
Figure A9. The AR model forecasting for Italy.
Sustainability 13 11666 g0a9
Figure A10. The AR model forecasting for Japan.
Sustainability 13 11666 g0a10
Figure A11. The AR model forecasting for South Korea.
Sustainability 13 11666 g0a11
Figure A12. The AR model forecasting for the Netherlands.
Sustainability 13 11666 g0a12
Figure A13. The AR model forecasting for Russia.
Sustainability 13 11666 g0a13
Figure A14. The AR model forecasting for UK.
Sustainability 13 11666 g0a14
Figure A15. The AR model forecasting for USA.
Sustainability 13 11666 g0a15

References

  1. McKibbin, W.J.; Fernando, R. The Global Macroeconomic Impacts of COVID-19: Seven Scenarios; CAMA Working Paper No. 19/2020; Australian National University and Centre of Excellence in Population Ageing Research (CEPAR): Canberra, Australia, 2020. [Google Scholar]
  2. Khan, K.; Su, C.W.; Umar, M.; Yue, X.G. Do crude oil price bubbles occur? Resour. Policy 2021, 71, 101936. [Google Scholar] [CrossRef]
  3. Sun, X.; Wandelt, S.; Zhang, A. How did COVID-19 impact air transportation? A first peek through the lens of complex networks. J. Air Transp. Manag. 2020, 89, 101928. [Google Scholar] [CrossRef]
  4. IATA. COVID-19. Fourth Impact Assessment. International Air Transport Association. 2020. Available online: https://www.iata.org/en/iata-repository/publications/economic-reports/covid-fourth-impact-assessment/ (accessed on 14 April 2020).
  5. ICAO. Effects of Novel Coronavirus (Covid-19) on Civil Aviation: Economic Impact Analysis. Available online: https://www.icao.int/sustainability/Documents/COVID-19/ICAO%20Coronavirus%202020%2004%2008%20Econ%20Impact.pdf (accessed on 15 April 2020).
  6. Bourguignon, F.; Darpeix, P.E. Air Traffic and Economic Growth: The Case of Developing Countries; Working Paper N° 2016–09; halshs-01305412; Paris-Jordan Science Économiques: Paris, France, 2016. [Google Scholar]
  7. Khurshid, A.; Khan, K. How COVID-19 shock will drive the economy and climate? A data-driven approach to model and forecast. Environ. Sci. Pollut. Res. 2021, 28, 2948–2958. [Google Scholar] [CrossRef]
  8. Dodson, M.; Defavari, G.; de Carvalho, V. Quality: The third element of earned value management. Procedia Comput. Sci. 2015, 64, 932–939. [Google Scholar] [CrossRef] [Green Version]
  9. Cortez, L.A.; Nigro, F.E.; Nogueira, L.A.; Nassar, A.M.; Cantarella, H.; Moraes, M.A.; Baldassin Junior, R. Perspectives for sustainable aviation biofuels in Brazil. Int. J. Aerosp. Eng. 2015, 2015, 264898. [Google Scholar] [CrossRef]
  10. Lutte, R.K.; Bartle, J.R. Sustainability in the air: The modernization of international air navigation. Public Work. Manag. Policy 2017, 22, 322–334. [Google Scholar] [CrossRef]
  11. Bonser, M.P. Global aviation system: Towards sustainable development. Int. J. Aviat. Aeronaut. Aerosp. 2020, 6, 8. [Google Scholar] [CrossRef]
  12. López Pascual, J.; Meléndez Rodríguez, J.C.; Cruz Rambaud, S. The Enhanced-Earned Value Management (E-EVM) model: A proposal for the aerospace industry. Symmetry 2021, 13, 232. [Google Scholar] [CrossRef]
  13. Albers, S.; Rundshagen, V. European airlines’ strategic responses to the COVID-19 pandemic (January–May 2020). J. Air Transp. Manag. 2020, 87, 101863. [Google Scholar] [CrossRef]
  14. Gössling, S. Risks, resilience, and pathways to sustainable aviation: A COVID-19 perspective. J. Air Transp. Manag. 2020, 89, 101933. [Google Scholar] [CrossRef]
  15. Nižetić, S. Impact of coronavirus (COVID-19) pandemic on air transport mobility, energy, and environment: A case study. Int. J. Energy Res. 2020, 44, 10953–10961. [Google Scholar] [CrossRef]
  16. Agrawal, A. Sustainability of airlines in India with Covid-19: Challenges ahead and possible way-outs. J. Revenue Pricing Manag. 2020, 20, 457–472. [Google Scholar] [CrossRef]
  17. Monmousseau, P.; Marzuoli, A.; Feron, E.; Delahaye, D. Impact of Covid-19 on passengers and airlines from passenger measurements: Managing customer satisfaction while putting the U.S. Air Transportation System to sleep. Transp. Res. Interdiscip. Perspect. 2020, 7, 100179. [Google Scholar] [CrossRef] [PubMed]
  18. Lau, H.; Khosrawipour, V.; Kocbach, P.; Mikolajczyk, A.; Ichii, H.; Zacharksi, M.; Khosrawipour, T. The association between international and domestic air traffic and the coronavirus (COVID-19) outbreak. J. Microbiol. Immunol. Infect. 2020, 53, 467–472. [Google Scholar] [CrossRef] [PubMed]
  19. Budd, L.; Ison, S.; Adrienne, N. European airline response to the COVID-19 pandemic–Contraction, consolidation and future considerations for airline business and management. Res. Transp. Bus. Manag. 2020, 37, 100578. [Google Scholar] [CrossRef]
  20. Rahman, N.A.A.; Rahim, S.A.; Ahmad, M.F.; Hafizuddin-Syah, B.A.M. Exploring COVID-19 pandemic: Its impact to global aviation industry and the key strategy. Int. J. Adv. Sci. Technol. 2020, 29, 1829–1836. [Google Scholar]
  21. Li, S.; Blake, A.; Cooper, C. China’s tourism in a global financial crisis: A computable general equilibrium approach. Curr. Issues Tour. 2010, 13, 435–453. [Google Scholar] [CrossRef]
  22. Serrano, F.; Kazda, A. The future of airport post COVID-19. J. Air Transp. Manag. 2020, 89, 101900. [Google Scholar] [CrossRef]
  23. Brauer, J.; Dunne, J.P. Terrorism, war, and global air traffic. Econ. Peace Secur. J. 2020, 7, 22–29. [Google Scholar] [CrossRef]
  24. Suau-Sanchez, P.; Voltes-Dorta, A.; Cugueró-Escofet, N. An early assessment of the impact of COVID-19 on air transport: Just another crisis or the end of aviation as we know it? J. Transp. Geogr. 2020, 86, 102749. [Google Scholar] [CrossRef]
  25. Bal, A.B.; Varol, Z. How COVID-19 Will Reshape Airline Industry: Fewer Players, Major Economic Downfall before Recovery. Daily Sabah, Istanbul. 2020. Available online: https://www.dailysabah.com/business/transportation/how-covid-19-will-reshape-airline-industry-fewer-players-major-economic-downfall-before-recovery (accessed on 22 May 2020).
  26. BCG, 2020. The Post-COVID-19 Flight Plan for Airlines. Boston Consulting Group. Available online: https://www.bcg.com/publications/2020/post-covid-airline-industry-strategy (accessed on 31 March 2020).
  27. Molenaar, M.; Bosch, F.; Guggenheim, J.; Jhunjhunwala, P.; Loh, H.H.; Wade, B. The Post-COVID-19 Flight Plan for Airlines. 2020. Available online: https://www.bcg.com/publications/2020/post-covid-airline-industry-strategy.aspx (accessed on 31 March 2020).
  28. Pecican, E.S. Forecasting Based on the Open VAR Model. Rom. J. Econ. Forecast. 2010, 13, 59–69. [Google Scholar]
  29. Sims, C.A. Macroeconomics and reality. Econometrica 1980, 48, 1–48. [Google Scholar] [CrossRef] [Green Version]
  30. Baltaci, N.; Sekmen, O.; Akbulut, G. The relationship between air transport and economic growth in turkey: Cross-regional panel data analysis approach. J. Econ. Behav. Stud. 2015, 7, 89–100. [Google Scholar] [CrossRef] [Green Version]
  31. İnan, T.T. The Effects of the Airline Business Models to The Airline Industry. J. Aviat. 2018, 2, 119–124. [Google Scholar]
  32. Khan, K.; Su, C.W.; Rehman, A.U. Do multiple bubbles exist in coal price? Resour. Policy 2021, 73, 102232. [Google Scholar] [CrossRef]
  33. Su, C.W.; Khan, K.; Tao, R.; Nicoleta-Claudia, M. Does geopolitical risk strengthen or depress oil prices and financial liquidity? Evidence from Saudi Arabia. Energy 2019, 187, 116003. [Google Scholar] [CrossRef]
  34. Khan, K.; Su, C.W.; Tao, R. Does Oil Prices Cause Financial Liquidity Crunch? Perspective from Geopolitical Risk. Def. Peace Econ. 2021, 32, 312–324. [Google Scholar] [CrossRef]
  35. Clark, D.E.; McGibany, J.M.; Myers, A. The Effects of 9/11 on the Airline Travel Industry. In The Impact of 9/11 on Business and Economics; Palgrave Macmillan: New York, NY, USA, 2009; pp. 75–86. [Google Scholar]
  36. Su, C.W.; Khan, K.; Umar, M.; Zhang, W. Does renewable energy redefine geopolitical risks? Energy Policy 2021, 158, 112566. [Google Scholar] [CrossRef]
  37. Drakos, K.; Kutan, A.M. Regional effects of terrorism on tourism in three Mediterranean countries. J. Confl. Resolut. 2003, 47, 621–641. [Google Scholar] [CrossRef]
  38. Chen, C.M.; Hua, K.T.; Chyou, J.T.; Tai, C.C. The effect of economic policy uncertainty on hotel room demand-evidence from Mainland Chinese and Japanese tourists in Taiwan. Curr. Issues Tour. 2020, 23, 1444–1448. [Google Scholar] [CrossRef]
  39. Shahbaz, M.; Ferrer, R.; Shahzad, S.J.H.; Haouas, I. Is the tourism–economic growth nexus time-varying? Bootstrap rolling-window causality analysis for the top 10 tourist destinations. Appl. Econ. 2018, 50, 2677–2697. [Google Scholar] [CrossRef]
  40. Ghosh, S. Uncertainty, economic growth its impact on tourism, some country experiences. Asia Pac. J. Tour. Res. 2019, 24, 83–107. [Google Scholar] [CrossRef]
  41. Khan, K.; Su, C.W.; Xiao, Y.D.; Zhu, H.; Zhang, X. Trends in tourism under economic uncertainty. Tour. Econ. 2020, 1–18. [Google Scholar] [CrossRef]
  42. Su, C.W.; Qin, M.; Zhang, X.L.; Tao, R.; Umar, M. Should Bitcoin be held under the US partisan conflict? Technol. Econ. Dev. Econ. 2021, 27, 511–529. [Google Scholar] [CrossRef]
  43. Khan, K.; Köseoğlu, S.D. Is palladium price in bubble? Resour. Policy 2020, 68, 101780. [Google Scholar] [CrossRef]
  44. Su, C.W.; Yuan, X.; Tao, R.; Umar, M. Can new energy vehicles help to achieve carbon neutrality targets? J. Environ. Manag. 2021, 297, 113348. [Google Scholar] [CrossRef]
  45. Morrison, J.; Bonnefoy, P.; Hansman, R.J.; Sgouridis, S. Investigation of the Impacts of Effective Fuel Cost Increase on the us Air Transportation Network and Fleet. In 10th AIAA Aviation Technology, Integration, and Operations (ATIO) Conference; American Institute of Aeronautics and Astronautics: Reston, VA, USA, 2010; p. 9202. [Google Scholar]
  46. Brett, D. Cargo the Bright Spot for Airlines as Revenues Expected to Soar. Air Cargo News. 2020. Available online: https://www.aircargonews.net/airlines/cargo-the-bright-spot-for-airlines-as-revenues-expected-to-soar/ (accessed on 10 June 2020).
  47. Seсilmis, N.; Koс, A. Economic factors affecting aviation demand: Practice of EU countries. Актуальні Прoблеми Екoнoміки 2016, 5, 412–420. [Google Scholar]
  48. Su, C.W.; Cai, X.Y.; Qin, M.; Tao, R.; Umar, M. Can bank credit withstand falling house price in China? Int. Rev. Econ. Financ. 2021, 71, 257–267. [Google Scholar] [CrossRef]
  49. Su, C.W.; Song, Y.; Umar, M. Financial aspects of marine economic growth: From the perspective of coastal provinces and regions in China. Ocean. Coast. Manag. 2021, 204, 105550. [Google Scholar] [CrossRef]
  50. IMF. World Economic Forum. Chapter 1. The Great Lockdown. International Monetary Fund. 2020. Available online: https://www.imf.org/en/Publications/WEO/Issues/2020/04/14/weo-April-2020 (accessed on 25 April 2020).
  51. Duddu, P. Coronavirus in Japan: COVID-19 Updates, Measures and Impact. 2020. Available online: https://www.pharmaceutical-technology.com/features/countries-with-coronavirus-japan-covid-19-impact-economy-travel-trade/ (accessed on 15 March 2020).
Figure 1. Graphic trends of forecasting values. Note: X-axis indicates the period of forecasting, Y-axis denotes forecasting values, and 95% confidence region.
Sustainability 13 11666 g001
Figure 2. Graphic trends of forecasting values.
Sustainability 13 11666 g002
Figure 3. Graphic trends of forecasting values.
Sustainability 13 11666 g003
Figure 4. Graphic trends of forecasting values.
Sustainability 13 11666 g004
Table 1. Summary statistics.
CountryDescriptive
Statistics
MeanStd. DevSkewnessKurtosisJ-B
AUSALR52.88115.4950.0221.5691.791
GDP1.8261.686−1.6776.74622.128 ***
AC2112.445452.3580.4122.1051.294
BRAALR63.04429.6210.1531.2782.677
GDP2.2382.830−0.2402.7760.246
AC1553.015158.8540.2712.2050.810
CANALR55.95421.4000.1091.8991.102
GDP2.7721.992−0.7244.7784.601
AC1892.555494.6691.6785.92117.319 ***
CHNALR244.713191.001611.44053.234172.278
GDP9.0052.0350.9463.3803.255
AC12,119.4207104.1530.2641.8071.490
FRAALR58.0497.928−0.3641.9181.488
GDP1.611.465−1.0995.3649.117 ***
AC5088.548775.740.5422.2141.57
GERALR92.02423.321−0.7061.9182.77
GDP1.4622.097−1.8237.58630.035 ***
AC7582.996828.4781.3545.80313.295 ***
INDALR59.20143.1430.9293.0363.019
GDP6.7151.704−0.8032.3892.585
AC1254.778672.2480.5032.1691.489
ITAALR31.2643.6610.421.7941.89
GDP0.5231.96−1.4065.16611.019 ***
AC1218.964348.377−0.6572.5561.685
JPNALR106.0419.6400.2023.1150.155
GDP0.7801.896−1.4836.76020.068
AC8435.106990.2680.5403.4501.199
KORALR45.14218.3551.2913.2205.875
GDP3.9433.265−0.4325.4245.792 ***
AC9822.8082394.4470.4392.1161.358
NDLALR29.0997.3010.522.4921.171
GDP1.8662.01−0.8354.0313.372
AC5049.214789.4890.261.8771.34
RUSALR44.50826.0680.6892.1632.273
GDP3.4674.514−0.9343.3963.191
AC2905.6812018.0680.6522.1562.109
SPNALR51.29612.0450.6183.2041.373
GDP2.0872.514−1.0252.9893.675
AC1032.287158.5910.0812.170.626
UKALR103.19529.0680.4352.3980.98
GDP2.0291.695−2.57910.17768.357 ***
AC5715.561602.7−0.5612.0541.886
Notes: ALR: shows airlines revenues, GDP indicates economic growth; AC represents air cargo. *** denote significance at the 1% levels.
Table 2. VAR model.
Table 2. VAR model.
(1)(2)(3)(4)(5)(6)
ALRALRALRALRALRALR
GDP0.267 ***0.269 ***
(0.439)(0.403)
EPU626.7 **621.8 **115.8 ***106.8 **139.8 ***138.2 ***
(193.3)(192.4)(319.1)(306.9)(285.9)(285.1)
EX−868.0283.8−735.3 ***−272.4−693.0 ***−839.1
(215.4)(454.4)(175.1)(396.3)(204.5)(415.0)
OP−187.8 **−174.7 *−930.9−108.2−209.5−885.1
(605.7)(651.9)(110.0)(106.4)(972.4)(998.5)
AC575.6 ***517.1 **180.7 ***177.9 ***181.6 ***179.2 ***
(145.2)(157.5)(298.7)(384.5)(298.6)(364.7)
TA−451.3 **−587.0 *−491.8−695.0−498.3−552.3
(286.8)(305.3)(348.4)(305.3)(580.2)(552.8)
Cons320.9255.5−260.2−336.1−227.0−274.2
(160.1)(133.5)(166.2)(216.2)(186.2)(207.9)
Standard errors in parentheses. * p < 0.05, ** p < 0.01, and *** p < 0.001.
Table 3. R2 with each predictor.
(1)(2)(3)(4)(5)(6)
ALRALRALRALRALRALR
EPU2.4 *
(8.201)
GDP 0.331 ***
(5.08)
TA 4.659 *
(1.662)
OP 4.729 **
(15.69)
AC 1.84 ***
(3.509)
EX 1.895
(6.712)
FEYesYesYesYesYesYes
ClusteredYesYesYesYesYesYes
R20.0890.8610.4030.0900.7190.001
Standard errors in parentheses. * p < 0.05, ** p < 0.01, and *** p < 0.001.
Publisher’s Note: MDPI stays neutral with regard to jurisdictional claims in published maps and institutional affiliations.

