
Influence of Disinfectants on Airport Conveyor Belts


Abstract
:1. Introduction
2. Materials and Methods
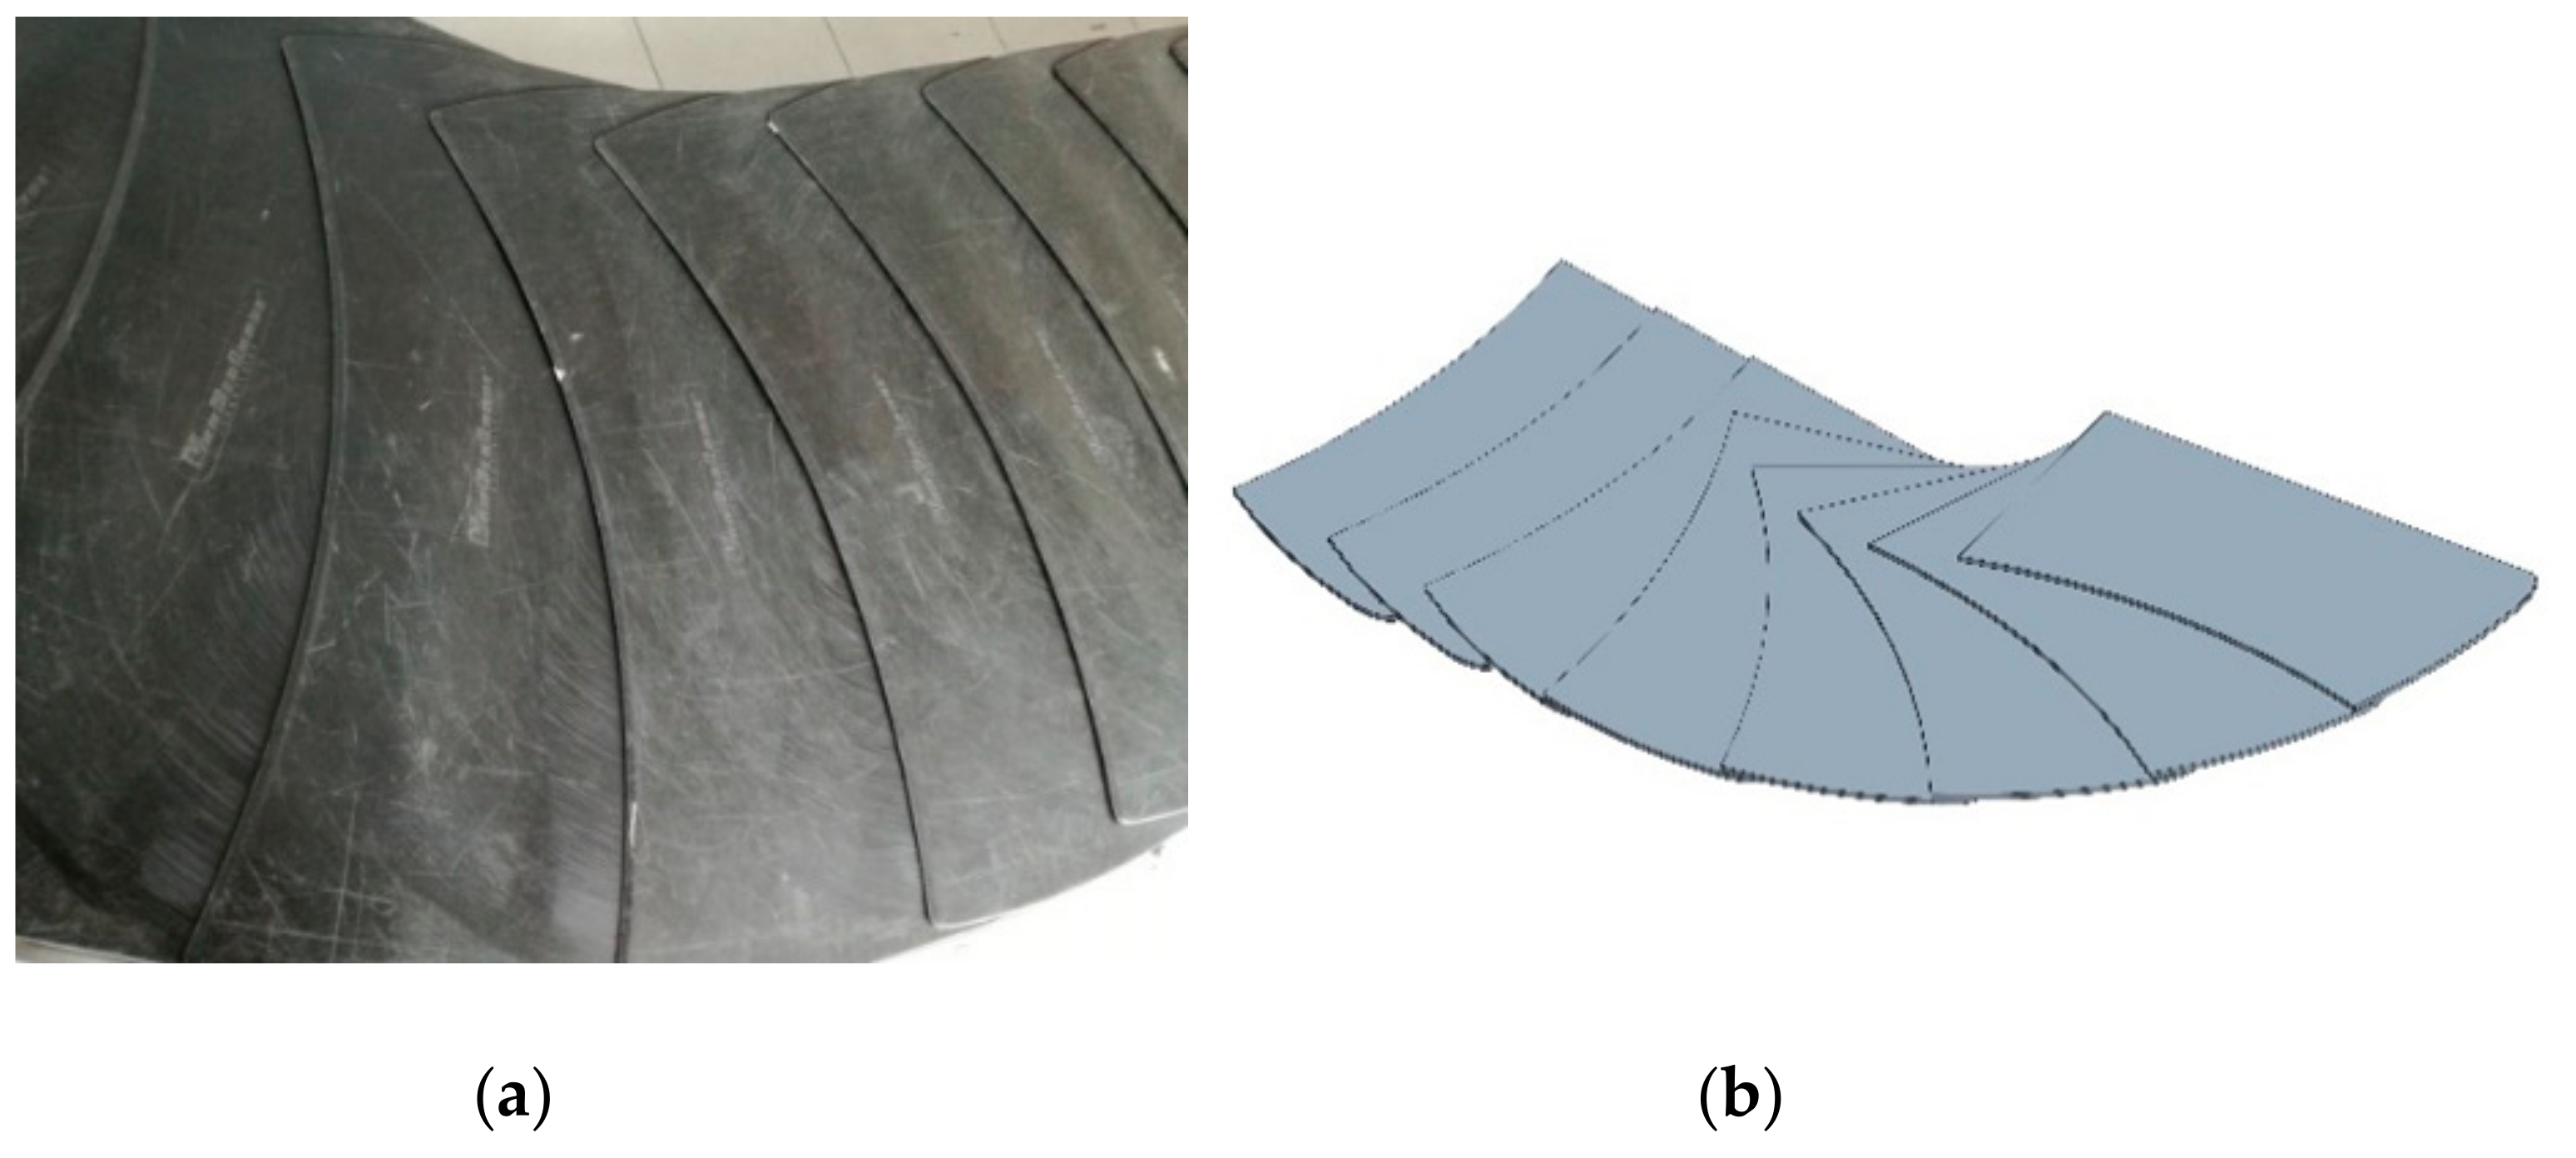
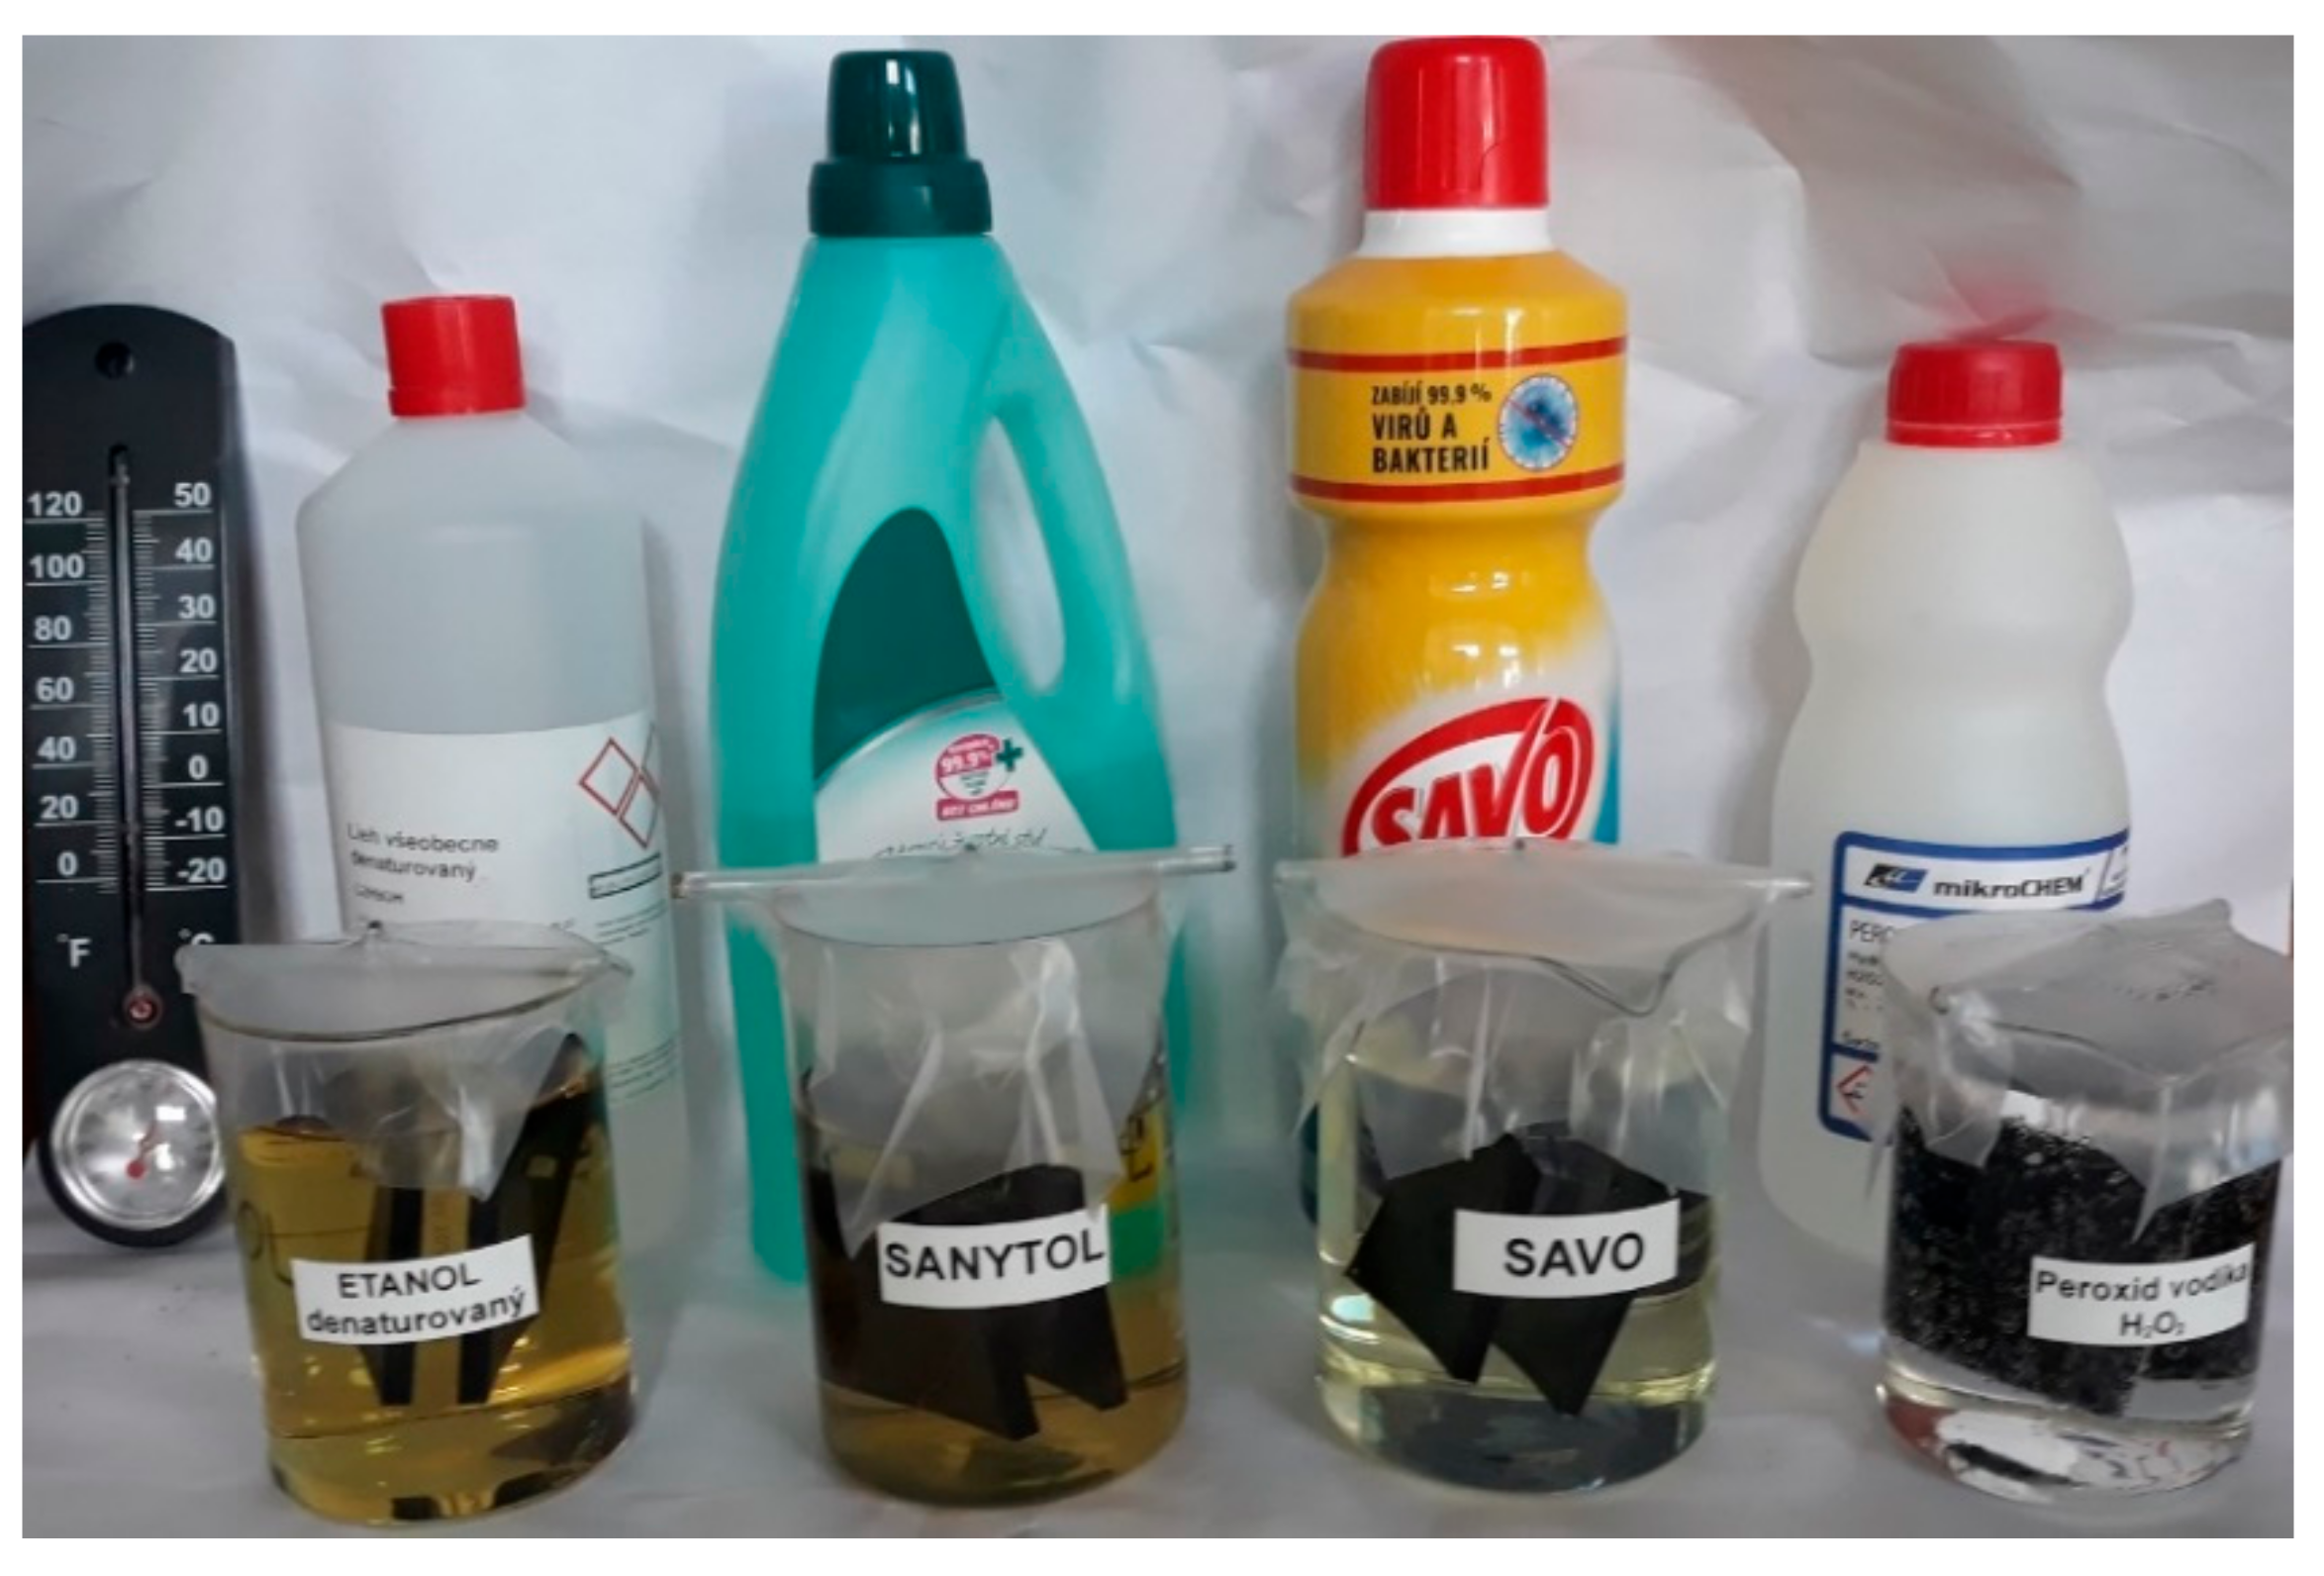
2.1. Materials
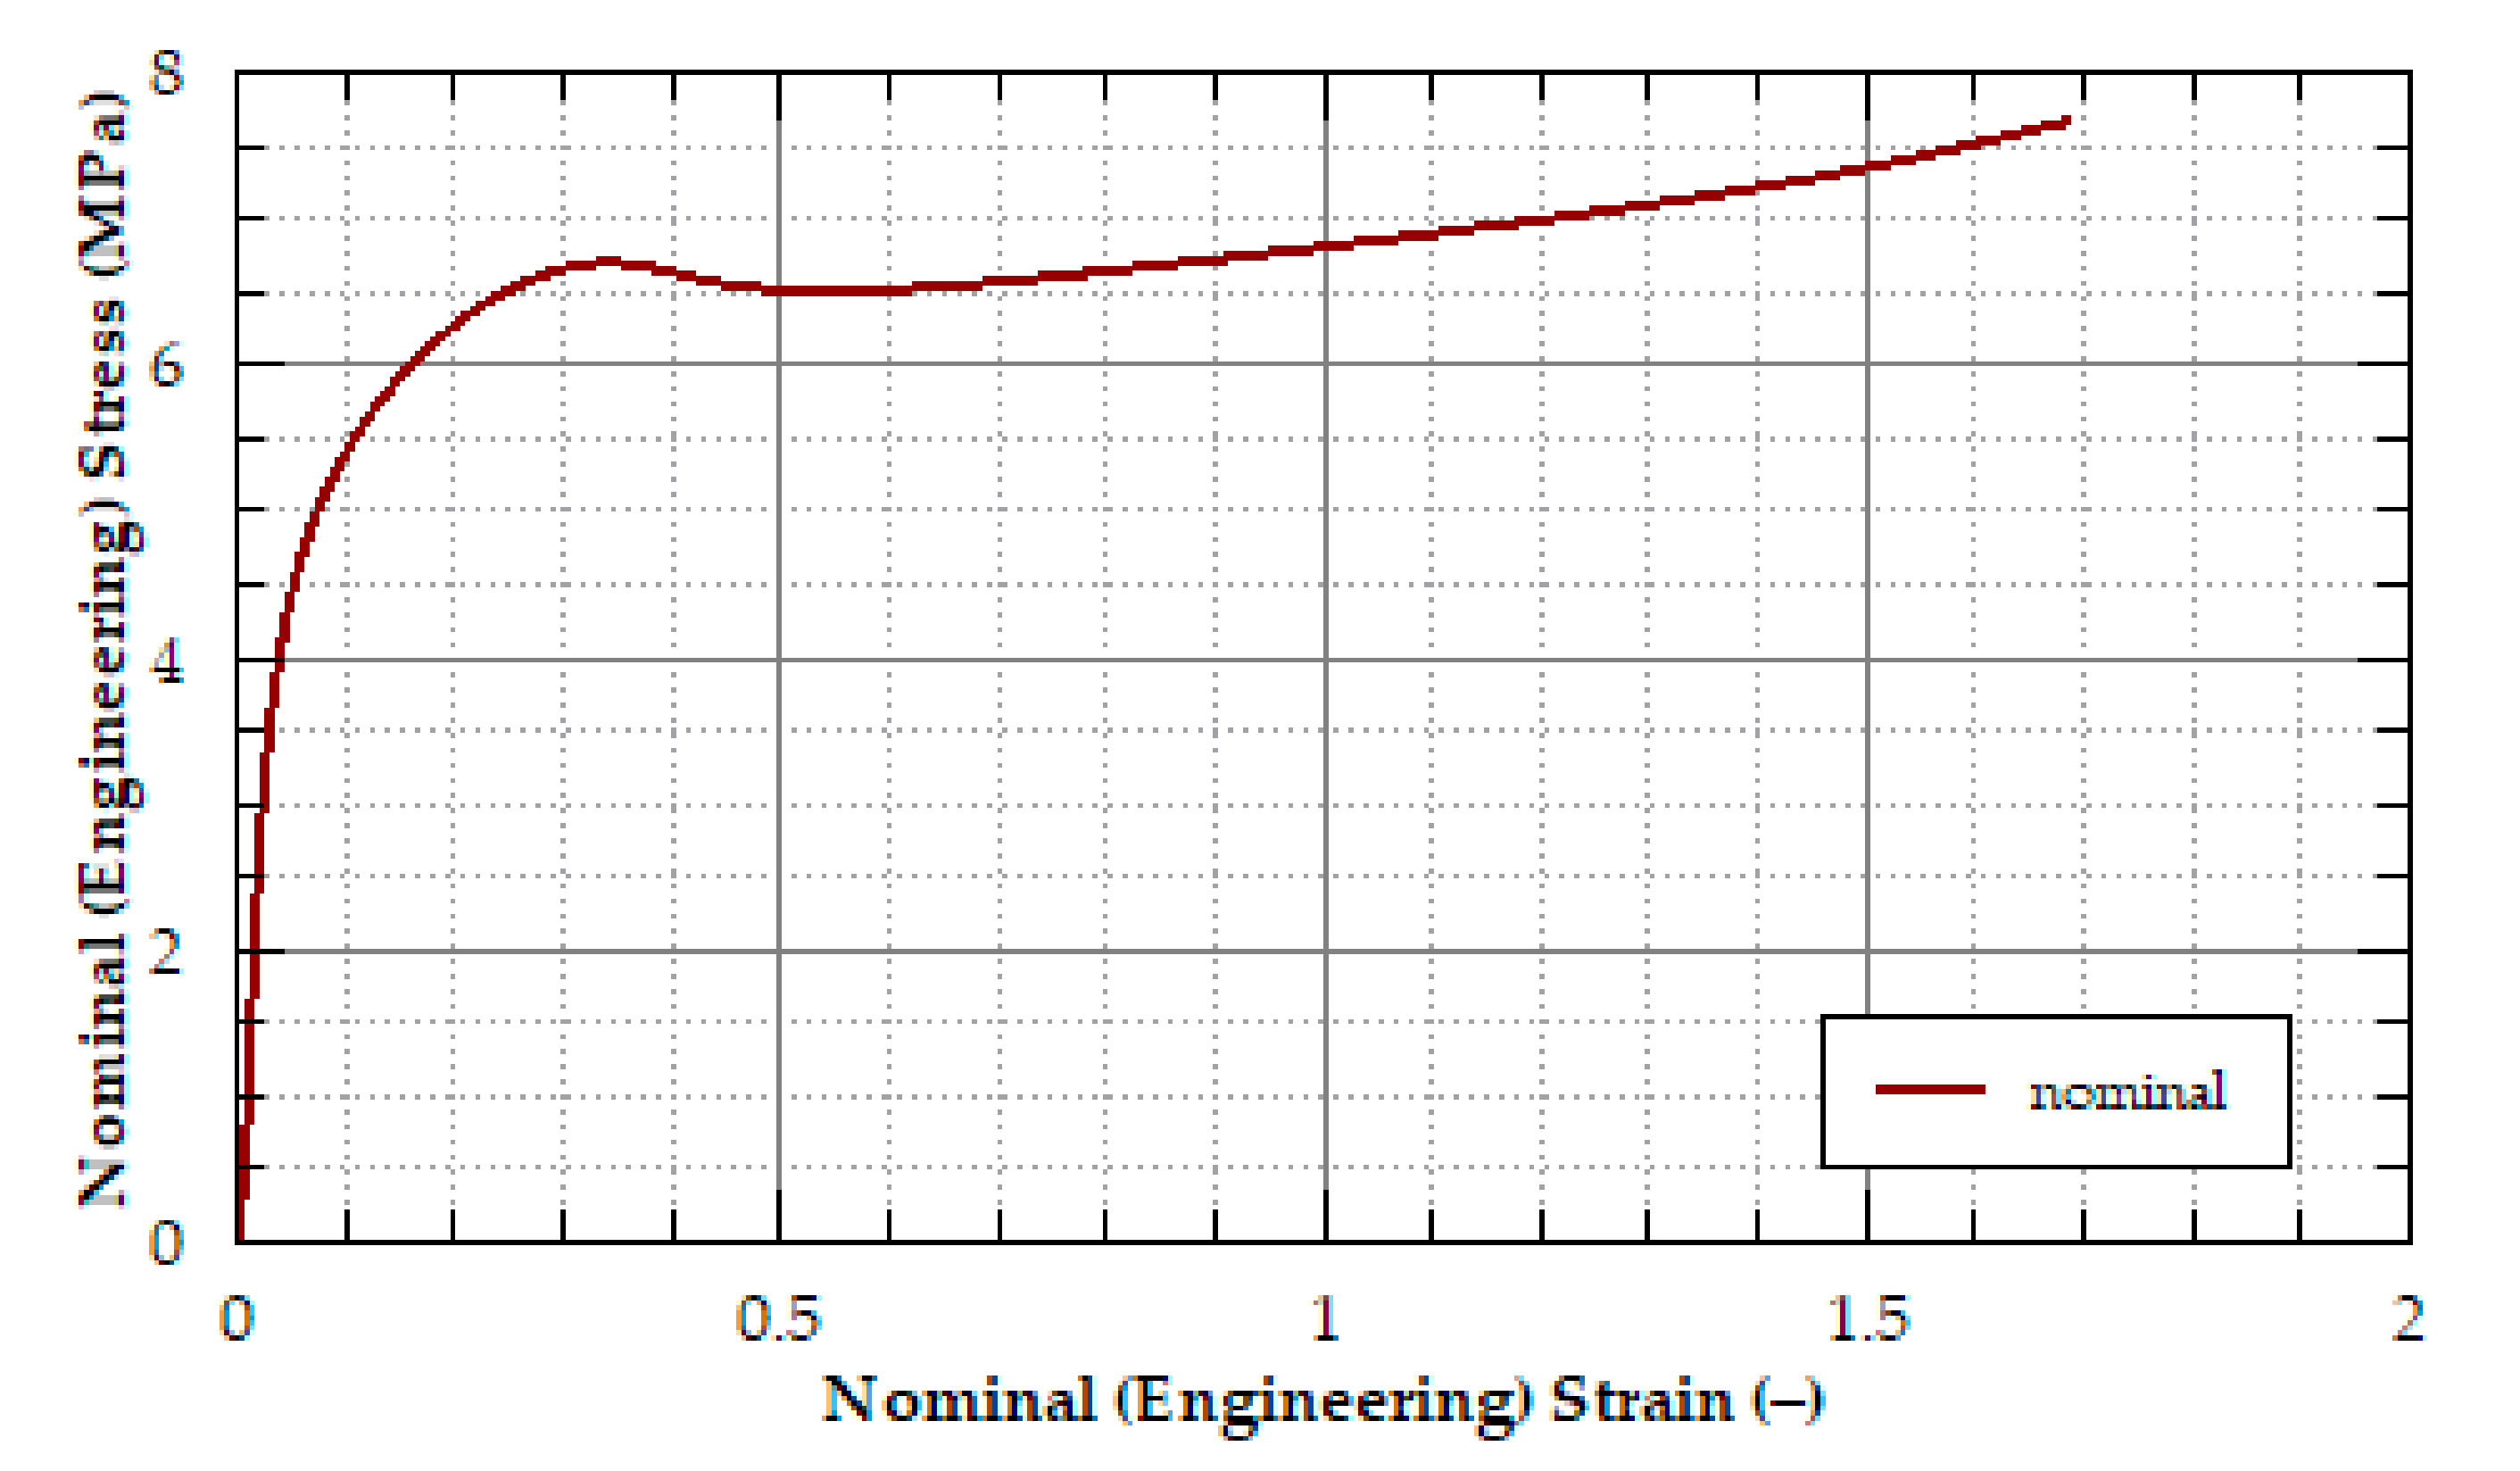
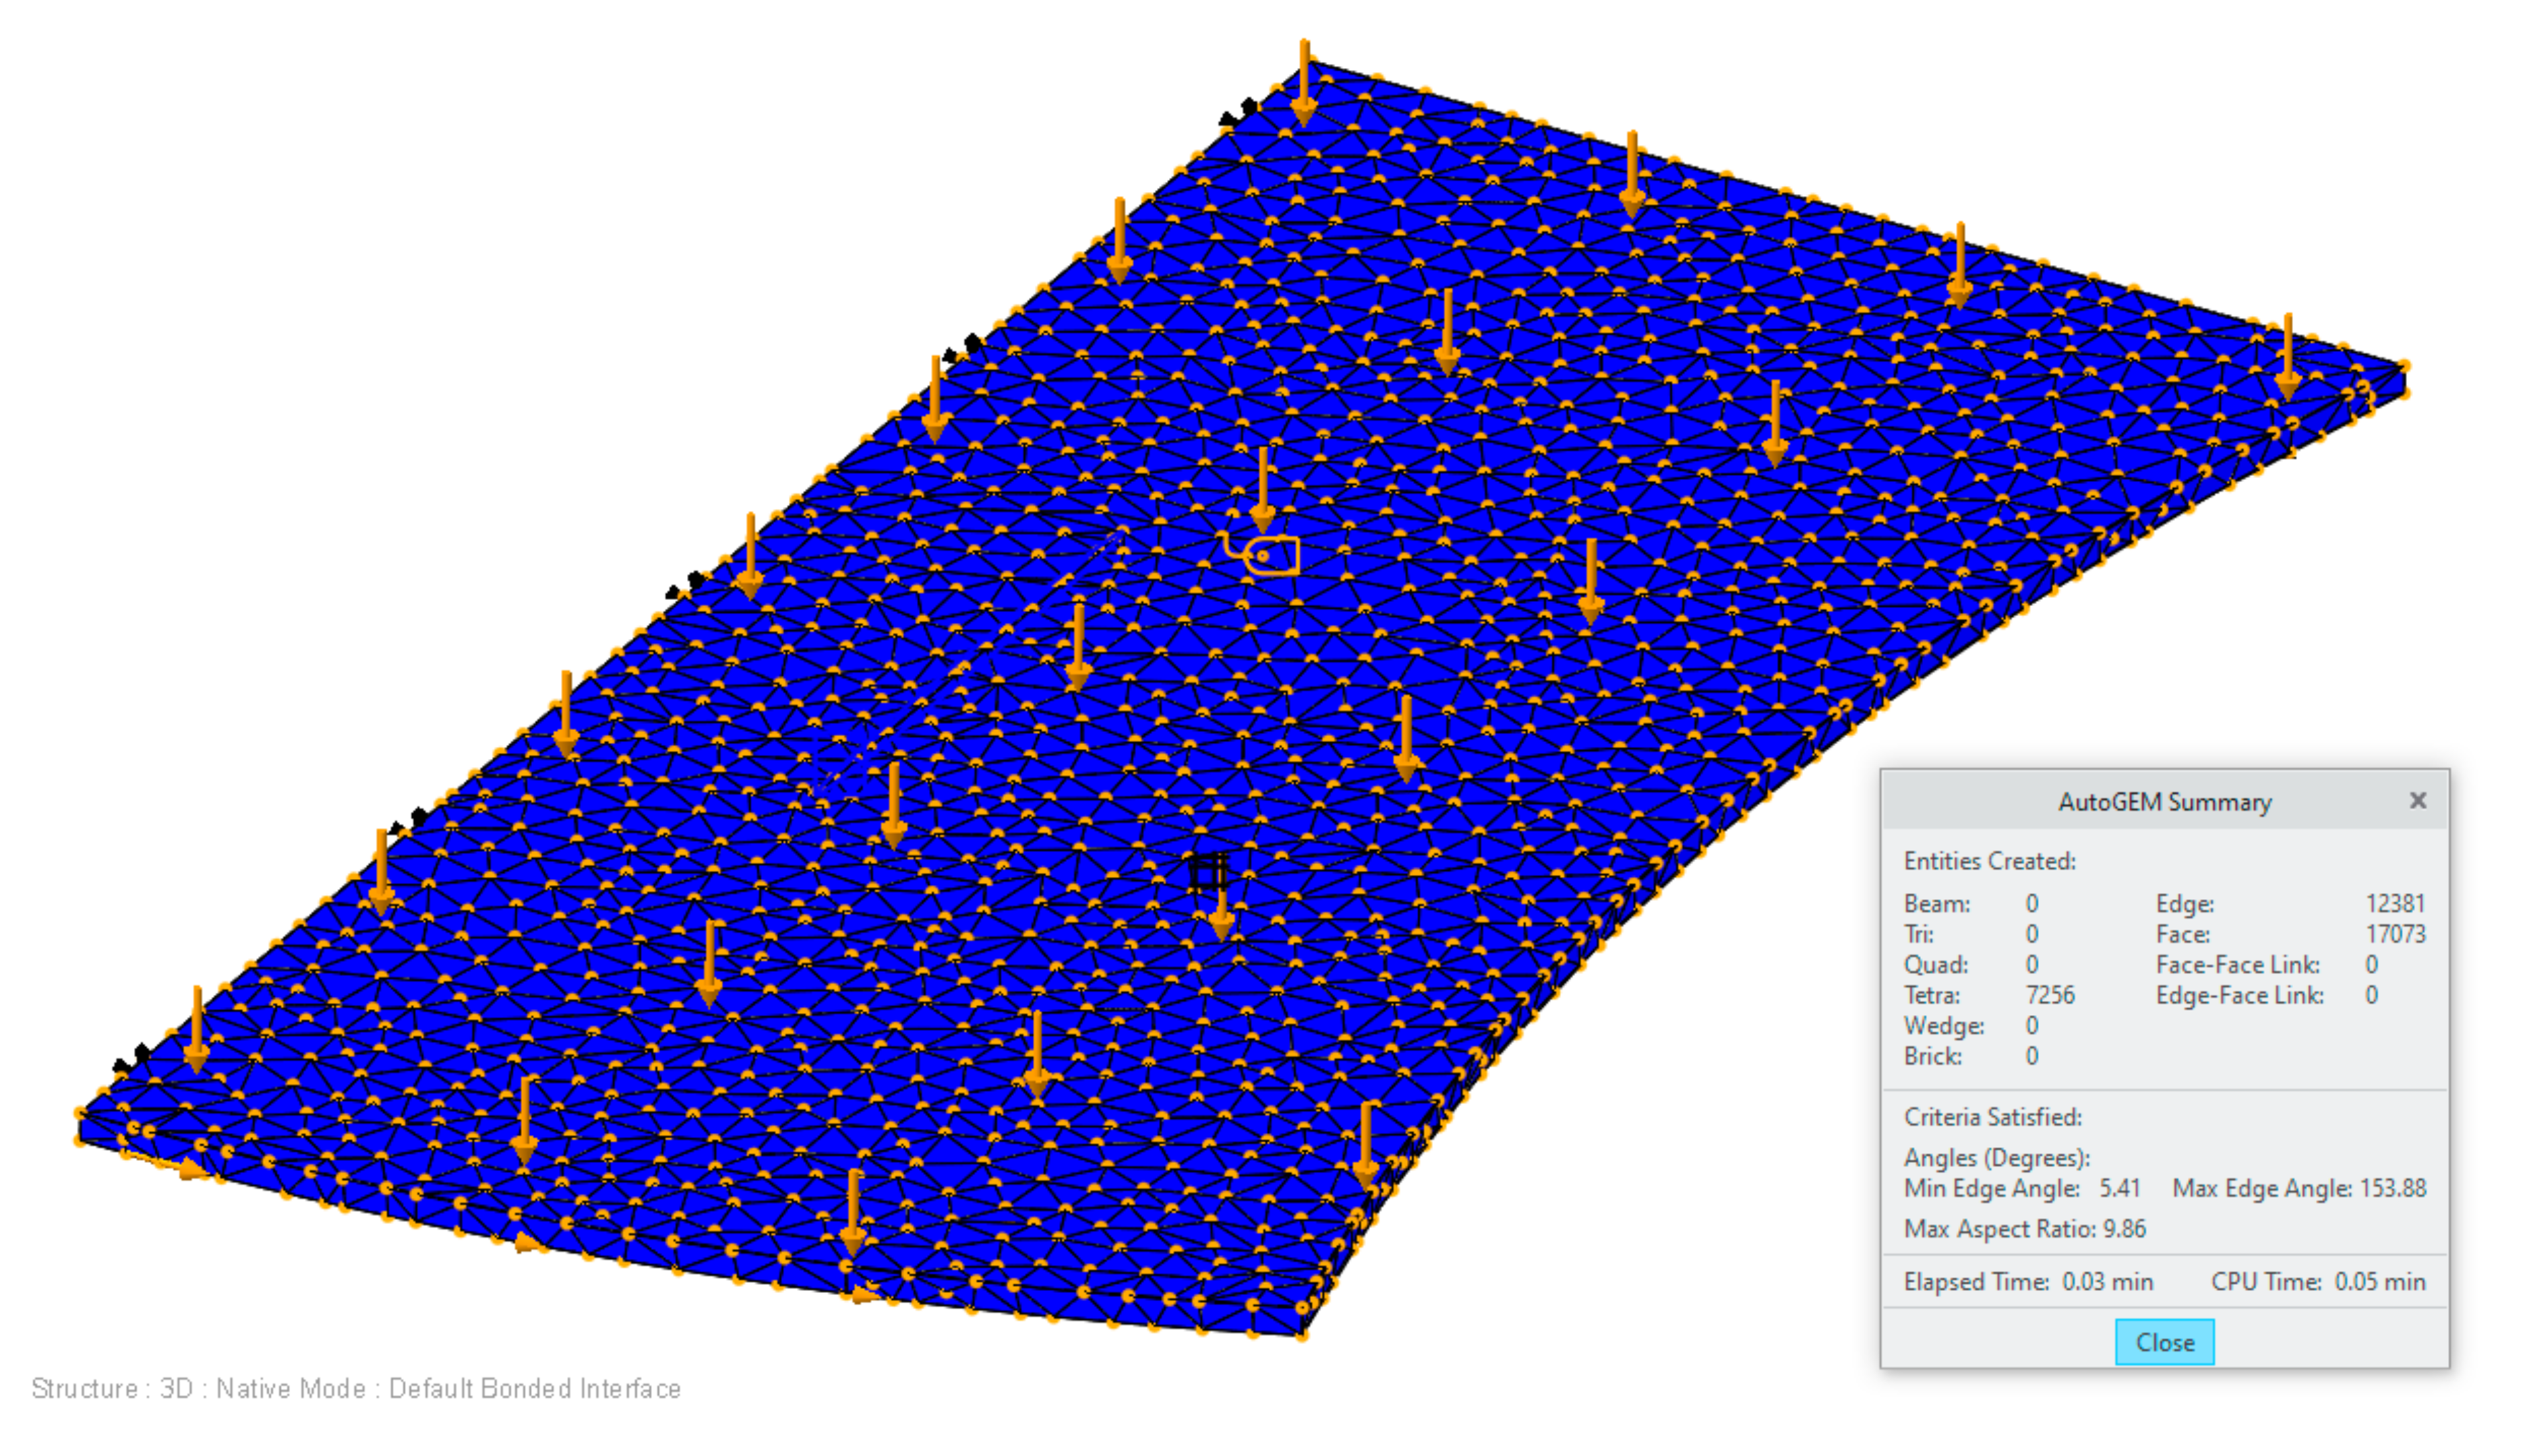
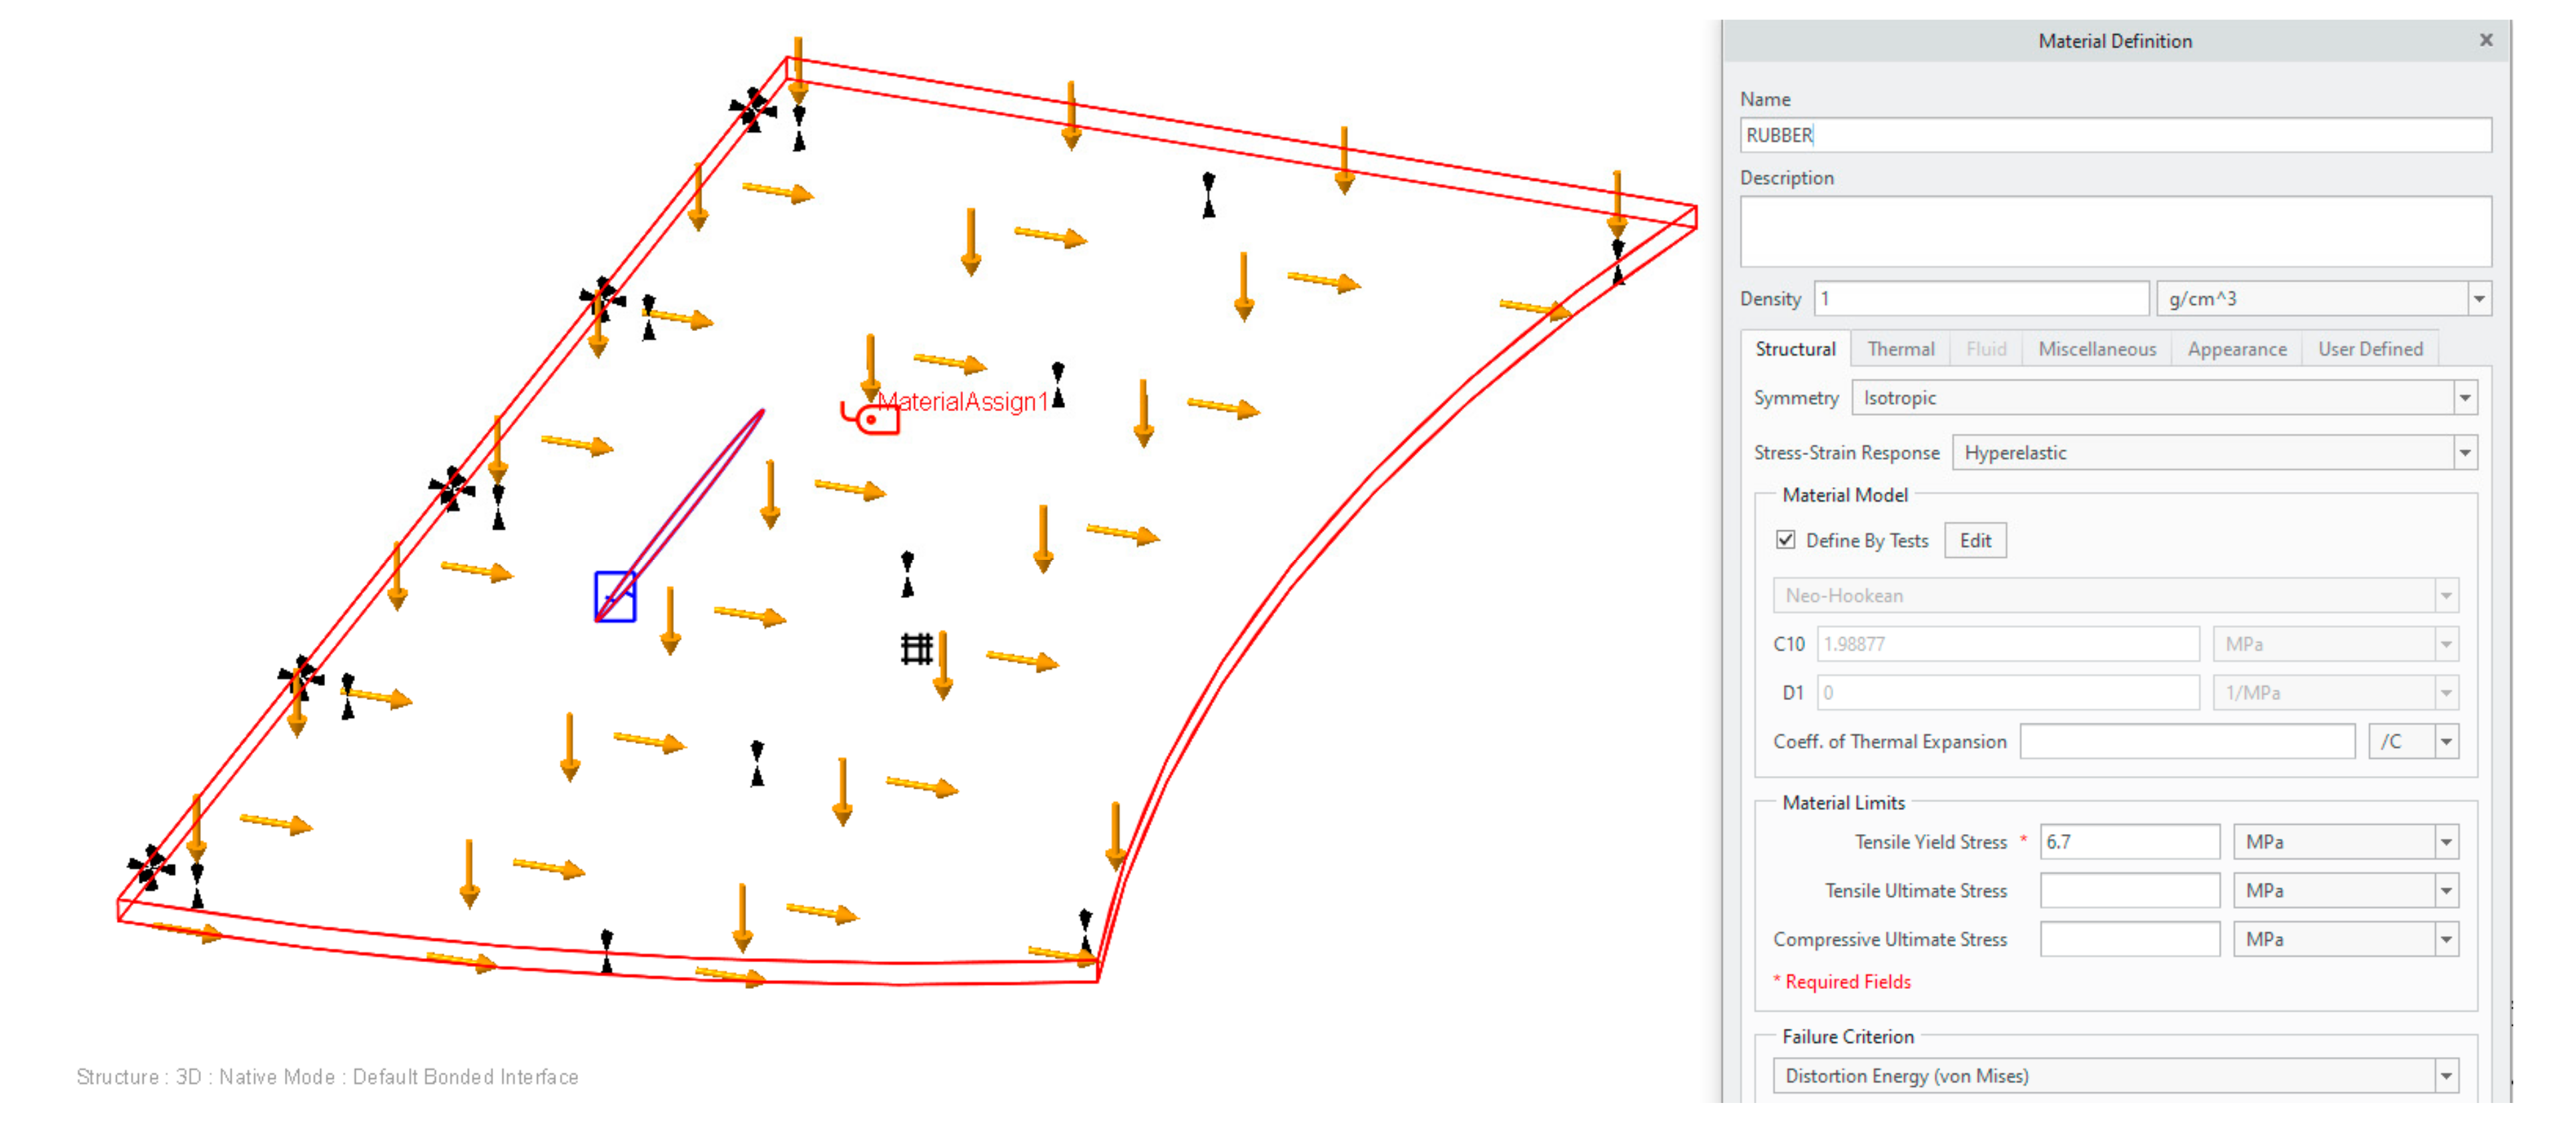
2.2. Methods
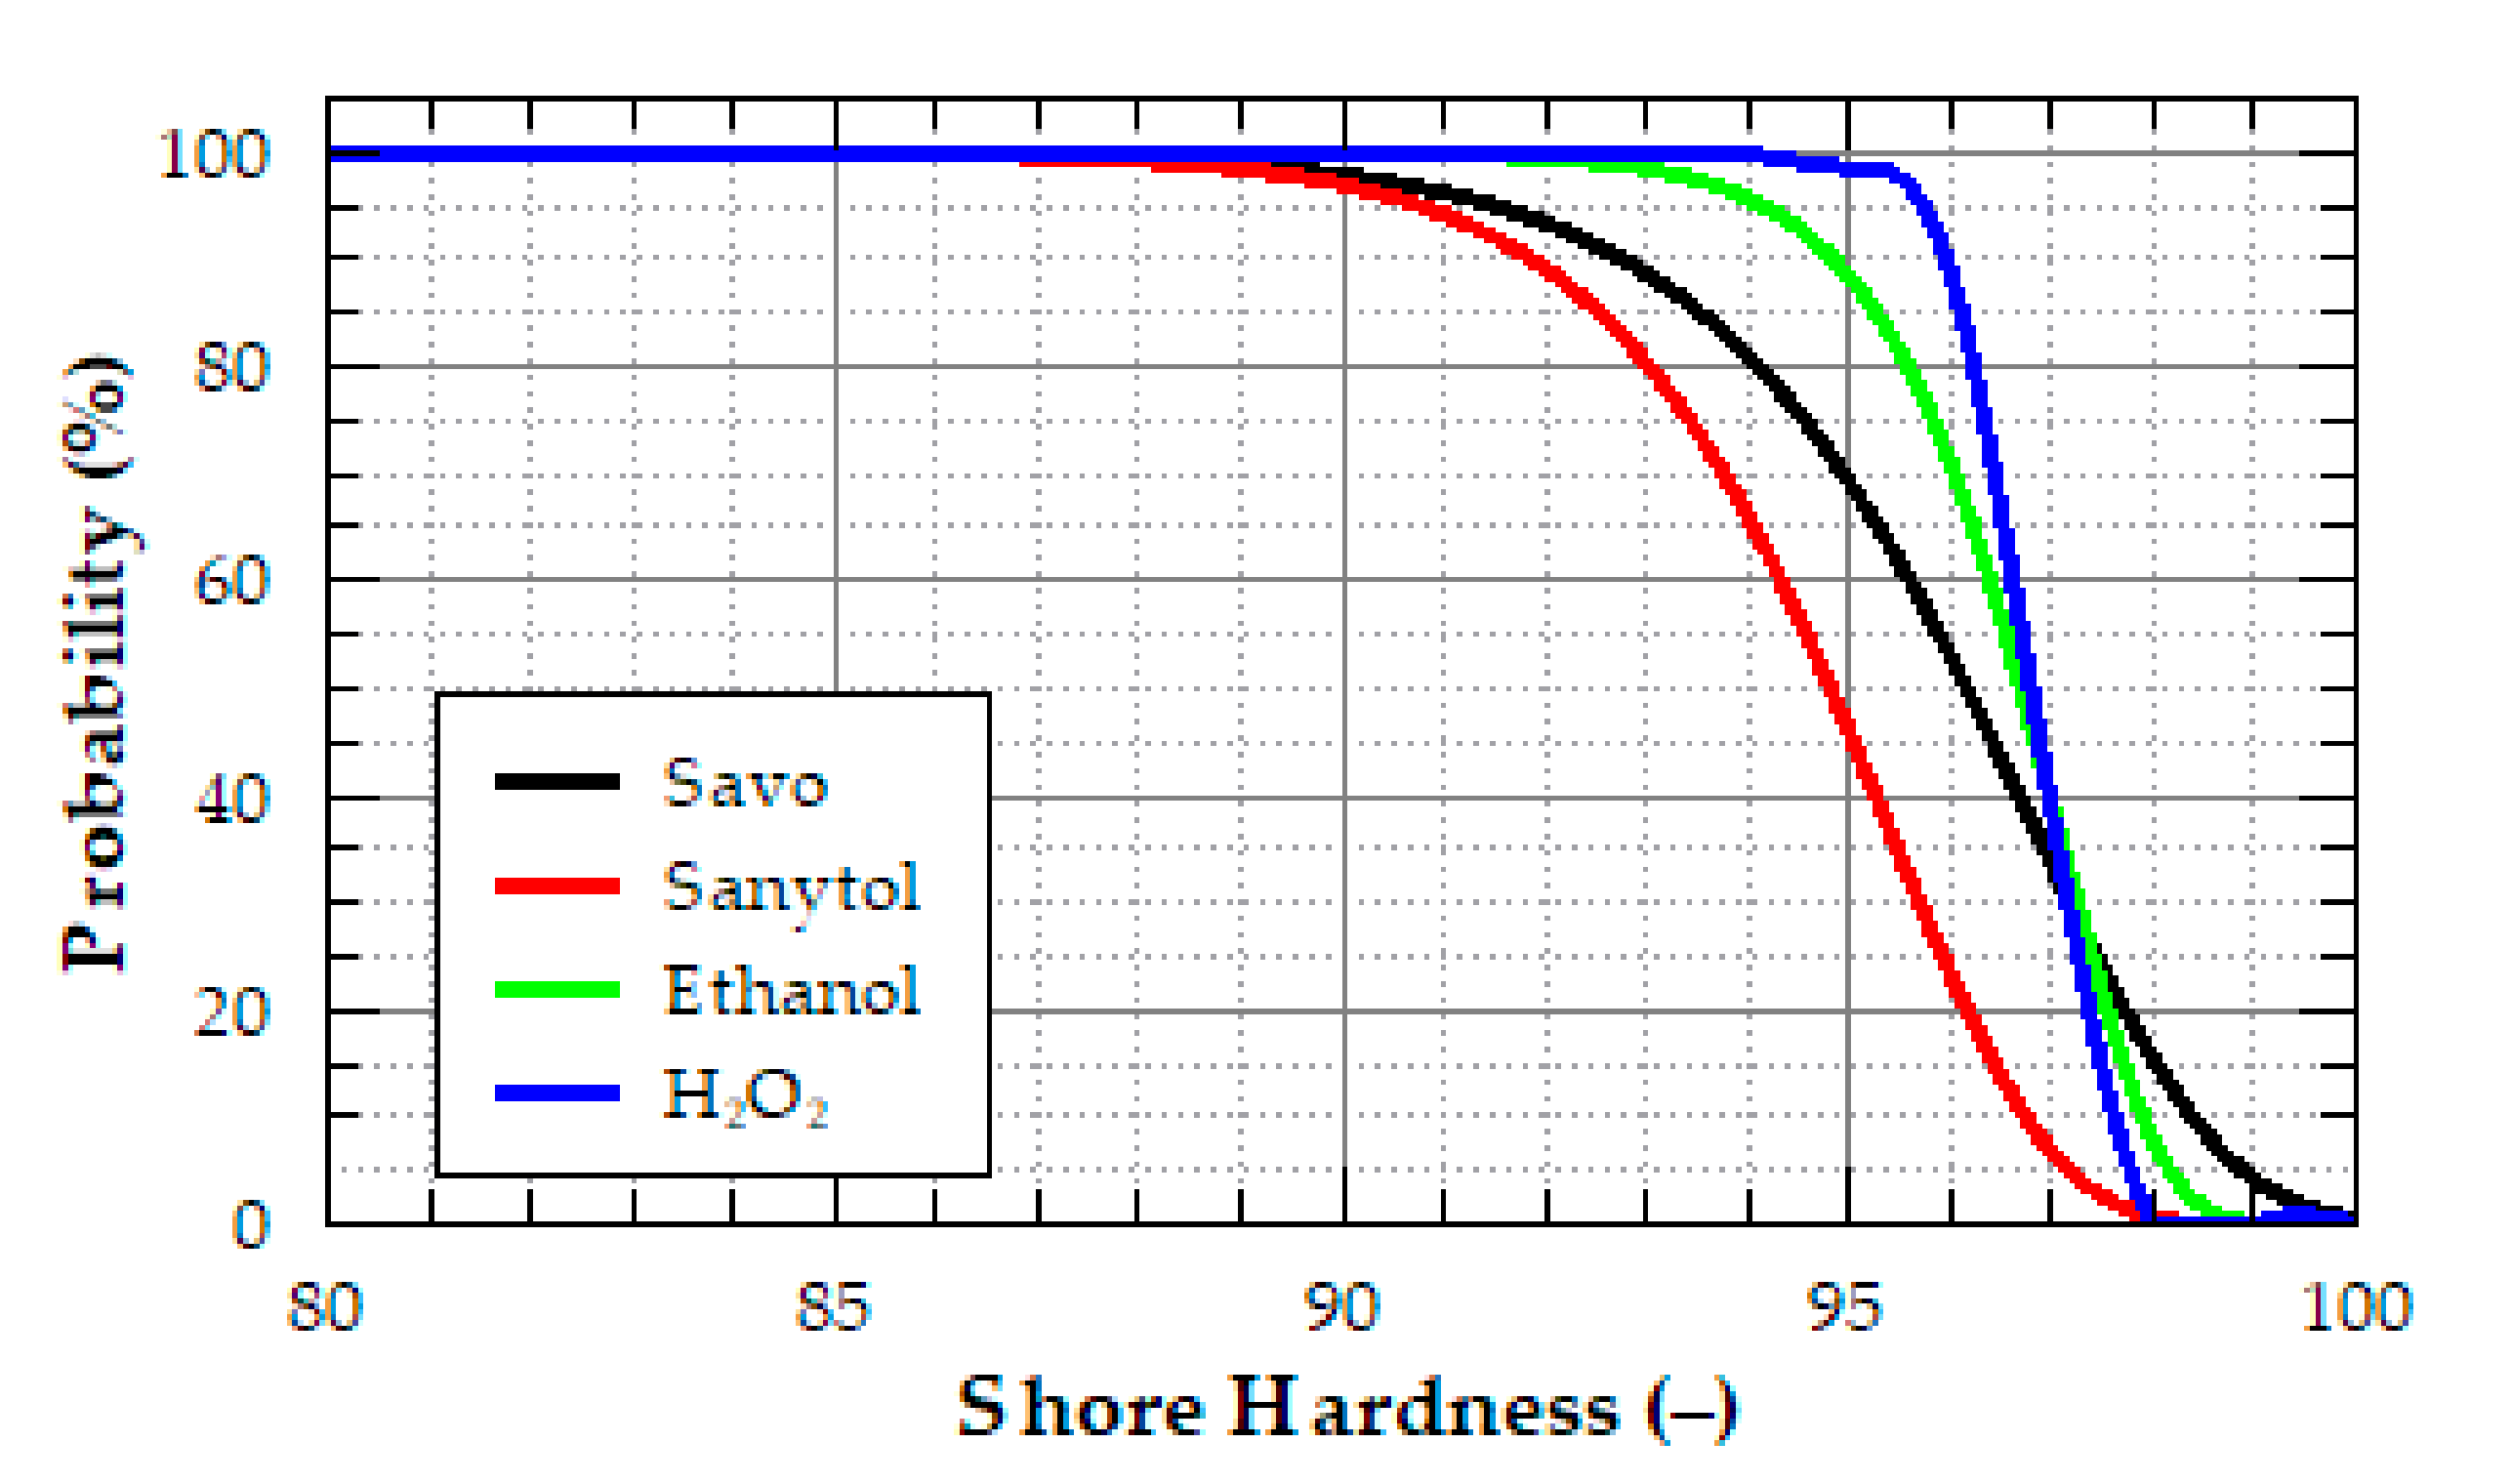
2.3. Weibull Distribution
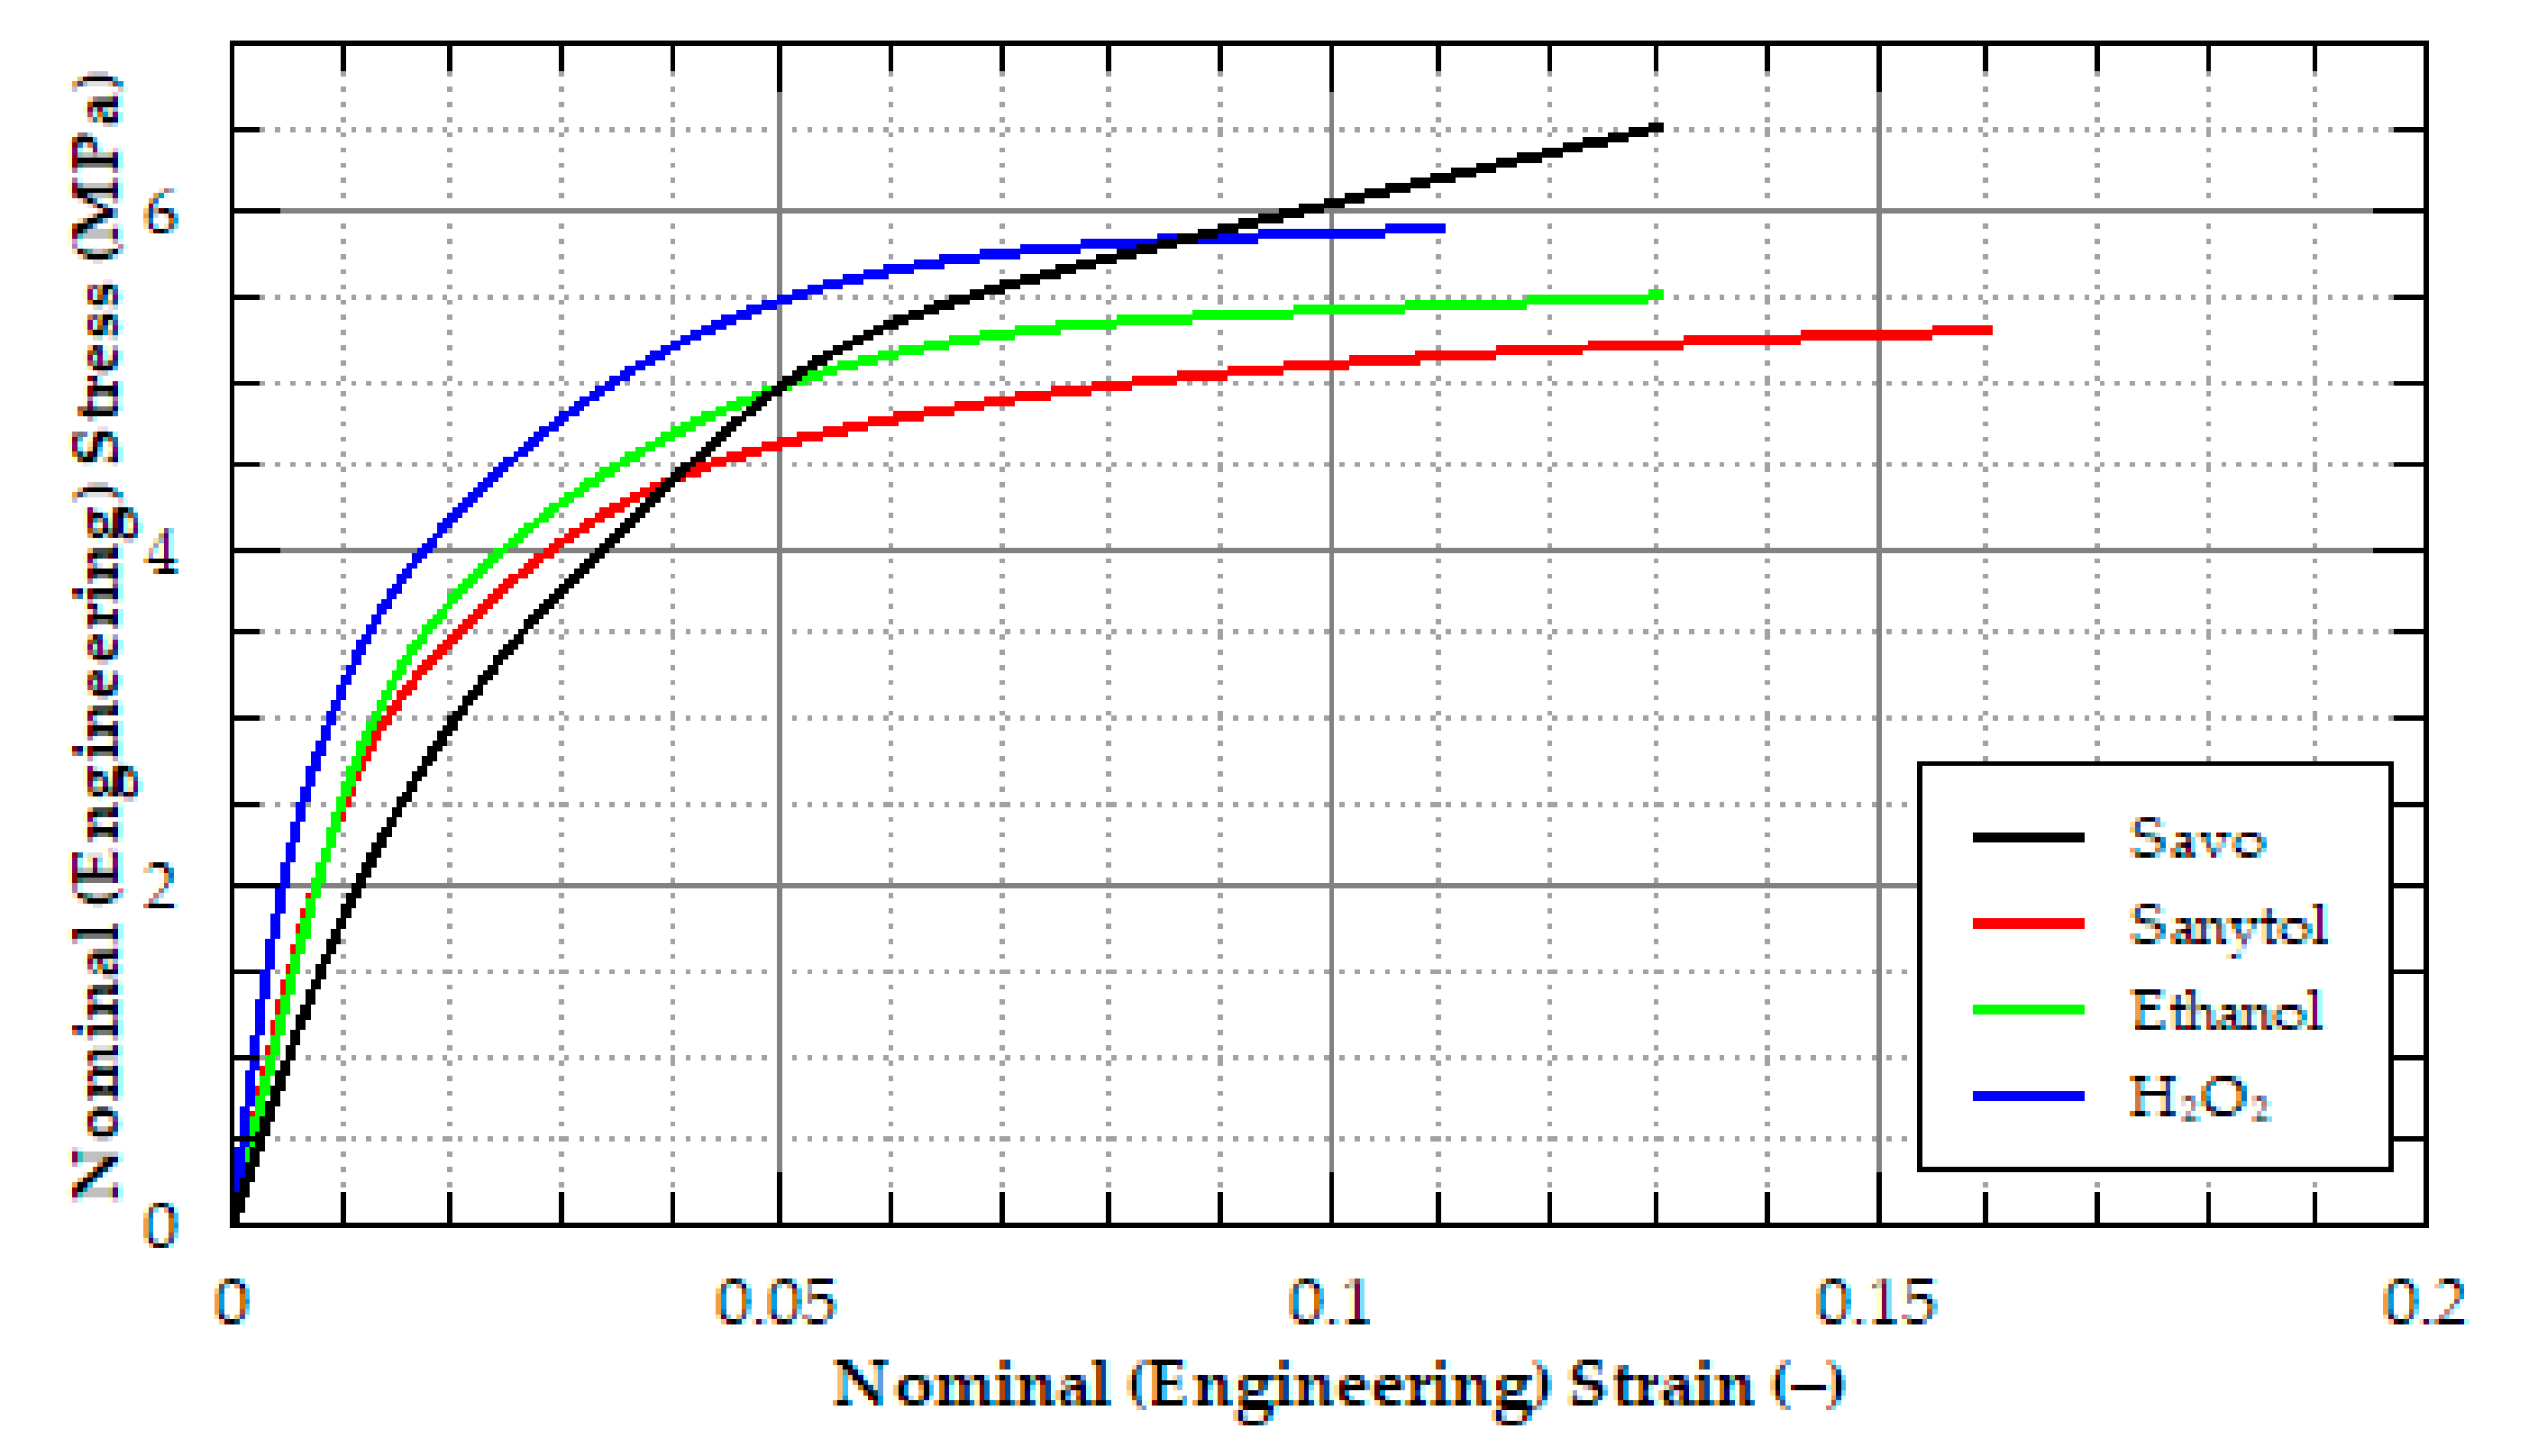
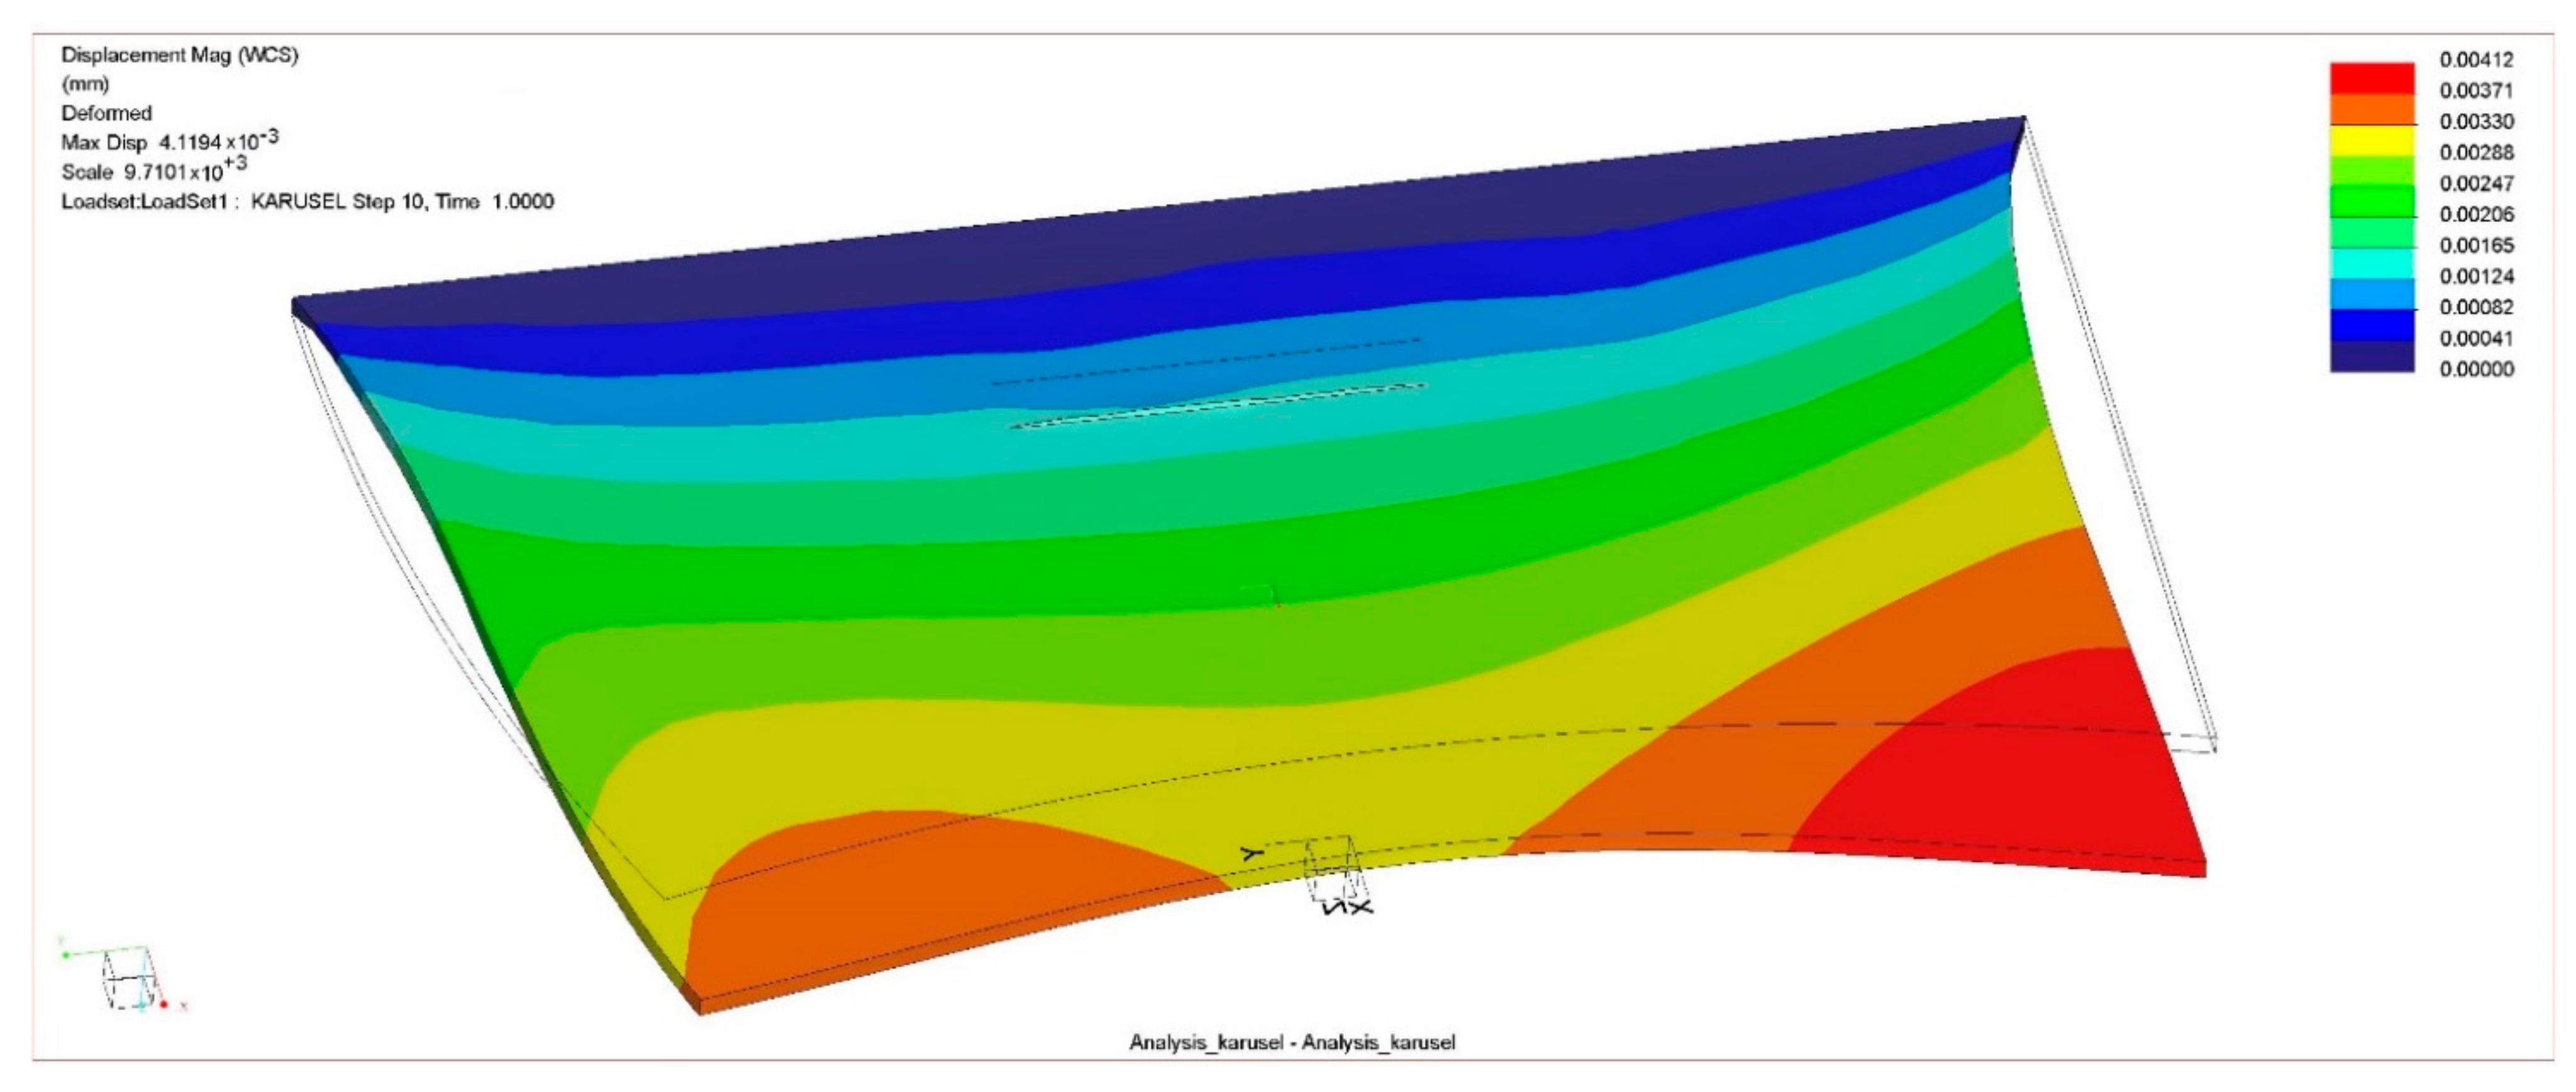
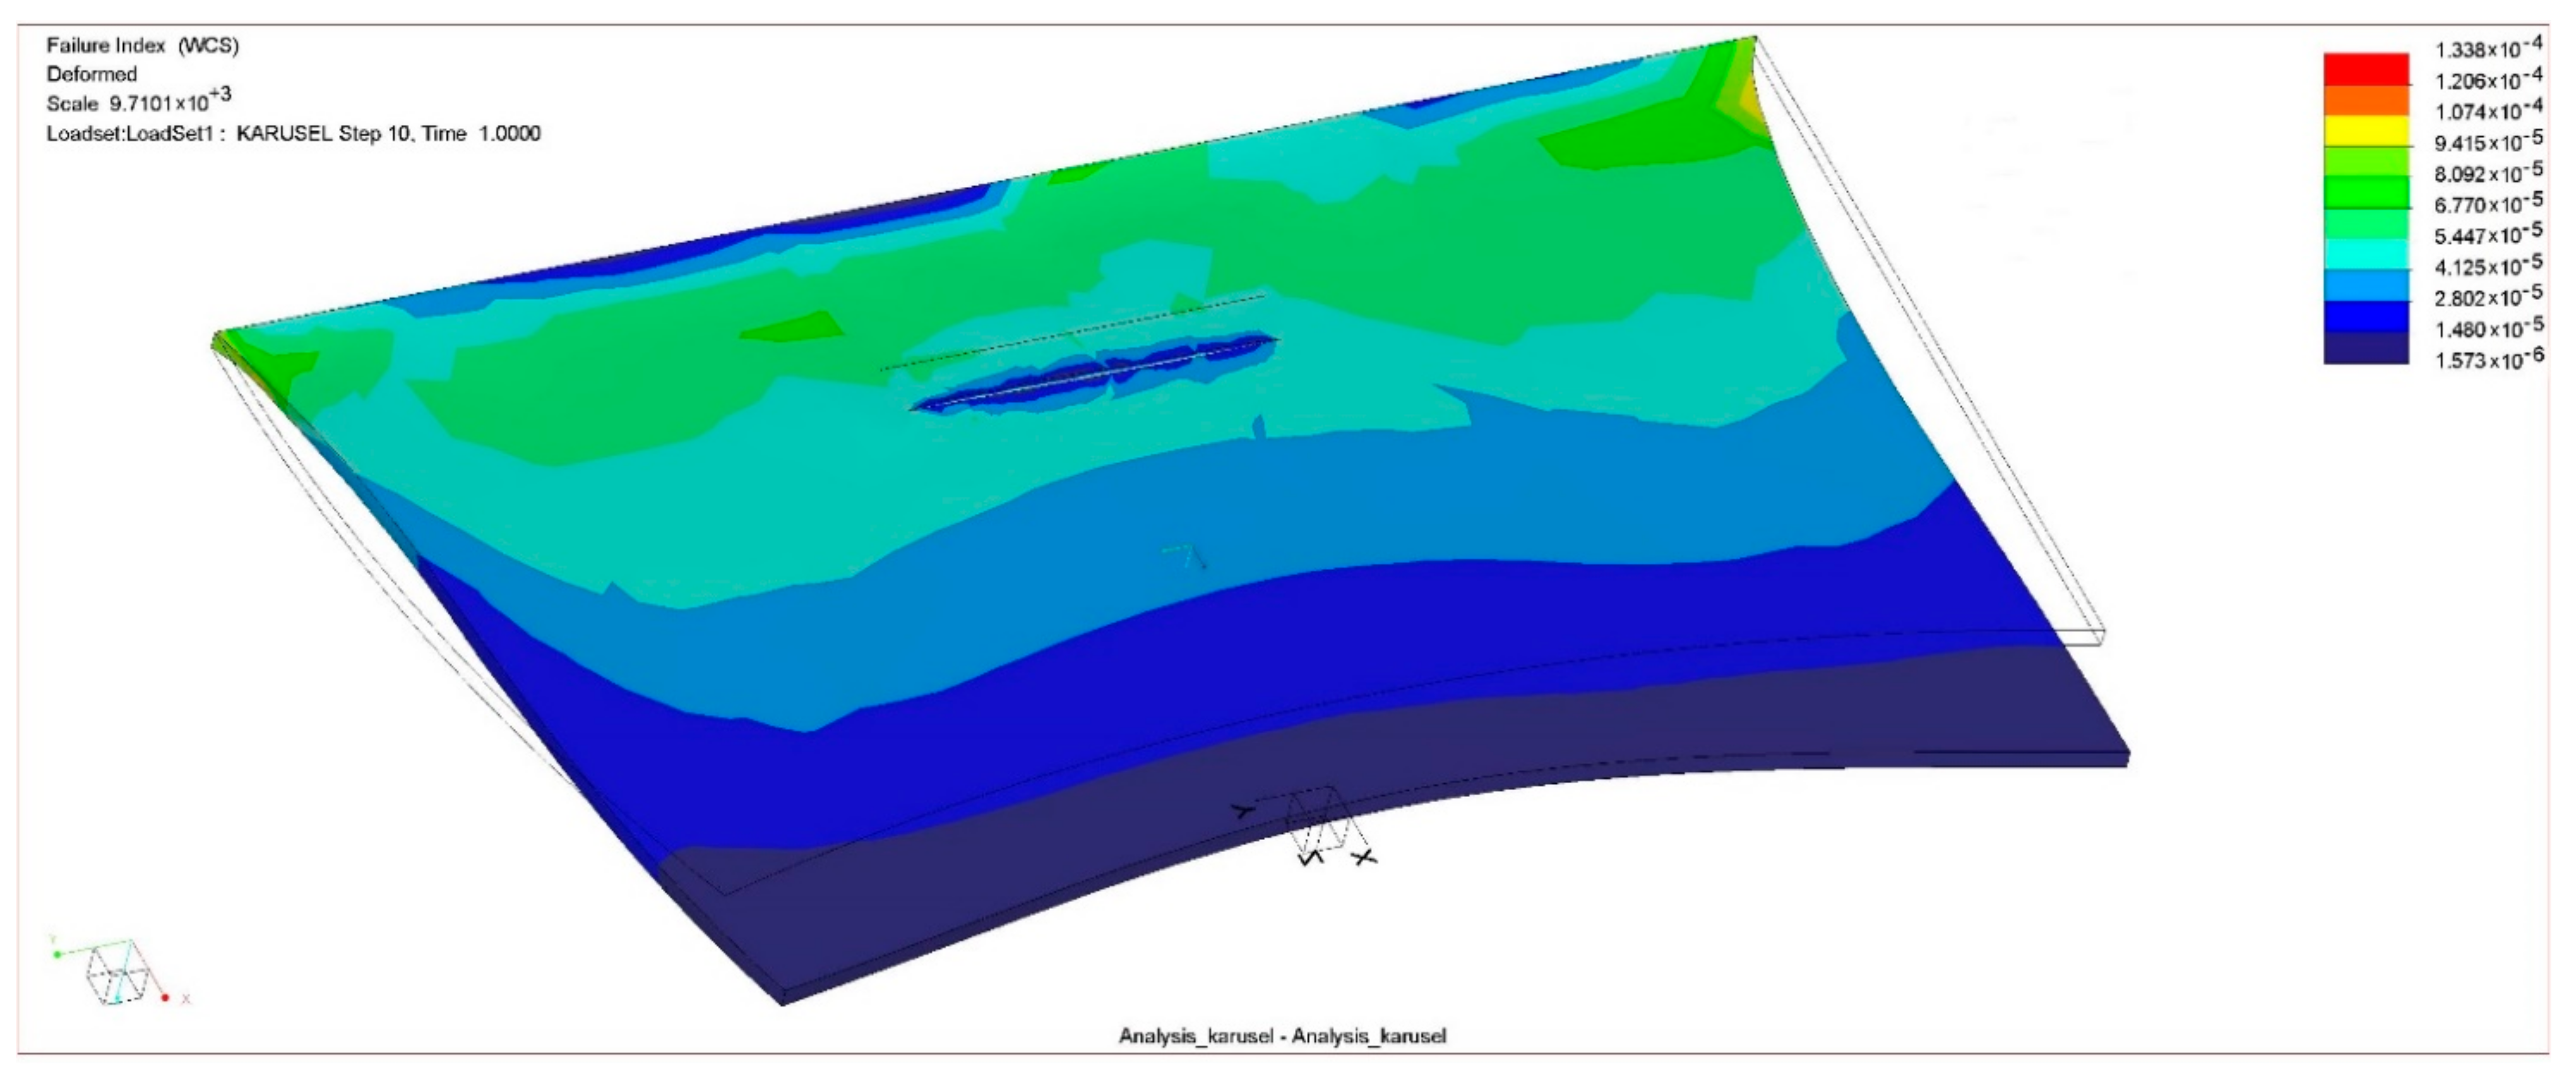
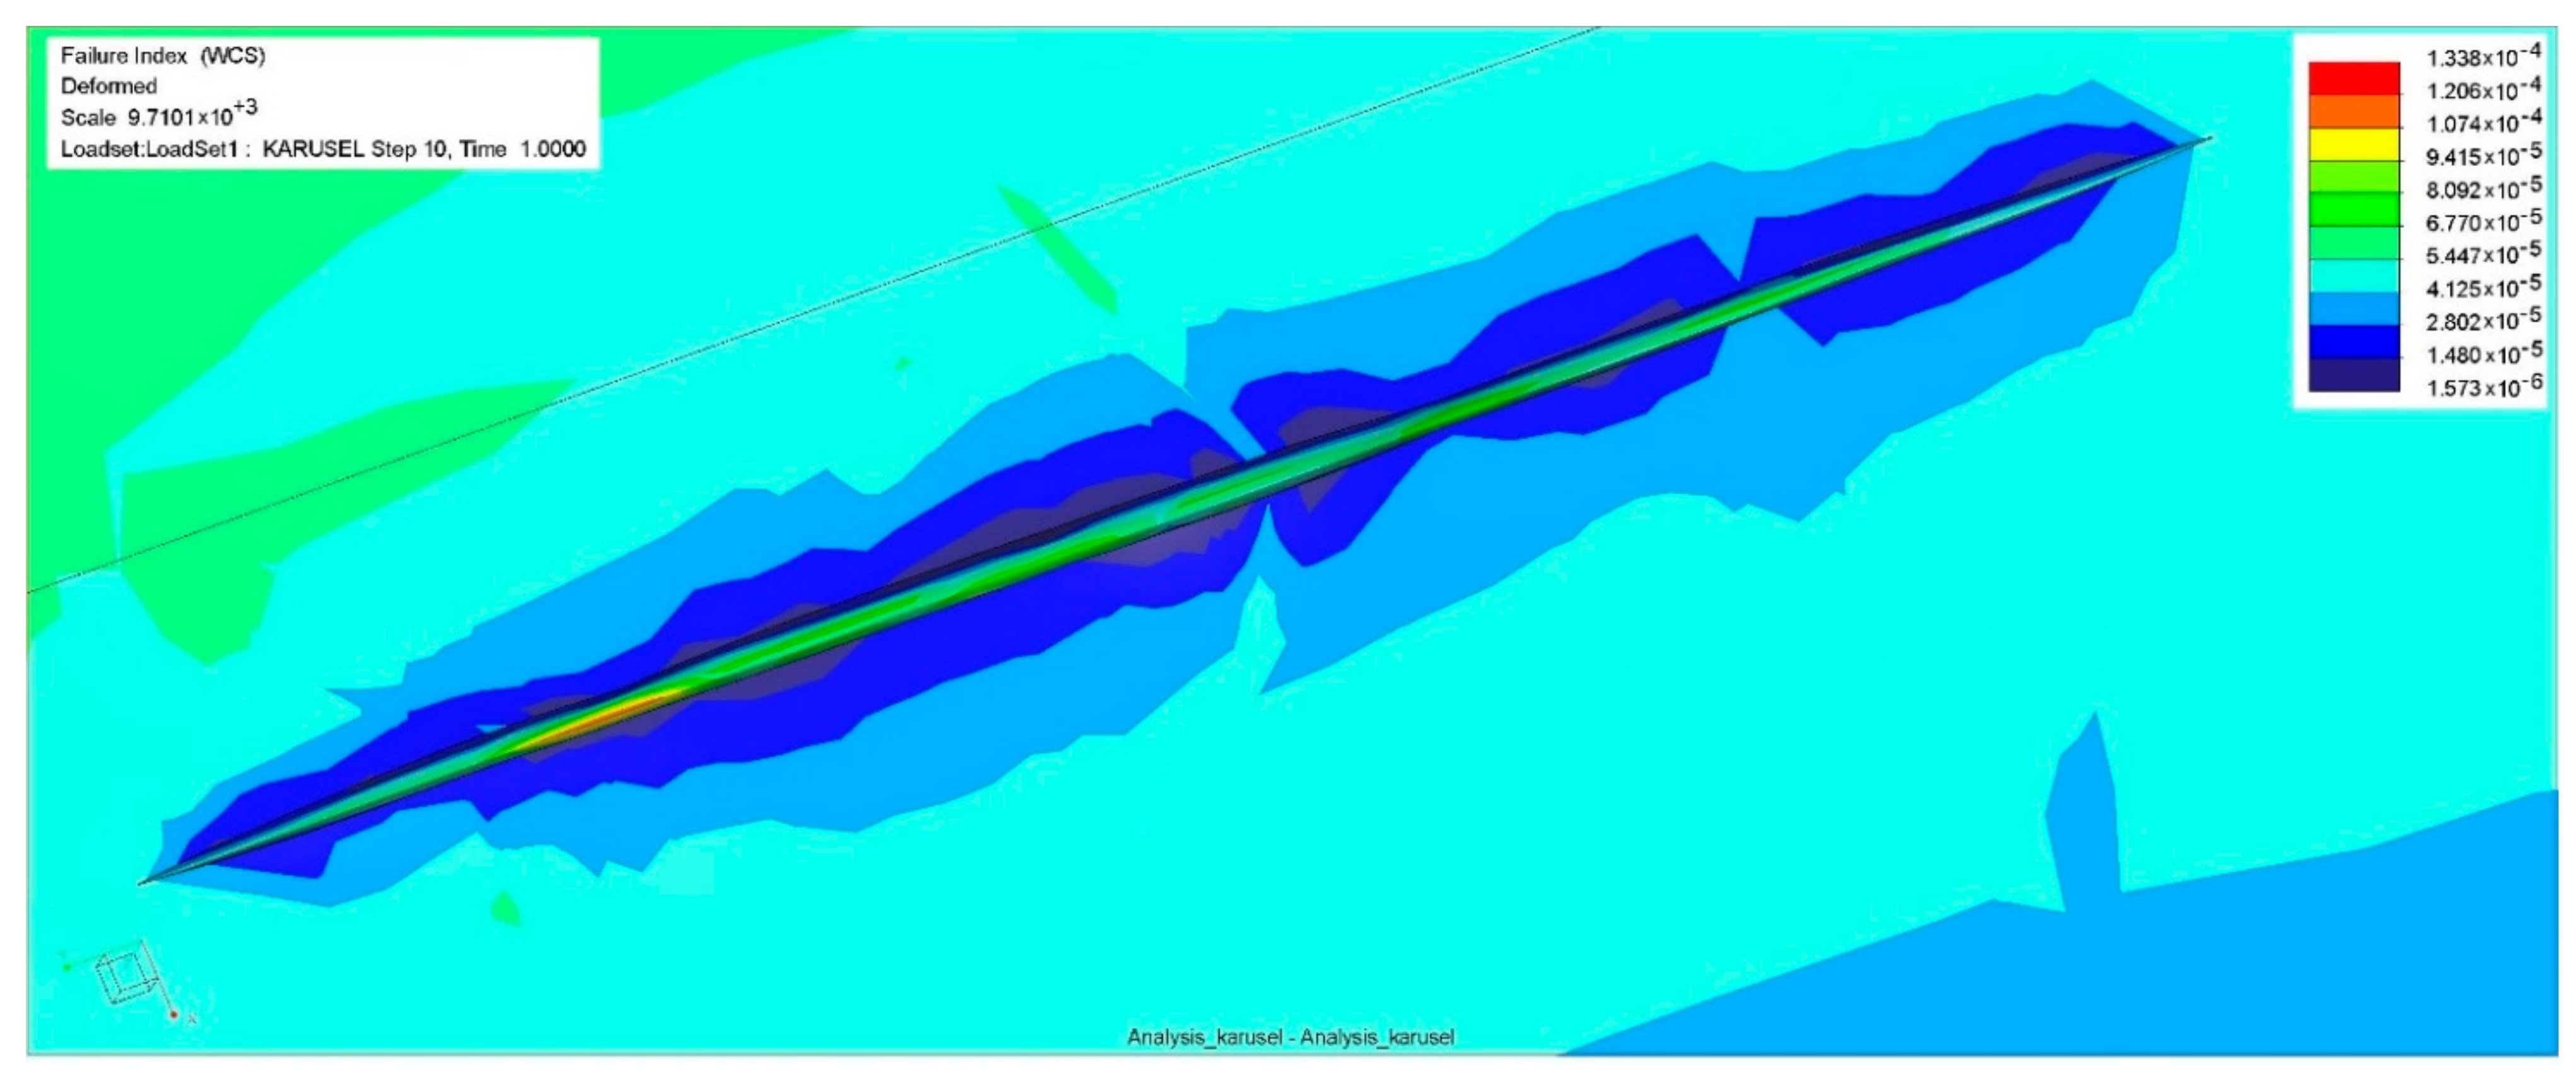
3. Results
4. Discussion
5. Conclusions
Author Contributions
Funding
Informed Consent Statement
Conflicts of Interest
References
- Weibull, W. A Statistical Distribution Function of Wide Applicability. J. Appl. Mech. 1951, 18, 293–297. [Google Scholar] [CrossRef]
- Zhang, C.W. Weibull parameter estimation and reliability analysis with zero-failure data from high-quality products. Reliab. Eng. Syst. Saf. 2021, 207, 107321. [Google Scholar] [CrossRef]
- Thanh Thach, T.; Briš, R. An additive Chen-Weibull distribution and its applications in reliability modeling. Qual. Reliab. Eng. Int. 2021, 37, 352–373. [Google Scholar] [CrossRef]
- Kam, O.M.; Noël, S.; Ramenah, H.; Kasser, P.; Tanougast, C. Comparative Weibull distribution methods for reliable global solar irradiance assessment in France areas. Renew Energ. 2021, 165, 194–210. [Google Scholar] [CrossRef]
- Silahli, B.; Dingec, K.D.; Cifter, A.; Aydin, N. Portfolio value-at-risk with two-sided Weibull distribution: Evidence from cryptocurrency markets. Financ. Res. Lett. 2021, 38, 101425. [Google Scholar] [CrossRef]
- Alshenawy, R.; Al-Alwan, A.; Almetwally, E.M.; Afify, A.Z.; Almongy, H.M. Progressive type-ii censoring schemes of extended odd weibull exponential distribution with applications in medicine and engineering. Mathematics 2020, 8, 1679. [Google Scholar] [CrossRef]
- Strzelecki, P. Determination of fatigue life for low probability of failure for different stress levels using 3-parameter Weibull distribution. Int. J. Fatigue 2021, 145, 106080. [Google Scholar] [CrossRef]
- Barraza-Contreras, J.M.; Piña-Monarrez, M.R.; Molina, A. Fatigue-life prediction of mechanical element by using the Weibull distribution. Appl. Sci. Basel 2020, 10, 6384. [Google Scholar] [CrossRef]
- Wang, Y.; Chen, Z.; Zhang, Y.; Li, X.; Li, Z. Remaining useful life prediction of rolling bearings based on the three-parameter Weibull distribution proportional hazards model. Insight Non-Destr. Test. Cond. Monit. 2021, 62, 710–718. [Google Scholar] [CrossRef]
- Abebaw Gessesse, A.; Mishra, R. Genetic Algorithm-Based Fuzzy Programming Method for Multi-objective Stochastic Transportation Problem Involving Three-Parameter Weibull Distribution. Adv. Intell. Syst. 2021, 1170, 155–167. [Google Scholar] [CrossRef]
- Franchuk, V.P.; Ziborov, K.A.; Krivda, V.V.; Fedoriachenko, S.O. On wheel rolling along the rail regime with longitudinal load. Nauk. Visnyk Natsionalnoho Hirnychoho Universytetu 2017, 3, 62–67. [Google Scholar]
- Milewska, A.; żukowska, J. An Attempt of Apply the Weibull Distribution in Road Traffic Losses Analysis. J. Konbin 2008, 7, 131–143. [Google Scholar] [CrossRef] [Green Version]
- Rouillard, V.; Lamb, M.J. Using the Weibull distribution to characterise road transport vibration levels. Packag. Technol. Sci. 2020, 33, 255–266. [Google Scholar] [CrossRef]
- Liwei, Z.; Liqing, W.; Jianping, L. Quality Control in Construction and Maintenance Process of Highway Mechanical and Electrical System Based on Weibull Distribution Model. IOP C Ser. Earth Environ. 2020, 565, 012027. [Google Scholar] [CrossRef]
- Jung, Y.S.; Oh, J. Lifespan evaluation of traffic detector for Automated traffic recorders based on Weibull distribution. J. Transp. Eng. 2017, 143, 05017006. [Google Scholar] [CrossRef]
- Kravets, V.; Ziborov, K.; Bas, K.; Fedoriachenko, S. Combined method for determining the optimal flow distribution plan for mining, urban electric vehicles and for charging stations. E3S Web Conf. 2019, 123, 01029. [Google Scholar] [CrossRef]
- Jamaludin; Sumarno. Analysis of Causes Damage in Flight Compartment Windows Due to Heating System Failure in Boeing 737–800 Airport Using Weibull Analysis Distribution. J. Phys. Conf. Ser. 2020, 147, 052038. [Google Scholar] [CrossRef]
- Niu, P.; Wang, Z.; Liu, S.; Jia, K. Demand Forecast of Restoring Air Material of Helicopter Based on NHPP and Weibull Model. J. Phys. Conf. Ser. 2020, 1676, 012089. [Google Scholar] [CrossRef]
- Gupta, M.; Anandpushparaj, J.; Muthuchidambaranathan, P.; Jayakody, D.N.K. Outage Performance Comparison of Dual-Hop Half/Full Duplex Wireless UAV System over Weibull Fading Channel. In Proceedings of the 2020 International Conference on Wireless Communications Signal Processing and Networking, Chennai, India, 4–6 August 2020; pp. 177–181. [Google Scholar] [CrossRef]
- Lei, W.-S.; Yu, Z.; Zhang, P.; Qian, G. Standardized Weibull statistics of ceramic strength. Ceram. Int. 2021, 47, 4972–4993. [Google Scholar] [CrossRef]
- Boiko, Y.M. Weibull statistics of the lap-shear strength of a symmetric interface of amorphous poly (ethylene terephthalate). Polym. Bull. 2020, 77, 6377–6390. [Google Scholar] [CrossRef]
- Berk, L.A.; Hallock, J.N. Predicting near-ground vortex lifetimes using weibull density functions. In Proceedings of the Collection of Technical Papers—45th AIAA Aerospace Sciences Meeting, Reno, Nevada, 8–11 January 2007; Volume 18, pp. 12746–12759. [Google Scholar]
- Ashfaq, F.; Hafeez, I.; Hussan, S. Developing Non-Linear Relationship among Factors Affecting the Rutting Susceptibility of Asphalt Mixtures Using Two Parameter Weibull Distribution. IOP C Ser. Mat. Sci. 2020, 899, 012017. [Google Scholar] [CrossRef]
- Attukur Nandagopal, R.; Narasimalu, S.; Chai, G.B. Study of statistically significant strength degradation of hygrothermal aged CFRP and its weibull analysis. Compos. Commun. 2021, 23, 100566. [Google Scholar] [CrossRef]
- Belhadj, B.; Abdelkader, L.; Chateauneuf, A. Weibull probabilistic model of moisture concentration build up in a fiber graphite/epoxy polymer composite under varying hydrothermal conditions. Period. Polytech. Mech. 2021, 65, 27–38. [Google Scholar] [CrossRef]
- Mukherjee, T.; Pati, B.; Senapati, D. Performance Evaluation of Composite Fading Channels Using q-Weibull Distribution. Adv. Intell. Syst. 2021, 1198, 317–324. [Google Scholar] [CrossRef]
- Chiang, Y.J.; Shih, C.D.; Lin, C.C.; Tseng, Y.Y. Examination of tyre rubber cure by Weibull distribution functions. Int. J. Mater. Prod. Tec. 2003, 20, 210–219. [Google Scholar] [CrossRef]
- Venudharan, V.; Biligiri, K.P. Rutting performance of asphalt-rubber gap-graded mixtures: Evaluation through statistical and reliability approaches. Road Mater. Pavement 2020, 21, S2–S18. [Google Scholar] [CrossRef]
- Ming, P.; Lu, J.; Cai, X.; Liu, M.; Chen, X. Analysis of the Crack Evolution Process in Crumb Rubber Concrete Based on Acoustic Emission Technology. KSCE J. Civ. Eng. 2020, 24, 2088–2098. [Google Scholar] [CrossRef]
- Koenig, F.; Found, P.A.; Kumar, M. Condition monitoring for airport baggage handling in the era of industry 4.0. J. Qual. Maint. Eng. 2019, 25, 435–451. [Google Scholar] [CrossRef]
- Marasova, D.; Saderova, J.; Ambrisko, L. Simulation of the Use of the Material Handling Equipment in the Operation Process. Open Eng. 2020, 10, 216–223. [Google Scholar] [CrossRef]
- Ravikumar, S.; Kanagasabapathy, H.; Muralidharan, V. Multi-Component Fault Diagnosis of Self Aligning Troughing Roller (SATR) in Belt Conveyor System using Decision Tree—A Statistical Approach. FME Trans. 2020, 48, 364–371. [Google Scholar] [CrossRef]
- Marasová, D.; Cehlár, M.; Kolman, J. Diagnostics of the residual service life of steel frames of large-scale excavators. Int. Multi. Sci. Geoco. 2019, 19, 255–262. [Google Scholar] [CrossRef]
- Blazej, R.; Jurdziak, L.; Kirjanów, A.; Kozlowski, T. Random Deterioration Process of Conveyor Belt Evaluated by Statistical Analysis of Core Failures Detected Along Belt Axis and Elapsed Time. IOP C Ser. Earth Environ. 2017, 95, 042046. [Google Scholar] [CrossRef]
- Liu, X.W.; He, D.J.; Lodewijks, G.; Pang, Y.S.; Mei, J. Integrated decision making for predictive maintenance of belt conveyor systems. Reliab. Eng. Syst. Saf. 2019, 188, 347–351. [Google Scholar] [CrossRef]
- Kessentinia, R.; Klinkova, O.; Tawfiq, I.; Haddar, M. Theoretical and Experimental Investigation of Bonded Patch Repairs of a Rubber Reinforced Composite Conveyor Belt. Polymers 2021, 13, 1710. [Google Scholar] [CrossRef]
- Kessentinia, R.; Klinkova, O.; Tawfiq, I.; Haddar, M. Transient hygro-thermo-mechanical stresses analysis in multi-layers bonded structure with coupled bidirectional model. Int. J. Mech. Sci. 2019, 150, 188–201. [Google Scholar] [CrossRef]
- Semrád, K.; Draganová, K.; Košcák, P.; Cernan, J. Statistical prediction models of impact damage of airport conveyor belts. Transp. Res. Proc. 2020, 51, 11–19. [Google Scholar] [CrossRef]
- Rahman, S.M.M.; Kim, J.; Laratte, B. Disruption in Circularity? Impact analysis of COVID-19 on ship recycling using Weibull tonnage estimation and scenario analysis method. Resour. Conserv. Recycl. 2021, 164, 105139. [Google Scholar] [CrossRef]
- Moreau, V.H. Forecast predictions for the COVID-19 pandemic in Brazil by statistical modeling using the Weibull distribution for daily new cases and deaths. Braz. J. Microbiol. 2020, 51, 1109–1115. [Google Scholar] [CrossRef]
- Draganova, K.; Semrad, K.; Fozo, L.; Spodniak, M.; Jurc, R. Methodology for Structural Analysis of Hyperelastic Materials with Embedded Magnetic Microwires. Metalurgija 2020, 59, 389–392. [Google Scholar]
- WHO. Guide to Hybiene and Sanitation in Aviation, 3rd ed; WHO: Geneva, Switzerland, 2009; ISBN 978-92-4-154777-2. [Google Scholar]
- Guo, S.; Wang, X.; Liu, Y.; Zhu, X.; Zhai, Y. A comparison study of three types of parameter estimation methods on weibull model. Adv. Intell. Syst. 2021, 1244, 706–711. [Google Scholar] [CrossRef]
- Ishaq, A.I.; Abiodun, A.A. The Maxwell–Weibull Distribution in Modeling Lifetime Datasets. Ann. Data Sci. 2020, 7, 639–662. [Google Scholar] [CrossRef]
- Dorner, W. Using Microsoft Excel for Weibull Analysis. Qual. Dig. Mag. 1999, 23237. Available online: http://www.qualitydigest.com/jan99/html/body_weibull.html (accessed on 3 February 2021).
- Sumair, M.; Aized, T.; Gardezi, S.A.R.; Rehman, S.U.U.; Rehman, S.M.S. A novel method developed to estimate Weibull parameters. Energy Rep. 2020, 6, 1715–1733. [Google Scholar] [CrossRef]
- Saboori, H.; Barmalzan, G.; Ayat, S.M. Generalized Modified Inverse Weibull Distribution: Its Properties and Applications. Sankhya B 2020, 82, 247–269. [Google Scholar] [CrossRef]
- Hongxiang, L.; Shan, F.P.; Baofeng, S. A comparative study of modified Weibull distributions in proportional hazards models. AIP Conf. Proc. 2020, 2266, 090011. [Google Scholar] [CrossRef]
- Nassar, M.; Afify, A.Z.; Shakhatreh, M.K.; Dey, S. On a new extension of Weibull distribution: Properties, estimation, and applications to one and two causes of failures. Qual. Reliab. Eng. Int. 2020, 36, 2019–2043. [Google Scholar] [CrossRef]
- Jurić, V.; Kozubowski, T.J.; Perman, M. An asymmetric multivariate weibull distribution. Commun. Stat. Theory 2020, 49, 4394–4412. [Google Scholar] [CrossRef]
- Marshall, A.W.; Olkin, I. A new method for adding a parameter to a family of distributions with application to the exponential and Weibull families. Biometrika 1997, 84, 641–652. [Google Scholar] [CrossRef]
- Lai, C.D.; Xie, M.; Murthy, D.N.P. A modified Weibull distribution. IEEE T Reliab. 2003, 52, 33–37. [Google Scholar] [CrossRef] [Green Version]


| Hardness (–) | Min. Hardness (–) | |
|---|---|---|
| Savo | 94.5 | 92.8 |
| Sanytol | 93.1 | 92.5 |
| Ethanol | 96 | 95.2 |
| H2O2 | 97.2 | 95.8 |
| α (–) | β (–) | |
|---|---|---|
| Savo | 96.83 | 52.41 |
| Sanytol | 95.39 | 59.68 |
| Ethanol | 97.06 | 97.41 |
| H2O2 | 97.01 | 201.77 |
| Tensile Ultimate Stress (MPa) | Failure Index (–) | Static Load (kg) | Dynamic Load (kg) | |
|---|---|---|---|---|
| Nominal | 7.6 | 0.0001338 | 747.0 | 373.5 |
| Ethanol | 5.5 | 0.0008846 | 113.0 | 56.5 |
| Sanytol | 5.3 | 0.0009180 | 108.9 | 54.4 |
| Savo | 6.5 | 0.0007485 | 133.6 | 66.8 |
| H2O2 | 5.9 | 0.0008246 | 121.2 | 60.6 |
Publisher’s Note: MDPI stays neutral with regard to jurisdictional claims in published maps and institutional affiliations. |
© 2021 by the authors. Licensee MDPI, Basel, Switzerland. This article is an open access article distributed under the terms and conditions of the Creative Commons Attribution (CC BY) license (https://creativecommons.org/licenses/by/4.0/).
Share and Cite
Draganová, K.; Semrád, K.; Blišťanová, M.; Musil, T.; Jurč, R. Influence of Disinfectants on Airport Conveyor Belts. Sustainability 2021, 13, 10842. https://doi.org/10.3390/su131910842
Draganová K, Semrád K, Blišťanová M, Musil T, Jurč R. Influence of Disinfectants on Airport Conveyor Belts. Sustainability. 2021; 13(19):10842. https://doi.org/10.3390/su131910842
Chicago/Turabian StyleDraganová, Katarína, Karol Semrád, Monika Blišťanová, Tomáš Musil, and Rastislav Jurč. 2021. "Influence of Disinfectants on Airport Conveyor Belts" Sustainability 13, no. 19: 10842. https://doi.org/10.3390/su131910842