
The Impacts of a COVID-19 Related Lockdown (and Reopening Phases) on Time Use and Mobility for Activities in Austria—Results from a Multi-Wave Combined Survey


Abstract
:1. Introduction
2. Materials and Methods
2.1. Study Design
2.2. Sampling
2.3. Data Analysis Methods
3. Results
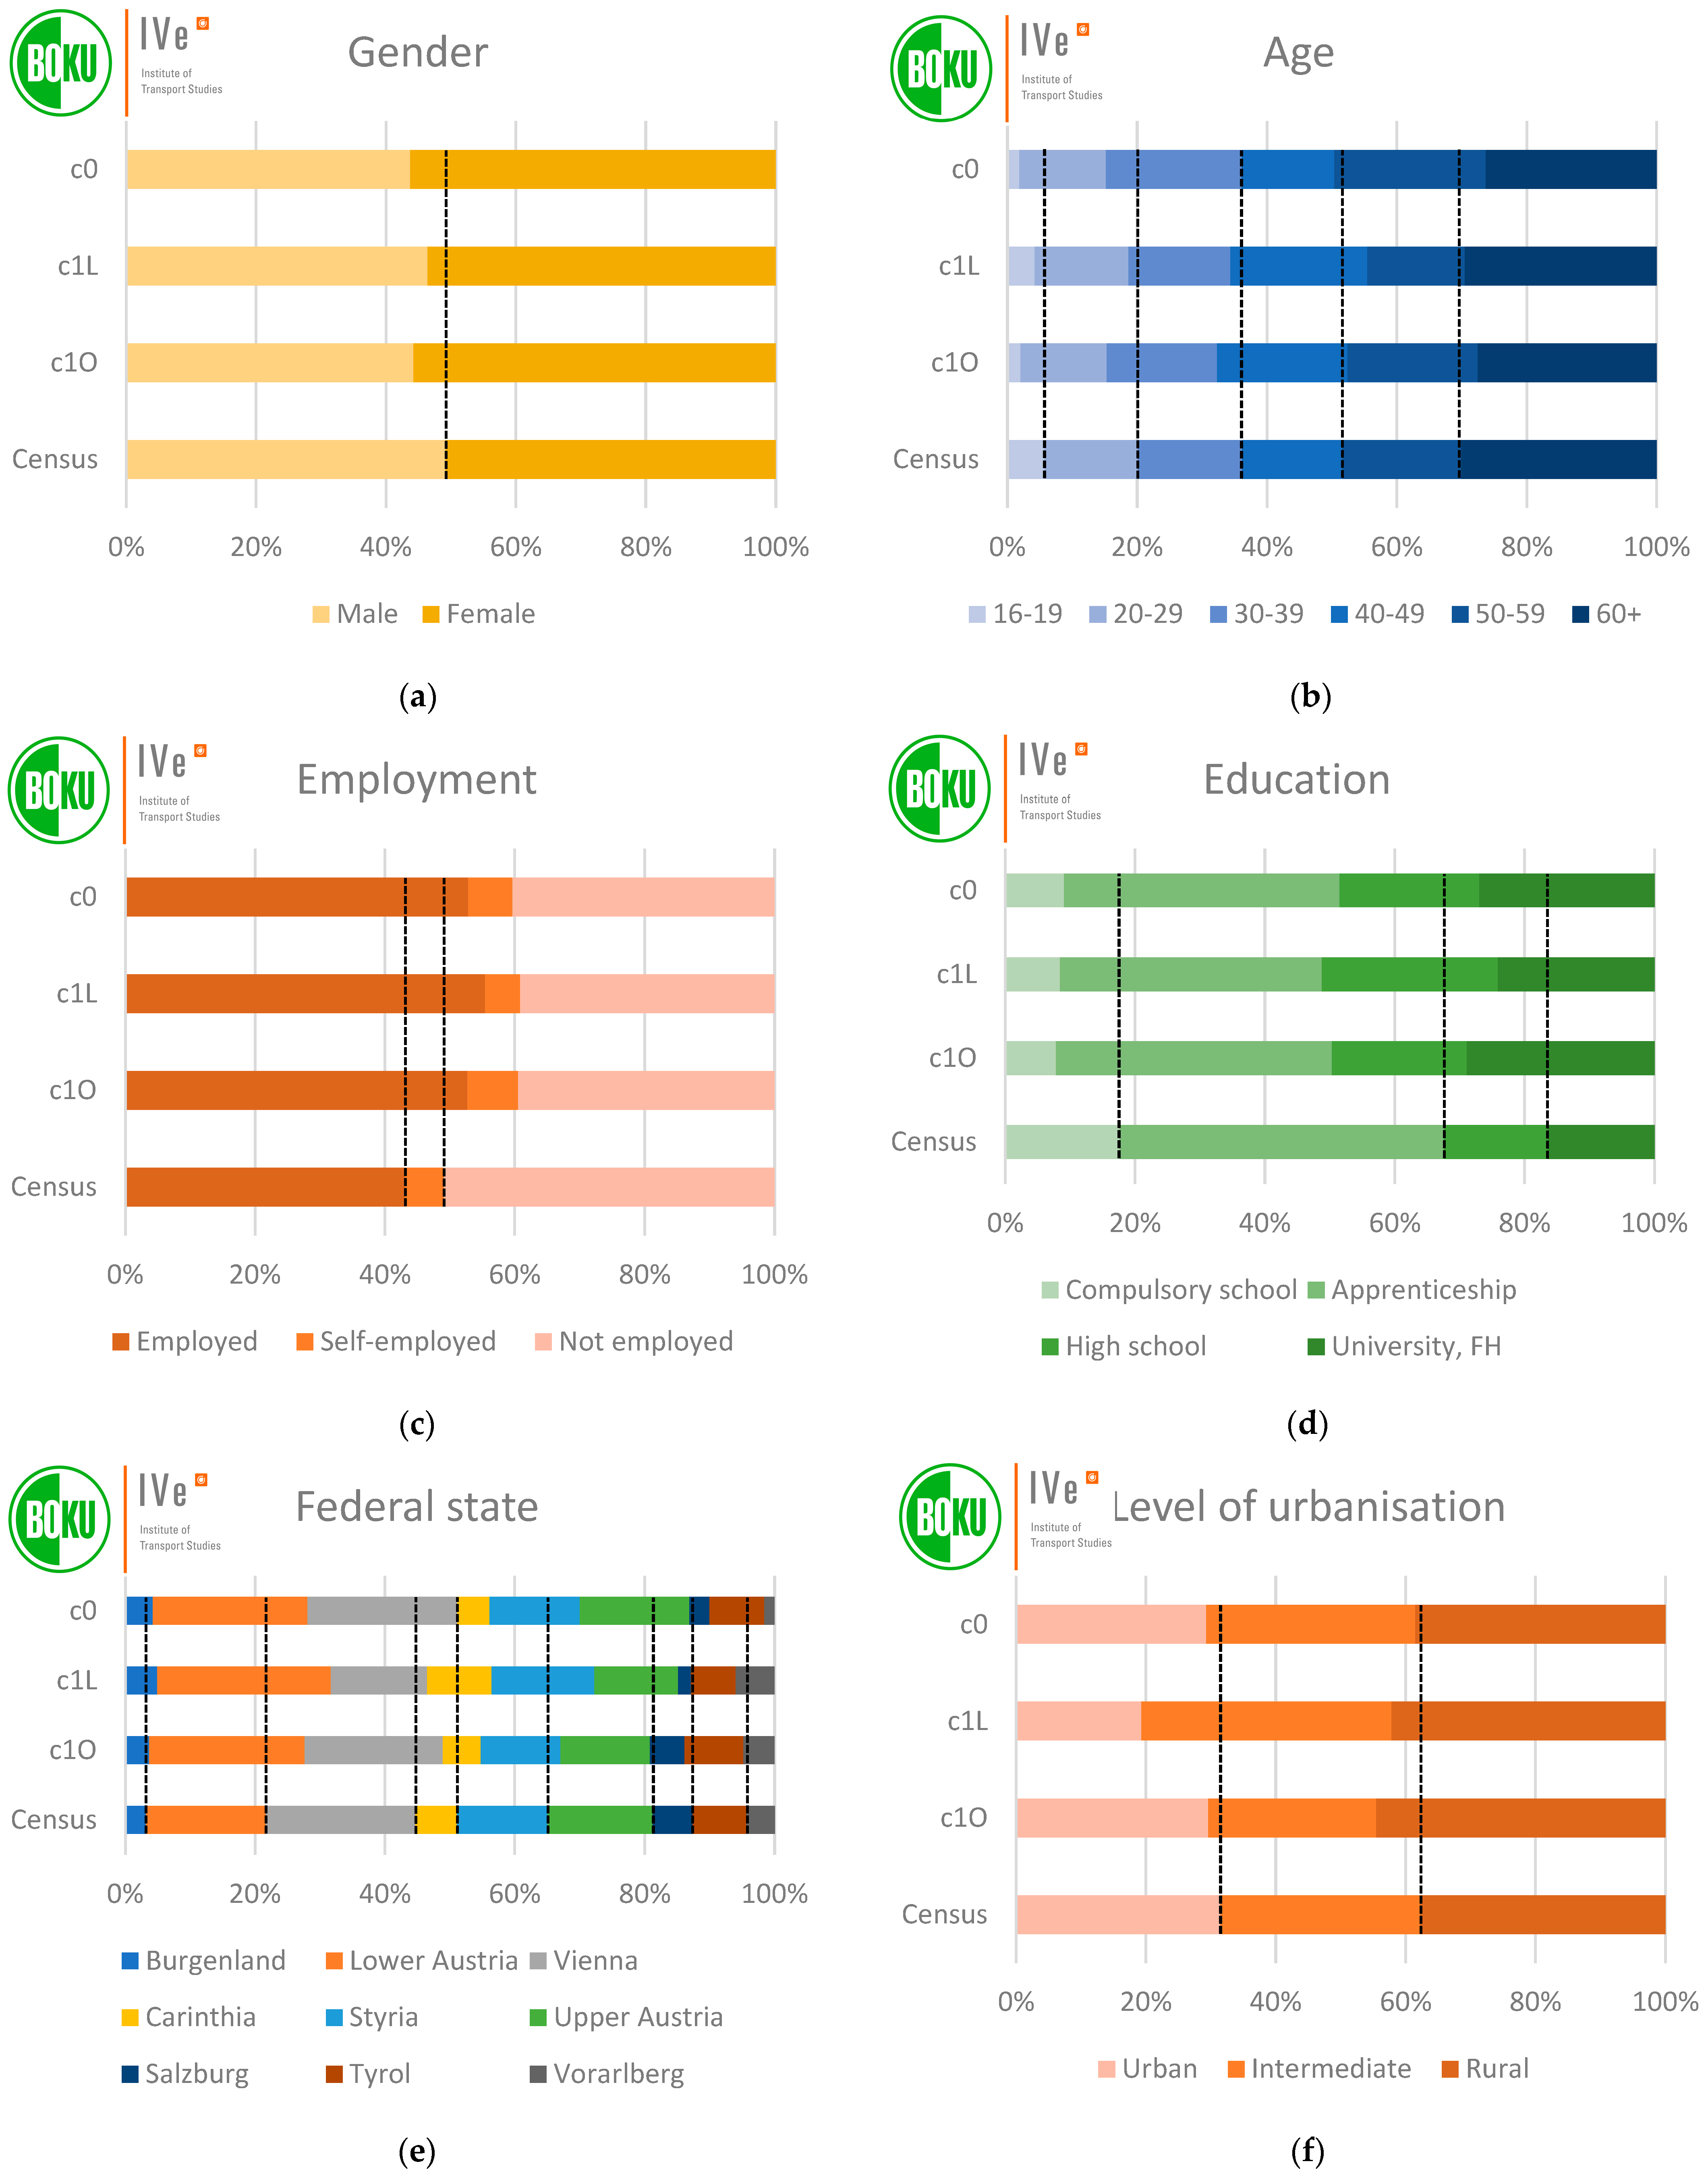
3.1. Description of the Sample
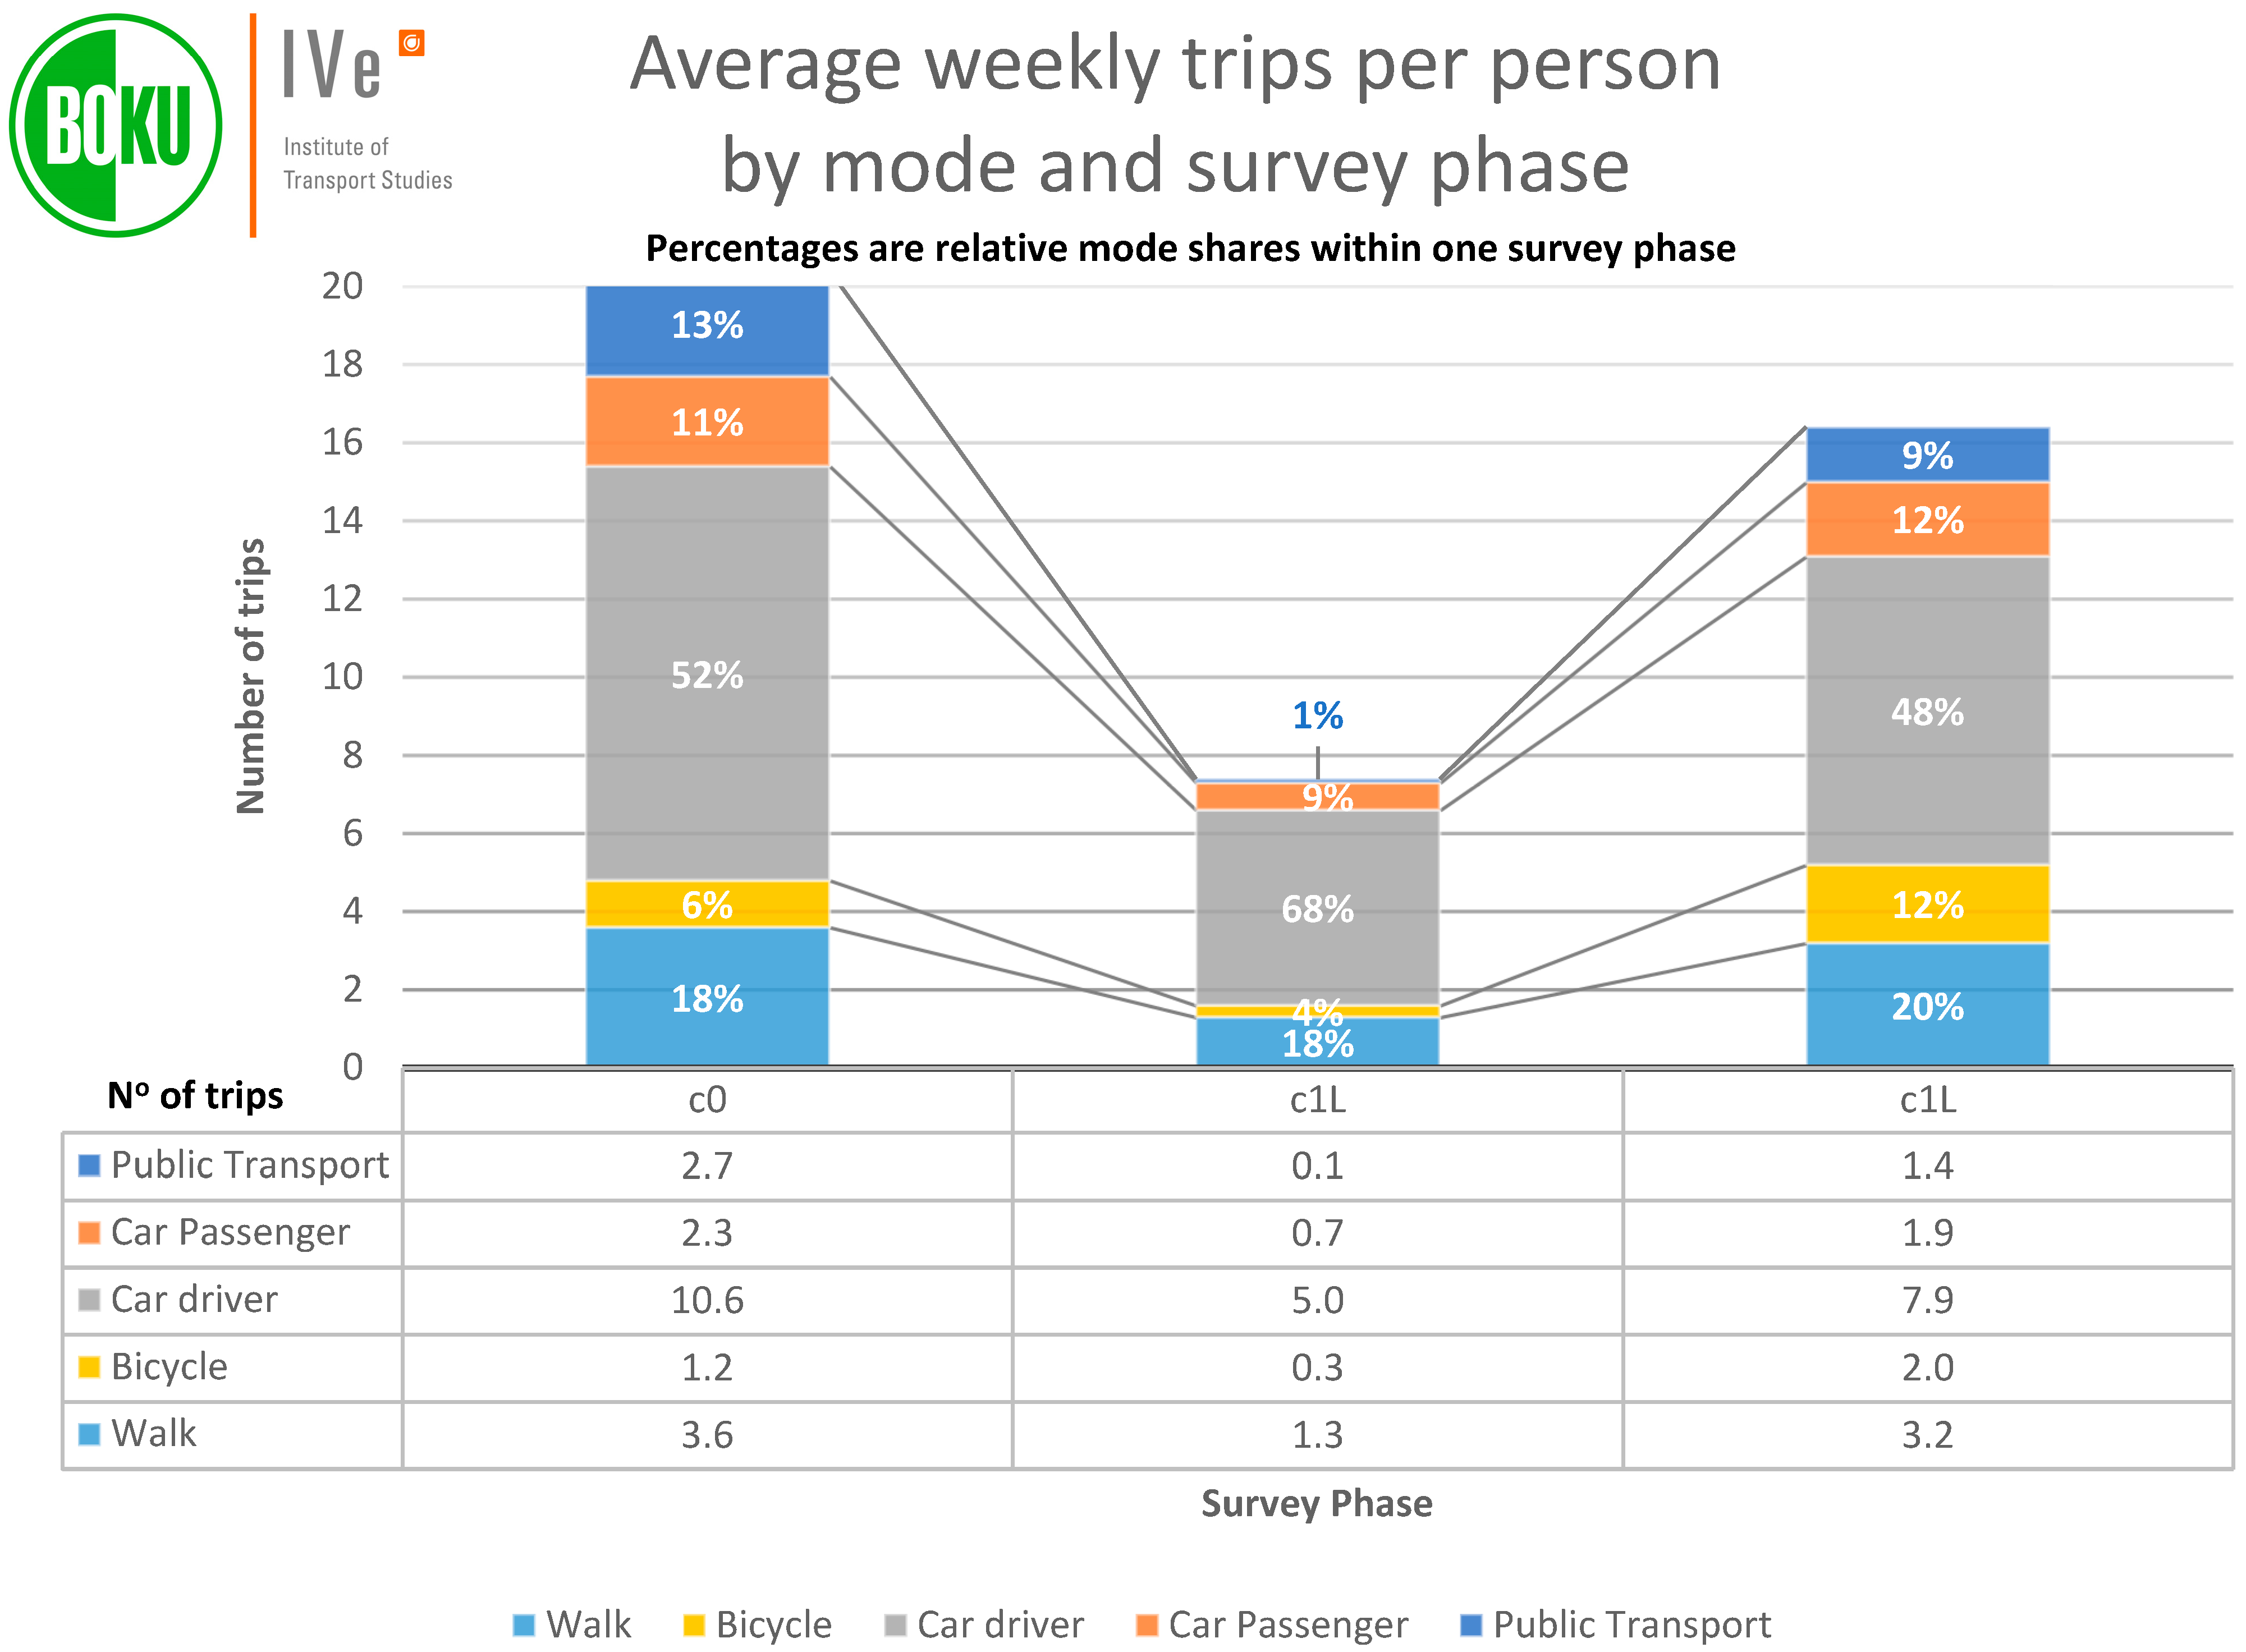
3.2. Mobility Indicators
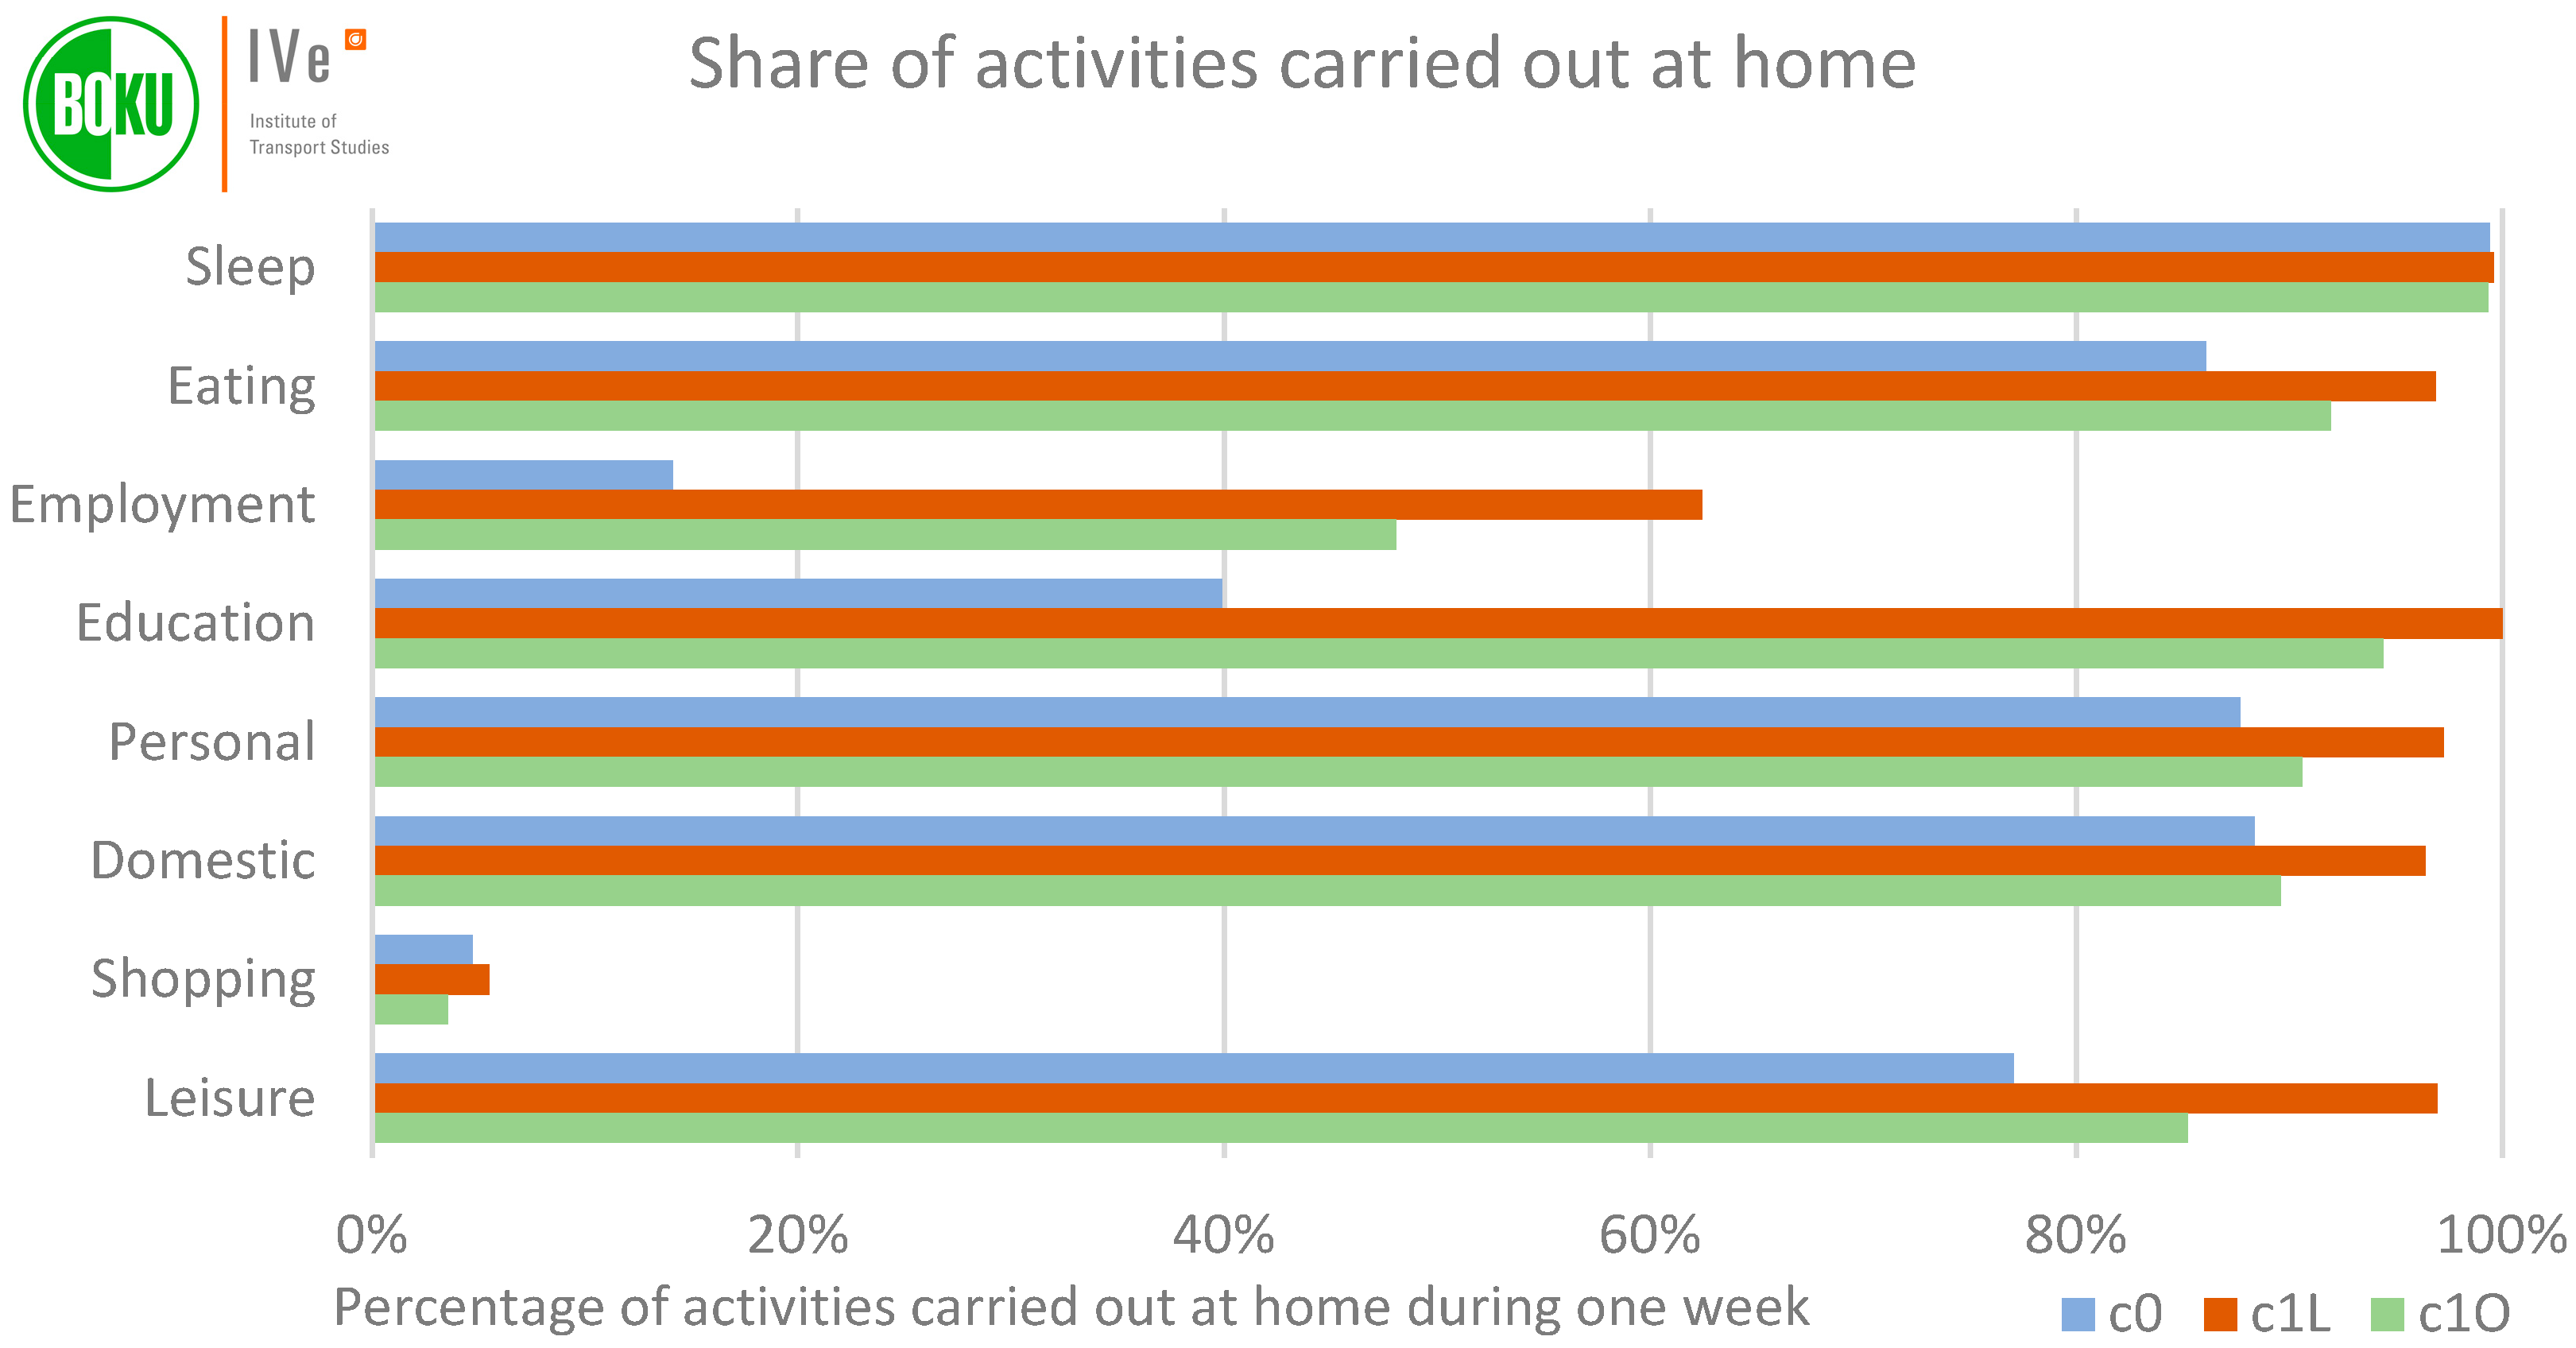
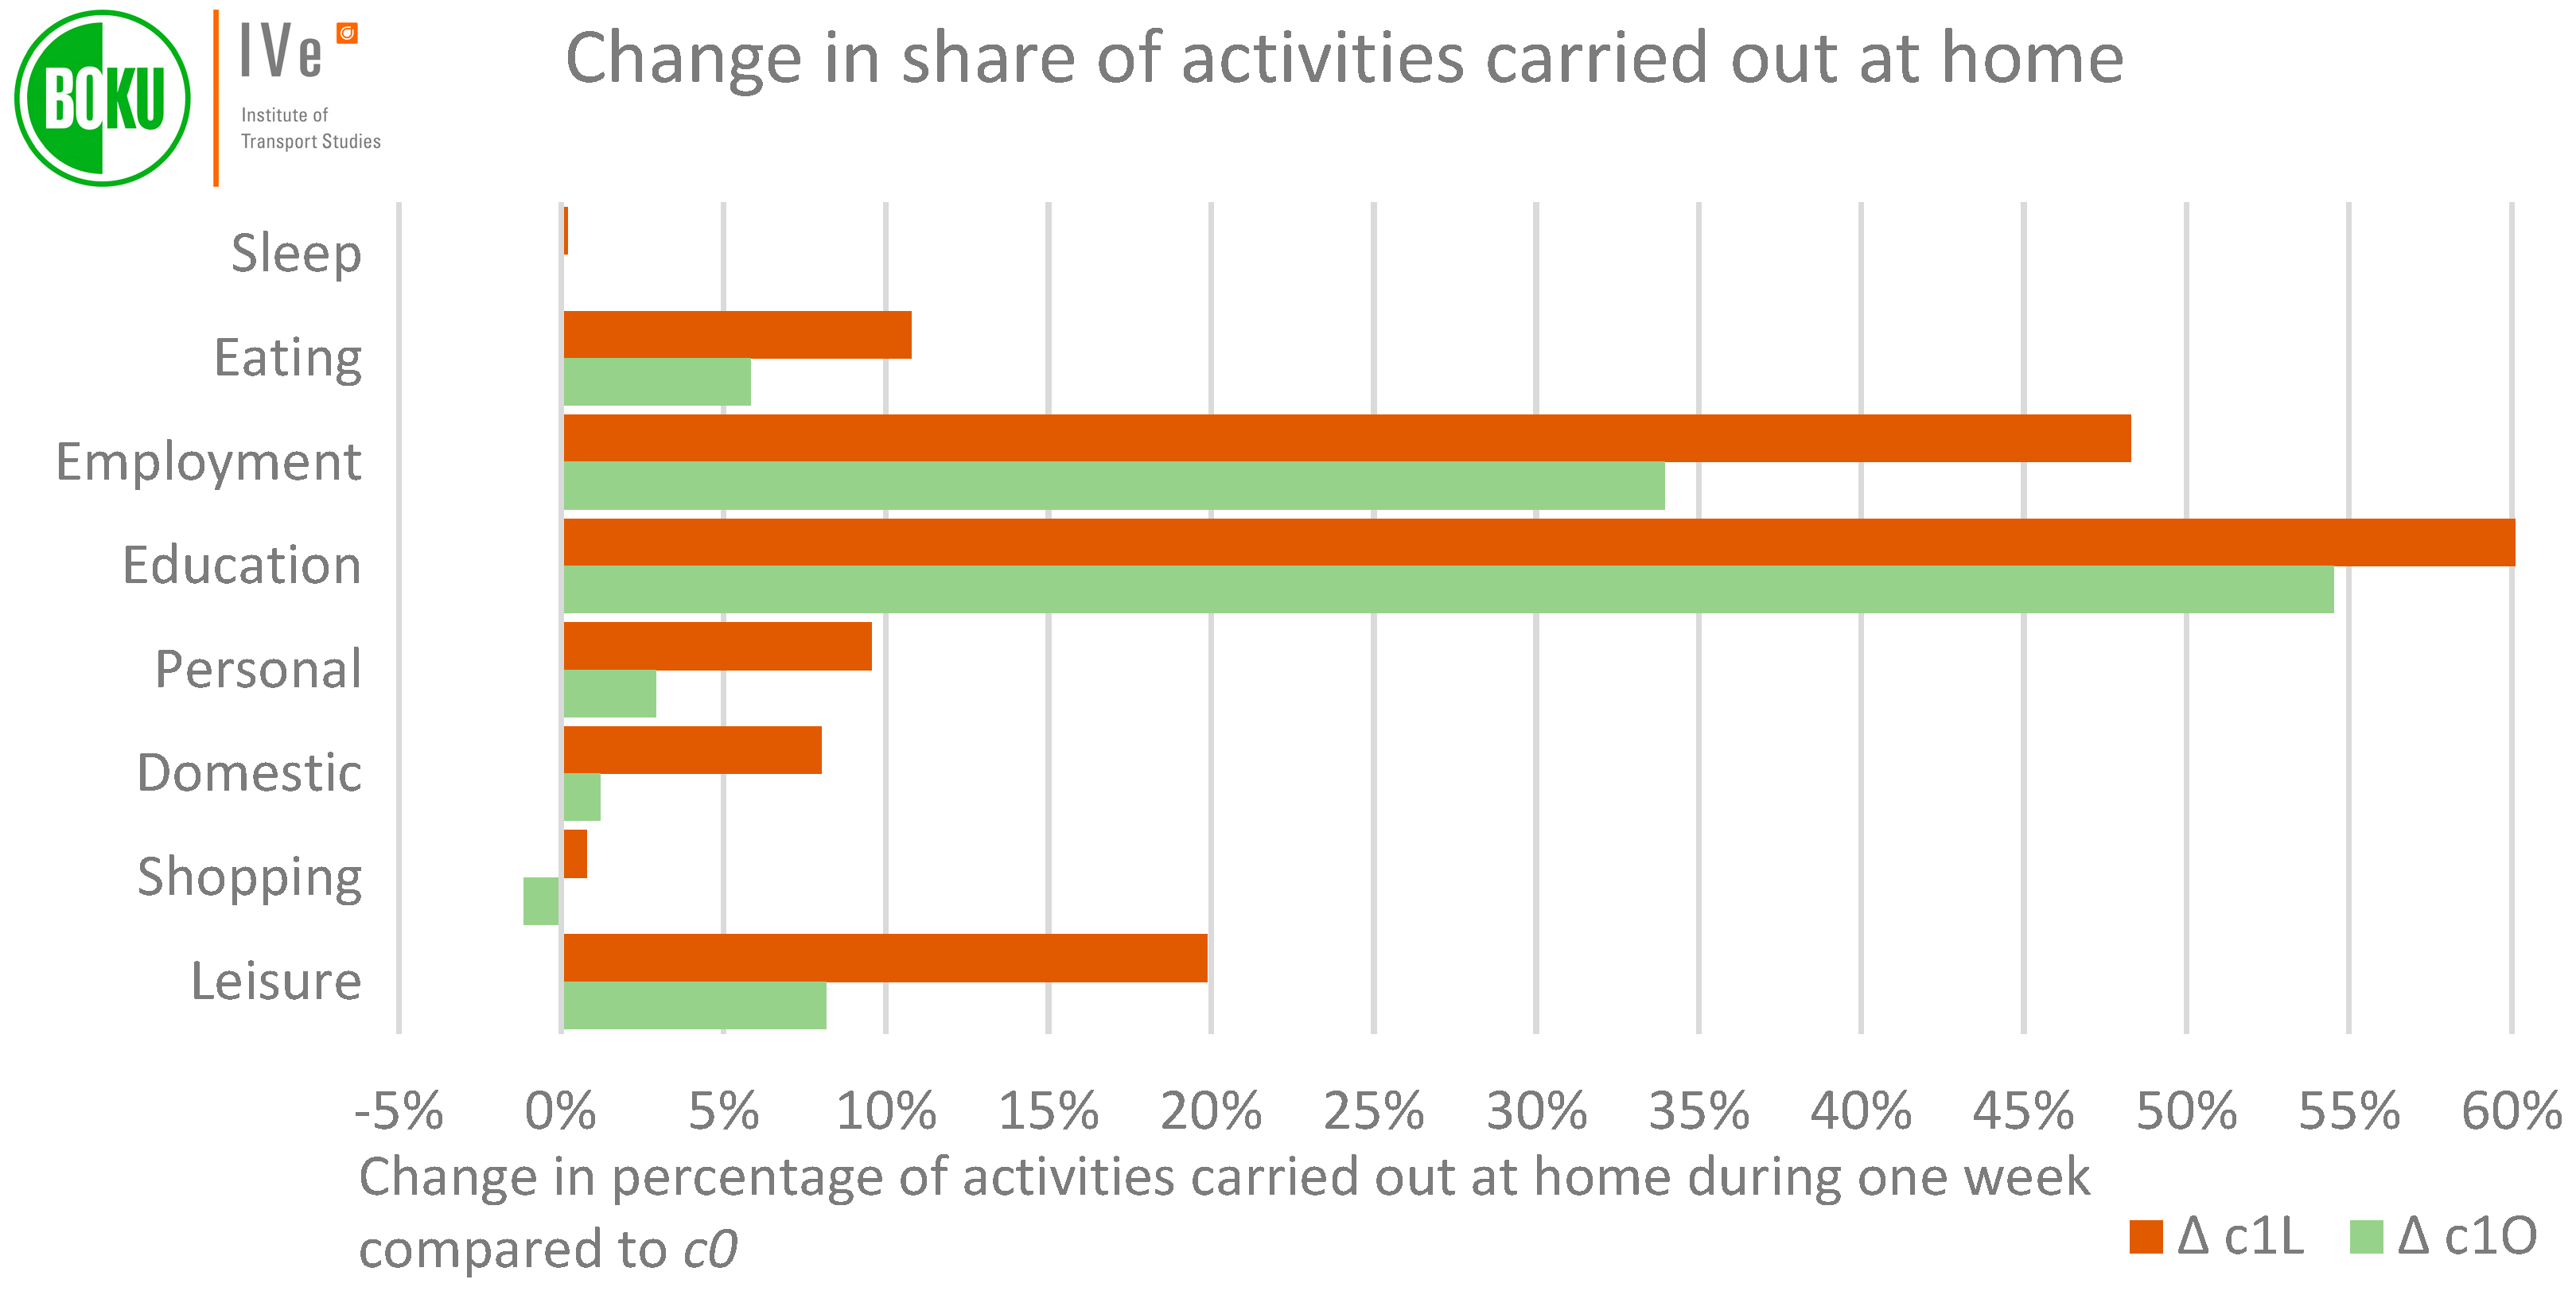
3.3. Share of in Activities Performed at Home
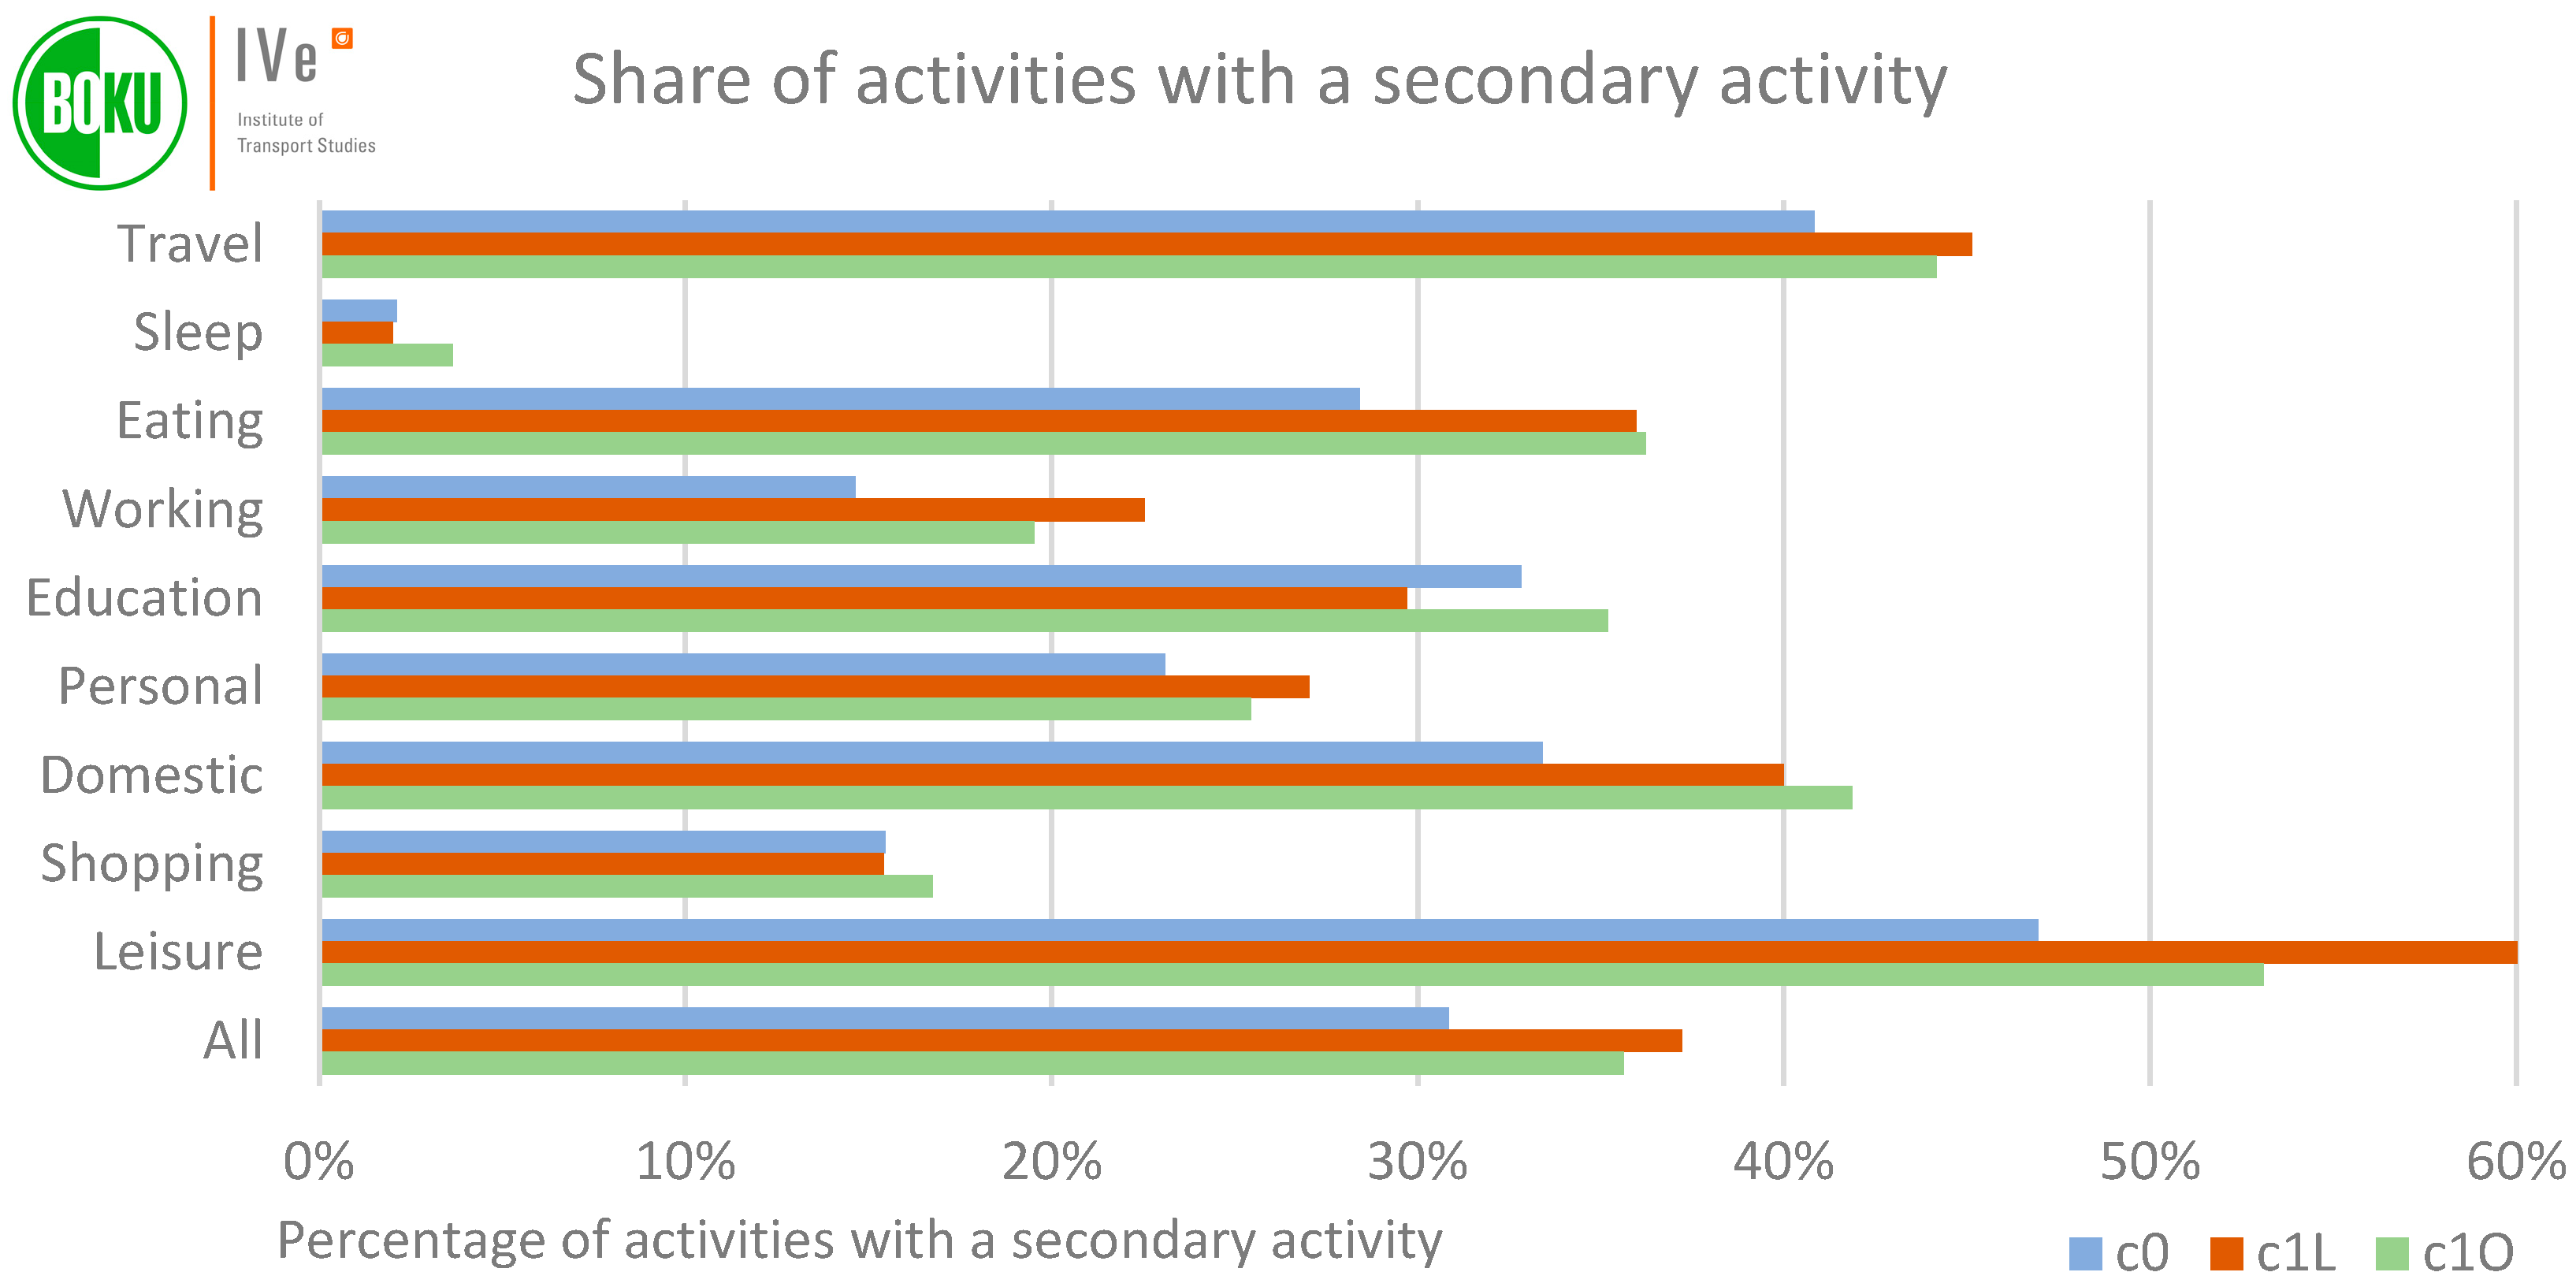
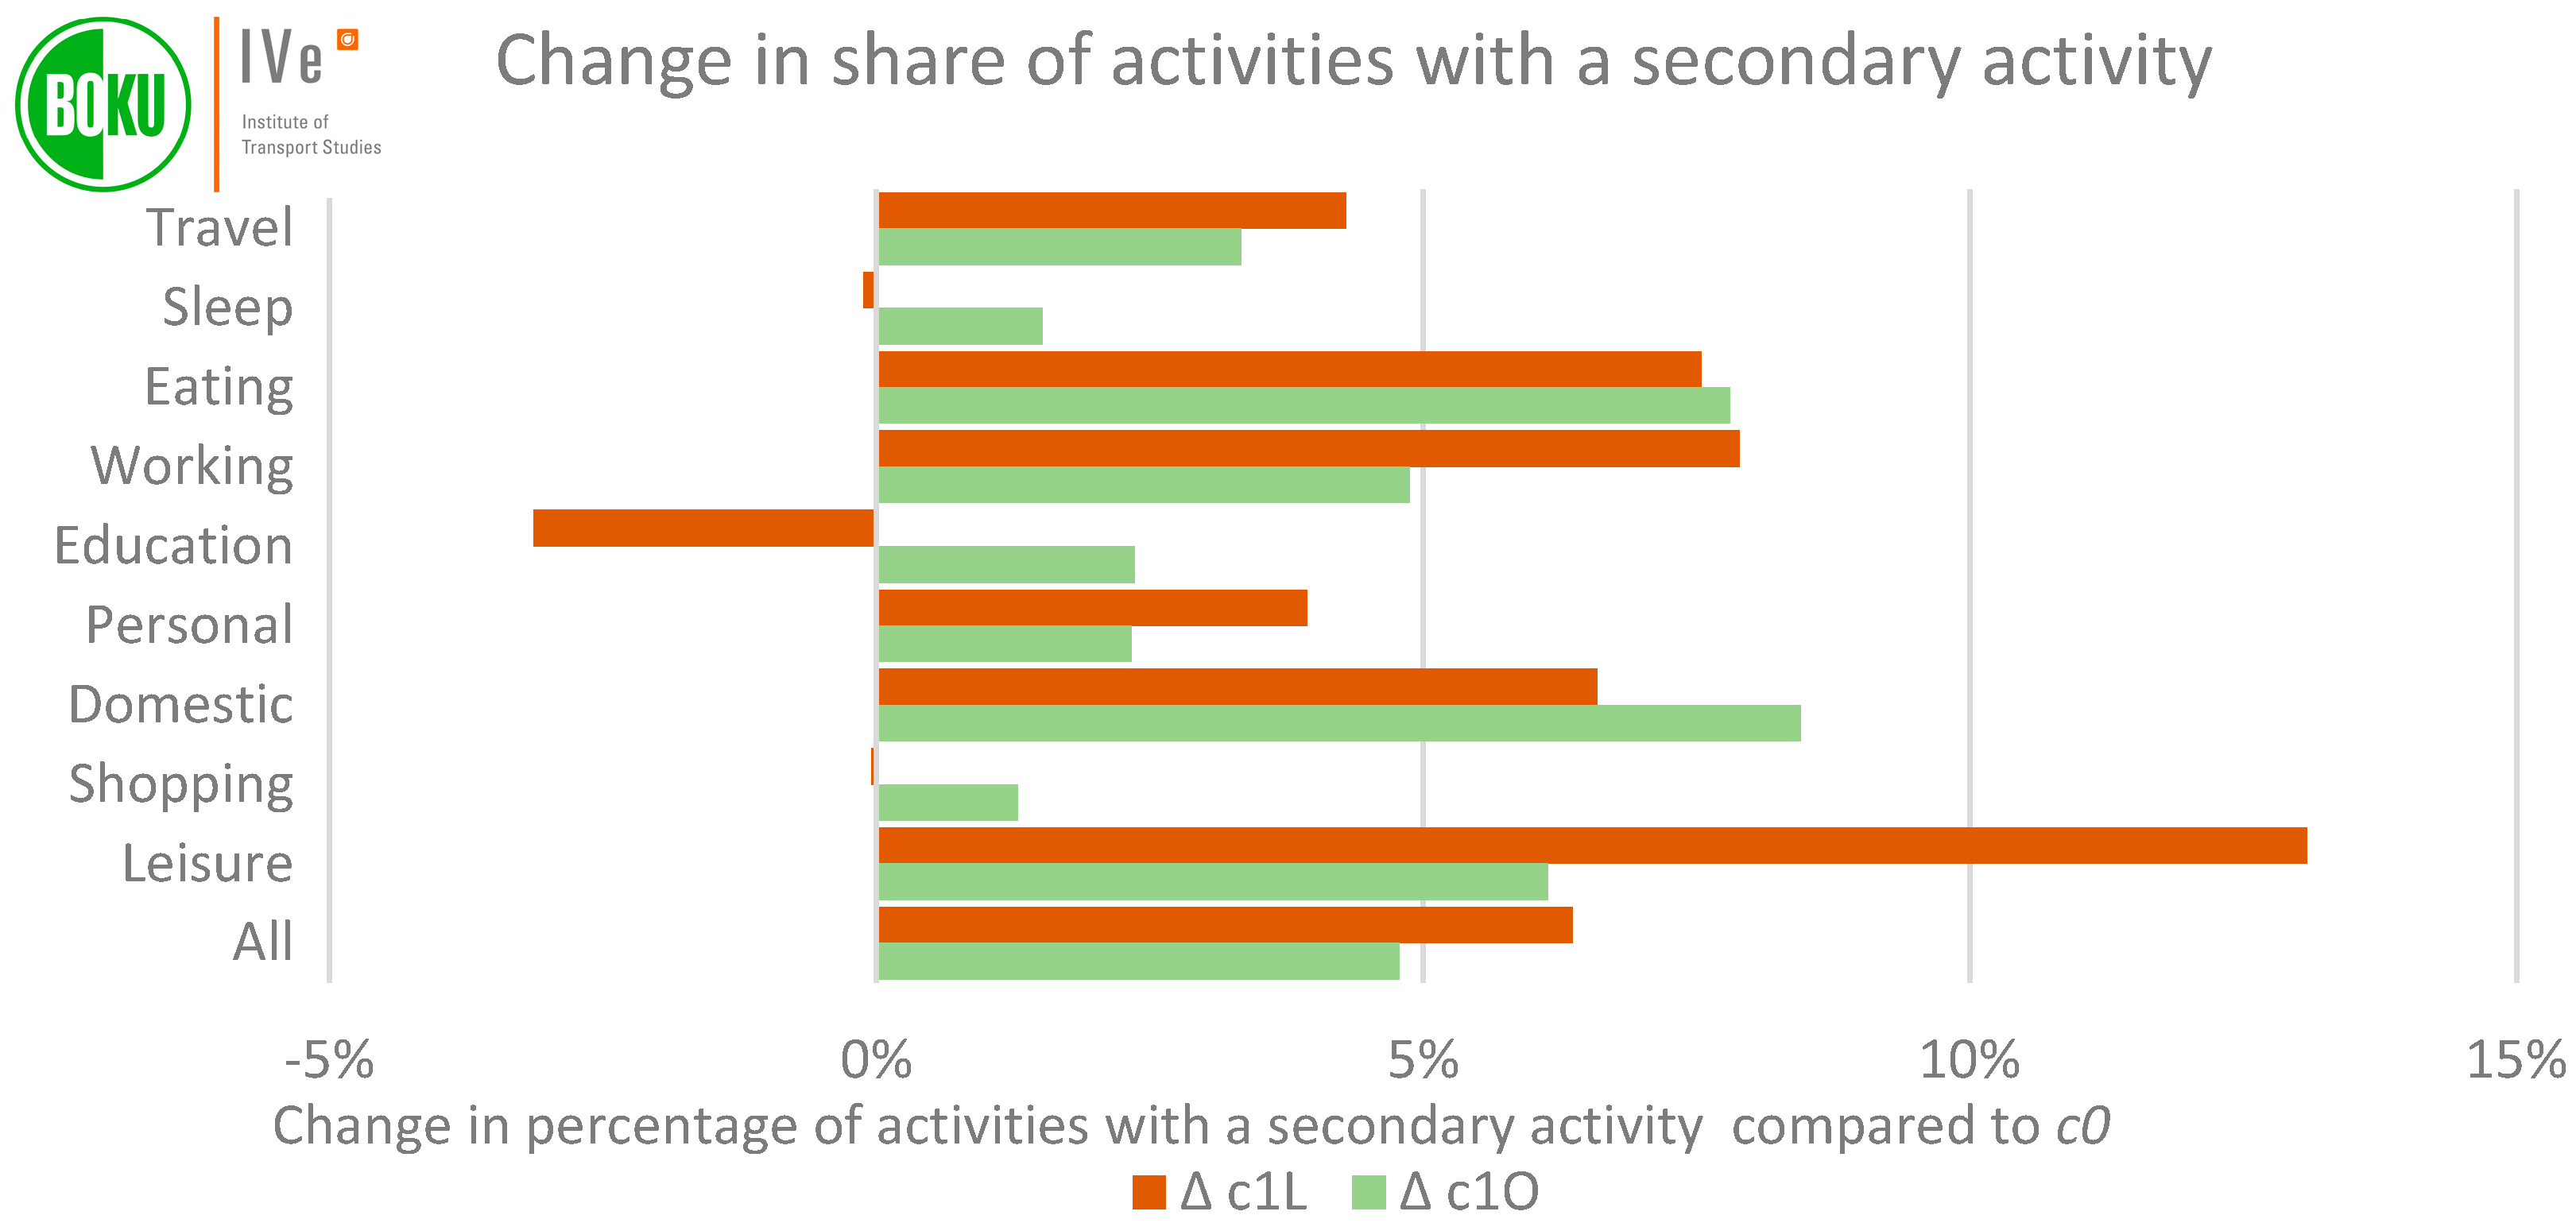
3.4. Secondary Activities
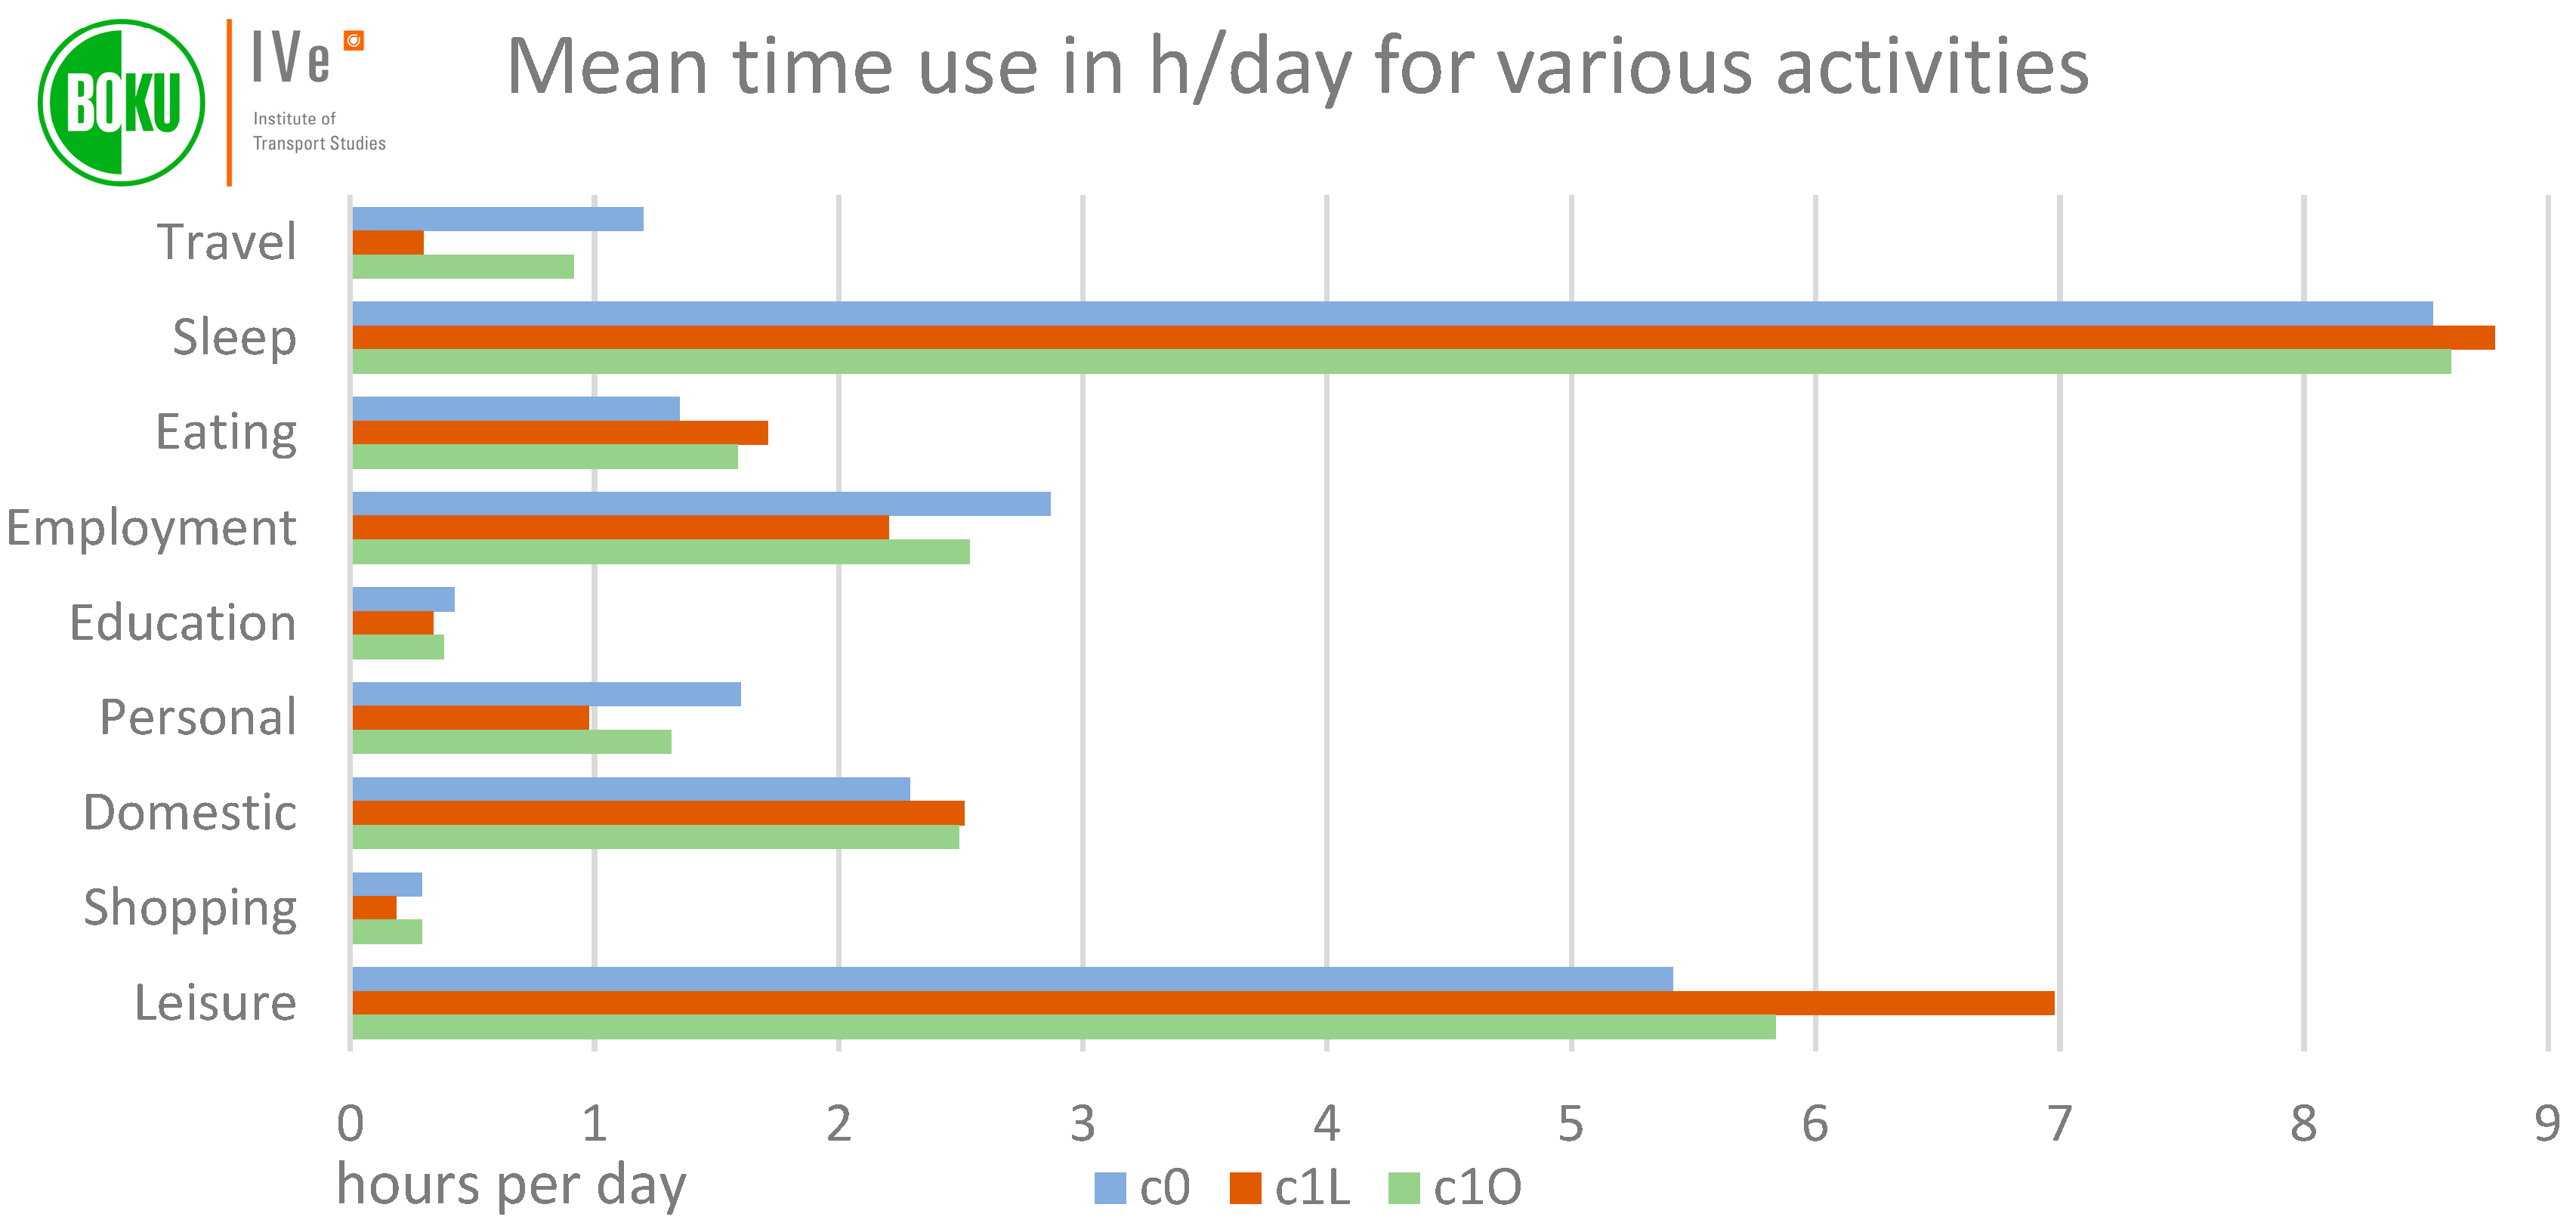
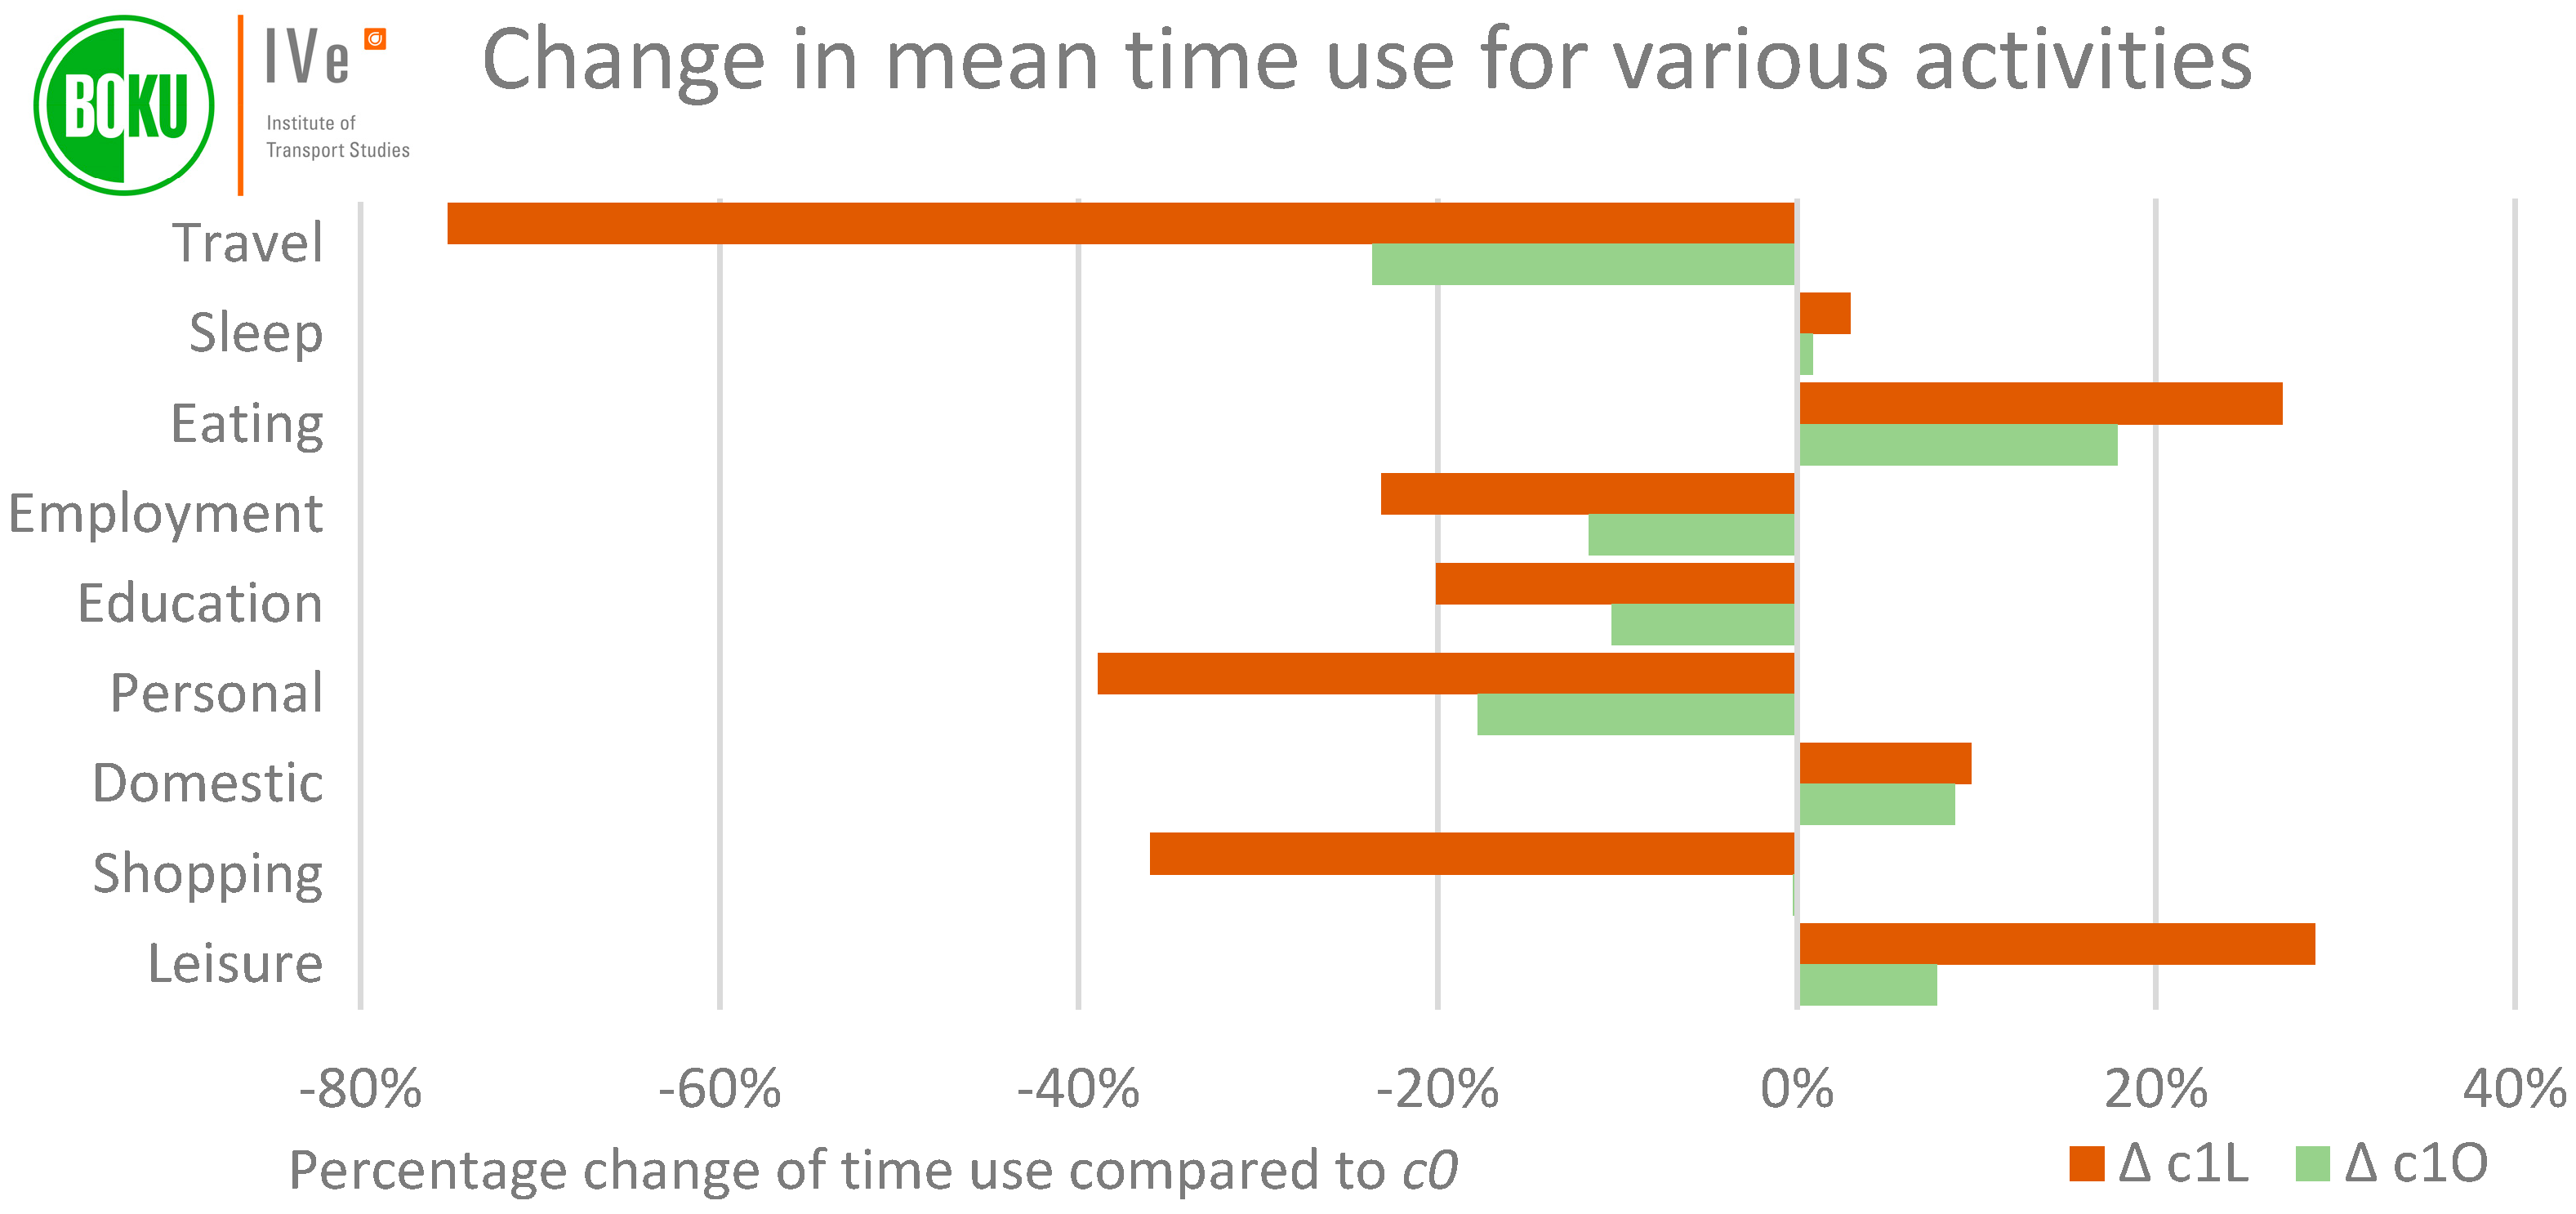
3.5. Shift in Time Use for Main Activities
3.6. Affectedness of Different Groups by Lockdown Measures
4. Discussion of Results
5. Conclusions
Author Contributions
Funding
Institutional Review Board Statement
Informed Consent Statement
Data Availability Statement
Acknowledgments
Conflicts of Interest
Appendix A

| Category | Question | Possible Answers |
|---|---|---|
| PS | Year of birth | Year: |
| Gender | Male | |
| Female | ||
| Height | in cm: | |
| Weight: | in kg: | |
| Highest completed education | No qualification (yet) | |
| Secondary school | ||
| Apprenticeship | ||
| High school | ||
| University | ||
| Type of employment | Student/apprentice | |
| Employed | ||
| Self-employed | ||
| Not employed | ||
| Regular working time before COVID-19 | h/week: | |
| Actual working time before COVID-19 | h/week: | |
| Regular working time during COVID-19 | h/week: | |
| Actual working time during COVID-19 | h/week: | |
| Net income from employment before COVID-19 | €/month: | |
| Net income from employment before COVID-19 | €/month: | |
| … from letting | ||
| … from capital investments | ||
| … from child benefits | ||
| … from student benefits | ||
| … from pension | ||
| … from unemployment benefits | ||
| HS | How many persons, including yourself, are living permanently in your household? | Total number: |
| … of which under 6 years: | ||
| … of which between 6 and 16 years: | ||
| … of which 16 years and older: | ||
| Address of the household | ||
| ME | How long does it take to walk from your dwelling to the following stops? | Bus: |
| Tram: | ||
| Subway: | ||
| Commuter/regional/long-distance train: | ||
| How many of the following vehicles do you have in your household? | Cars: | |
| Mopeds/motorbikes: | ||
| Bicycles: | ||
| … of which e-bikes: | ||
| Which cars are present in your household? | Make: | |
| Model: | ||
| Power [kW]: | ||
| Fuel type | Petrol | |
| Diesel | ||
| Electric | ||
| Hybrid | ||
| If privately-owned car: | Bought new | |
| Bought used | ||
| Received as gift | ||
| If company-owned car: | Private use permitted | |
| Private use not permitted | ||
| Driver’s licence | Car | |
| Motorbike | ||
| Bicycle availability | No | |
| Yes | ||
| Car availability | Always | |
| Sometimes | ||
| Never | ||
| Carsharing/rental car | No | |
| Yes | ||
| Motorbike/Scooter | No | |
| Yes | ||
| Availability of private parking at dwelling | No | |
| Yes | ||
| Availability of company parking at workplace | No | |
| Yes | ||
| Discount card for train travel owned? | No | |
| Yes | ||
| Public transport season ticket owned? | No | |
| Yes | ||
| TC | Trip start time | Date: |
| Time: | ||
| Trip end time | Date: | |
| Time: | ||
| Trip origin address | Street: | |
| No: | ||
| Locality: | ||
| Trip destination address | Street: | |
| No: | ||
| Locality: | ||
| Used modes of transport | Walking | |
| Kick scooter | ||
| Bicycle | ||
| E-Bike | ||
| Motorbike/moped | ||
| Car as driver | ||
| Car as passenger | ||
| Carsharing | ||
| Public Transport | ||
| Other (taxi, ride-hailing, airplane,…) | ||
| Used electronic devices | Route planning or navigation device | |
| Online ticketing or booking | ||
| Who else was present during the trip? | No one else | |
| Partner | ||
| Children under 10 years | ||
| Other household member | ||
| Other acquaintance | ||
| What else did you do during the trip (secondary activities)? | ||
| AC | Activity at destination start time | Time: |
| Activity at destination end time | Time: | |
| Activity category | Sleep | |
| Eating | ||
| Employed work | ||
| Education | ||
| Personal | ||
| Domestic | ||
| Shopping | ||
| Leisure | ||
| Other | ||
| How high was the level of physical activity during this activity? | Low | |
| Medium | ||
| High | ||
| What else did you do during this activity (secondary activities)? |
| Activity Category | Description |
|---|---|
| Sleep | All sleep, including naps during the day. |
| Eating | Consumption of food. Cooking of food falls into category domestic. |
| Employment | Paid work, also when self-employed. Unpaid work falls into category domestic (care work, household work) or leisure (volunteering). |
| Education | Education in a school, university or apprenticeship. Personal self-improvement classes (e.g., language courses) fall into category leisure. |
| Personal | Personal activities that cannot be transferred to another person (e.g., personal hygiene, doctor’s appointments, banking transactions). |
| Domestic | Work pertaining to the household (e.g., cooking, laundry, home repairs, washing the car). |
| Shopping | Buying of groceries and other goods, in-store as well as online. |
| Leisure | Activities, performed for pleasure (e.g., sports, meeting friends, church, watching TV) and voluntary help (e.g., helping neighbours, volunteer work). |
| MAED All Phases | c0 Only (n = 260) | c1L Only (n = 101) | c1O Only (n = 188) | Statistics Austria (STAT) | Difference (STAT to All Phases) | |
|---|---|---|---|---|---|---|
| Household size (persons) | ||||||
| 1 | 30.6 | 28.8 | 32.7 | 31.9 | 37.8 | −7.2 |
| 2 | 36.6 | 37.3 | 41.6 | 33.0 | 30.4 | +6.2 |
| 3 | 15.7 | 18.1 | 8.9 | 16.0 | 14.6 | +1.1 |
| 4 | 14.9 | 12.7 | 14.9 | 18.1 | 11.3 | +3.7 |
| >4 | 2.2 | 3.1 | 2.0 | 1.1 | 6.0 | −3.8 |
| Household members aged < 15 | ||||||
| 0 | 76.2 | 75.4 | 81.2 | 74.5 | 81.0 | −4.8 |
| 1 | 11.3 | 13.5 | 7.9 | 10.1 | 10.0 | +1.3 |
| 2 | 10.9 | 8.8 | 8.9 | 14.9 | 7.0 | +3.9 |
| >3 | 1.6 | 2.3 | 2.0 | 0.5 | 2.0 | −0.4 |
| Federal state | ||||||
| Burgenland | 4.2 | 4.2 | 5.0 | 3.7 | 3.2 | +1.0 |
| Lower Austria | 24.4 | 23.8 | 26.7 | 23.9 | 18.5 | +5.9 |
| Vienna | 20.9 | 23.1 | 14.9 | 21.3 | 23.0 | −2.1 |
| Carinthia | 6.2 | 5.0 | 9.9 | 5.9 | 6.4 | −0.2 |
| Styria | 13.7 | 13.8 | 15.8 | 12.2 | 13.9 | −0.3 |
| Upper Austria | 15.1 | 16.9 | 12.9 | 13.8 | 16.2 | −1.1 |
| Salzburg | 3.6 | 3.1 | 2.0 | 5.3 | 6.1 | −2.5 |
| Tyrol | 8.4 | 8.5 | 6.9 | 9.0 | 8.4 | ±0.0 |
| Vorarlberg | 3.5 | 1.5 | 5.9 | 4.8 | 4.3 | −0.8 |
| MAED All Phases | c0 Only (n = 441) | c1L Only (n = 166) | c1O Only (n = 249) | Statistics Austria (STAT) | Difference (STAT to All Phases) | |
|---|---|---|---|---|---|---|
| Gender | ||||||
| Male | 44.4 | 43.8 | 46.4 | 44.2 | 49.2 | −4.8 |
| Female | 55.6 | 56.2 | 53.6 | 55.8 | 50.8 | +4.8 |
| Age | ||||||
| 16–19 | 2.3 | 1.8 | 4.2 | 2.0 | 5.7 | −3.4 |
| 20–29 | 13.5 | 13.4 | 14.5 | 13.3 | 14.4 | −0.9 |
| 30–39 | 18.6 | 20.9 | 15.7 | 17.0 | 16.1 | +2.6 |
| 40–49 | 17.4 | 14.3 | 21.1 | 20.1 | 15.4 | +2.0 |
| 50–59 | 20.8 | 23.4 | 15.1 | 20.1 | 18.3 | +2.5 |
| 60+ | 27.3 | 26.3 | 29.5 | 27.6 | 30.1 | −2.8 |
| Type of employment | ||||||
| Employed | 53.3 | 52.8 | 55.4 | 52.7 | 43.1 | +10.1 |
| Self-employed | 6.9 | 6.8 | 5.4 | 7.8 | 6.0 | +0.9 |
| Not employed | 39.8 | 40.4 | 39.2 | 39.5 | 50.9 | −11.0 |
| Highest degree of education | ||||||
| Compulsory school | 8.5 | 9.1 | 8.4 | 7.8 | 17.6 | −9.1 |
| Apprenticeship | 42.1 | 42.4 | 40.4 | 42.5 | 49.9 | −7.9 |
| High school | 22.3 | 21.5 | 27.1 | 20.7 | 16.0 | +6.3 |
| University | 27.1 | 27.0 | 24.1 | 28.9 | 16.5 | +10.6 |
| Level of urbanisation | ||||||
| Urban | 27.5 | 29.3 | 19.3 | 29.6 | 31.4 | −3.9 |
| Intermediate | 31.3 | 32.2 | 38.6 | 25.9 | 30.8 | +0.5 |
| Rural | 41.2 | 38.5 | 42.2 | 44.6 | 37.8 | +3.4 |
| c0 vs. c1L | c0 vs. c1O | ||||||
|---|---|---|---|---|---|---|---|
| Dependent Variable (y) | Moderator Variable (z) | ||||||
| Domestic | Age | 0.304 | 0.036 | 0.94 | 0.294 | 0.015 | 0.43 |
| Domestic | No. of visited destinations per week | 0.040 | 0.039 | 0.97 | 0.006 | −0.020 | −0.55 |
| Domestic | University educated | −0.067 | 0.005 | 0.13 | −0.091 | −0.022 | −0.59 |
| Domestic | Employed | −0.265 | 0.036 | 0.92 | −0.238 | 0.063 | 1.77 |
| Domestic | Gender | 0.288 | −0.077 | −1.98 | 0.310 | −0.033 | −0.95 |
| Domestic | Household urbanity | 0.230 | −0.041 | −1.04 | 0.253 | −0.013 | −0.37 |
| Domestic | Income | −0.206 | 0.046 | 1.17 | −0.160 | 0.094 | 2.61 |
| Domestic | Current workplace flexibility | −0.217 | −0.009 | −0.23 | −0.166 | 0.050 | 1.39 |
| Domestic | Max workplace flexibility | −0.221 | 0.002 | 0.06 | −0.175 | 0.062 | 1.71 |
| Domestic | Physical activity at job | −0.245 | 0.018 | 0.45 | −0.193 | 0.078 | 2.17 |
| Domestic | Driver’s license owned | 0.020 | 0.001 | 0.03 | 0.055 | 0.051 | 1.39 |
| Domestic | Car availability | 0.054 | 0.030 | 0.73 | 0.081 | 0.051 | 1.38 |
| Domestic | All persons in hh | 0.068 | −0.015 | −0.36 | 0.063 | −0.018 | −0.48 |
| Domestic | Persons under 16 in hh | 0.115 | 0.015 | 0.36 | 0.150 | 0.049 | 1.34 |
| Domestic | Person under 6 in hh | 0.186 | −0.017 | −0.44 | 0.206 | 0.010 | 0.27 |
| Domestic | Discount card train owned | −0.049 | 0.019 | 0.48 | −0.093 | −0.033 | −0.90 |
| Domestic | Discount card local PT owned | −0.156 | −0.009 | −0.22 | −0.211 | −0.061 | −1.70 |
| Domestic | Effective current working time | −0.378 | −0.013 | −0.35 | −0.311 | 0.099 | 2.86 |
| Domestic | Regular current working time | −0.379 | 0.007 | 0.20 | −0.314 | 0.115 | 3.32 |
| Eating | Age | 0.174 | −0.029 | −0.74 | 0.252 | 0.059 | 1.69 |
| Eating | No. of visited destinations per week | −0.068 | −0.025 | −0.62 | −0.020 | 0.046 | 1.27 |
| Eating | University educated | −0.013 | −0.015 | −0.38 | −0.003 | 0.002 | 0.05 |
| Eating | Employed | −0.196 | 0.000 | 0.00 | −0.207 | 0.002 | 0.07 |
| Eating | Gender | 0.030 | −0.025 | −0.64 | 0.054 | 0.007 | 0.20 |
| Eating | Household urbanity | 0.091 | 0.005 | 0.12 | 0.057 | −0.048 | −1.33 |
| Eating | Income | −0.024 | −0.028 | −0.72 | −0.013 | −0.007 | −0.20 |
| Eating | Current workplace flexibility | −0.097 | 0.028 | 0.71 | −0.122 | 0.002 | 0.06 |
| Eating | Max workplace flexibility | −0.141 | 0.011 | 0.27 | −0.161 | 0.003 | 0.08 |
| Eating | Physical activity at job | −0.132 | 0.013 | 0.32 | −0.133 | 0.015 | 0.43 |
| Eating | Driver’s license owned | 0.083 | −0.021 | −0.53 | 0.092 | −0.008 | −0.22 |
| Eating | Car availability | 0.097 | −0.002 | −0.06 | 0.076 | −0.036 | −0.99 |
| Eating | All persons in hh | 0.021 | 0.066 | 1.67 | −0.028 | −0.008 | −0.21 |
| Eating | Persons under 16 in hh | 0.021 | 0.169 | 4.31 | −0.041 | 0.044 | 1.22 |
| Eating | Person under 6 in hh | 0.070 | 0.043 | 1.10 | 0.028 | −0.031 | −0.86 |
| Eating | Discount card train owned | 0.042 | 0.033 | 0.84 | 0.048 | 0.029 | 0.79 |
| Eating | Discount card local PT owned | −0.103 | −0.005 | −0.12 | −0.099 | 0.014 | 0.39 |
| Eating | Effective current working time | −0.229 | −0.016 | −0.42 | −0.210 | 0.046 | 1.31 |
| Eating | Regular current working time | −0.230 | 0.009 | 0.23 | −0.225 | 0.053 | 1.51 |
| Education | Age | −0.387 | 0.029 | 0.76 | −0.372 | 0.009 | 0.27 |
| Education | No. of visited destinations per week | −0.111 | −0.057 | −1.40 | −0.048 | 0.038 | 1.04 |
| Education | University educated | −0.011 | 0.008 | 0.19 | 0.049 | 0.075 | 2.05 |
| Education | Employed | −0.164 | 0.015 | 0.38 | −0.209 | −0.054 | −1.51 |
| Education | Gender | −0.025 | 0.003 | 0.08 | −0.032 | −0.009 | −0.23 |
| Education | Household urbanity | −0.141 | 0.006 | 0.14 | −0.147 | −0.007 | −0.18 |
| Education | Income | −0.306 | 0.017 | 0.44 | −0.295 | 0.001 | 0.03 |
| Education | Current workplace flexibility | −0.090 | 0.025 | 0.61 | −0.103 | −0.002 | −0.05 |
| Education | Max workplace flexibility | −0.119 | 0.020 | 0.49 | −0.093 | 0.039 | 1.06 |
| Education | Physical activity at job | −0.073 | −0.030 | −0.75 | −0.085 | −0.046 | −1.24 |
| Education | Driver’s license owned | −0.160 | 0.009 | 0.22 | −0.143 | 0.007 | 0.19 |
| Education | Car availability | −0.215 | −0.020 | −0.51 | −0.156 | 0.045 | 1.25 |
| Education | All persons in hh | 0.049 | 0.048 | 1.19 | 0.011 | −0.008 | −0.23 |
| Education | Persons under 16 in hh | −0.033 | 0.054 | 1.33 | −0.065 | −0.006 | −0.17 |
| Education | Person under 6 in hh | −0.060 | −0.018 | −0.43 | −0.043 | 0.008 | 0.21 |
| Education | Discount card train owned | 0.090 | −0.021 | −0.51 | 0.086 | −0.016 | −0.42 |
| Education | Discount card local PT owned | 0.278 | 0.059 | 1.51 | 0.240 | −0.002 | −0.04 |
| Education | Effective current working time | −0.133 | 0.004 | 0.10 | −0.134 | 0.005 | 0.13 |
| Education | Regular current working time | −0.142 | −0.012 | −0.29 | −0.141 | 0.002 | 0.05 |
| Leisure | Age | 0.142 | −0.081 | −2.12 | 0.145 | −0.060 | −1.67 |
| Leisure | No. of visited destinations per week | −0.051 | −0.015 | −0.39 | −0.048 | −0.004 | −0.11 |
| Leisure | University educated | −0.156 | −0.017 | −0.43 | −0.097 | 0.064 | 1.77 |
| Leisure | Employed | −0.267 | 0.016 | 0.43 | −0.247 | 0.041 | 1.15 |
| Leisure | Gender | −0.064 | −0.003 | −0.07 | −0.078 | −0.018 | −0.50 |
| Leisure | Household urbanity | −0.017 | −0.057 | −1.47 | 0.007 | −0.010 | −0.28 |
| Leisure | Income | −0.092 | −0.021 | −0.56 | −0.025 | 0.069 | 1.89 |
| Leisure | Current workplace flexibility | −0.168 | 0.076 | 2.01 | −0.203 | 0.024 | 0.66 |
| Leisure | Max workplace flexibility | −0.191 | 0.065 | 1.70 | −0.195 | 0.053 | 1.48 |
| Leisure | Physical activity at job | −0.194 | −0.024 | −0.65 | −0.226 | −0.067 | −1.87 |
| Leisure | Driver’s license owned | −0.022 | 0.017 | 0.44 | −0.054 | −0.030 | −0.83 |
| Leisure | Car availability | −0.027 | −0.060 | −1.56 | −0.004 | −0.017 | −0.46 |
| Leisure | All persons in hh | −0.128 | 0.006 | 0.17 | −0.103 | 0.035 | 0.97 |
| Leisure | Persons under 16 in hh | −0.165 | −0.001 | −0.03 | −0.180 | −0.012 | −0.34 |
| Leisure | Person under 6 in hh | −0.102 | 0.017 | 0.45 | −0.127 | −0.018 | −0.49 |
| Leisure | Discount card train owned | 0.010 | 0.063 | 1.64 | −0.014 | 0.021 | 0.56 |
| Leisure | Discount card local PT owned | −0.020 | 0.051 | 1.31 | −0.042 | 0.010 | 0.27 |
| Leisure | Effective current working time | −0.266 | −0.028 | −0.75 | −0.233 | 0.043 | 1.21 |
| Leisure | Regular current working time | −0.248 | 0.030 | 0.80 | −0.222 | 0.076 | 2.13 |
| Personal | Age | 0.114 | 0.016 | 0.41 | 0.137 | 0.041 | 1.14 |
| Personal | No. of visited destinations per week | 0.024 | −0.002 | −0.06 | 0.059 | 0.039 | 1.06 |
| Personal | University educated | 0.005 | 0.004 | 0.11 | −0.056 | −0.069 | −1.89 |
| Personal | Employed | −0.113 | −0.012 | −0.30 | −0.160 | −0.064 | −1.78 |
| Personal | Gender | −0.008 | 0.010 | 0.24 | 0.025 | 0.047 | 1.30 |
| Personal | Household urbanity | 0.028 | 0.019 | 0.48 | −0.009 | −0.032 | −0.86 |
| Personal | Income | −0.003 | 0.001 | 0.02 | −0.083 | −0.101 | −2.78 |
| Personal | Current workplace flexibility | −0.051 | −0.013 | −0.33 | −0.076 | −0.038 | −1.05 |
| Personal | Max workplace flexibility | −0.097 | −0.010 | −0.25 | −0.130 | −0.039 | −1.06 |
| Personal | Physical activity at job | −0.076 | 0.016 | 0.40 | −0.103 | −0.027 | −0.75 |
| Personal | Driver’s license owned | −0.050 | 0.008 | 0.20 | −0.079 | −0.038 | −1.03 |
| Personal | Car availability | −0.041 | 0.009 | 0.21 | −0.067 | −0.022 | −0.61 |
| Personal | All persons in hh | −0.107 | −0.028 | −0.72 | −0.101 | −0.016 | −0.43 |
| Personal | Persons under 16 in hh | −0.060 | −0.031 | −0.79 | −0.073 | −0.035 | −0.95 |
| Personal | Person under 6 in hh | −0.044 | −0.040 | −1.01 | −0.062 | −0.051 | −1.39 |
| Personal | Discount card train owned | 0.003 | −0.038 | −0.95 | 0.020 | −0.009 | −0.26 |
| Personal | Discount card local PT owned | −0.074 | 0.001 | 0.03 | −0.035 | 0.050 | 1.38 |
| Personal | Effective current working time | −0.131 | 0.001 | 0.03 | −0.175 | −0.034 | −0.95 |
| Personal | Regular current working time | −0.136 | 0.002 | 0.06 | −0.167 | −0.012 | −0.35 |
| Shopping | Age | 0.155 | −0.048 | −1.20 | 0.173 | −0.007 | −0.18 |
| Shopping | No. of visited destinations per week | 0.283 | 0.025 | 0.64 | 0.252 | −0.011 | −0.31 |
| Shopping | University educated | 0.025 | 0.006 | 0.16 | −0.009 | −0.036 | −0.98 |
| Shopping | Employed | −0.151 | 0.049 | 1.23 | −0.177 | −0.001 | −0.03 |
| Shopping | Gender | 0.151 | −0.101 | −2.57 | 0.196 | −0.015 | −0.41 |
| Shopping | Household urbanity | −0.018 | 0.039 | 0.97 | −0.046 | −0.008 | −0.21 |
| Shopping | Income | −0.043 | 0.057 | 1.42 | −0.055 | 0.025 | 0.67 |
| Shopping | Current workplace flexibility | −0.108 | 0.057 | 1.44 | −0.104 | 0.044 | 1.20 |
| Shopping | Max workplace flexibility | −0.097 | 0.041 | 1.04 | −0.116 | 0.010 | 0.26 |
| Shopping | Physical activity at job | −0.111 | 0.004 | 0.11 | −0.093 | 0.020 | 0.53 |
| Shopping | Driver’s license owned | 0.057 | −0.002 | −0.04 | −0.001 | −0.074 | −2.02 |
| Shopping | Car availability | 0.025 | 0.040 | 1.01 | −0.031 | −0.037 | −1.01 |
| Shopping | All persons in hh | −0.180 | 0.010 | 0.25 | −0.171 | 0.010 | 0.29 |
| Shopping | Persons under 16 in hh | −0.113 | 0.047 | 1.17 | −0.120 | 0.023 | 0.63 |
| Shopping | Person under 6 in hh | −0.095 | 0.044 | 1.10 | −0.086 | 0.040 | 1.09 |
| Shopping | Discount card train owned | 0.027 | −0.073 | −1.83 | 0.060 | −0.016 | −0.42 |
| Shopping | Discount card local PT owned | −0.037 | −0.047 | −1.17 | −0.019 | −0.009 | −0.25 |
| Shopping | Effective current working time | −0.207 | 0.060 | 1.53 | −0.209 | 0.048 | 1.33 |
| Shopping | Regular current working time | −0.196 | 0.076 | 1.95 | −0.212 | 0.048 | 1.35 |
| Sleeping | Age | 0.105 | −0.099 | −2.46 | 0.086 | −0.098 | −2.68 |
| Sleeping | No. of visited destinations per week | −0.200 | −0.036 | −0.89 | −0.164 | 0.023 | 0.62 |
| Sleeping | University educated | −0.078 | −0.033 | −0.81 | −0.059 | 0.002 | 0.05 |
| Sleeping | Employed | −0.350 | 0.042 | 1.11 | −0.310 | 0.082 | 2.36 |
| Sleeping | Gender | 0.130 | −0.062 | −1.54 | 0.097 | −0.087 | −2.39 |
| Sleeping | Household urbanity | 0.010 | −0.035 | −0.87 | 0.009 | −0.026 | −0.70 |
| Sleeping | Income | −0.227 | −0.012 | −0.30 | −0.213 | 0.006 | 0.17 |
| Sleeping | Current workplace flexibility | −0.183 | 0.034 | 0.86 | −0.197 | 0.010 | 0.29 |
| Sleeping | Max workplace flexibility | −0.250 | 0.046 | 1.18 | −0.242 | 0.052 | 1.47 |
| Sleeping | Physical activity at job | −0.207 | 0.043 | 1.10 | −0.166 | 0.083 | 2.30 |
| Sleeping | Driver’s license owned | −0.198 | 0.072 | 1.82 | −0.171 | 0.082 | 2.28 |
| Sleeping | Car availability | −0.178 | 0.061 | 1.53 | −0.145 | 0.088 | 2.43 |
| Sleeping | All persons in hh | −0.058 | 0.017 | 0.41 | −0.009 | 0.073 | 1.98 |
| Sleeping | Persons under 16 in hh | −0.080 | 0.022 | 0.54 | −0.112 | −0.022 | −0.61 |
| Sleeping | Person under 6 in hh | −0.061 | −0.023 | −0.56 | −0.044 | 0.008 | 0.20 |
| Sleeping | Discount card train owned | 0.046 | 0.043 | 1.06 | 0.050 | 0.035 | 0.96 |
| Sleeping | Discount card local PT owned | 0.013 | 0.080 | 1.98 | 0.008 | 0.048 | 1.30 |
| Sleeping | Effective current working time | −0.325 | 0.076 | 2.00 | −0.308 | 0.097 | 2.79 |
| Sleeping | Regular current working time | −0.322 | 0.094 | 2.47 | −0.296 | 0.124 | 3.56 |
| Travel | Age | −0.188 | 0.117 | 3.59 | −0.214 | 0.074 | 2.10 |
| Travel | No. of visited destinations per week | 0.483 | −0.008 | −0.28 | 0.528 | 0.024 | 0.78 |
| Travel | University educated | 0.181 | −0.126 | −3.87 | 0.212 | −0.076 | −2.17 |
| Travel | Employed | 0.225 | −0.072 | −2.23 | 0.215 | −0.085 | −2.43 |
| Travel | Gender | −0.069 | −0.007 | −0.22 | −0.039 | 0.035 | 0.98 |
| Travel | Household urbanity | −0.260 | 0.121 | 3.83 | −0.298 | 0.071 | 2.06 |
| Travel | Income | 0.150 | −0.038 | −1.13 | 0.128 | −0.067 | −1.87 |
| Travel | Current workplace flexibility | 0.116 | −0.077 | −2.32 | 0.132 | −0.053 | −1.49 |
| Travel | Max workplace flexibility | 0.166 | −0.097 | −2.95 | 0.162 | −0.096 | −2.73 |
| Travel | Physical activity at job | 0.144 | 0.001 | 0.04 | 0.128 | −0.026 | −0.73 |
| Travel | Driver’s license owned | 0.039 | 0.009 | 0.26 | 0.003 | −0.042 | −1.15 |
| Travel | Car availability | −0.014 | 0.048 | 1.43 | −0.086 | −0.044 | −1.24 |
| Travel | All persons in hh | 0.008 | −0.033 | −0.97 | −0.021 | −0.062 | −1.72 |
| Travel | Persons under 16 in hh | 0.016 | −0.002 | −0.06 | −0.001 | −0.023 | −0.65 |
| Travel | Person under 6 in hh | 0.007 | 0.013 | 0.38 | 0.006 | 0.008 | 0.21 |
| Travel | Discount card train owned | 0.105 | −0.054 | −1.62 | 0.138 | −0.015 | −0.42 |
| Travel | Discount card local PT owned | 0.231 | −0.139 | −4.35 | 0.267 | −0.084 | −2.44 |
| Travel | Effective current working time | 0.196 | −0.045 | −1.37 | 0.152 | −0.107 | −3.02 |
| Travel | Regular current working time | 0.215 | −0.062 | −1.90 | 0.173 | −0.121 | −3.42 |
| Employment | Age | −0.285 | 0.044 | 1.13 | −0.304 | 0.019 | 0.55 |
| Employment | No. of visited destinations per week | −0.002 | 0.034 | 0.84 | −0.057 | −0.047 | −1.27 |
| Employment | University educated | 0.175 | 0.056 | 1.40 | 0.128 | −0.025 | −0.69 |
| Employment | Employed | 0.729 | −0.045 | −1.65 | 0.753 | −0.031 | −1.28 |
| Employment | Gender | −0.214 | 0.101 | 2.57 | −0.236 | 0.058 | 1.64 |
| Employment | Household urbanity | −0.069 | 0.046 | 1.14 | −0.061 | 0.046 | 1.25 |
| Employment | Income | 0.456 | −0.007 | −0.21 | 0.412 | −0.071 | −2.14 |
| Employment | Current workplace flexibility | 0.463 | −0.069 | −1.92 | 0.498 | −0.029 | −0.90 |
| Employment | Max workplace flexibility | 0.551 | −0.061 | −1.81 | 0.545 | −0.089 | −2.90 |
| Employment | Physical activity at job | 0.525 | −0.006 | −0.19 | 0.533 | 0.005 | 0.17 |
| Employment | Driver’s license owned | 0.149 | −0.050 | −1.25 | 0.165 | −0.015 | −0.40 |
| Employment | Car availability | 0.155 | −0.008 | −0.19 | 0.121 | −0.054 | −1.49 |
| Employment | All persons in hh | 0.121 | −0.022 | −0.55 | 0.125 | −0.015 | −0.41 |
| Employment | Persons under 16 in hh | 0.135 | −0.083 | −2.09 | 0.187 | −0.004 | −0.10 |
| Employment | Person under 6 in hh | 0.010 | 0.016 | 0.39 | 0.023 | 0.028 | 0.77 |
| Employment | Discount card train owned | −0.077 | −0.046 | −1.15 | −0.044 | 0.006 | 0.17 |
| Employment | Discount card local PT owned | 0.005 | −0.058 | −1.43 | 0.053 | 0.015 | 0.41 |
| Employment | Effective current working time | 0.821 | 0.010 | 0.45 | 0.785 | −0.128 | −5.76 |
| Employment | Regular current working time | 0.807 | −0.059 | −2.53 | 0.771 | −0.188 | −8.44 |
| DistSumWk (sum of travel distance per week) | Age | −0.073 | 0.036 | 0.91 | −0.078 | 0.003 | 0.10 |
| DistSumWk | No. of visited destinations per week | 0.179 | −0.006 | −0.15 | 0.179 | 0.029 | 0.82 |
| DistSumWk | University educated | 0.039 | −0.033 | −0.85 | 0.092 | 0.048 | 1.31 |
| DistSumWk | Employed | 0.161 | −0.068 | −1.76 | 0.145 | −0.034 | −0.93 |
| DistSumWk | Gender | −0.047 | −0.003 | −0.08 | −0.052 | −0.016 | −0.45 |
| DistSumWk | Household urbanity | 0.004 | 0.010 | 0.27 | 0.041 | 0.050 | 1.36 |
| DistSumWk | Income | 0.151 | −0.060 | −1.54 | 0.143 | −0.018 | −0.49 |
| DistSumWk | Current workplace flexibility | 0.084 | −0.062 | −1.60 | 0.093 | −0.017 | −0.48 |
| DistSumWk | Max workplace flexibility | 0.092 | −0.055 | −1.42 | 0.108 | −0.006 | −0.17 |
| DistSumWk | Physical activity at job | 0.083 | −0.010 | −0.24 | 0.052 | −0.029 | −0.80 |
| DistSumWk | Driver’s license owned | 0.107 | −0.043 | −1.09 | 0.096 | −0.016 | −0.45 |
| DistSumWk | Car availability | 0.116 | −0.038 | −0.98 | 0.109 | −0.014 | −0.39 |
| DistSumWk | All persons in hh | 0.020 | −0.013 | −0.33 | −0.034 | −0.071 | −1.95 |
| DistSumWk | Persons under 16 in hh | 0.017 | 0.005 | 0.13 | −0.011 | −0.028 | −0.77 |
| DistSumWk | Person under 6 in hh | 0.031 | 0.004 | 0.09 | 0.015 | −0.014 | −0.37 |
| DistSumWk | Discount card train owned | 0.002 | −0.002 | −0.06 | 0.066 | 0.071 | 1.93 |
| DistSumWk | Discount card local PT owned | −0.082 | 0.028 | 0.72 | −0.030 | 0.066 | 1.81 |
| DistSumWk | Effective current working time | 0.157 | −0.048 | −1.25 | 0.127 | −0.045 | −1.25 |
| DistSumWk | Regular current working time | 0.168 | −0.062 | −1.62 | 0.134 | −0.058 | −1.61 |
| Mode Share PT | Age | −0.222 | 0.121 | 3.15 | −0.227 | 0.077 | 2.15 |
| Mode Share PT | No. of visited destinations per week | 0.066 | −0.044 | −1.11 | 0.045 | −0.041 | −1.13 |
| Mode Share PT | University educated | 0.152 | −0.126 | −3.25 | 0.123 | −0.123 | −3.40 |
| Mode Share PT | Employed | 0.016 | −0.003 | −0.06 | 0.018 | 0.000 | 0.01 |
| Mode Share PT | Gender | 0.043 | −0.025 | −0.64 | 0.015 | −0.051 | −1.39 |
| Mode Share PT | Household urbanity | −0.361 | 0.187 | 5.17 | −0.406 | 0.078 | 2.34 |
| Mode Share PT | Income | −0.059 | 0.011 | 0.28 | −0.072 | −0.010 | −0.27 |
| Mode Share PT | Current workplace flexibility | 0.031 | −0.036 | −0.91 | −0.010 | −0.072 | −1.98 |
| Mode Share PT | Max workplace flexibility | 0.068 | −0.068 | −1.72 | 0.029 | −0.091 | −2.50 |
| Mode Share PT | Physical activity at job | 0.029 | 0.019 | 0.48 | 0.006 | −0.015 | −0.40 |
| Mode Share PT | Driver’s license owned | −0.243 | 0.065 | 1.70 | −0.280 | −0.023 | −0.64 |
| Mode Share PT | Car availability | −0.379 | 0.163 | 4.54 | −0.464 | 0.020 | 0.60 |
| Mode Share PT | All persons in hh | −0.046 | 0.011 | 0.28 | −0.061 | −0.012 | −0.32 |
| Mode Share PT | Persons under 16 in hh | −0.058 | 0.001 | 0.02 | −0.088 | −0.036 | −0.97 |
| Mode Share PT | Person under 6 in hh | −0.058 | 0.010 | 0.25 | −0.066 | −0.005 | −0.14 |
| Mode Share PT | Discount card train owned | 0.097 | −0.052 | −1.32 | 0.105 | −0.029 | −0.80 |
| Mode Share PT | Discount card local PT owned | 0.610 | −0.315 | −11.16 | 0.666 | −0.158 | −5.93 |
| Mode Share PT | Effective current working time | 0.013 | 0.011 | 0.27 | 0.031 | 0.024 | 0.66 |
| Mode Share PT | Regular current working time | 0.028 | −0.005 | −0.14 | 0.048 | 0.014 | 0.37 |
| Trip frequency (per week) | Age | −0.113 | 0.078 | 2.41 | −0.141 | 0.040 | 1.13 |
| Trip frequency | No. of visited destinations per week | 0.757 | 0.021 | 1.04 | 0.803 | 0.004 | 0.21 |
| Trip frequency | University educated | 0.156 | −0.107 | −3.35 | 0.189 | −0.063 | −1.80 |
| Trip frequency | Employed | 0.218 | −0.033 | −1.05 | 0.229 | −0.036 | −1.03 |
| Trip frequency | Gender | 0.019 | −0.029 | −0.88 | 0.059 | 0.023 | 0.66 |
| Trip frequency | Household urbanity | −0.149 | 0.062 | 1.90 | −0.179 | 0.032 | 0.91 |
| Trip frequency | Income | 0.157 | −0.020 | −0.62 | 0.159 | −0.028 | −0.80 |
| Trip frequency | Current workplace flexibility | 0.104 | −0.074 | −2.28 | 0.163 | −0.007 | −0.21 |
| Trip frequency | Max workplace flexibility | 0.135 | −0.082 | −2.54 | 0.176 | −0.038 | −1.08 |
| Trip frequency | Physical activity at job | 0.123 | 0.033 | 1.01 | 0.134 | 0.034 | 0.95 |
| Trip frequency | Driver’s license owned | 0.108 | −0.016 | −0.49 | 0.100 | −0.028 | −0.79 |
| Trip frequency | Car availability | 0.092 | 0.019 | 0.59 | 0.060 | −0.034 | −0.94 |
| Trip frequency | All persons in hh | 0.048 | −0.055 | −1.67 | 0.062 | −0.033 | −0.92 |
| Trip frequency | Persons under 16 in hh | 0.100 | −0.059 | −1.80 | 0.149 | 0.003 | 0.09 |
| Trip frequency | Person under 6 in hh | 0.009 | 0.006 | 0.19 | 0.048 | 0.055 | 1.54 |
| Trip frequency | Discount card train owned | 0.120 | −0.096 | −2.96 | 0.146 | −0.062 | −1.76 |
| Trip frequency | Discount card local PT owned | 0.080 | −0.097 | −2.97 | 0.101 | −0.058 | −1.64 |
| Trip frequency | Effective current working time | 0.165 | −0.030 | −0.94 | 0.139 | −0.079 | −2.23 |
| Trip frequency | Regular current working time | 0.175 | −0.029 | −0.89 | 0.148 | −0.081 | −2.30 |
References
- Jones, P.M. New Approaches to Understanding Travel Behaviour: The Human Activity Approach. In Behavioural Travel Modelling; Routledge: Abingdon-on-Thames, UK, 1979. [Google Scholar]
- Hägerstrand, T. What about People in Regional Science? Pap. Reg. Sci. Assoc. 1970, 24, 6–21. [Google Scholar] [CrossRef]
- Gürbüz, H.; Şöhret, Y.; Ekici, S. Evaluating Effects of the Covid-19 Pandemic Period on Energy Consumption and Enviro-Economic Indicators of Turkish Road Transportation. Energy Sources Part A Recover. Util. Environ. Eff. 2021, 1–13. [Google Scholar] [CrossRef]
- Forster, P.M.; Forster, H.I.; Evans, M.J.; Gidden, M.J.; Jones, C.D.; Keller, C.A.; Lamboll, R.D.; Le Quéré, C.; Rogelj, J.; Rosen, D.; et al. Current and Future Global Climate Impacts Resulting from COVID-19. Nat. Clim. Chang. 2020, 10, 913–919. [Google Scholar] [CrossRef]
- Lalas, D.; Gakis, N.; Mirasgedis, S.; Georgopoulou, E.; Sarafidi, Y.; Doukas, H. Energy and GHG Emissions Aspects of the COVID Impact in Greece. Energies 2021, 14, 1955. [Google Scholar] [CrossRef]
- Büchel, B.; Marra, A.D.; Corman, F. COVID-19 as a Window of Opportunity for Cycling: Evidence from the First Wave. Transp. Policy 2022, 116, 144–156. [Google Scholar] [CrossRef]
- Aloi, A.; Alonso, B.; Benavente, J.; Ech, E. Effects of the COVID-19 Lockdown on Urban Mobility: Empirical Evidence from the City of Santander (Spain). Sustainability 2020, 12, 3870. [Google Scholar] [CrossRef]
- Feng, Y.; Zhou, W. Work from Home during the COVID-19 Pandemic: An Observational Study Based on a Large Geo-Tagged COVID-19 Twitter Dataset. Educ. Res. Rev. 2020, 59, 102820. [Google Scholar] [CrossRef]
- Toger, M.; Kourtit, K.; Nijkamp, P.; Östh, J. Article Mobility during the Covid-19 Pandemic: A Data-Driven Time-Geographic Analysis of Health-Induced Mobility Changes. Sustainability 2021, 13, 4027. [Google Scholar] [CrossRef]
- Liu, Z.; Wang, X.; Dai, J.; Li, X.; Li, R. Impacts of COVID-19 Pandemic on Travel Behavior in Large Cities of China: Investigation on the Lockdown and Reopening Phases. J. Transp. Eng. Part A Syst. 2022, 148, 05021011. [Google Scholar] [CrossRef]
- Parady, G.; Taniguchi, A.; Takami, K. Travel Behavior Changes during the COVID-19 Pandemic in Japan: Analyzing the Effects of Risk Perception and Social Influence on Going-out Self-Restriction. Transp. Res. Interdiscip. Perspect. 2020, 7, 100181. [Google Scholar] [CrossRef]
- Tamagusko, T.; Ferreira, A. Data-Driven Approach to Understand the Mobility Patterns of the Portuguese Population during the COVID-19 Pandemic. Sustainability 2020, 12, 9775. [Google Scholar] [CrossRef]
- Abdullah, M.; Dias, C.; Muley, D.; Shahin, M. Exploring the Impacts of COVID-19 on Travel Behavior and Mode Preferences. Transp. Res. Interdiscip. Perspect. 2020, 8, 100255. [Google Scholar] [CrossRef] [PubMed]
- Shakibaei, S.; de Jong, G.C.; Alpkökin, P.; Rashidi, T.H. Impact of the COVID-19 Pandemic on Travel Behavior in Istanbul: A Panel Data Analysis. Sustain. Cities Soc. 2021, 65, 102619. [Google Scholar] [CrossRef] [PubMed]
- Anke, J.; Francke, A.; Schaefer, L.M.; Petzoldt, T. Impact of SARS-CoV-2 on the Mobility Behaviour in Germany. Eur. Transp. Res. Rev. 2021, 13, 10. [Google Scholar] [CrossRef]
- Irawan, M.Z.; Belgiawan, P.F.; Joewono, T.B.; Bastarianto, F.F.; Rizki, M.; Ilahi, A. Exploring Activity-Travel Behavior Changes during the Beginning of COVID-19 Pandemic in Indonesia. Transportation 2021, 49, 529–553. [Google Scholar] [CrossRef]
- Beck, M.J.; Hensher, D.A. Insights into the Impact of COVID-19 on Household Travel and Activities in Australia–The Early Days under Restrictions. Transp. Policy 2020, 96, 76–93. [Google Scholar] [CrossRef]
- Almlöf, E.; Rubensson, I.; Cebecauer, M.; Jenelius, E. Who Continued Travelling by Public Transport during COVID-19? Socioeconomic Factors Explaining Travel Behaviour in Stockholm 2020 Based on Smart Card Data. Eur. Transp. Res. Rev. 2021, 13, 31. [Google Scholar] [CrossRef]
- Monterde-i-Bort, H.; Sucha, M.; Risser, R.; Kochetova, T. Mobility Patterns and Mode Choice Preferences during the COVID-19 Situation. Sustainability 2022, 14, 768. [Google Scholar] [CrossRef]
- Bin, E.; Andruetto, C.; Susilo, Y.; Pernestål, A. The Trade-off Behaviours between Virtual and Physical Activities during the First Wave of the COVID-19 Pandemic Period. Eur. Transp. Res. Rev. 2021, 13, 14. [Google Scholar] [CrossRef]
- Kolarova, V.; Eisenmann, C.; Nobis, C.; Winkler, C.; Lenz, B. Analysing the Impact of the COVID-19 Outbreak on Everyday Travel Behaviour in Germany and Potential Implications for Future Travel Patterns. Eur. Transp. Res. Rev. 2021, 13, 27. [Google Scholar] [CrossRef]
- Lee, I.; Tipoe, E. Changes in the Quantity and Quality of Time Use during the COVID-19 Lockdowns in the UK: Who Is the Most Affected? PLoS ONE 2021, 16, e0258917. [Google Scholar] [CrossRef] [PubMed]
- Gershuny, J.; Sullivan, O.; Sevilla, A.; Vega-Rapun, M.; Foliano, F.; De Grignon, J.L.; Harms, T.; Walthery, P. A New Perspective from Time Use Research on the Effects of Social Restrictions on COVID-19 Behavioral Infection Risk. PLoS ONE 2021, 16, e0245551. [Google Scholar] [CrossRef] [PubMed]
- Alho, A.; Cheng, C.; Hieu, D.T.; Sakai, T.; Zhao, F.; Ben-Akiva, M.; Cheah, L. Online and In-Person Activity Logging Using a Smartphone-Based Travel, Activity, and Time-Use Survey. Transp. Res. Interdiscip. Perspect. 2022, 13, 100524. [Google Scholar] [CrossRef]
- Hintermann, B.; Schoeman, B.; Molloy, J.; Schatzmann, T.; Tchervenkov, C.; Axhausen, K.W. The Impact of COVID-19 on Mobility Choices in Switzerland; WWZ Working Paper; University of Basel: Basel, Switzerland, 2021. [Google Scholar]
- Aschauer, F.; Rösel, I.; Hössinger, R.; Kreis, H.B.; Gerike, R. Time Use, Mobility and Expenditure: An Innovative Survey Design for Understanding Individuals’ Trade-off Processes; Springer: New York, NY, USA, 2018; ISBN 0123456789. [Google Scholar]
- Brög, W.; Erl, E.; Ker, I.; Ryle, J.; Wall, R. Evaluation of Voluntary Travel Behaviour Change: Experiences from Three Continents. Transp. Policy 2009, 16, 281–292. [Google Scholar] [CrossRef]
- Fellendorf, M.; Herry, M.; Karmasin, H.; Klementschitz, R.; Kohla, B.; Meschik, M.; Rehrl, K.; Reiter, T.; Sammer, G.; Schneider, C.; et al. KOMOD-Konzeptstudie Mobilitätsdaten Österreichs: Handbuch für Mobilitätserhebungen (Concept Study Travel Data Austria: Manual for Travel Surveys); Austrian Ministry for Transport, Innovation and Technology: Vienna, Austria, 2011.
- Stopher, P.R.; Greaves, S.P. Household Travel Surveys: Where Are We Going? Transp. Res. Part A Policy Pract. 2007, 41, 367–381. [Google Scholar] [CrossRef]
- Eurostat. Harmonised European Time Use Surveys (HETUS) 2018 Guidelines; Publications Office of the European Union: Luxembourg, 2019; ISBN 9789276019640. [Google Scholar]
- UNECE. Guidelines for Harmonizing Time-Use Surveys; UNECE: Geneva, Switzerland, 2013; p. 129. [Google Scholar]
- AAPOR. Standard Definitions: Final Dispositions of Case Codes and Outcome Rates for Surveys, 9th ed.; AAPOR: Alexandria, VA, USA, 2016. [Google Scholar]
- BMSGPK. 98. Verordnung Des Bundesministers für Soziales, Gesundheit, Pflege Und Konsumentenschutz Gemäß § 2 Z 1 Des COVID-19-Maßnahmengesetzes; BMSGPK: Vienna, Austria, 2020. [Google Scholar]
- BMBWF Etappenplan zur Aktivierung des Schulbetriebs. Available online: https://www.bmbwf.gv.at/Themen/schule/beratung/corona/corona_info/corona_etappenplan.html (accessed on 17 January 2022).
- Statistics Austria Population. Available online: https://www.statistik.at/web_en/publications_services/statistical_overviews/population/index.html (accessed on 16 February 2022).
- Schulte-Fischedick, M.; Shan, Y.; Hubacek, K. Implications of COVID-19 Lockdowns on Surface Passenger Mobility and Related CO2 Emission Changes in Europe. Appl. Energy 2021, 300, 117396. [Google Scholar] [CrossRef]
- Munawar, H.S.; Khan, S.I.; Qadir, Z.; Kouzani, A.Z.; Mahmud, M.A.P. Insight into the Impact of COVID-19 on Australian Transportation Sector: An Economic and Community-Based Perspective. Sustainability 2021, 13, 1276. [Google Scholar] [CrossRef]
- Cartenì, A.; Di Francesco, L.; Henke, I.; Marino, T.V.; Falanga, A. The Role of Public Transport during the Second Covid-19 Wave in Italy. Sustainability 2021, 13, 11905. [Google Scholar] [CrossRef]
- Morgan, J.P. E-Commerce Payments Trends Report: Austria. 2020. Available online: https://www.jpmorgan.com/merchant-services/insights/reports/austria-2020 (accessed on 19 May 2022).
- Ghodsi, M.; Ardestani, A.; Rasaizadi, A.; Ghadamgahi, S.; Yang, H. How COVID-19 Pandemic Affected Urban Trips? Structural Interpretive Model of Online Shopping and Passengers Trips during the Pandemic. Sustainability 2021, 13, 11995. [Google Scholar] [CrossRef]
- Shamshiripour, A.; Rahimi, E.; Shabanpour, R.; Mohammadian, A. How Is COVID-19 Reshaping Activity-Travel Behavior? Evidence from a Comprehensive Survey in Chicago. Transp. Res. Interdiscip. Perspect. 2020, 7, 100216. [Google Scholar] [CrossRef]
- Susilo, Y.; Avineri, E. Survey and Empirical Evaluation of Nonhomogeneous Arrival Process Models with Taxi Data. J. Adv. Transp. 2013, 48, 454–470. [Google Scholar] [CrossRef] [Green Version]
- Susilo, Y.; Floden, J.; Geurs, K. Six Lessons from First Year COVID-19 Restrictions: What Can We Do Better in the Future? Eur. Transp. Res. Rev. 2021, 13, 48. [Google Scholar] [CrossRef]
- Qi, Y.; Liu, J.; Tao, T.; Zhao, Q. Impacts of COVID-19 on Public Transit Ridership. Int. J. Transp. Sci. Technol. 2022, in press, corrected proof. [Google Scholar] [CrossRef]
- Lozzi, G.; Cré, I.; Ramos, C. Relaunching Transport and Tourism in the EU after COVID-19; European Parliament Policy Department for Structural and Cohesion Policies: Brussels, Belgium, 2022. [Google Scholar]
- Kylili, A.; Afxentiou, N.; Georgiou, L.; Panteli, C.; Morsink-Georgalli, P.Z.; Panayidou, A.; Papouis, C.; Fokaides, P.A. The Role of Remote Working in Smart Cities: Lessons Learnt from COVID-19 Pandemic. Energy Sources Part A Recover. Util. Environ. Eff. 2020, 1–16. [Google Scholar] [CrossRef]
- Ahmed, A.; Stopher, P. Seventy Minutes Plus or Minus 10—A Review of Travel Time Budget Studies. Transp. Rev. 2014, 34, 607–625. [Google Scholar] [CrossRef]


| Dependent Variable (y) | Moderator Variable (z) | ||||
|---|---|---|---|---|---|
| Travel † | 0.25 | Age | −0.19 | 0.12 | 3.59 |
| University educated a | 0.18 | −0.13 | −3.87 | ||
| Employed | 0.23 | −0.07 | −2.23 | ||
| Household (hh) urbanity b | 0.26 | −0.12 | −3.83 | ||
| Max workplace flexibility c | 0.17 | −0.10 | −2.95 | ||
| Local PT season ticket owned | 0.23 | −0.14 | −4.35 | ||
| Sleep † | 1.03 | Age | 0.11 | −0.10 | −2.46 |
| Local PT season ticket owned | 0.01 | 0.08 | 1.98 | ||
| Daily working time | −0.32 | 0.09 | 2.47 | ||
| Eating † | 1.27 | No of persons under 16 in hh | 0.02 | 0.17 | 4.31 |
| Employment † | 0.77 | Gender female d | −0.21 | 0.10 | 2.57 |
| No of persons under 16 in hh | 0.14 | −0.08 | −2.09 | ||
| Daily working time | 0.81 | −0.06 | −2.53 | ||
| Education † | - | - | - | - | - |
| Personal † | - | - | - | - | - |
| Domestic † | 1.10 | Gender female | 0.29 | −0.08 | −1.98 |
| Shopping † | 0.64 | Gender female | 0.15 | −0.10 | −2.57 |
| Leisure † | 1.29 | Age | 0.14 | −0.08 | −2.12 |
| Mode share PT | 0.18 | Age | −0.22 | 0.12 | 3.15 |
| University educated | 0.15 | −0.13 | −3.25 | ||
| Household urbanity | 0.36 | −0.19 | −5.17 | ||
| Car availability e | −0.38 | 0.16 | 4.54 | ||
| Local PT season ticket owned | 0.61 | −0.32 | −11.16 | ||
| Trip frequency | 0.36 | Age | −0.11 | 0.08 | 2.41 |
| University educated | 0.16 | −0.11 | −3.35 | ||
| Max workplace flexibility | 0.13 | −0.08 | −2.54 | ||
| Train discount card owned | 0.12 | −0.10 | −2.96 | ||
| Local PT season ticket owned | 0.08 | −0.10 | −2.97 |
| Dependent Variable (y) | Moderator Variable (z) | ||||
|---|---|---|---|---|---|
| Travel † | 0.76 | Age | −0.21 | 0.07 | 2.10 |
| University educated a | 0.21 | −0.08 | −2.17 | ||
| Employed | 0.22 | −0.09 | −2.43 | ||
| Household (hh) urbanity b | 0.30 | −0.07 | −2.06 | ||
| Max workplace flexibility c | 0.16 | −0.10 | −2.73 | ||
| Local PT season ticket owned | 0.27 | −0.08 | −2.44 | ||
| Daily working time | 0.17 | −0.12 | −3.42 | ||
| Sleep † | 1.01 | Age | 0.09 | −0.10 | −2.68 |
| Employed | −0.31 | 0.08 | 2.36 | ||
| Gender female d | 0.10 | −0.09 | −2.39 | ||
| Physical activity at job e | −0.17 | 0.08 | 2.30 | ||
| Driver’s license owned | −0.17 | 0.08 | 2.28 | ||
| Car availability f | −0.14 | 0.09 | 2.43 | ||
| Total no of persons in hh | −0.01 | 0.07 | 1.98 | ||
| Daily working time | −0.30 | 0.12 | 3.56 | ||
| Eating † | - | - | - | - | - |
| Employment † | 0.88 | Personal income | 0.41 | −0.07 | −2.14 |
| Max workplace flexibility | 0.54 | −0.09 | −2.90 | ||
| Daily working time | 0.77 | −0.19 | −8.44 | ||
| Education † | 0.90 | University educated | 0.05 | 0.08 | 2.05 |
| Personal † | 0.82 | Personal income | −0.08 | −0.10 | −2.78 |
| Domestic † | 1.09 | Personal income | −0.16 | 0.09 | 2.61 |
| Physical activity at job | −0.19 | 0.08 | 2.17 | ||
| Daily working time | −0.31 | 0.12 | 3.32 | ||
| Shopping † | 1.00 | Driver’s license owned | 0.00 | −0.07 | −2.02 |
| Leisure † | 1.08 | Daily working time | −0.22 | 0.08 | 2.13 |
| Mode share PT | 0.66 | Age | −0.23 | 0.08 | 2.15 |
| University educated | 0.12 | −0.12 | −3.40 | ||
| Household urbanity | 0.41 | −0.08 | −2.34 | ||
| Max workplace flexibility | 0.03 | −0.09 | −2.50 | ||
| Local PT season ticket owned | 0.67 | −0.16 | −5.93 | ||
| Trip frequency | 0.79 | Daily working time | 0.15 | −0.08 | −2.30 |
Publisher’s Note: MDPI stays neutral with regard to jurisdictional claims in published maps and institutional affiliations. |
© 2022 by the authors. Licensee MDPI, Basel, Switzerland. This article is an open access article distributed under the terms and conditions of the Creative Commons Attribution (CC BY) license (https://creativecommons.org/licenses/by/4.0/).
Share and Cite
Hartwig, L.; Hössinger, R.; Susilo, Y.O.; Gühnemann, A. The Impacts of a COVID-19 Related Lockdown (and Reopening Phases) on Time Use and Mobility for Activities in Austria—Results from a Multi-Wave Combined Survey. Sustainability 2022, 14, 7422. https://doi.org/10.3390/su14127422
Hartwig L, Hössinger R, Susilo YO, Gühnemann A. The Impacts of a COVID-19 Related Lockdown (and Reopening Phases) on Time Use and Mobility for Activities in Austria—Results from a Multi-Wave Combined Survey. Sustainability. 2022; 14(12):7422. https://doi.org/10.3390/su14127422
Chicago/Turabian StyleHartwig, Lukas, Reinhard Hössinger, Yusak Octavius Susilo, and Astrid Gühnemann. 2022. "The Impacts of a COVID-19 Related Lockdown (and Reopening Phases) on Time Use and Mobility for Activities in Austria—Results from a Multi-Wave Combined Survey" Sustainability 14, no. 12: 7422. https://doi.org/10.3390/su14127422