Article

Global Optimization Algorithm Based on Kriging Using Multi-Point Infill Sampling Criterion and Its Application in Transportation System

1
Smart Transport Key Laboratory of Hunan Province, School of Traffic and Transportation Engineering, Central South University, Changsha 410075, China
2
School of Transportation Engineering, Changsha University of Science and Technology, Changsha 410205, China
*
Authors to whom correspondence should be addressed.
Sustainability 2021, 13(19), 10645; https://doi.org/10.3390/su131910645
Submission received: 22 July 2021 / Revised: 14 September 2021 / Accepted: 21 September 2021 / Published: 25 September 2021

Abstract

:
Public traffic has a great influence, especially with the background of COVID-19. Solving simulation-based optimization (SO) problem is efficient to study how to improve the performance of public traffic. Global optimization based on Kriging (KGO) is an efficient method for SO; to this end, this paper proposes a Kriging-based global optimization using multi-point infill sampling criterion. This method uses an infill sampling criterion which obtains multiple new design points to update the Kriging model through solving the constructed multi-objective optimization problem in each iteration. Then, the typical low-dimensional and high-dimensional nonlinear functions, and a SO based on 445 bus line in Beijing city, are employed to test the performance of our algorithm. Moreover, compared with the KGO based on the famous single-point expected improvement (EI) criterion and the particle swarm algorithm (PSO), our method can obtain better solutions in the same amount or less time. Therefore, the proposed algorithm expresses better optimization performance, and may be more suitable for solving the tricky and expensive simulation problems in real-world traffic problems.

1. Introduction

In general, simulation optimization methods can be divided into three categories [1]: simulation-based optimization, optimization-based simulation and the optimization of simulation. The simulation-based optimization is basically formed around the black-box concept; its objective function values are calculated through simulation models. The optimization-based simulation uses the optimization process to generate data which are linked to the simulation needed. The optimization of simulation usually focuses on the search of appropriate simulation parameters. Among them, the simulation-based optimization problem is common and worth studying. The objective functions of many simulation-based optimization (SO) problems do not have explicit mathematical expressions, and the evaluation process often relies on complex simulations. For example, Zheng et al. [2] constructed a simulation-based model to simulate the signal timing under uncertainties in the real world, then they optimized the output variables of the model. This SO problem is extremely common in engineering, but difficult to deal with [3], because of its high time-consuming features.
At present, the optimization algorithms can mainly be divided into two categories: gradient-based and non-gradient-based. The gradient-based algorithm is not suitable for the SO, because the objective functions of SO usually do not have explicit mathematical expressions, and their gradients are hard to accurately obtain. The non-gradient-based algorithm can generally be divided into three categories: heuristic methods, surrogate-assisted heuristic methods and metamodel-based methods. Among them, heuristic and surrogate-assisted heuristic methods usually need a large number of evaluations of objective functions, this is extremely time-consuming. The metamodel-based methods are the most suitable for solving the SO. Commonly used metamodels [4] include polynomial models, neural network models, Krigng models, support vector machine models, and so on. Among the many meta models, due to the good approximation ability of the Kriging model on multimodal and nonlinear problems, the global optimization method based on the Kriging (KGO) model has attracted extensive attention.
The core of the KGO is the infill sampling criterion; that is, how to select the new infill sampling points to update the Kriging model in each iteration. The traditional infill sampling criterion is a typical single-point method, (i.e., only one point is selected as the new design point in each iteration). The expected improvement (EI) criterion proposed by Jones et al. [5] is the most well-known single-point criterion, which selects the point corresponding to the maximum value of the EI function in each iteration to update the Kriging model. Besides, this criterion has been widely applied in other real-world engineering problems [6,7,8,9,10,11]. However, the single-point criterion selects only one point as a new design point in each iteration, it cannot meet the parallel computing function of high-performance computers. To this end, the multi-point infill sampling criterion that can obtain multiple new design points in each iteration has received comprehensive attention in recent years, which can improve optimization efficiency proved according to practice [12,13,14,15,16,17,18,19,20,21,22,23,24,25,26]. According to Sobester et al. [27], the EI criterion sometimes cannot balance exploration and exploitation, which is important to the efficiency of algorithm. To this end, Feng et al. [28] proposed a method called EGO-MO, which used the multi-objective optimization to generate exploitation–exploration trade-off points. The two objective functions are the two parts of the EI function. The EGO-MO needs to ensure many extra clustering parameters. It may be hard to apply it to the practice application.
Considering the disadvantages of both EGO and EGO-MO, this paper proposes a Kriging-based global optimization using multi-point infill sampling criterion. The multi-point infill sampling criterion uses the method of EGO-MO to generate candidate sampling points; then, the suitable sampling points are selected through the Kriging predicted values. Afterwards, the method is applied to the typical nonlinear high-dimensional and low-dimensional functions, which verifies the efficiency of the method proposed in this paper. Finally, the problem of optimizing corporate revenue in the public transportation system is taken as an engineering case, and the 445 bus line in the Beijing city is employed as the research object. This method is carried out to optimize it, and the optimization result is compared with the PSO. The optimization results show that the proposed optimization method can obtain optimization results in a shorter time; therefore, this method is more suitable for solving expensive black box problems.
The rest of this paper is organized as follows. Section 2 presents the background. The proposed multi-point infill sampling method, based on the multi-objective optimization problem, is introduced in Section 3. Section 4 presents the numerical cases and engineering cases. The conclusions are summarized in Section 5.

2. Literature Reviews about KGO Used in Traffic Area

The Kriging-based global optimization (KGO), which is also called the Bayesian optimization based on the Gaussian process in the machine learning field, has some applications in the transportation system: Li et al. [29] incorporated the fastest-rising ideas in response surface analysis into Bayesian optimization in the field of machine learning and established a SA-BO algorithm model to improve optimization efficiency. In addition, the passenger flow simulation model and the simulation optimization based on the SA-BO algorithm constituted the overall bus schedule simulation optimization based on passenger flow big data. In the work of Lv and Zhao [30], the K-means clustering method was used to establish a logistics park location model, MATLAB software was used to iteratively calculate the established model, and the Bayesian discriminant method was introduced to analyze the reliability of the clustering results. Zhang et al. [31] proposed a deep learning-based multitask (MLT) learning model to predict network-wide traffic speed, and used Bayesian optimization to optimize the hyperparameters of MTL model with limited computational costs. Wang et al. [32] employed the Bayesian optimization for the SVR regression model, which is applied to predict traffic flow; on the basis of it, a novel regression framework for short-term traffic flow prediction with automatic parameter tuning is proposed. Gu et al. [33] extracted decision variables from three aspects: characteristics based on physical state, characteristics based on interactive perception, and characteristics based on road structure, so as to make the factors considered in the decision-making process of lane changing model more comprehensive. Then, in view of the many factors that exist in the decision-making process of free lane changing, for nonlinear problems, a support vector machine (SVM) decision model based on Bayesian optimization algorithm (BOA) is proposed. Tian and Zhang [34] conducted the accurate and effective identification and sorting of black spots in road traffic accidents, proposed an optimized Bayesian black spot identification method based on accident statistics and accident prediction models, and optimized the engineering practicability of this method. At the same time, an optimized empirical Bayesian blackspot sorting method is proposed from two aspects: the degree of the risk of accidents and the improvement space of safety management. In order to improve the estimation accuracy of the OD matrix, a layered optimization OD matrix estimation model based on the Bayesian method is proposed by Yu [35]. This model divided the OD matrix estimation into three optimization problems: (1) wardrop minimum variance optimization model, using it to obtain the path selection probability; (2) least squares optimization problem to obtain OD sample data; (3) maximum likelihood optimization problem to perform parameter estimation.

3. Method

3.1. Kriging Model

Metamodel is also called a surrogate model; it is a simple model used to simulate the complex processes. Kriging is a kind of metamodel. The basic formula of the Kriging model [5] is:
y ( X ) = β f ( X ) + Z ( X )
where, X is the surrogate model variable; y(X) is the unknown surrogate model; β is the regression coefficient; f(X) is the determined basis function; Z(X) is the error of random distribution, its mean is 0, and its variance is σZ2 The covariance is:
c o v [ Z ( x i ) , Z ( x j ) ] = σ Z 2 [ R i j ( θ , x i , x j ) ]
where, xi and xj are any two sample points in the training sample. [Rij (θ, xi, xj)] is the correlation functions contained θ and represents the positional relationship between the training sample points. The relationship between the sample points is related to the distance, so the given function relationship is:
R i j ( θ , x i , x j ) = k = 1 n 1 R k ( θ , d k ) ,   d k = | x i k x j k |
where, n1 is the number of design variables, and xik, xjk are the k-th component of the training sample points xi and xj respectively, Rk (θ, dk) is thespatial correlation function (SCF).
If the training sample contains m1 sample points, the predicted value y(x) of x at any point within the range of the design variables is:
y ^ ( x ) = f ( x ) T β ^ + r T ( x ) R 1 ( y F β ^ )
where, f(x) = [f1(x), f2(x), …, fk(x)]T, y = [y1, y2, …, ym1]T, rT(x) = [R(x,x1), R(x,x2), …, R(x,xm1)].
R = [ R ( x 1 , x 1 ) R ( x 1 , x m 1 ) R ( x m 1 , x 1 ) R ( x m 1 , x m 1 ) ] F = [ f T ( x 1 ) f T ( x m 1 ) ] ,   β ^ = [ β ^ 1 , β ^ 2 ,   , β ^ k ] T = ( F T R 1 F ) 1 F T R 1 y
The relevant parameters are the maximum likelihood estimates θk, which can be obtained by solving Equation (6):
M L E = max θ k > 0 { 1 2 [ n ln ( σ Z 2 ) + ln ( | R | ) ] }
where:
σ Z 2 = 1 m ( y F β ^ ) T R 1 ( y F β ^ )

3.2. Two Infill Sampling Criterions

3.2.1. Expected Improvement (EI)

Suppose ymin to be the minimum value of the response of the evaluated design point, the expression for the improvement at a point x: I(x) is:
I ( x ) = max { 0 , y min y ( x ) }
Its mathematical expectation can be written as:
E [ I ( x ) ] = ( y min y ( x ) ) Φ ( y min y ( x ) s ( x ) ) + s ( x ) φ ( y min y ( x ) s ( x ) )
where, Φ is the cumulative distribution function of the standard normal distribution, and φ is the probability density function of the standard normal distribution, y(x) is the predicted value of the Kriging model, while s(x) is the predicted standard deviation of the Kriging model.
According to the basic principle of the Kriging proxy model, for any unknown point x, the Kriging model provides the predicted value y(x) and the standard deviation s(x) of the predicted value. How to use the two aspects of information provided by the Kriging model to select the most potential point as the update point is the core issue of the infill sampling criterion. On the one hand, we can select the minimum value of Kriging model prediction value y(x) as the update point. On the other hand, we can select the maximum value of the standard deviation s(x) of the Kriging model as the update point. Selecting the minimum value of y(x), as the update point can fully explore the area near the current optimal solution and further improve the current optimal solution. However, such a search is concentrated in a local area, which may cause the search to fall into a certain local maximum of the original problem advantage. Selecting the maximum value of s(x) as the update point can explore the unknown area as much as possible, and choose the update point in the area where the sampling points are sparse, so that the search jumps out of the local area, but this search is very slow, and requires a large number of supplementary update points to find the optimal solution of the original problem. Since the EI criterion considers both of them, it is still widely used as an efficient method today.

3.2.2. A Multi-Point Infill Sampling Criterion Based on EI Criterion

Traditional infill sampling criteria such as EI criteria only search for single new design point in each iteration, which is inefficient. Moreover, according to Sobester et al. [27], sometimes the EI cannot balance exploitation and exploration. To solve these problems, Feng et al. [28] proposed a multi-point infill sampling criterion based on multi-objective optimization problem (MOP). The MOP can be written as:
Min: F(x) = (f1(x), f2(x), …, fm(x))T
Subject to: x = (x1, x2, …,xm) T
where, the set x is belong to the design space: D.
In most cases, the various sub-goals of the MOP are in conflict with each other; that is, the improvement of some sub-goals will cause the performance of other sub-goals to decrease. Hence, it is impossible for all sub-goals to reach the optimal rate at the same time. The ultimate goal of the MOP is to coordinate and compromise between each sub-goal, so that each sub-goal is as optimal as possible. Therefore, there is a huge difference between the optimal solution of the MOP and the optimal solution of the single objective problem. In order to solve the MOP problem correctly, it is necessary to define the concept of its solution:
Definition 1.
(Pareto dominate): Suppose x1, x2 are two feasible solutions in the D of the MOP. If, and only if, fi(x1) ≤ fi(x2) (i = 1, …, m), and at least one j which belongs to [1, m] makes fi(x1) < fi(x2). It can be said that x1 dominates x2.
Definition 2.
(Pareto optimal): There is no other solution x Dsuch that x dominates x*. It can be said that x* is a Pareto optimal solution.
Definition 3.
(Pareto optimal set (PS)): The set of all Pareto optimal solutions is called a Pareto optimal set (Pareto Set, PS), that is: PS = {x is a Pareto optimal solution}.
Definition 4.
(Pareto optimal front (PF)): Pareto front (PF) is defined as: PF = {F(x)|x∈ PS}.
It is obvious that the essence of multi-objective optimization is to find a set of non-dominated Pareto optimal solutions and their corresponding Pareto front. Hence, if we want to gain exploration- exploitation trade-off design points, solving a bi-objective optimization problem whose two objective functions measure local exploitation and global exploration respectively, is a feasible approach.
The EI can be divided into two parts:
E I 1 ( x ) = ( y min y ( x ) ) Φ ( y min y ( x ) s ( x ) )
E I 2 ( x ) = s ( x ) φ ( y min y ( x ) s ( x ) )
EI1(x) represents the local exploitation, while the EI2(x) represents the global exploration. However, the EI is hard to balance exploration and exploitation.
The MOP proposed by Feng et al. in [28] is:
Min: {EI1(x), EI2(x)}

Solution Algorithm

In order to better solve the MOP (13), this paper employs the decomposition-based multi-objective evolutionary algorithm (MOEA/D) [36,37]. First, the MOP is decomposed into multiple scalar optimization sub-problems; each sub-problem hastens the search speed by exchanging the information of its respective solutions. In order to avoid the algorithm “premature”, the exchange of solution information generally occurs between adjacent sub-problems, and the adjacent sub-problems are usually determined by the Euclidean distance of the aggregation coefficient. This is because we assume that the closest aggregation coefficient produces the most excellent solutions are also similar. The solutions retained for each sub-problem are the best solutions for the corresponding aggregation coefficient so far. It can be seen that the basis is the decomposition strategy.
The so-called decomposing into multiple scalar optimization sub-problems refers to: instead of processing as a whole but decomposing one into a single-objective optimization problem. The decomposition is achieved through the polymerization method. Common aggregation methods are: weighted sum method, Chebyshev method, and penalty-based boundary crossing method, and can be seen as follows:
Chebyshev decomposition method
min : g t c h ( x | λ , z ) = max { λ i | f i ( x ) z i | } s . t . x D
where, tch represents the Chebyshev decomposition method, z is the reference point, z = (z1, z2, …, zm)T. For each i = 1, 2, …, m.zi = min{fi(x)}, m is the target number of the multi-objective optimization problem. The setting of the reference point can make the population distribution more uniform and improve the effect of the algorithm.
Weighted sum decomposition method
This method achieves the purpose of transforming multi-objective optimization into multiple single-objective optimization by multiplying the target vector with its corresponding weight vector.
min : g w s ( x | λ ) = i = 1 m λ i f i ( x ) s . t . x D
Among them, ws represents the weighted sum decomposition method. In [30], it is pointed out that this method can achieve better results in multi-objective optimization problems with convex Pareto frontiers, but often cannot achieve better solutions for other situations.
Penalty-based boundary cross decomposition method
min : g p b i ( x | λ , z ) = d 1 + θ d 2 d 1 = | | ( F ( x ) z ) T λ | | | | λ | | d 2 = | | F ( x ) ( z d 1 λ ) | | s . t . x D
where, z is the reference point and has the same meaning in the Chebyshev decomposition method. d1 is the distance from the solution in the target space to the corresponding weight vector, d2 is the distance from the foot of the solution in the target space to the corresponding weight vector and the reference point, and θ is the penalty factor. The penalty-based boundary cross decomposition method takes the linear sum of d1 and d2 through the penalty factor as the optimization goal. This method is more effective than the other two methods for multi-objective optimization problems with more than two objectives, and can produce more uniform solutions. However, this method is very sensitive to penalty parameters, and usually cannot handle different complex multi-objective optimization problems.
In general, as the Chebyshev decomposition method is more suitable in solving both non-convex and convex problems, this paper adopts the Chebyshev decomposition method in the process of solving the bi-objective optimization problem (13), and the parameters of MOEA/D are consistent with the setting in literature [36].
The pseudo codes of MOEA/D are summarized in Algorithm 1:
Algorithm 1. MOEA/D.
Input: a multi-objective optimization problem.
A stop condition % the maximum number of iterations Gen.
Decompose into the number of subproblems N.
A set of weight vectors λ = (λ1, …, λN).
Number of neighbors T
Output: Approximate Pareto Frontier EP.
1. Initialization
2.  suppose EP = (The represents a empty set).
3.  Calculate the distance between each weight vector and the ownership vector, take the nearest T weight vectors of each weight vector, and store their index in B. For each i = 1, 2, …, N, B(i) = {i1, i2, …, iT}.
4.  Randomly or by other methods to generate initial population: x1, x2, …, xN.
5.  For each i = 1, 2, …, N, set FVi= F(xi).
6.  Initialize reference point z.
7.  while the stop condition is not met
8.    for i = 1: N
9.     Generate offspring: randomly select two indexes k and l from B(i), and use analog binary crossover operator to generate offspring individuals x* from xk and xl.
10.       Adjustment: if necessary (out of bounds, etc.), then adjust x*.
11.       Calculate the objective function value F(x*).
12.      for j = 1: m
13. if fj(x*)< zj
14.           zj = fj(x*)
15.         else
16.            zj = zj
17.         end
18. end
19.      for j = 1: sum(B(i))
20.         if gtch(x*|λj, z) ≤gtch(xj|λj, z)
21.           xj = x*, FVj = F(x*)
22.         else
23.             xj = xj, FVj = FVj
24.end
25.       end
26.       Update EP: First delete all target vectors dominated by F(x*) in EP, then add the F(x*) to EP.
27.     end % corresponds to the for in line 8
28.    end % corresponds to the while in line 7
29. END

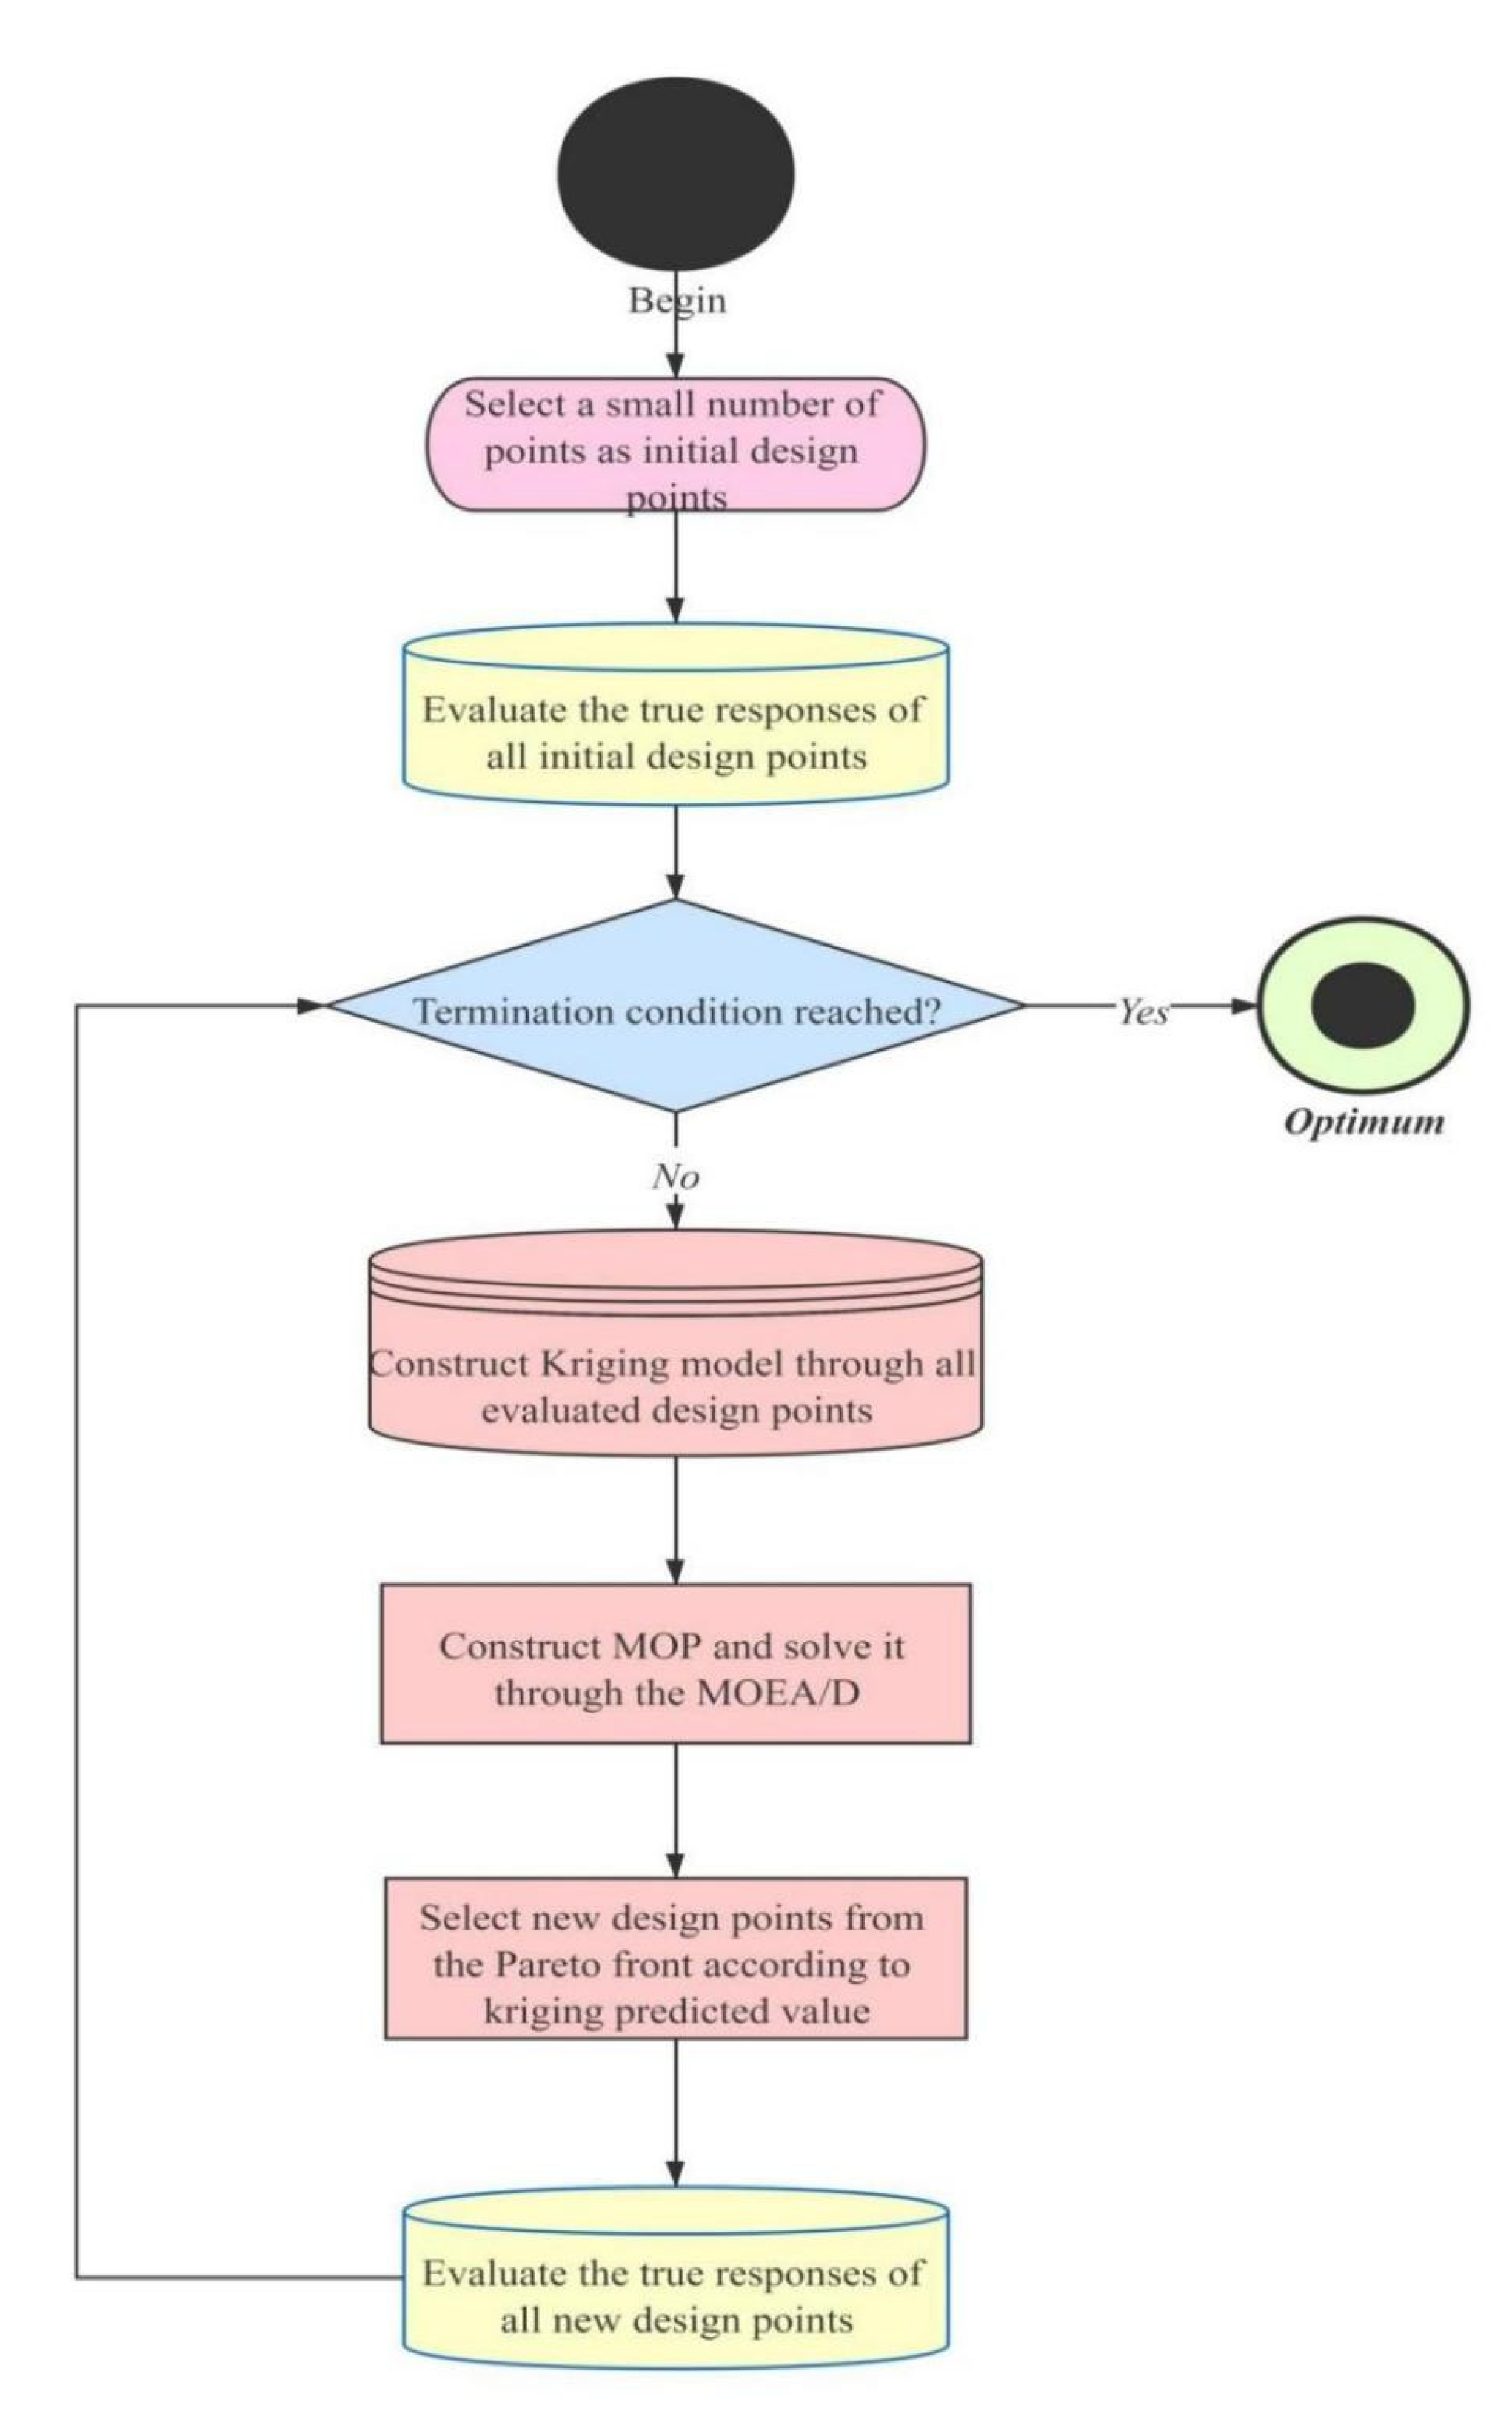
3.3. Kriging-Based Global Optimization Based on Multi-Point Infill Sampling Criterion

The framework of the Kriging-based global optimization algorithm using multi-point infill sampling criterion proposed in this paper is summarized as: First, the design of experiment is used to obtain the initial sampling points. Then, in each iteration, the candidate sampling points which balancing exploration and exploitation are generated through solving the MOP in the [28]. To select high-quality sampling points from candidates, the kriging values of them are used. Finally, the optimization is conducting until the stopping condition is reached. The pseudo codes are shown in Algorithm 2:
Algorithm 2. Multi-point infill sampling criterion. Global Optimization BASED on Kriging Using Multi-Point Infill Sampling Criterion.
1. Initialization
2.  Use design of experiment (DOE) to select a small number V of initial design points: {p1, p2, …, pV} %According to the literature [5], the selection number Vis generally 5d or 11d-1, where d is the number of design variables.
3.  for i = 1: V
4.      Evaluate the response values R(pi) of the design point pi
5.  end
6.    while the given algorithm termination condition is not met (in actual engineering problems, it is generally judged whether a certain number of iterations has been reached)
7.    Use all known design points and their corresponding objective function values to construct a Kriging model.
8.      Construct the MOP: min {EI1(x), EI2(x)}
9.    Solve the MOP through the decomposition-based multi-objective evolutionary algorithm (MOEA/D).
10.    Obtain the PS and its corresponded PF of the MOP with a number B of candidates: {ps1, ps2,…, psB}
11.      for i = 1: B
12.        calculate the Kriging predicted value kpv(psi) of the point psi
13.     end
14.    KPV = []
15.    for i = 1: B
16.      KPV = [KPV, kpv(psi)]
17.    end
18.    KPV = sort(KPV, ‘ascend’)
19.    for i = 1: n
20.       find the corresponding point cpi of the KPV(i)
21.    end
22.    for i = 1: n
23.       Evaluate the response values R(cpi) of the design point cpi.
24.    end
25.   end % corresponds to the while in line 6.
26.  output the optimal solution.
27. END
The flowchart is shown in Figure 1:

4. Numerical and Engineering Examples Based on the Multi-Point Infill Sampling Criterion

All the experiments are run on Matlab 2018a software in a computer with 8 GB memory, Intel i5 CPU and Microsoft Windows 10.

4.1. Numerical Analysis

Taking two typical benchmark functions as examples, and KGO using the EI criterion (simply EI criterion) is applied to compare with KGO using the multi-point infill sampling criterion (simply multi-point infill sampling criterion) proposed. The performance evaluation criteria are the size of the optimized value under the same number of iterations, the size of the optimized value and the number of iterations are used to measure the optimal accuracy and time respectively. Hence, in the numerical analysis, the stable number of iterations is set as the stopping condition.

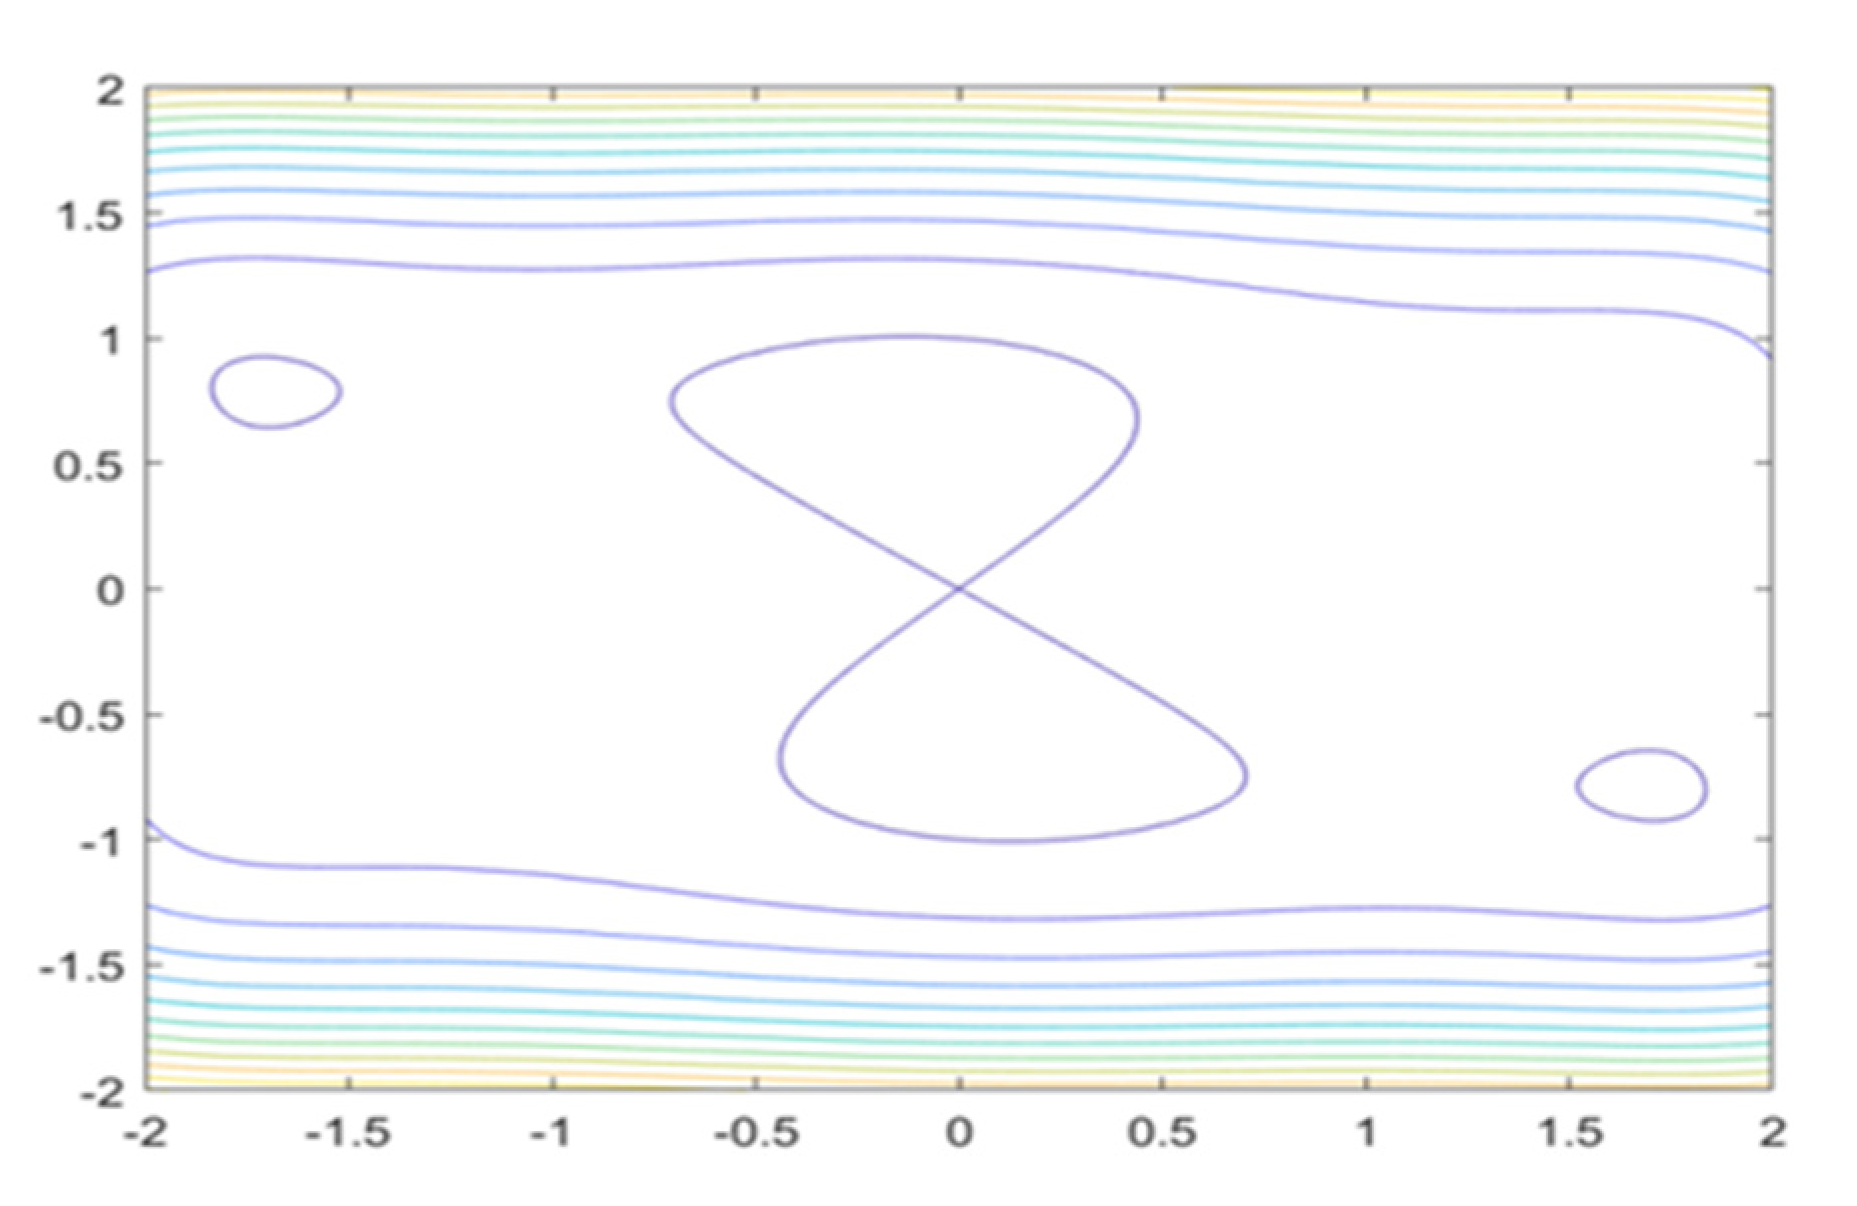
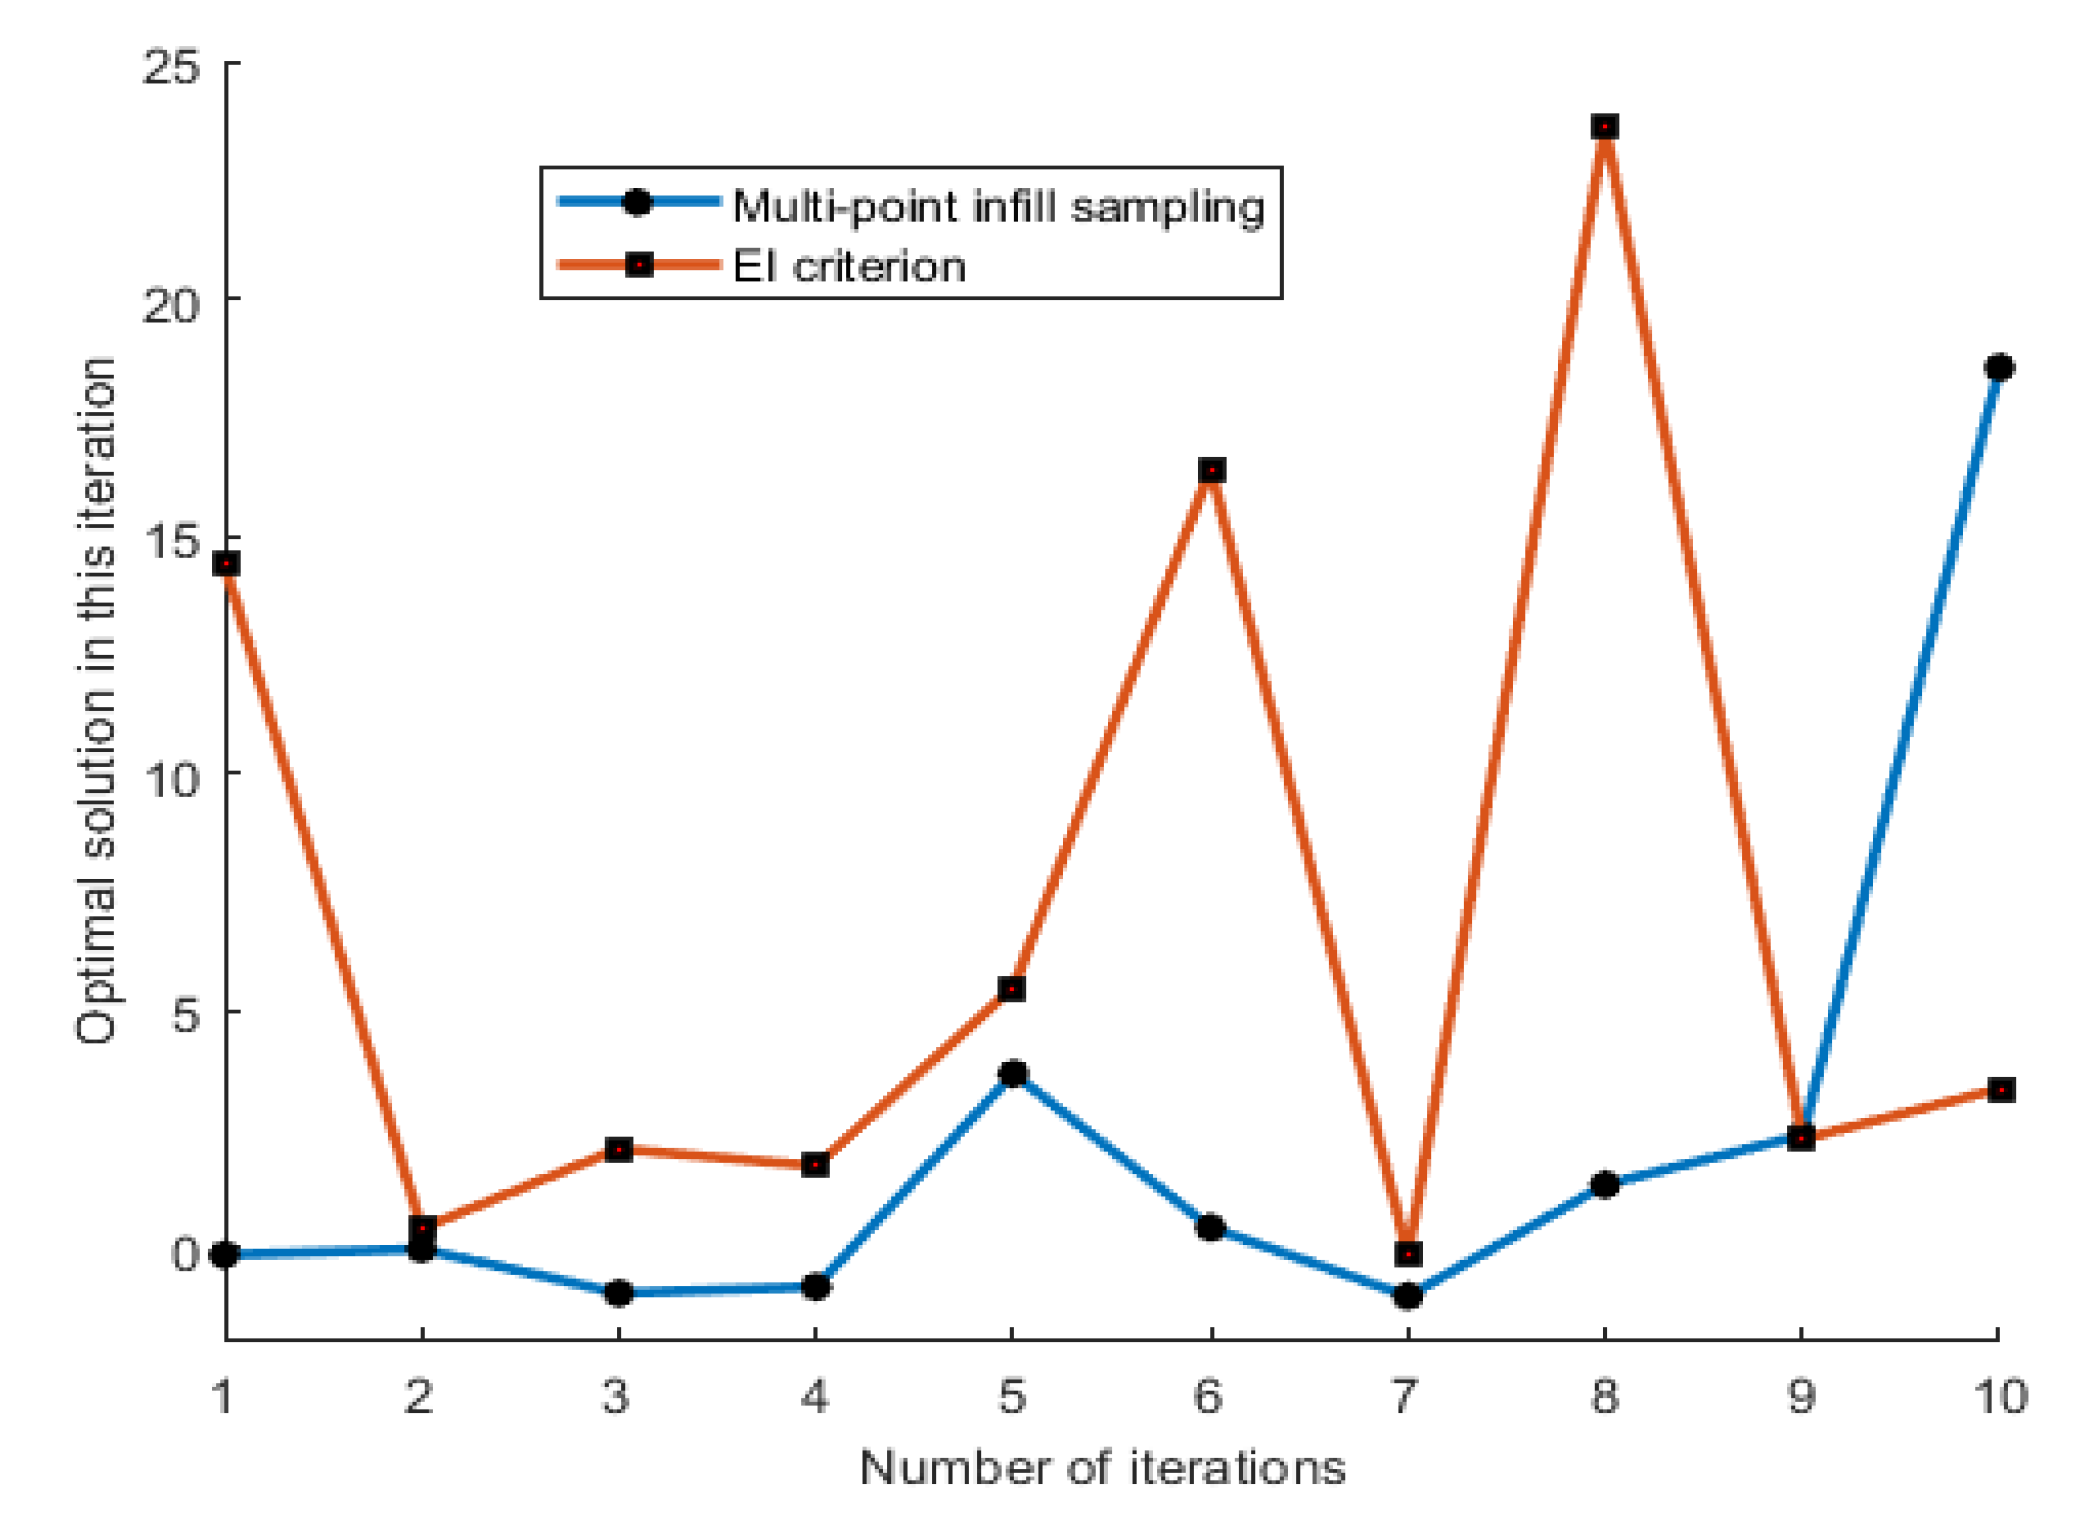
4.1.1. Six-Hump Camel Back Function (SC)

The contour of the function is shown in Figure 2:
f ( x ) = 4 x 1 2 2.1 x 1 4 + 1 3 x 1 6 + x 1 x 2 4 x 2 2 + 4 x 2 4 ; x 1 , x 2 [ 2 , 2 ]
The initial sample points are 10 design points, and the results of the two methods are shown in Figure 3 and Table 1:

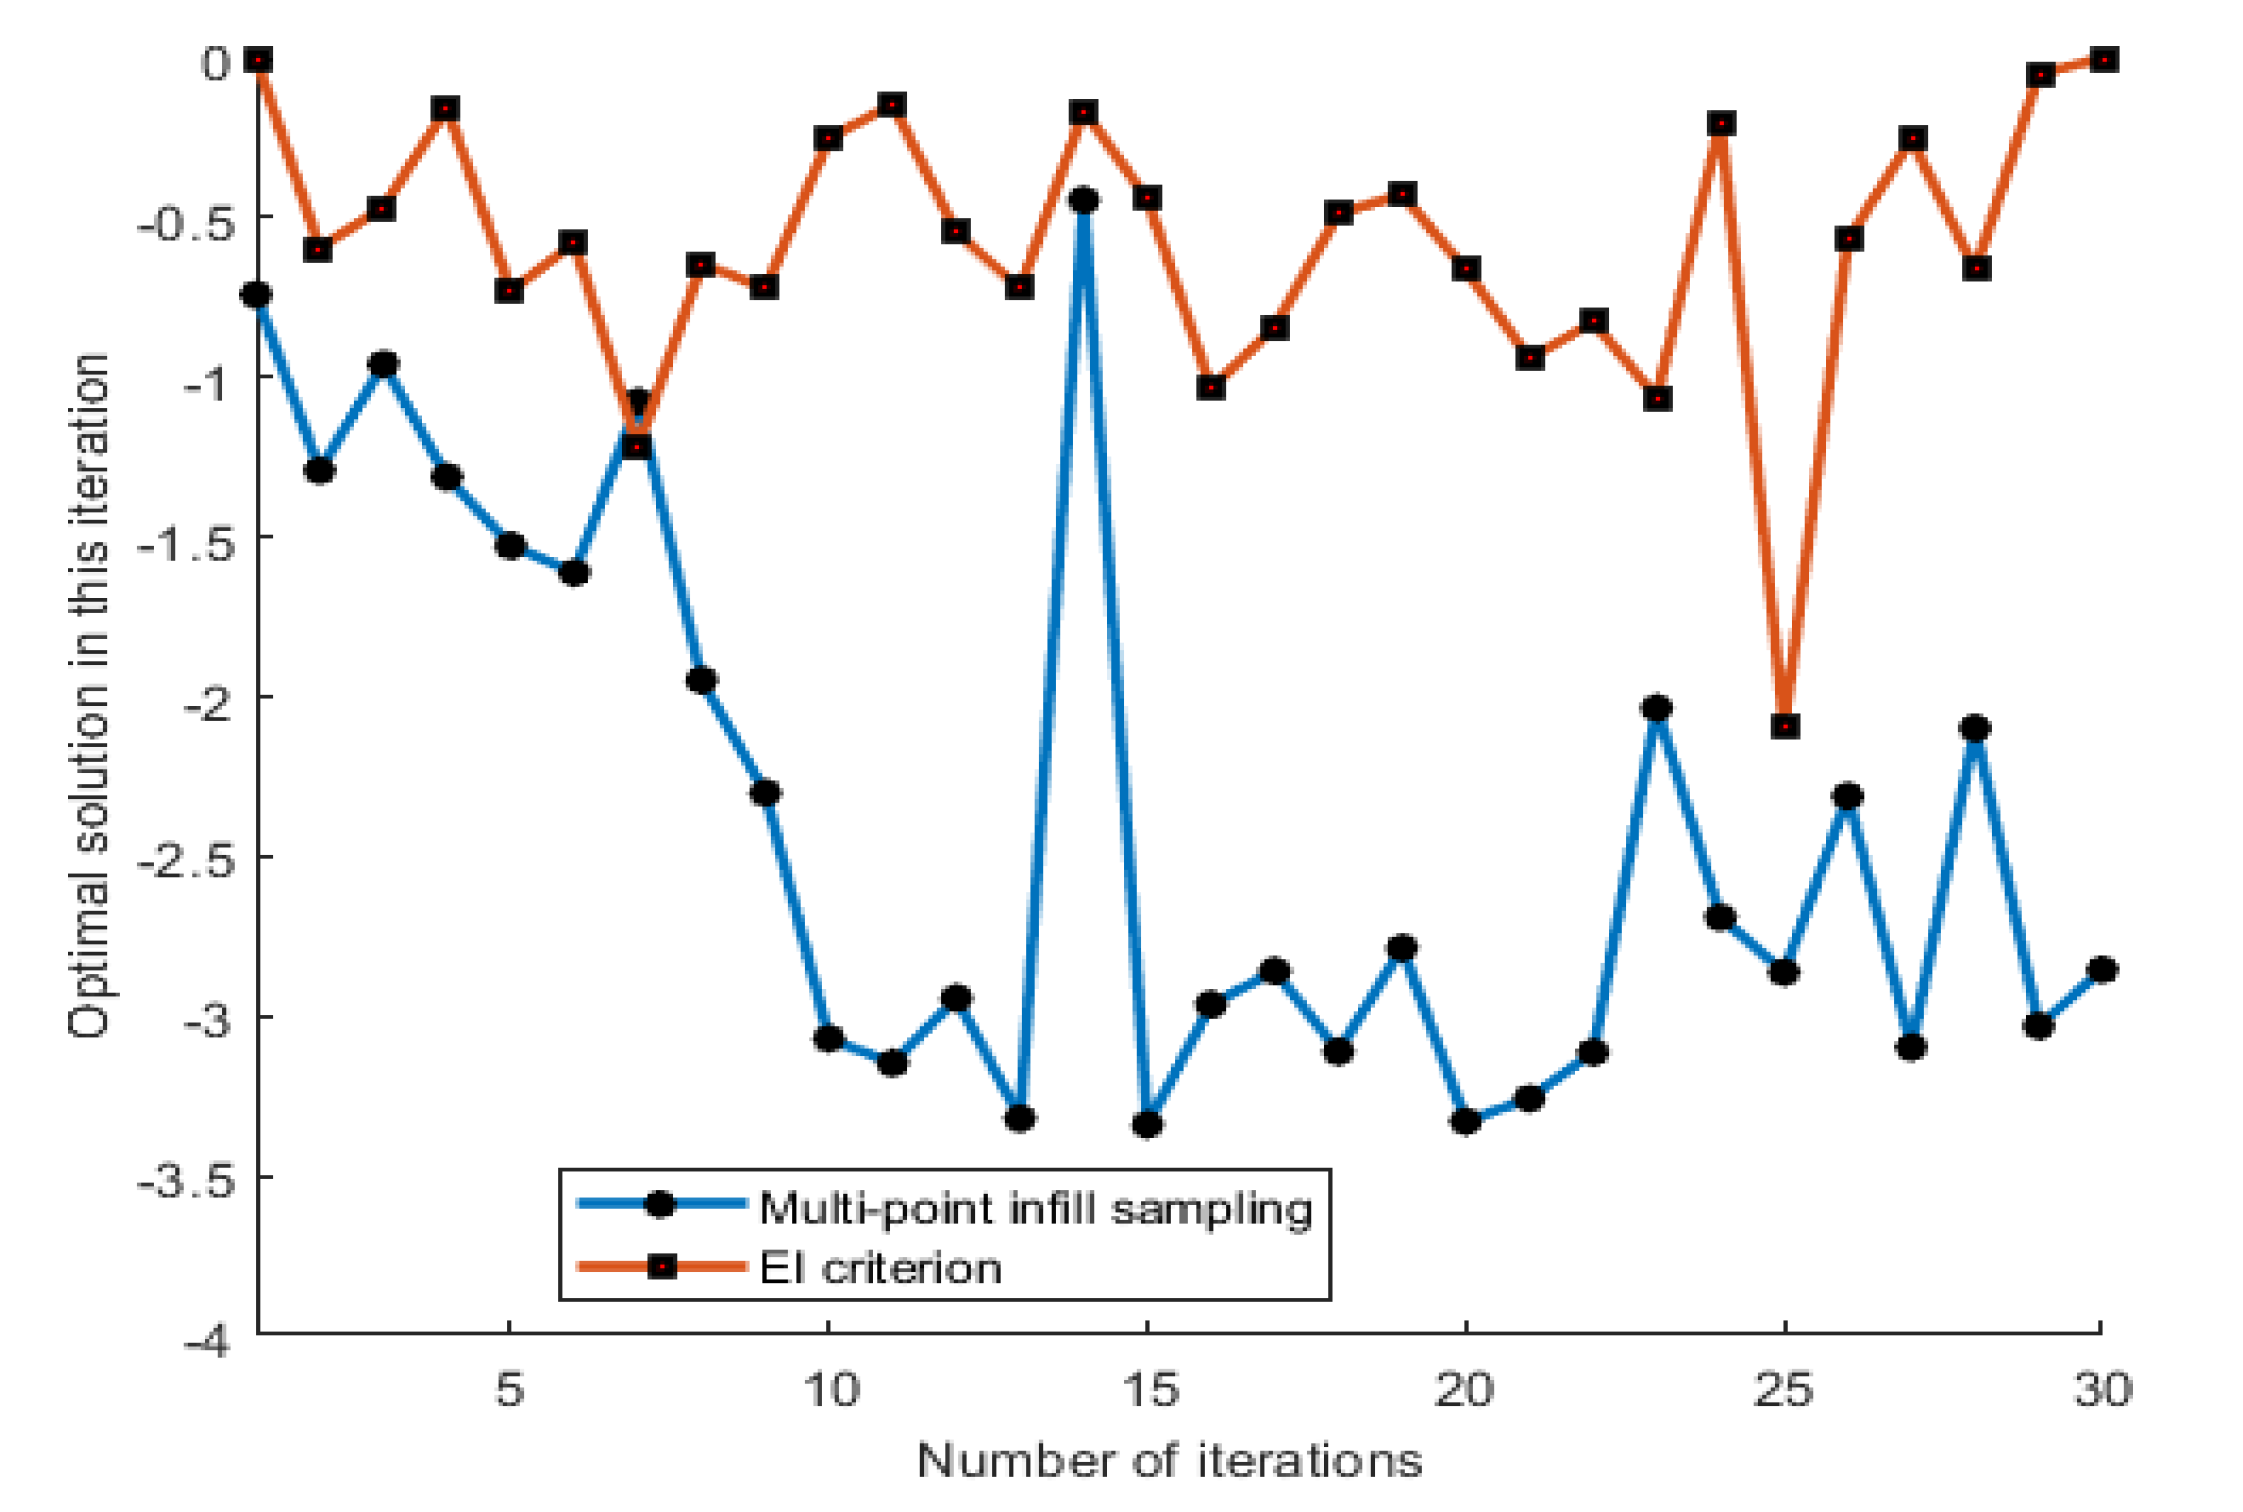
4.1.2. Hartman 6 Function (H6)

The initial sample points are 30 design points, and the results of the two points addition methods are shown in Figure 4 and Table 2:
f ( x ) = i = 1 4 c i e x p ( j = 1 6 α i j ( x j p i j ) 2 ) ; 0 x i 1
α i j = [ 10 3 17 3.5 1.7 8 0.05 10 17 0.1 8 14 3 3.5 1.7 10 17 8 17 8 0.05 10 0.1 14 ] , c i = [ 1 1.2 3 3.2 ] p i j = [ 0.1312 0.1696 0.5569 0.0124 0.8283 0.5886 0.2329 0.4135 0.8307 0.3736 0.1004 0.9991 0.2348 0.1451 0.3522 0.2883 0.3047 0.6650 0.4047 0.8828 0.8732 0.5743 0.1091 0.0381 ]
It can be seen from the above comparison results that the method proposed in this paper has better optimization results. This means that when using high-performance parallel computer, the method proposed in this paper can obtain better optimal solutions at the same time. On high-dimensional issues, the advantages of the multi-point infill sampling criterion are more obvious, and this feature is more in line with real-world engineering problems.

4.1.3. The Test of MOEA/D Parameters

In this section, the influence of MOEA/D parameters (number of neighbors T, the maximum number of iterations gen) is studied by SC function in Table 3 and Table 4:

4.2. Engineering Case

4.2.1. Optimization Model and Process

In this paper, optimizing the corporate revenue in the simulation model of transportation system [38] is employed as the engineering case to verify the performance of multi-point infill sampling criterion. The simulation model of the transportation system is based on a data-driven timetable optimization method and details of its construction can be seen in the literature [38].
In the simulation model of the transportation system, the variables with decision-making value mainly include the maximum number of departures I, the minimum departure interval hmin, and the maximum departure interval hmax. This article intends to optimize these parameters to improve corporate revenue, and the optimization model constructed is as follows:
min : P = N p * F p N v * C v
Subject to:
l I I u I
l h min h min u h min
l h max h max u h max
T h max I T h min
Among them, Np corresponds to the number of passengers under the timetable, and Fp is the passenger fare. Nv is the number of departures under the corresponding timetable, and Cv is the operating cost coefficient for the vehicle to complete one service. T is the time interval between the first and the last bus, which needs to be determined according to the data selection range.

4.2.2. Data Description

The 445 bus line in Beijing city is selected in the case study. There are 19 bus stops on the route, and the collection time of GPS trajectory data and Smart Card data was from 1 to 30 November 2017. In the case of this paper, select the data between 17:30 and 18:30. The data information is shown in Table 5 and Table 6:
According to the actual condition of the 445 bus line, the value ranges of the three decision variables: maximum number of departures I, minimum departure interval hmin and maximum departure interval hmax are set as follows:
10 I 20 2 h min 3 15 h max 20
Among them, I should be an integer, and hmin and hmax can be accurate to one decimal place. Their original values are set to be consistent in the literature [38].
The maximum passenger capacity of the bus is 50, the interval between the first and last buses T is 60 min, the fare of the 445 bus is 3 yuan/person, and the operating cost coefficient of the bus is 39.6 yuan/car.

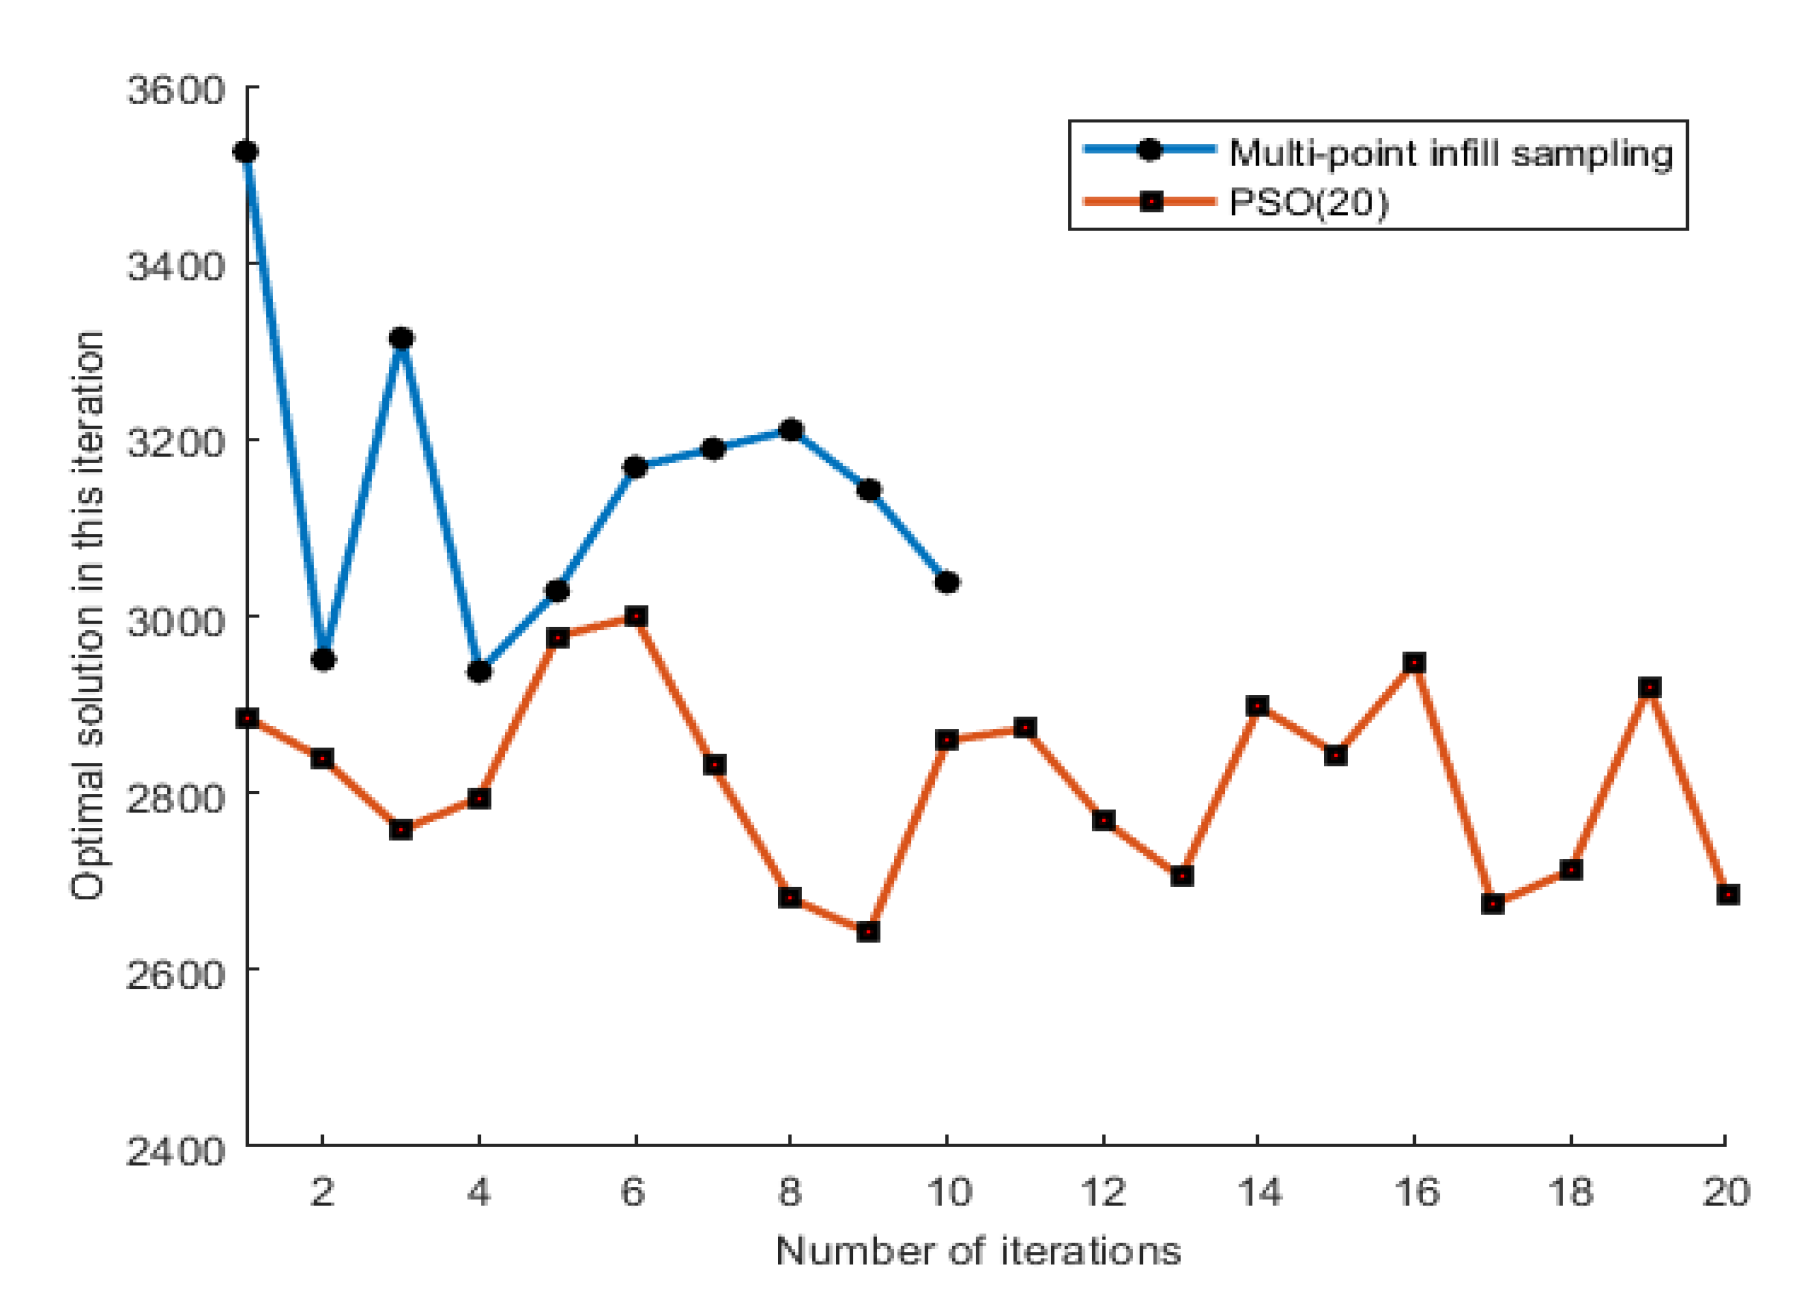
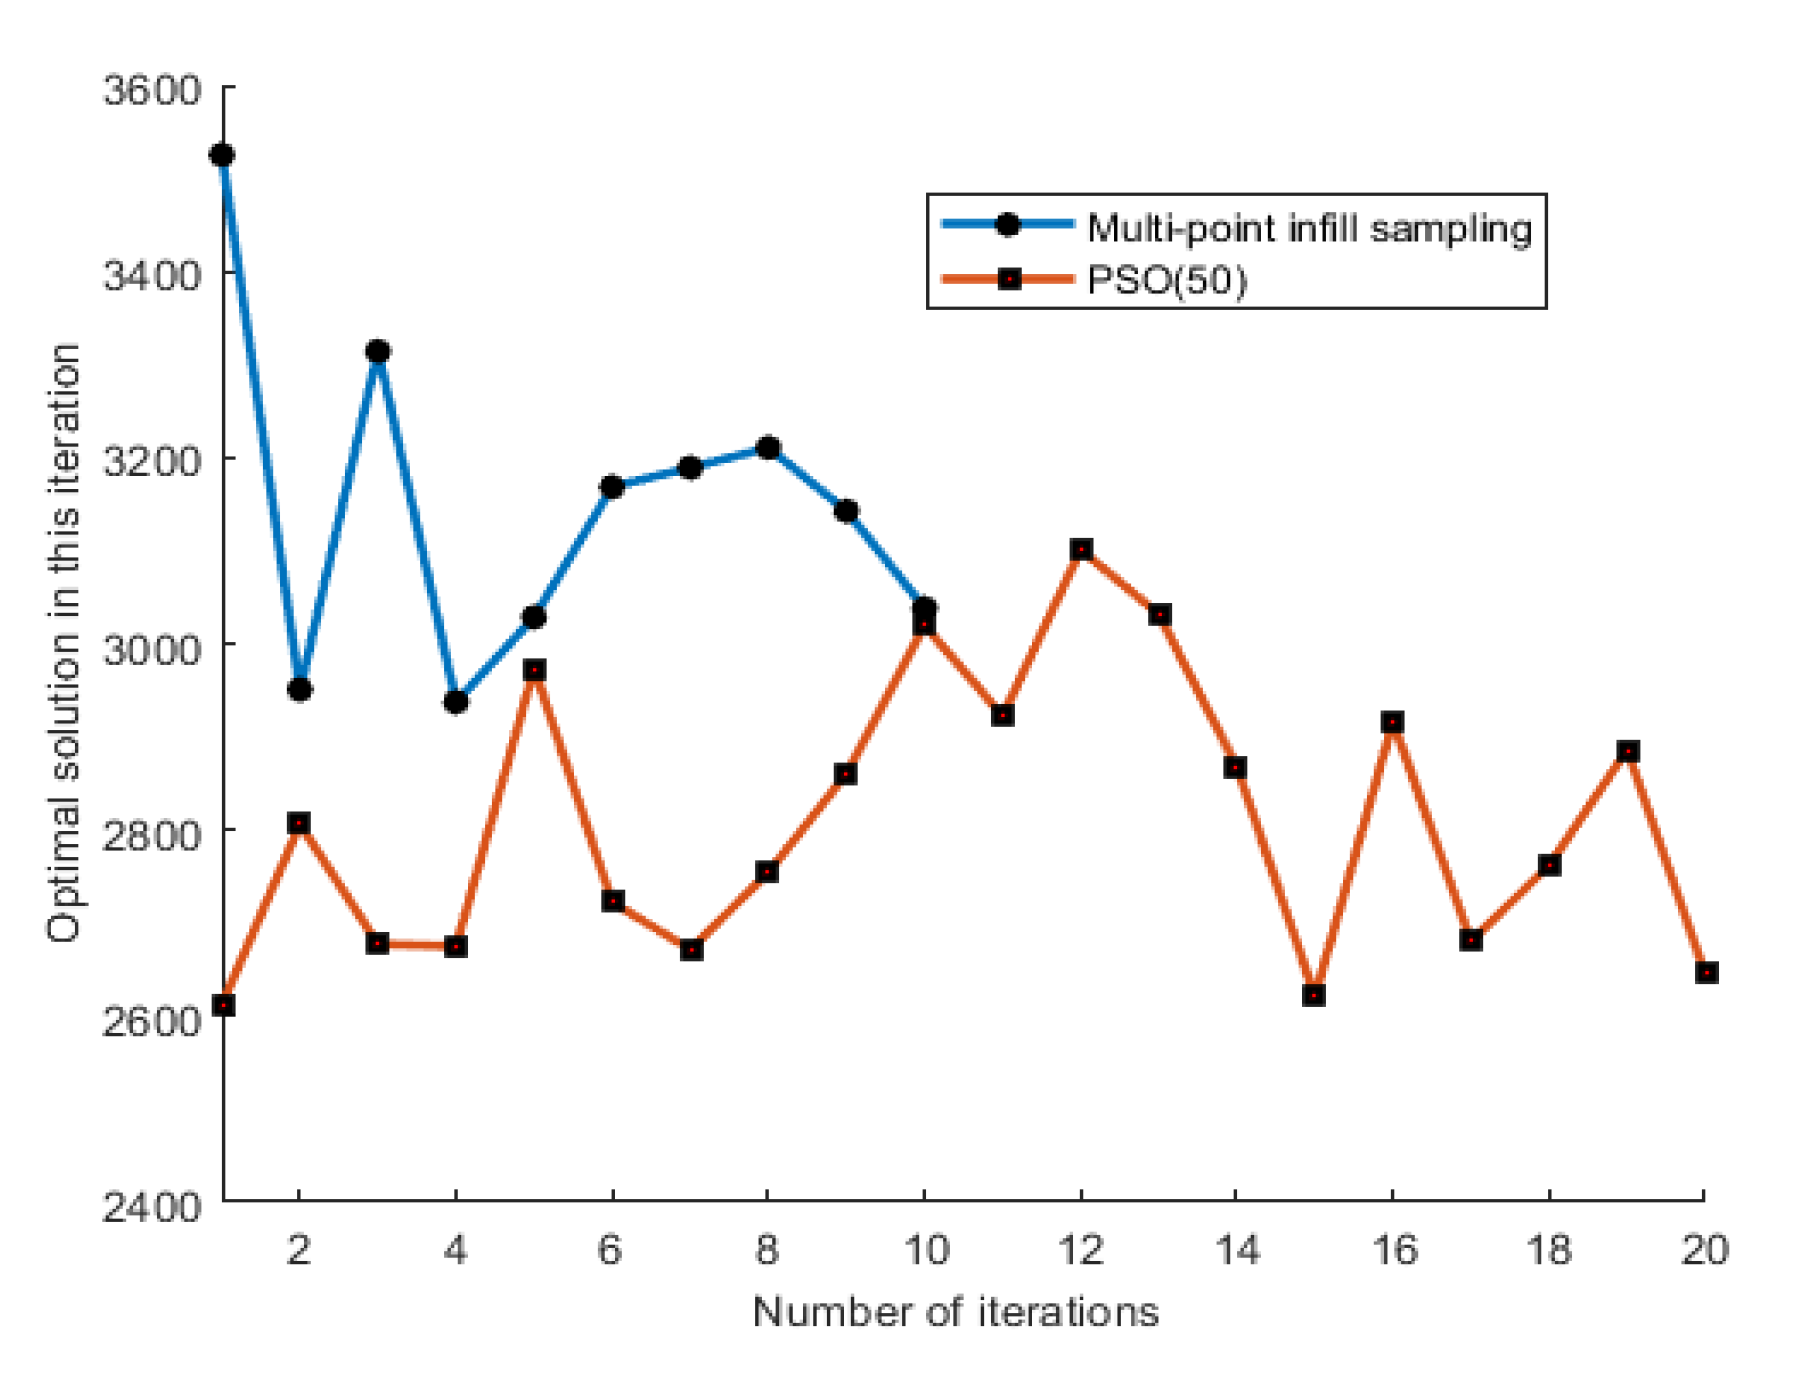
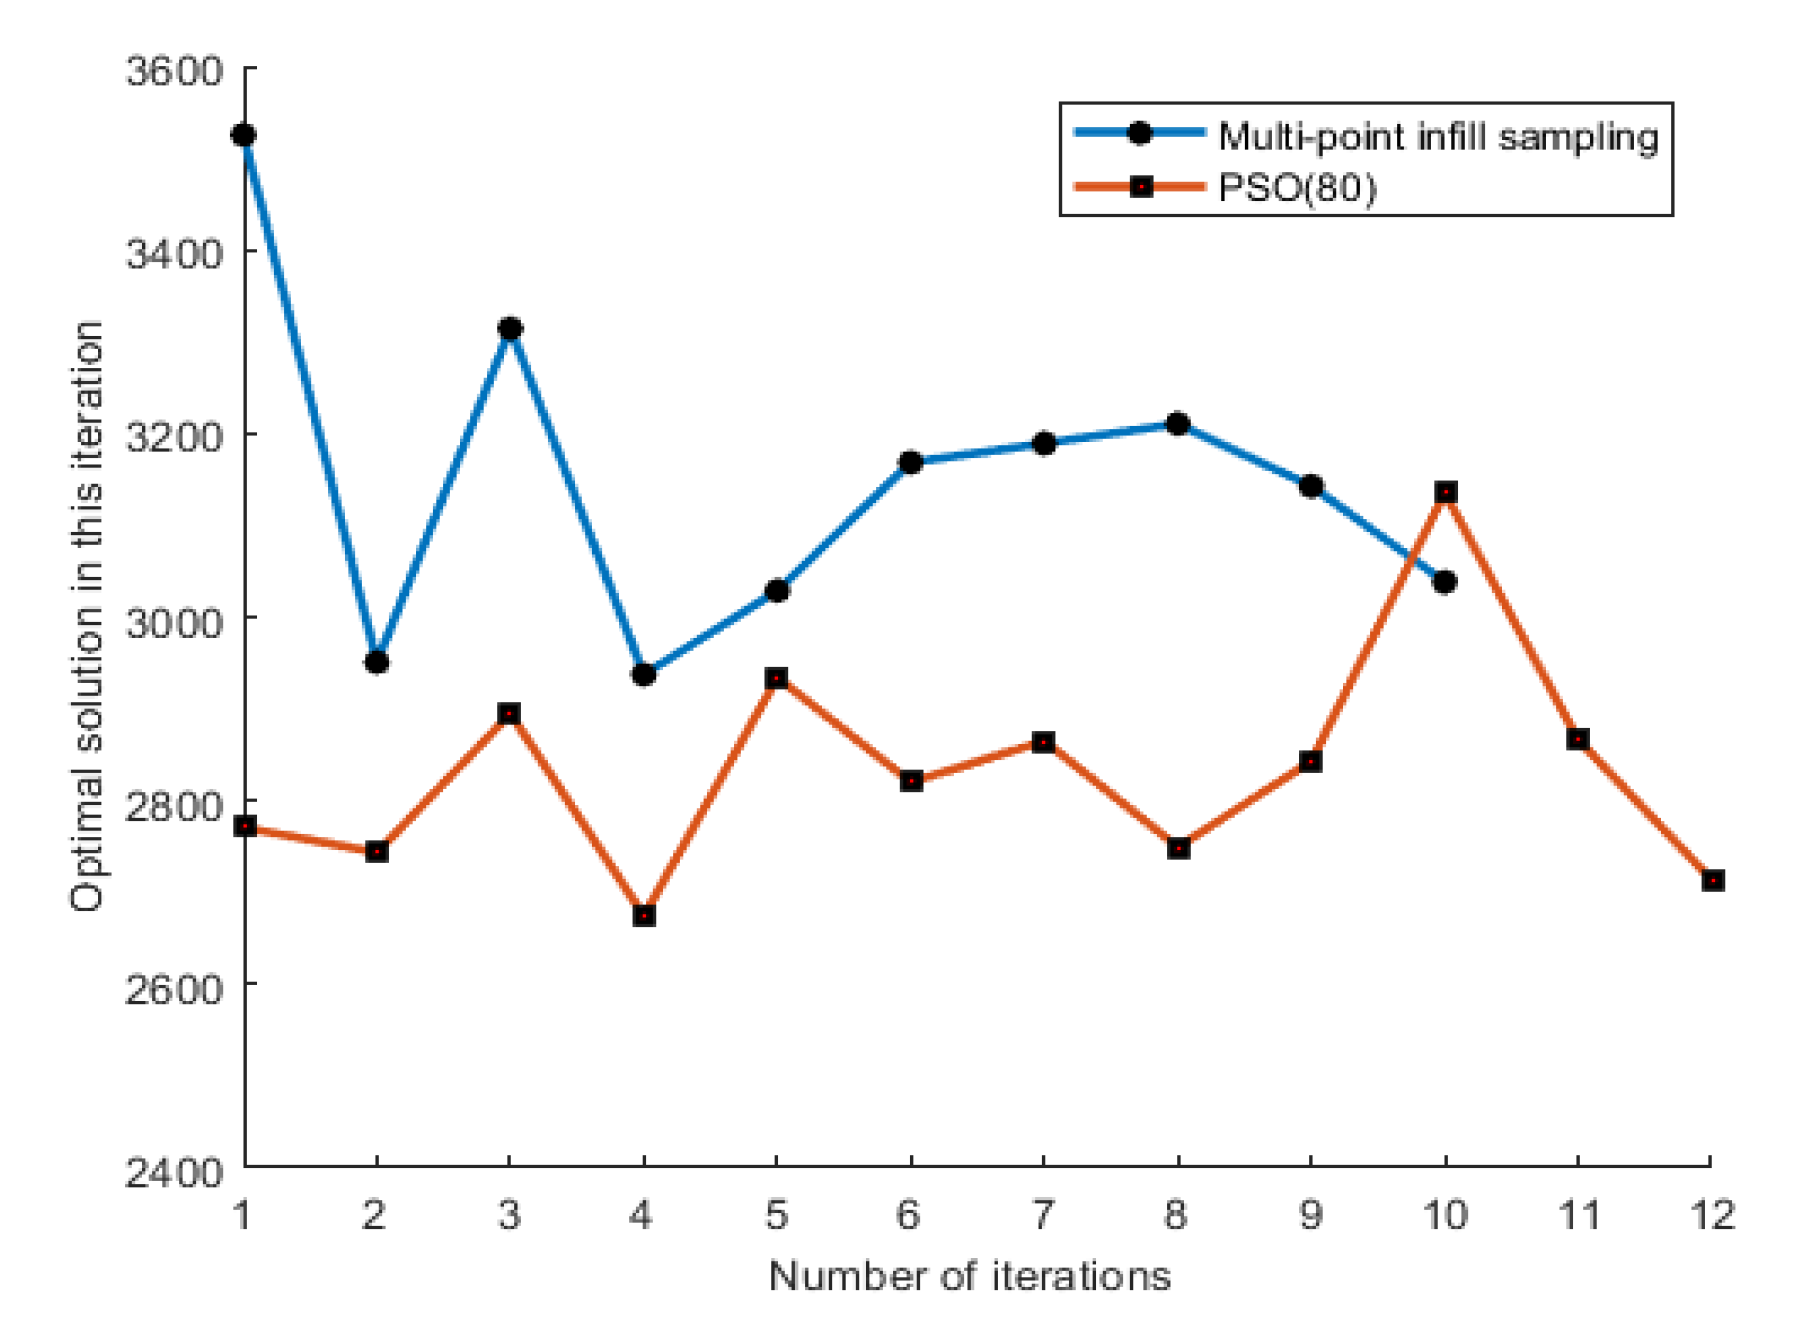
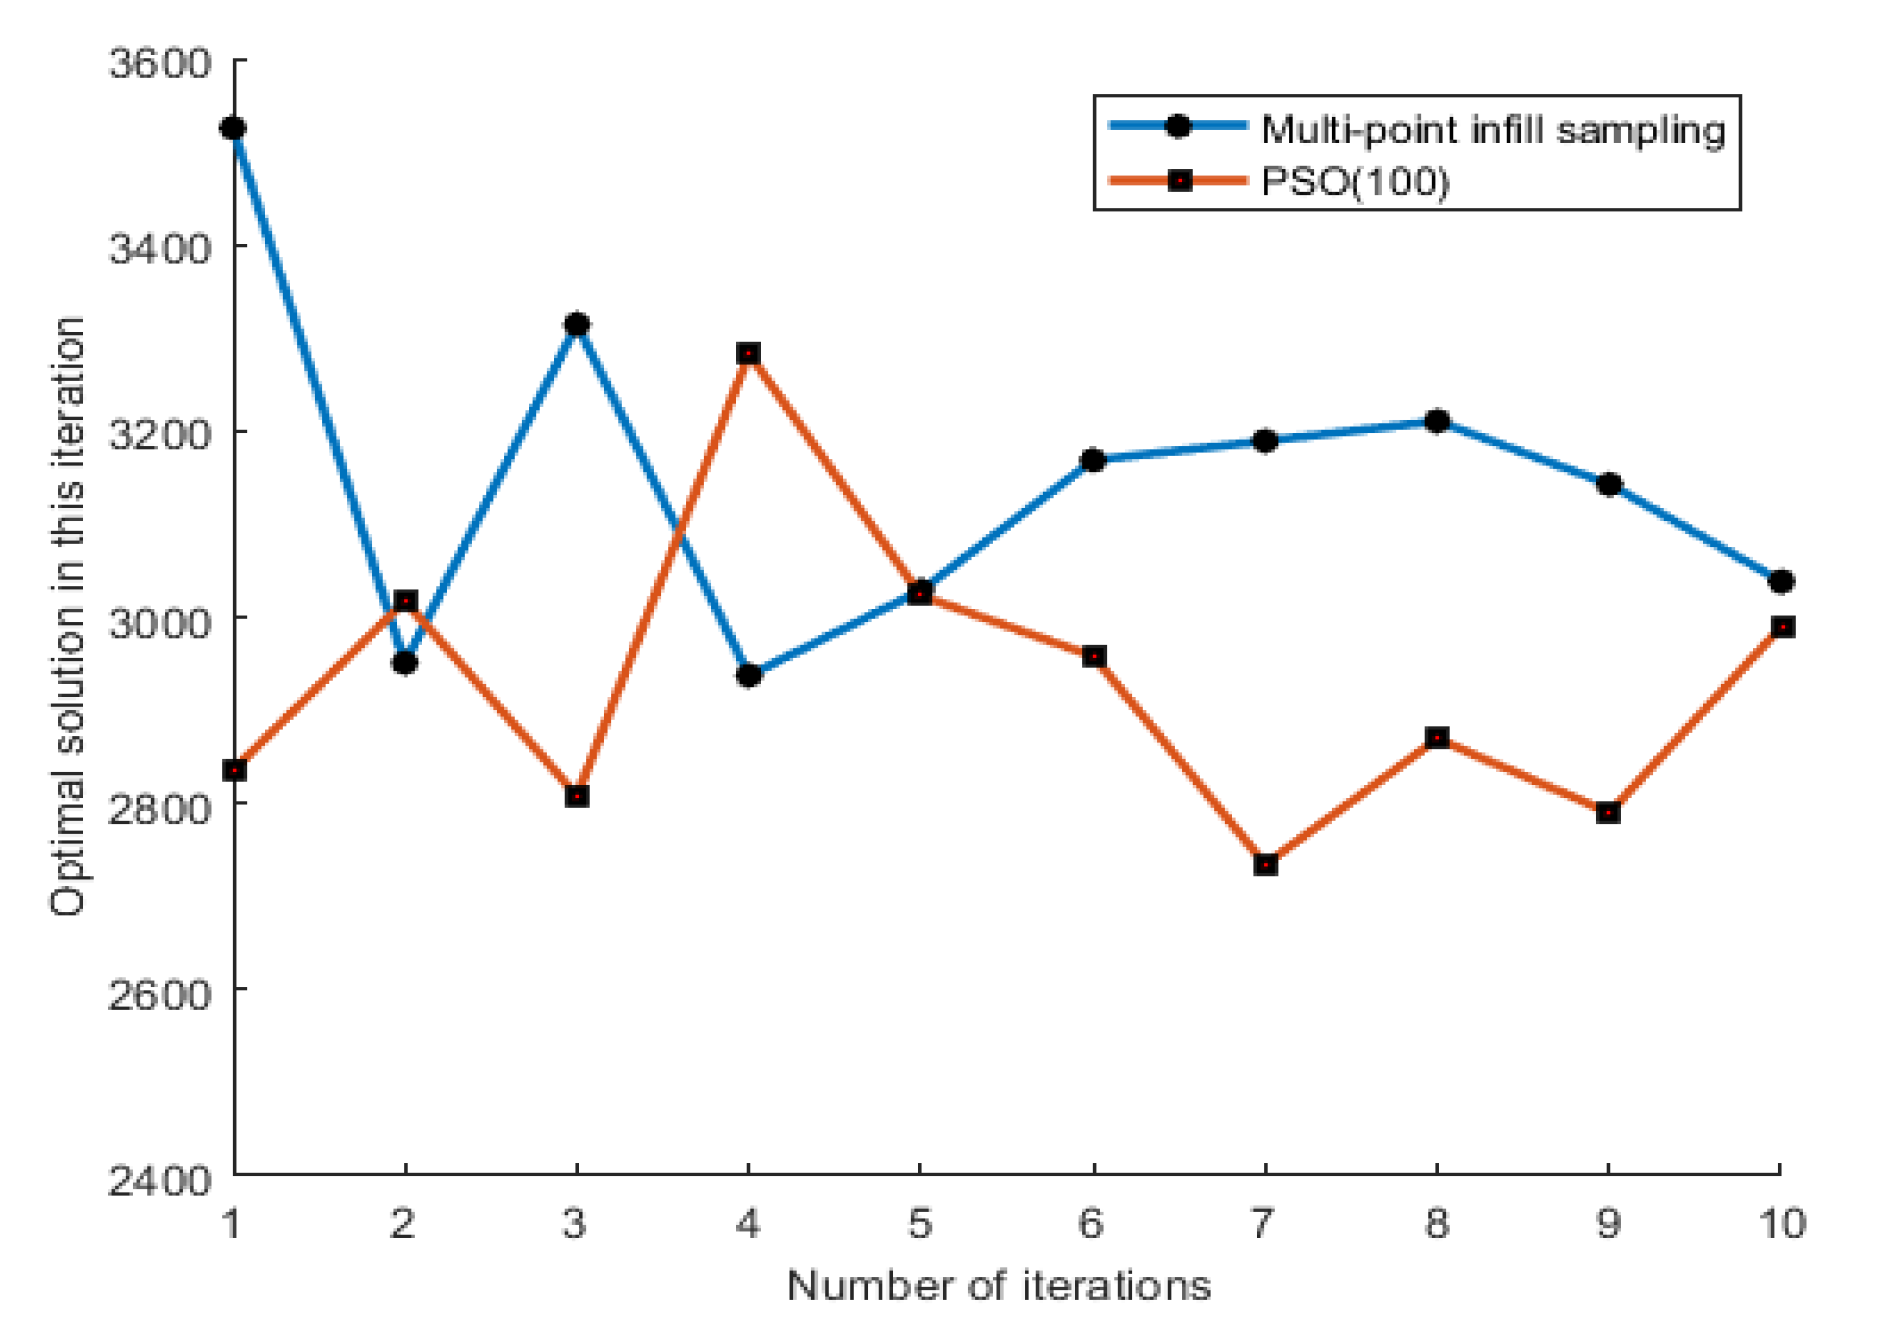
4.2.3. Result Analysis

The particle swarm algorithm (PSO) and multi-point infill sampling criterion are applied to optimize corporate revenue respectively. Due to the long optimization time, the number of populations in PSO cannot be selected too large. The selections are 20, 50, 80 and 100 in this test. The maximum number of iterations is set to 20, the maximum particle velocity is set to 0.1, the minimum velocity is set to 0, and the maximum number of function evaluations is 1000. The optimization results are shown in Table 7 and Figure 5, Figure 6, Figure 7 and Figure 8:
Since the time for evaluating corporate revenue is about 900 s, it is much longer than the running time of the optimization algorithm. Therefore, the number of iterations can be used to measure the optimization efficiency of the algorithm under the use of parallel computing technology, and the number of function evaluations can be used to measure the optimization efficiency of the algorithm under the inapplicable parallel technology. The results explain that the multi-point infill sampling criterion can get better optimization results, which is an increase of 7.2% compared to the best result of PSO, 17.5%, compared to the worst result of PSO, and even 45%, compared to the suboptimal value. In terms of optimization efficiency: under the premise of using parallel technology, the multi-point criterion can increase the efficiency by 50% on the basis of obtaining better optimization solutions; under the premise of not using the combination technology, the efficiency of this method is improved more obviously: 64%, 92.5%, 92.8%. It can be seen that, in dealing with expensive black box problems, the method proposed in this paper is far stronger than the PSO in terms of solution accuracy and optimization efficiency.

4.3. Implications

Summary of Section 4.1 and Section 4.2, our optimization method has its advantage in solving simulation-based optimization problems. In some developing countries with large populations like China, traffic resources such as urban roads are relatively limited and traffic congestion is getting worse. Public transportation is an important means to alleviate traffic congestion. In the decision-making stage, solving simulation-based optimization problems can provide a good reference for decision makers. Hence, our method has a positive impact on sustainable development, to a certain extent. Moreover, this method is board, not only for the simulation-based optimization in traffic area. In other areas like, for example, simulation model optimization of groundwater dredging, our method can also be tried. As a general method, simulation-based optimization is of great help to the decision-making of sustainable development.

5. Conclusions and Discussion

Simulation-based optimization is a common but difficult problem to deal with. In order to solve the expensive optimization problem efficiently, this study proposes a novel multi-point infill sampling method based on solving a multi-objective optimization problem to obtain exploration–exploitation trade-off points in each iteration, and then improve the performance of Kriging-based global optimization, which is also called a Bayesian optimization based on Gaussian process in the machine learning field. Moreover, the proposed method may deal with the real-world problems better. The main conclusions are shown as follows:
  • Considering the disadvantages of EGO and EGO-MO, this paper proposes a Kriging-based global optimization using multi-point infill sampling criterion. The characteristic of comparison to the already existing research is that the multi-point infill sampling criterion uses the method of EGO-MO to generate candidate sampling points, and the Kriging predicted values are employed as judgment standard. In this way, the extra parameters required are greatly reduced.
  • At present, in the field of transportation, there are a few research studies on how to deal with simulation-based optimization problems. Therefore, the method proposed in this paper has certain reference significance for other time-consuming optimization problems in the transportation field.
The core of our proposed algorithm is the multi-point infill sampling criterion. The criterion selects multiple exploration–exploitation trade-off points to update the Kriging model in each iteration. However, our criterion is mainly based on the traditional EI function—it is difficult to search the area, except the current minimum. Then, how to solve the constructed MOP better is also a problem worth investigating. In addition, the method in this paper is the lack of more practical applications. In the future, we will be more focused on the black-box optimization-combined time-consuming simulations of real-world traffic problems and continuously improve our algorithm in practical applications.

Author Contributions

Conceptualization, X.S.; Methodology, F.L.; Supervision, X.S.; Validation, M.L.; Visualization, M.L. and Z.L.; Writing—original draft, X.S., M.L. and F.L.; Writing—review and editing, M.L. All authors have read and agreed to the published version of the manuscript.

Funding

This research was funded, in part, by the Natural Science Foundation of Hunan Province (No. 2020JJ4752), Innovation-Driven Project of Central South University (No. 2020CX041), Foundation of Central South University (No. 502045002).

Institutional Review Board Statement

Not applicable.

Informed Consent Statement

Not applicable.

Data Availability Statement

Data sharing not applicable.

Conflicts of Interest

The authors declare no conflict of interest. The funders had no role in the design of the study; in the collection, analyses, or interpretation of data; in the writing of the manuscript, or in the decision to publish the results.

References

  1. Pourhejazy, P.; Kwon, O.K. The new generation of operations research methods in supply chain optimization: A review. Sustainability 2016, 8, 1033. [Google Scholar] [CrossRef] [Green Version]
  2. Zheng, L.; Xue, X.; Xu, C.; Ran, B. A stochastic simulation-based optimization method for equitable and efficient network-wide signal timing under uncertainties. Transp. Res. Part B 2019, 122, 287–308. [Google Scholar] [CrossRef]
  3. Simpson, T.; Booker, A.; Ghosh, D.; Giunta, A.; Koch, P.; Yang, R.-J. Approximation methods in multidisciplinary analysis and optimization: A panel discussion. Struct. Multidiscip. Optim. 2004, 27, 302–313. [Google Scholar] [CrossRef] [Green Version]
  4. Han, Z.H. Kriging surrogate model and its application to design optimization: A review of recent progress. Acta Aeronaut. Astronaut. Sin. 2016, 37, 3197–3225. [Google Scholar]
  5. Jones, D.R.; Schonlau, M.; Welch, W.J. Efficient global optimization of expensive black-box functions. J. Glob. Optim. 1998, 13, 455–492. [Google Scholar] [CrossRef]
  6. Henkenjohann, N.; Kunert, J. An efficient sequential optimization approach based on the multivariate expected improvement criterion. Qual. Eng. 2007, 19, 267–280. [Google Scholar] [CrossRef]
  7. Kleijnen, J.P.; Van, B.W.; Van, N.I. Expected improvement in efficient global optimization through bootstrapped Kriging. J. Glob. Optim. 2012, 54, 59–73. [Google Scholar] [CrossRef]
  8. Picheny, V.; Wagner, T.; Ginsbourger, D. A benchmark of Kriging based infill criteria for noisy optimization. Struct. Multidiscip. Optim. 2013, 48, 607–626. [Google Scholar] [CrossRef] [Green Version]
  9. Wang, X.; Gu, J.; Wang, X. Warpage optimization with dynamic injection molding technology and sequential optimization method. J. Adv. Manuf. Technol. 2015, 78, 177–187. [Google Scholar] [CrossRef]
  10. Jeong, S.; Murayama, M.; Yamamoto, K. Efficient Optimization Design Method Using Kriging Model. J. Aircr. 2004, 42, 1375. [Google Scholar] [CrossRef]
  11. Meunier, M. Simulation and Optimization of Flow Control Strategies for Novel High-Lift Configurations. AIAA J. 2009, 47, 1145–1157. [Google Scholar] [CrossRef]
  12. Wang, X.; Li, M.; Liu, Y.; Sun, W.; Song, X.; Zhang, J. Surrogate based multidisciplinary design optimization of lithium-ion battery thermal management system in electric vehicles. Struct. Multidiscip. Optim. 2017, 56, 1555–1570. [Google Scholar] [CrossRef]
  13. Song, X.; Sun, G.; Li, Q. Sensitivity analysis and reliability based design optimization for high-strength steel tailor welded thin-walled structures under crashworthiness. Thin-Walled Struct. 2016, 109, 132–142. [Google Scholar] [CrossRef]
  14. Song, J.; Yang, Y.; Wu, J.; Wu, J.; Sun, X.; Lin, J. Adaptive surrogate model based multiobjective optimization for coastal aquifer management. J. Hydrol. 2018, 561, 98–111. [Google Scholar] [CrossRef]
  15. Mastrippolito, F.; Aubert, S.; Ducros, F. Kriging metamodels-based multi-objective shape optimization applied a multi-scale heat exchanger. Comput. Fluids 2021, 221, 104899. [Google Scholar] [CrossRef]
  16. Li, Y.; Shi, J.; Cen, H. A Kriging-based adaptive global optimization method with generalized expected improvement and its application in numerical simulation and crop evapotranspiration. Agric. Water Manag. 2021, 245, 106623. [Google Scholar] [CrossRef]
  17. Li, Y.; Shen, J.; Cai, Z. A Kriging-assisted multi-objective constrained method for expensive black-box functions (dagger). Mathematics 2021, 9, 149. [Google Scholar] [CrossRef]
  18. Xia, B.; Liu, R.; He, Z. A single- and multi-objective optimization algorithm for electromagnetic devices assisted by adaptive Kriging based on parallel infilling strategy. J. Electr. Eng. Technol. 2021, 16, 301–308. [Google Scholar] [CrossRef]
  19. Kroetz, H.; Moustapha, M.; Beck, A. A two-level Kriging-based approach with active learning for solving time-variant risk optimization problems. Reliab. Eng. Syst. Saf. 2020, 203, 107033. [Google Scholar] [CrossRef]
  20. He, Y.; Sun, J.; Song, P. Dual Kriging assisted efficient global optimization of expensive problems with evaluation failures. Aerosp. Sci. Technol. 2020, 105, 106006. [Google Scholar] [CrossRef]
  21. Passos, A.; Luersen, M. Kriging-based multiobjective optimization using sequential reduction of the entropy of the predicted pareto front. J. Braz. Soc. Mech. Sci. Eng. 2020, 42, 1–17. [Google Scholar] [CrossRef]
  22. Ribaud, M.; Balchet-Scalliet, C.; Helbert, C. Robust optimization: A Kriging-based multi-objective optimization approach. Reliab. Eng. Syst. Saf. 2020, 200, 106913. [Google Scholar] [CrossRef] [Green Version]
  23. Yi, J.; Zhou, Q.; Cheng, Y. Efficient adaptive Kriging-based reliability analysis combining new learning function and error-based stopping criterion. Struct. Multidiscip. Optim. 2020, 62, 2517–2536. [Google Scholar] [CrossRef]
  24. Tao, T.; Zhao, G.; Ren, S. An efficient Kriging-based constrained optimization algorithm by global and local sampling in feasible region. J. Mech. Des. 2020, 142, 1–48. [Google Scholar] [CrossRef]
  25. Hong, L.; Li, H.; Peng, K. A novel Kriging based active learning method for for structural reliability analysis. J. Mech. Sci. Technol. 2020, 34, 1545–1556. [Google Scholar]
  26. Shi, R.; Liu, L.; Long, T. Multi-Fidelity modeling and adaptive Co-Kriging-based optimization for all-electric geostationary orbit satellite systems. J. Mech. Des. 2020, 142, 021404. [Google Scholar] [CrossRef]
  27. Sobester, A.; Leary, S.J.; Keane, A.J. On the design of optimization strategies based on global response surface approximation models. J. Glob. Optim. 2005, 33, 31–59. [Google Scholar] [CrossRef] [Green Version]
  28. Feng, Z.; Zhang, Q.B.; Zhang, Q.F. Amultiobjective optimizationbased framework to balance the global exploration and local exploitation in expensive optimization. J. Glob. Optim. 2015, 61, 677–694. [Google Scholar] [CrossRef]
  29. Li, M.; Li, S.; Jia, N. Simulation and optimization of bus schedule based on passenger flow big Data. China Transp. Rev. 2020, 42, 81–85. [Google Scholar]
  30. Lv, N.; Zhao, J. Research on Optimizing the Location of Logistics Park Based on Bayesian Probability Theory. China J. Highw. Transp. 2020, 33, 251–260. [Google Scholar]
  31. Zhang, K.; Zheng, L.; Liu, Z.; Jia, N. A deep learning based multitask model for network-wide traffic speed prediction. Neurocomputing 2020, 396, 438–450. [Google Scholar] [CrossRef]
  32. Wang, D.; Wang, C.; Xiao, J.; Xiao, Z.; Chen, W.; Havyarimana, V. Bayesian optimization of Support vector machine for regression prediction of short-term traffic flow. Intell. Data Anal. 2019, 23, 481–497. [Google Scholar] [CrossRef]
  33. Gu, X.; Han, Y.; Yu, J. Vehicle lane changing decision model based on decision mechanism and support vector machine. J. Harbin Inst. Technol. 2020, 52, 111–121. [Google Scholar]
  34. Tian, Z.; Zhang, S. Optimized empirical Bayesian accident black spot identification and sorting method. J. Chang’an Univ. 2019, 39, 115–126. [Google Scholar]
  35. Yu, Q. Hierarchical optimization OD estimation model based on Bayesian method. Highway 2014, 59, 123–127. [Google Scholar]
  36. Zhang, Q.; Li, H. MOEA/D: A multiobjective evolutionary algorithm based on decomposition. IEEE Trans. Evol. Comput. 2007, 11, 712–731. [Google Scholar] [CrossRef]
  37. Li, H.; Zhang, Q. Multiobjective optimization problems with complicated Pareto sets, MOEA/D and NSGA-II. IEEE Trans. Evol. Comput. 2009, 13, 284–302. [Google Scholar] [CrossRef]
  38. Tang, J.; Yang, Y.; Hao, W.; Liu, F.; Wang, Y. A data-driven timetable optimization of urban bus line based on multi-objective genetic algorithm. IEEE Trans. Intell. Transp. 2021, 22, 2417–2429. [Google Scholar] [CrossRef]
Figure 1. The flowchart of KGO using multi-point criterion.
Sustainability 13 10645 g001
Figure 2. The contour of SC function.
Sustainability 13 10645 g002
Figure 3. Comparison of the optimization process of two methods based on SC function.
Sustainability 13 10645 g003
Figure 4. Comparison of the optimization process of two methods based on H6 function.
Sustainability 13 10645 g004
Figure 5. Comparison between the multi-point infill sampling criterion and PSO (20).
Sustainability 13 10645 g005
Figure 6. Comparison between the multi-point infill sampling criterion and PSO (50).
Sustainability 13 10645 g006
Figure 7. Comparison between the multi-point infill sampling criterion and PSO (80).
Sustainability 13 10645 g007
Figure 8. Comparison between the multi-point infill sampling criterion and PSO (100).
Sustainability 13 10645 g008
Table 1. Comparison of the average values of 5 independent test results based on the SC function.
MethodMulti-Point Infill SamplingEI Criterion
Solution result−1.0303−1.0127
Number of iterations1010
Table 2. Comparison of average values of 5 independent test results based on H6 function.
MethodMulti-Point Infill SamplingEI Criterion
Solution result−3.2704−2.0399
Number of iterations3030
Table 3. Ten average optimal results of different Gen.
GenOptimal Solution
100−1.0299
200−1.0313
300−1.0152
400−1.0315
500−1.0314
Table 4. Ten average optimal results of different T.
TOpimal Solution
5−1.0310
10−1.0310
15−1.0314
20−1.0313
As shown in Table 3 and Table 4, the best Gen and T for MOEA/D are Gen = 200, T = 15.
Table 5. GPS data.
Table 5. GPS data.
TimeVehicle NumberLineLongitudeLatitudeSpeed
2017/11/1 17:3112301445116.492939.96297.9
2017/11/1 17:3512301445116.49739.96689.9
2017/11/1 17:5012301445116.483739.97710.9
2017/11/1 17:5912301445116.483639.983213.3
2017/11/1 18:1012301445116.483539.98630
2017/11/1 18:3012301445116.455639.984529.9
Table 6. Smart Card data.
Smart Card NumberDrop off TimeBoardtimeVehicle NumberDrop off Station NumberBoarding Station Number
C9FC4D7620171129220144201711292154001229795
9D1F3E31201711292201452017112921500012297115
E420FD7C201711292201472017112921530012297105
627AEA05201711292201482017112921390012297135
22C69F45201711292201502017112921290012297185
0144EB12201711292201522017112921500012297115
Table 7. Comparison of results of optimization of revenue.
AlgorithmOptimumNumber of IterationsNumber of Function Evaluations
PSO (population 80)3135.112960
PSO (population 20)2998.920400
PSO (population 50)3110201000
PSO (population 100)3287.5101000
Multi-point infill sampling3525.110132
Unoptimized value2431.1————
Publisher’s Note: MDPI stays neutral with regard to jurisdictional claims in published maps and institutional affiliations.

