
Optimization Model of Regional Traffic Signs for Inducement at Road Works

Abstract
:1. Introduction
2. Data Collection
2.1. Node Characteristics
2.2. Traffic Volume
2.3. Section Saturation
3. Model Construction and Solution
3.1. Existing Models
3.2. Model Building
3.3. Model Solving
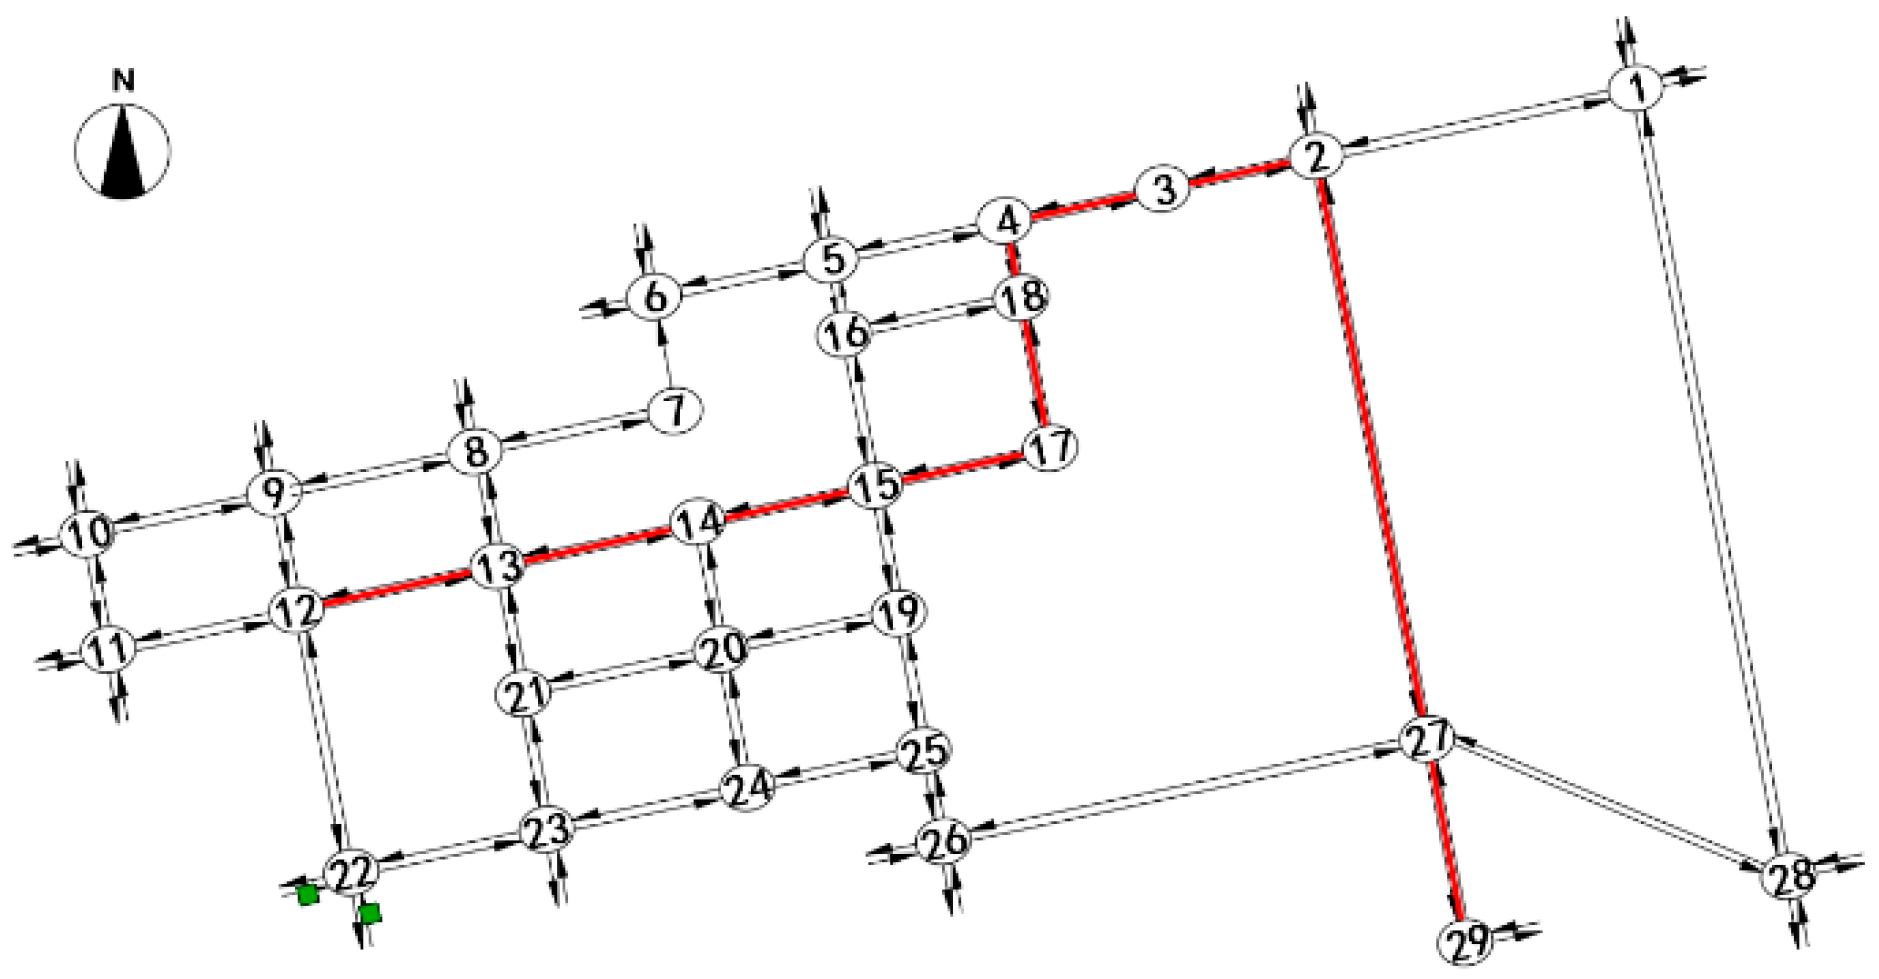
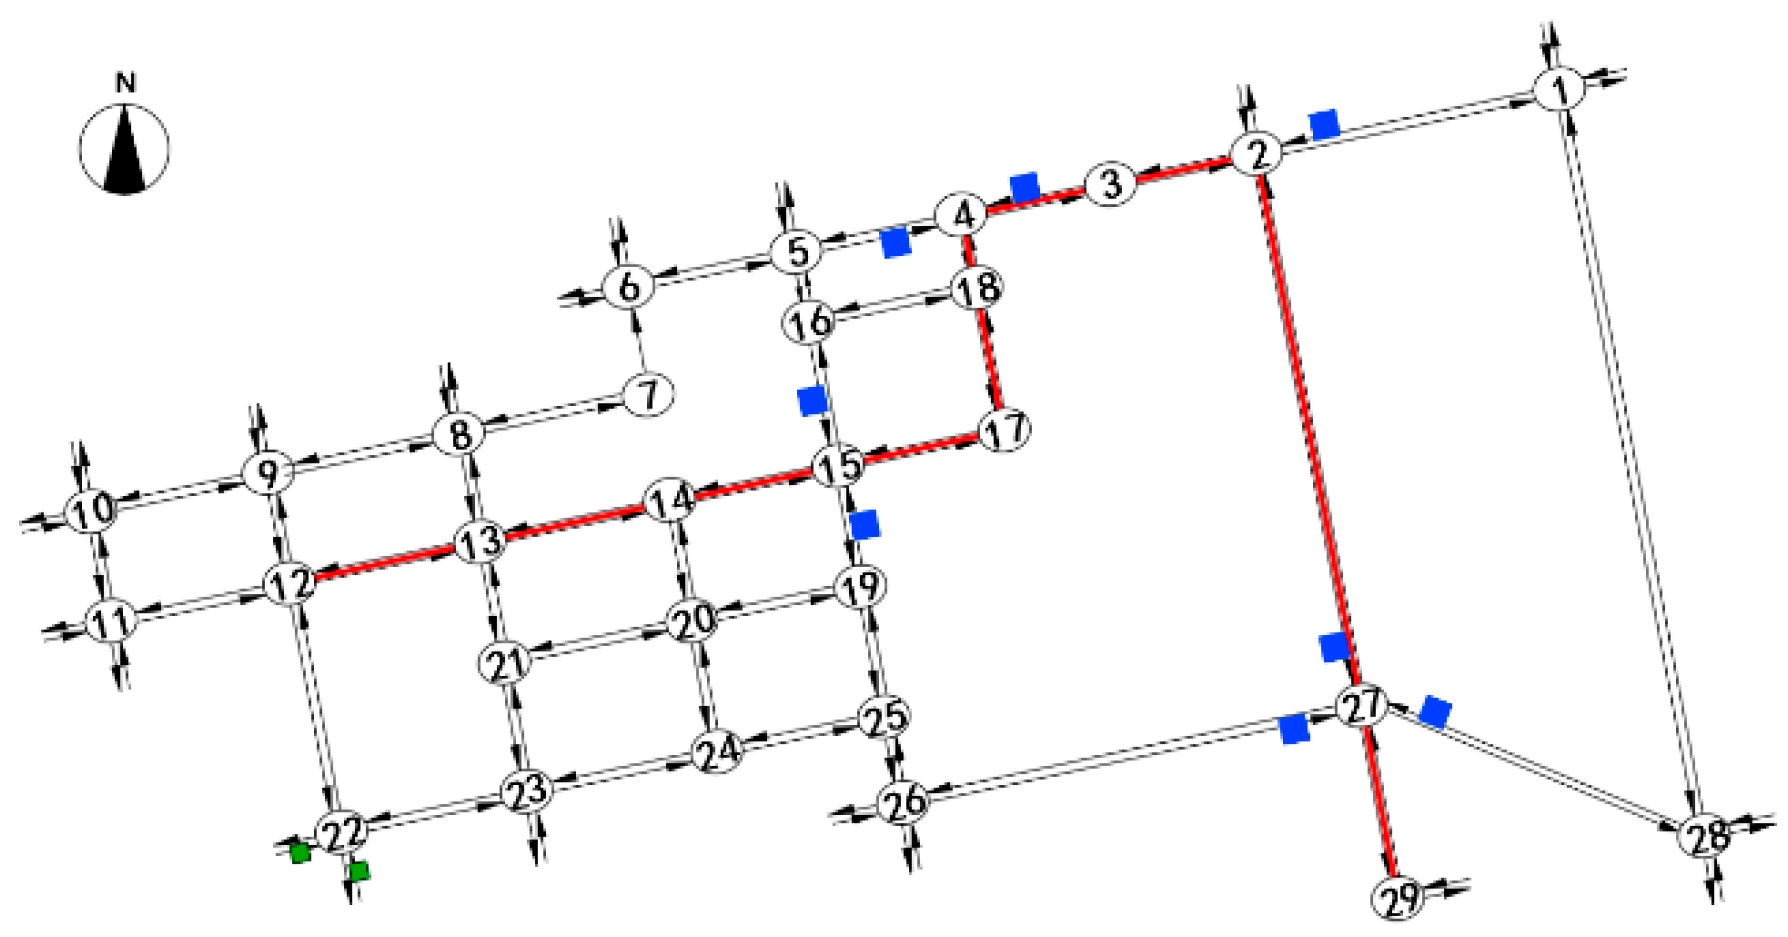
4. Model Application
4.1. Calculate Node Importance
4.2. Determination of Index Weight
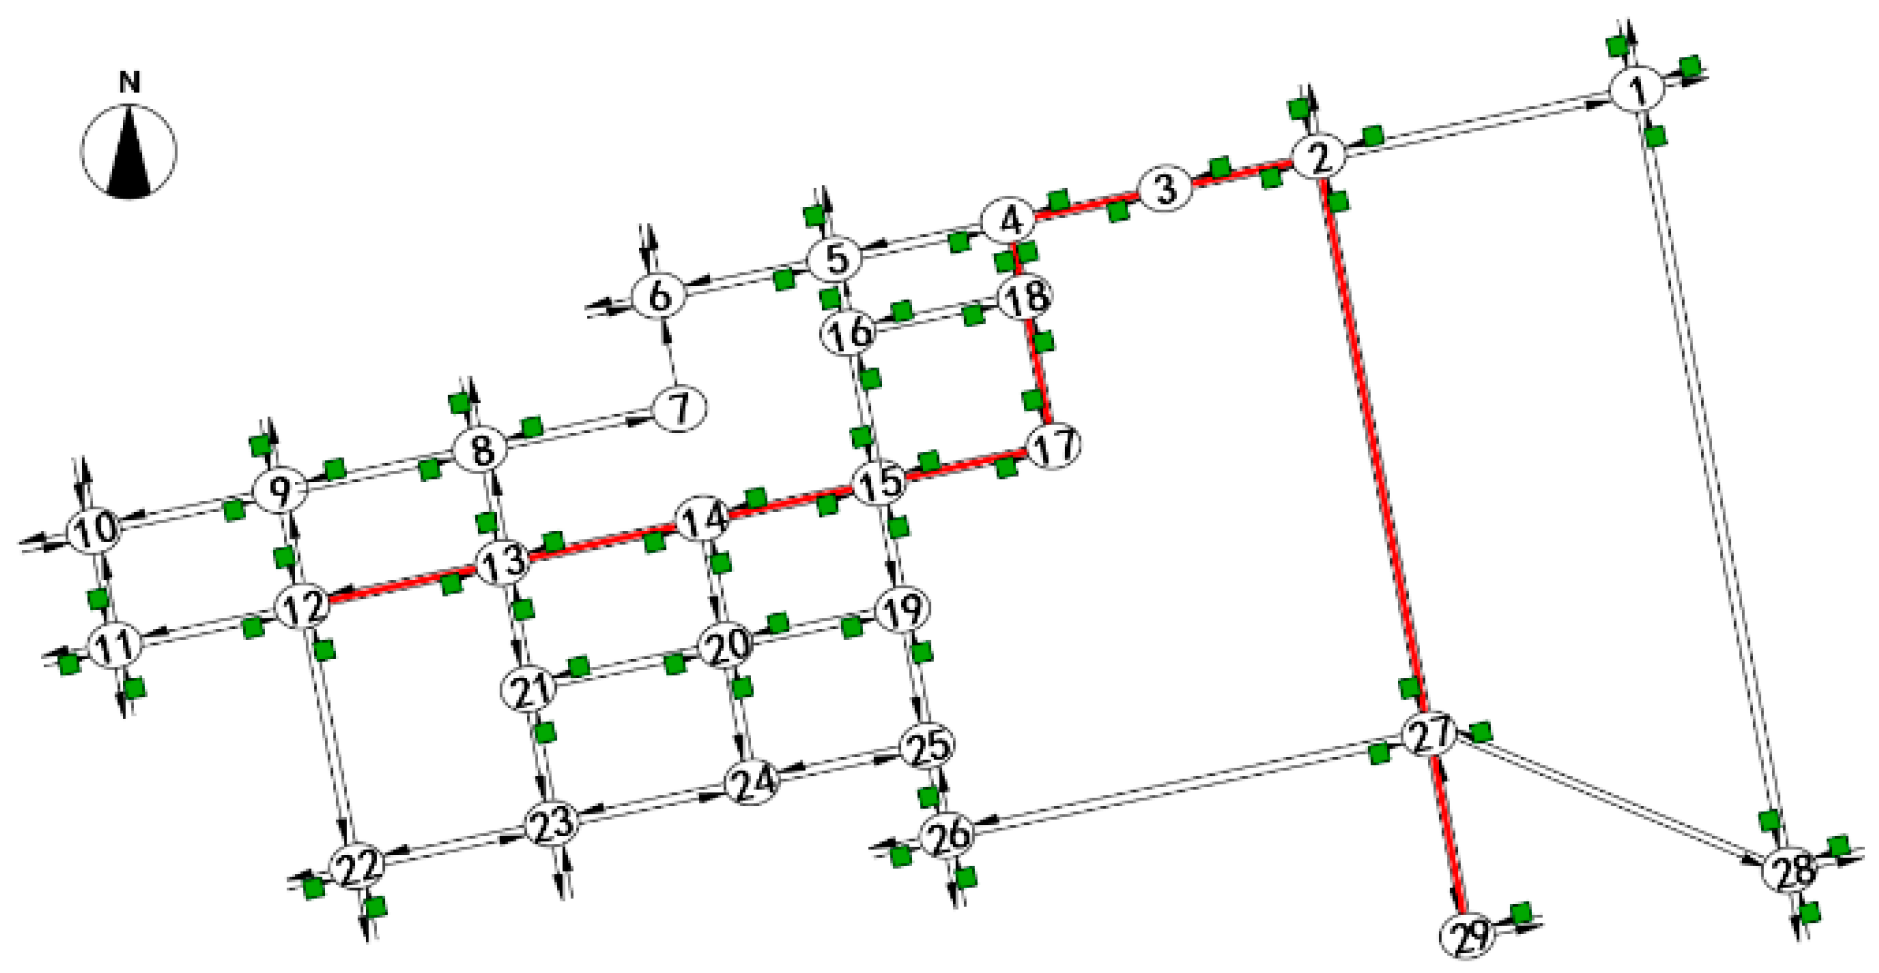
4.3. Calculation of Parameters of Objective Function at Alternative Points
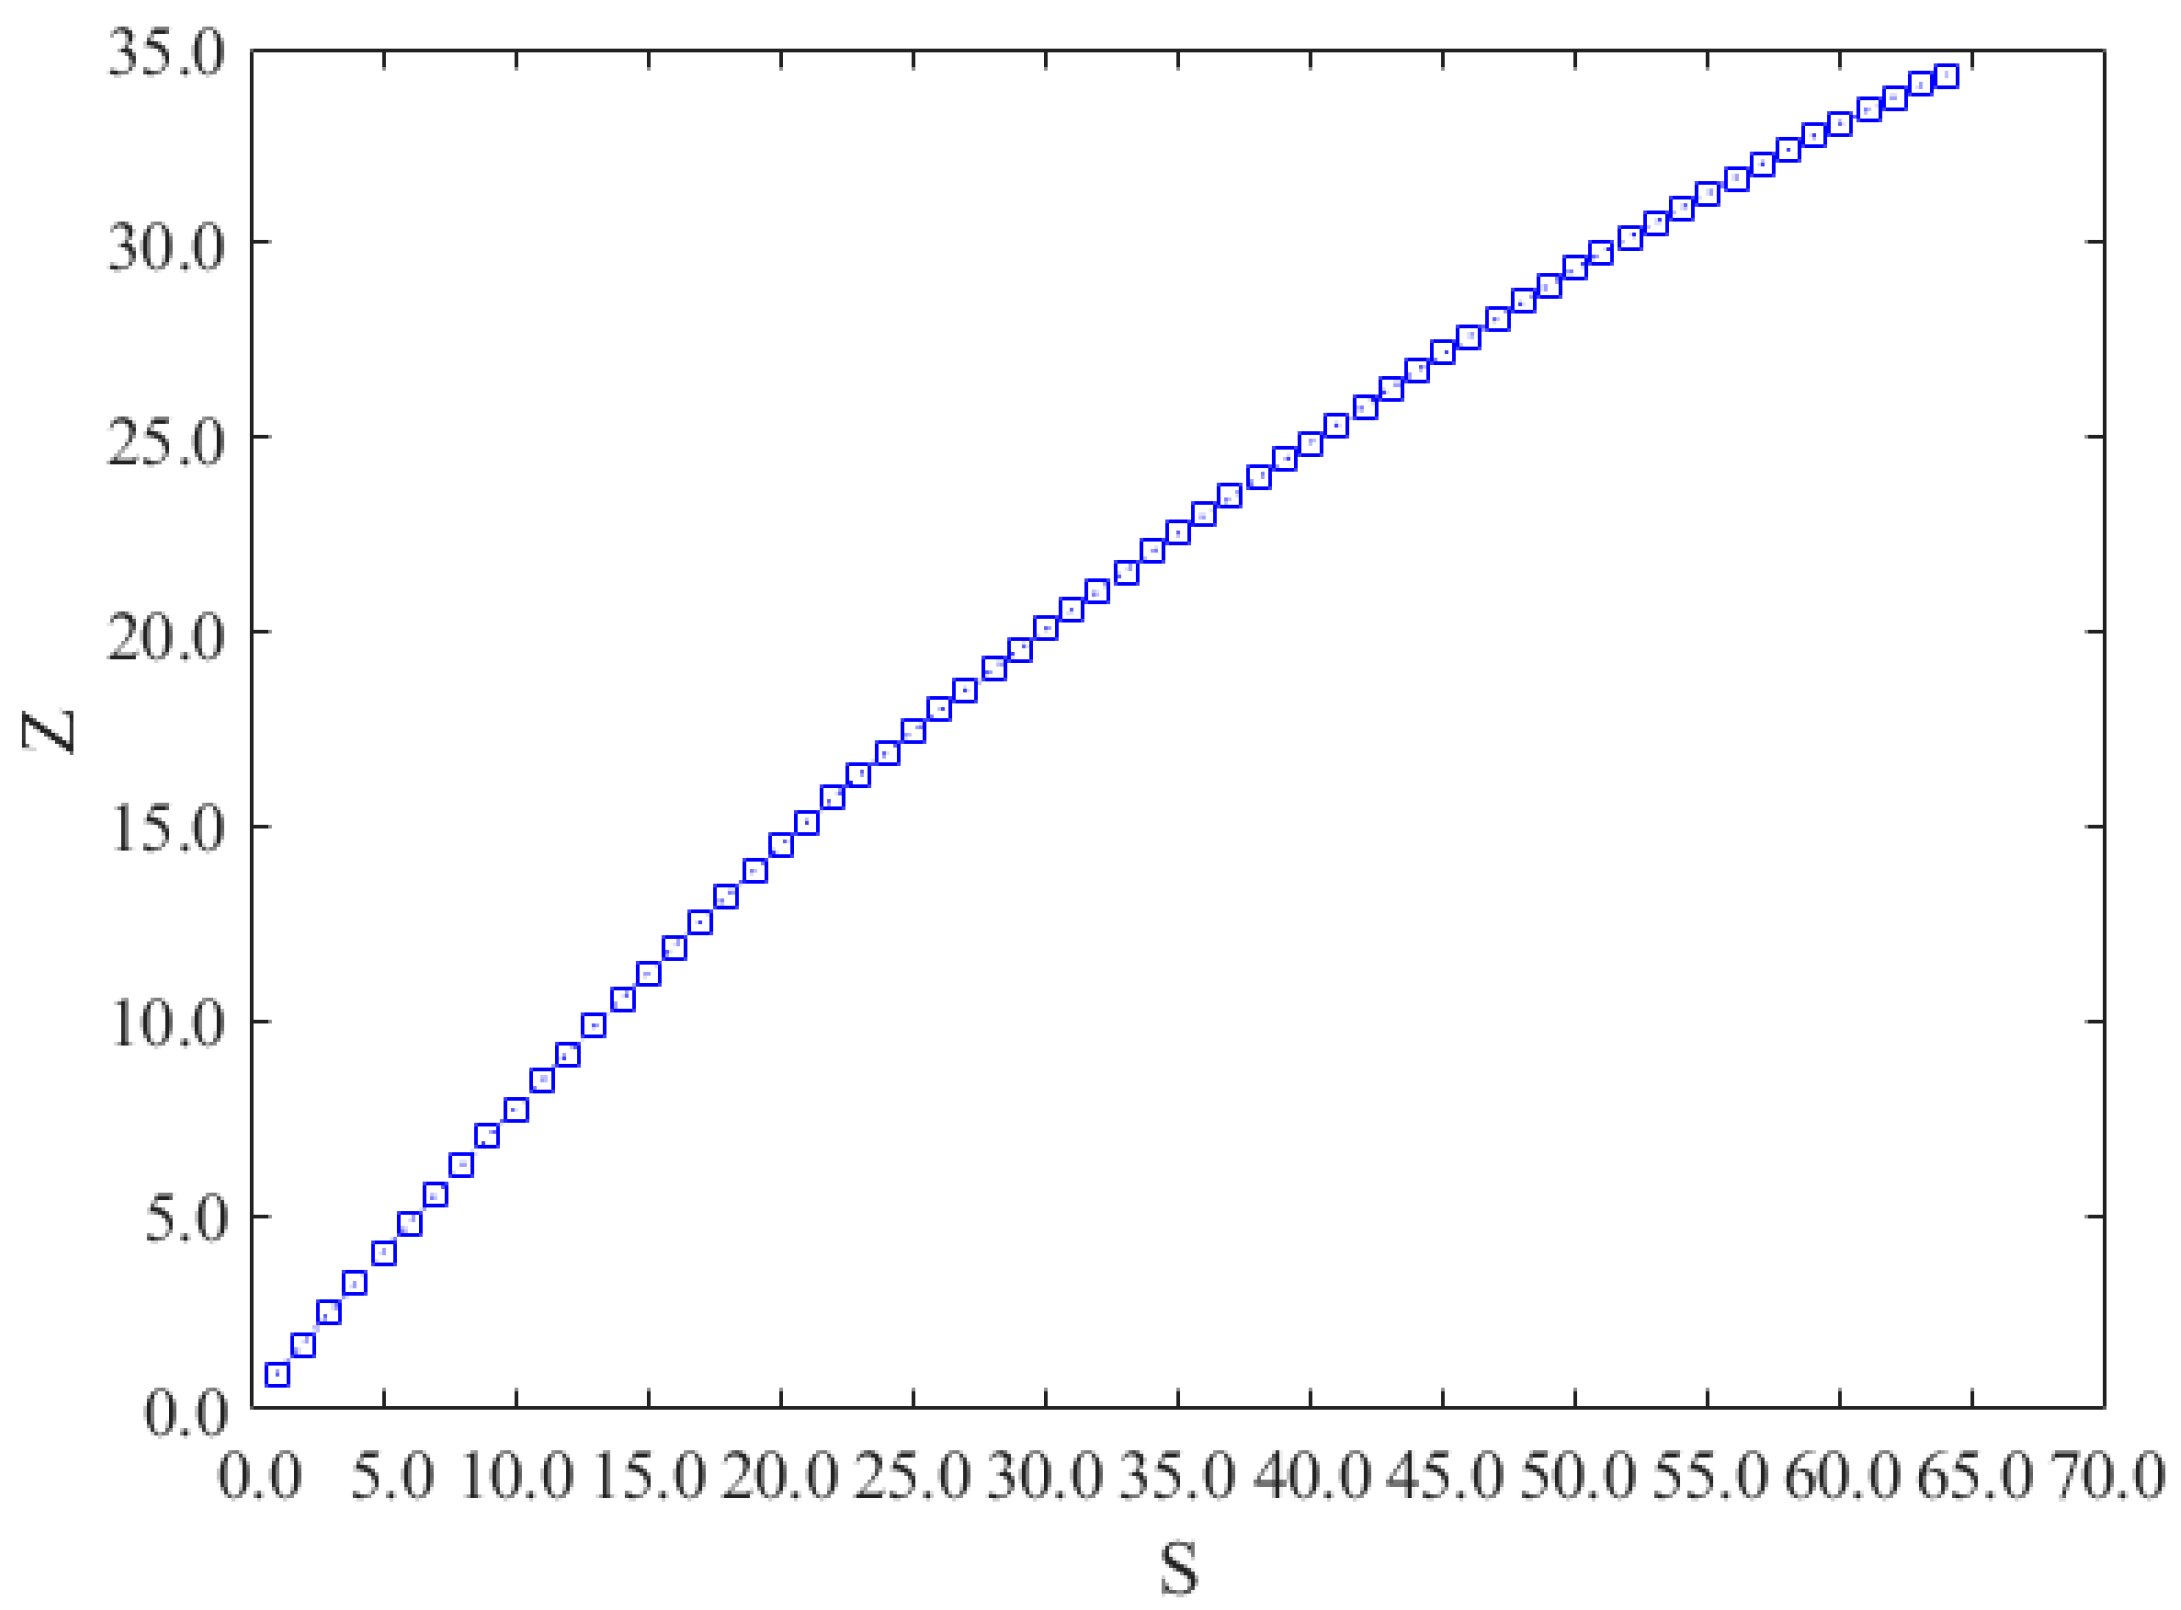
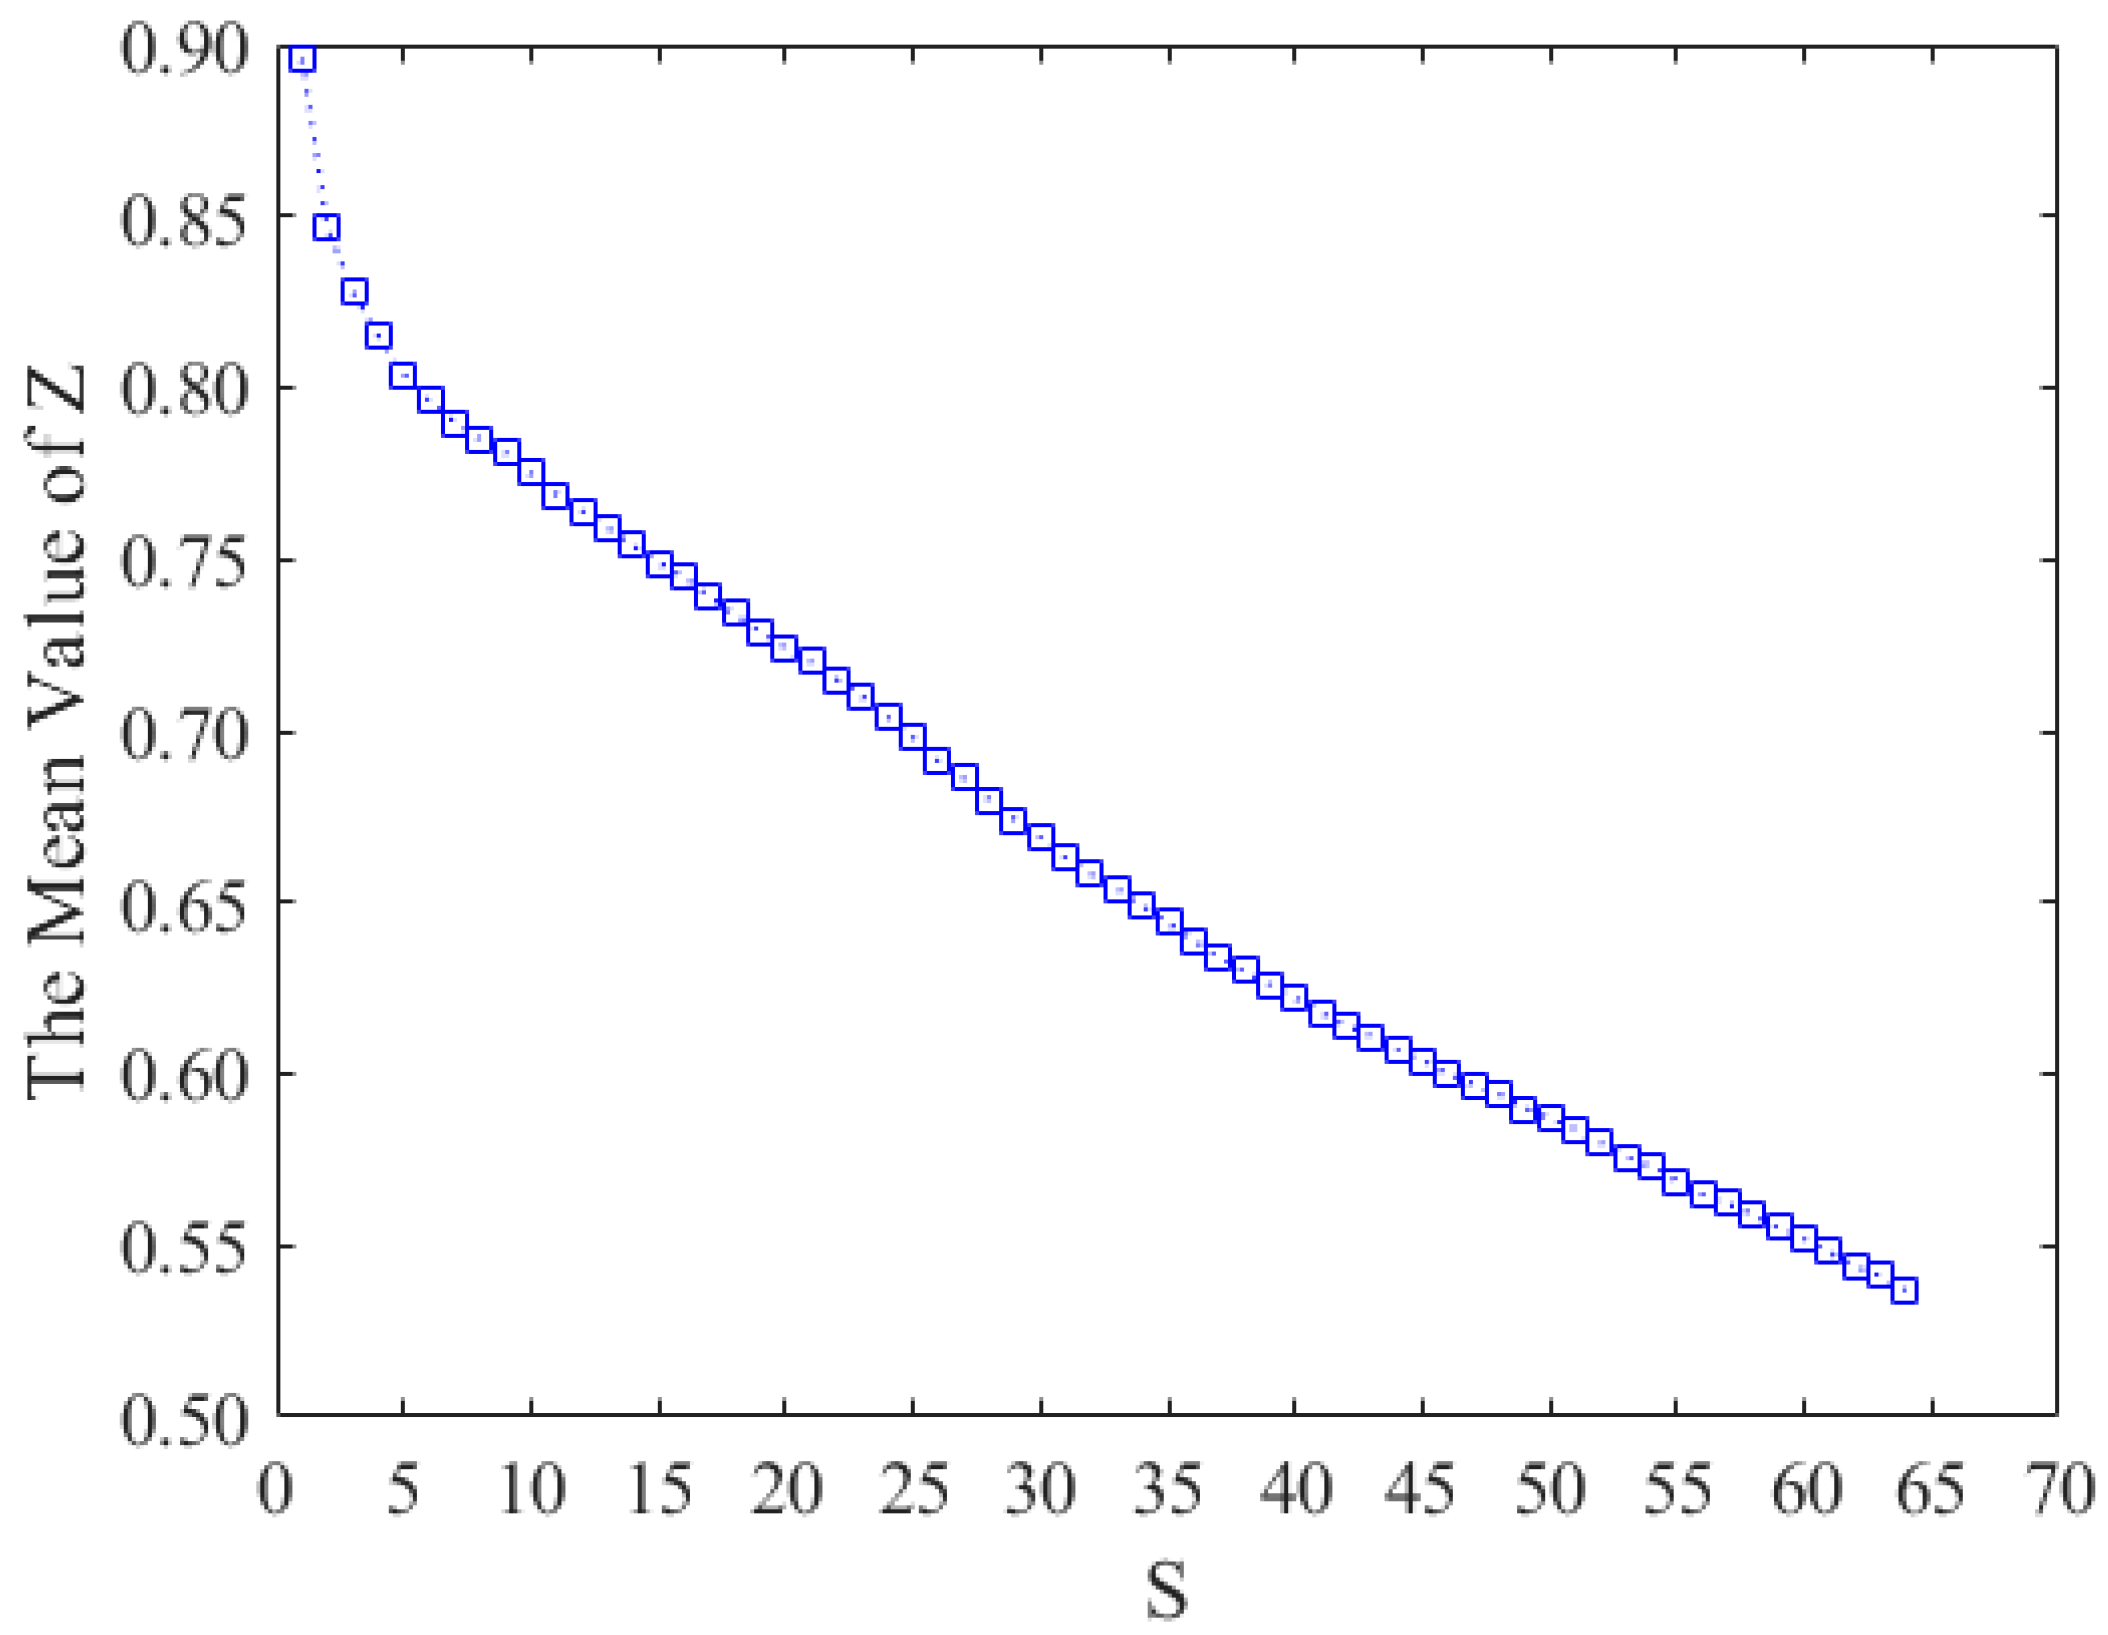
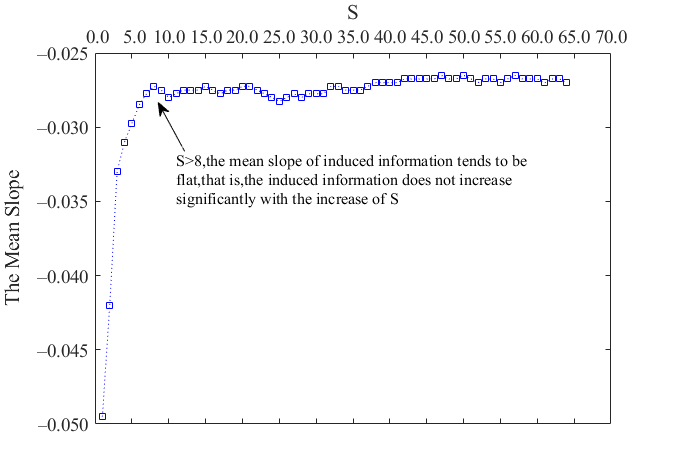
4.4. Sensitivity Analysis of the Solution Results
5. Conclusions
Author Contributions
Funding
Institutional Review Board Statement
Informed Consent Statement
Conflicts of Interest
References
- Chen, X.; Li, Z.; Yang, Y.; Qi, L.; Ke, R. High-Resolution Vehicle Trajectory Extraction and Denoising From Aerial Videos. IEEE Trans. Intell. Transp. Syst. 2021, 22, 3190–3202. [Google Scholar] [CrossRef]
- Wu, B.; Zhang, J.; Yip, T.L.; Guedes Soares, C. A quantitative decision-making model for emergency response to oil spill from ships. Marit. Policy Manag. 2021, 48, 299–315. [Google Scholar] [CrossRef]
- Chen, X.; Lu, J.; Zhao, J.; Qu, Z.; Yang, Y.; Xian, J. Traffic Flow Prediction at Varied Time Scales via Ensemble Empirical Mode Decomposition and Artificial Neural Network. Sustainability 2020, 12, 3678. [Google Scholar] [CrossRef]
- Maze, T.H.; Schrock, S.D.; Kamyab, A. Capacity of freeway work zone lane closures. In Mid-Continent Transportation Symposium 2000 Proceedings; Center for Transportation Research and Education, Iowa State University: Ames, IA, USA, 2000; pp. 178–183. [Google Scholar]
- Racha, S.; Chowdhury, M.; Sarasua, W.; Ma, Y. Analysis of work zone traffic behavior for planning applications. Transp. Plan. Technol. 2008, 31, 183–199. [Google Scholar] [CrossRef]
- Nirmesh, M.; Samuel, R.; Madden, A.B. A Continuous Query System for Dynamic Route Planning. In Proceedings of the 27th International Conference on Data Engineering, Washington, DC, USA, 11–16 April 2011. [Google Scholar]
- Senge, S.; Wedde, H.F. 2-Way evaluation of the distributed BeeJamA vehicle routing approach. In Intelligent Vehicles Symposium; IEEE: Piscataway, NJ, USA, 2012. [Google Scholar]
- Weng, J.; Meng, Q. Modeling speed-flow relationship and merging behavior in work zone merging areas. Transp. Res. Part C Emerg. Technol. 2011, 19, 985–996. [Google Scholar] [CrossRef]
- Olia, A.; Izadpanah, P.; Razavi, S.N. Construction work zone Traffic Management using Connected Vehicle Systems. In Proceedings of the Canadian Society of Civil Engineers 2012 Conference, Edmonton, AB, Canada, 6–9 June 2012; pp. 1787–1796. [Google Scholar]
- Wei, S.; Jian, W.; Shaolin, Z.; Ling, Z.; Zhi, T.; Yuyu, Y.; Li, K.; Zhaohui, W. Variable message sign and dynamic regional traffic guidance. IEEE Intell. Transp. Syst. Mag. 2009, 1, 15–21. [Google Scholar]
- Paz, A.; Peeta, S. Information-based network control strategies consistent with estimated driver behavior. Transp. Res. Part B Methodol. 2009, 43, 73–96. [Google Scholar] [CrossRef] [Green Version]
- Zhong, S.; Zhou, L.; Ma, S.; Jia, N. Effects of different factors on drivers’ guidance compliance behaviors under road condition information shown on VMS. Transp. Res. 2012, 46A, 1490–1505. [Google Scholar] [CrossRef]
- Yang, Y.; Ruan, J.; Li, J.; Liu, B.; Kong, X. Route choice behavior model with guidance information based on fuzzy analytic hierarchy process. Int. J. Innov. Comput. Inf. Control 2018, 14, 363–370. [Google Scholar]
- Erke, A.; Sagberg, F.; Hagman, R. Effects of route guidance variable message signs (VMS) on driver behavior. Transp. Res. Part F Traffic Psychol. Behav. 2007, 10, 447–457. [Google Scholar] [CrossRef]
- Li, M.; Lin, X.; He, F.; Jiang, H. Optimal locations and travel time display for variable message signs. Transp. Res. Part C Emerg. Technol. 2016, 69, 418–435. [Google Scholar] [CrossRef]
- Dia, H.; Panwai, S. Modelling drivers’ compliance and route choice behavior in response to travel information. Nonlinear Dyn. 2007, 49, 493–509. [Google Scholar] [CrossRef]
- Chatterjee, K.; Mcdonald, M. Effectiveness of using variable message signs to disseminate dynamic traffic information: Evidence from field trails in European cities. Transp. Rev. 2004, 24, 559–585. [Google Scholar] [CrossRef]
- Lina, K.; Khandker, N.H.; Shahid, N.; Md, T.I. Modeling Travelers’ Responses to Incident Information Provided by Variable Message Signs in Calgary, Canada. J. Civ. Eng. 2010, 38, 1335–1346. [Google Scholar]
- Chorus, C.G.; Molin, E.J.E.; Wee, B.V. Use and effects of Advanced Traveller Information Services (ATIS): A review of the literature. Transp. Rev. 2006, 26, 127–149. [Google Scholar] [CrossRef]
- Tamar, B.; Shinar, D. Ergonomic guidelines for traffic sign design increase sigcomprehension. Hum. Factors J. Hum. Factors Ergon. Soc. 2006, 48, 182–195. [Google Scholar]
- Kirmizioglu, E.; Tuydes-Yaman, H. Comprehensibility of traffic signs among urban drivers in Turkey. Accid. Anal. Prev. 2012, 45, 131–141. [Google Scholar] [CrossRef]
- Francene, M.F. Thomas, Samuel, G. Charlton. Inattentional blindness and information relevance of variable message signs. Accid. Anal. Prev. 2020, 140, 105511. [Google Scholar]
- Guo, Y.R.; Wang, X.M.; Wang, M.; Zhang, H. A new method for variable message sign layout based on the actual guidance effect maximization. J. Univ. Sci. Technol. China 2017, 47, 342–349. [Google Scholar]
- Huang, Y.Q. Research on Spatiotemporal Strategies of Releasing Dynamic Traffic Information; Beijing Jiaotong University: Beijing, China, 2012. [Google Scholar]
- Wang, B.B.; Shao, C.F.; Sun, Y.X.; Li, J.; Ji, X. Holiday Travel Behavior Analysis under Integrated Multimodal Travel Information Service. J. Transp. Syst. Eng. Inf. Technol. 2014, 14, 229–234. [Google Scholar] [CrossRef]
- Zhou, J. Research on Construction Zone Sign of Freeway Based on Driver’s Visual Recognition Characteristics; Southeast University: Nanjing, China, 2015. [Google Scholar]
- Wang, P. Analysis on construction technology of road traffic signs and markings. Jiangxi Build. Mater. 2017, 159, 162. [Google Scholar]
- Zheng, G.T. Study on the Standardization of Traffic Guidance Information Release in Urban Road Construction; Chongqing Jiaotong University: Chongqing, China, 2018. [Google Scholar]
- Lv, Q.H.; Guang, X.P. Study on traffic organization design method during urban road construction [J]. Sci. Tech. Inf. Gansu 2019, 48, 47–50. [Google Scholar]
- Yi, X.B.W.; Tang, K.S.; Li, K.P. Location Optimization of Urban Variable Message Sign Based on Amount of Information. J. Tongji Univ. (Nat. Sci.) 2019, 47, 1148–1155. [Google Scholar]
- Li, X.H. The Design Method Research on Urban Traffic Management Facilities Based on Minimum Redundancy; Guilin University of Electronic Technology: Guilin, China, 2019. [Google Scholar]
- Wu, B.; Tang, Y.; Yan, X.; Soares, C.G. Bayesian Network modelling for safety management of electric vehicles transported in RoPax ships. Reliab. Eng. Syst. Saf. 2021, 209, 107466. [Google Scholar] [CrossRef]
- Han, Y.X.; Zhang, X. Research on optimization method for decision making point of guide sign in passenger station based on GA. Railw. Comput. Appl. 2009, 018, 10–13. [Google Scholar]
- Xu, H.Z.; Zhao, X.H.; Wu, T.F. Optimal Layout of Subway Station Information Query Platform Considering Passenger Flow and Node Importance. J. Transp. Syst. Eng. Inf. Technol. 2019, 19, 68–76. [Google Scholar]


| ID | Decision Point or Not (1—Yes, 0—No) x1 | The Number of Decision Points Excluding the Construction Section x2 | The Number of Nodes That Intersect with the Construction Road x3 |
|---|---|---|---|
| 1 | 1 | 3 | 1 |
| 2 | 1 | 2 | 0 |
| 3 | 0 | 0 | 0 |
| 4 | 1 | 1 | 0 |
| 5 | 1 | 3 | 1 |
| 8 | 1 | 3 | 1 |
| 9 | 1 | 3 | 1 |
| 11 | 1 | 3 | 1 |
| 12 | 1 | 3 | 0 |
| 13 | 1 | 2 | 0 |
| 14 | 1 | 1 | 0 |
| 15 | 1 | 2 | 0 |
| 16 | 1 | 3 | 1 |
| 17 | 0 | 0 | 0 |
| 18 | 1 | 1 | 0 |
| 19 | 1 | 2 | 1 |
| 20 | 1 | 3 | 1 |
| 21 | 1 | 2 | 1 |
| 22 | 1 | 3 | 1 |
| 26 | 1 | 3 | 1 |
| 27 | 1 | 2 | 0 |
| 28 | 1 | 3 | 1 |
| 29 | 0 | 0 | 0 |
| ID | Decision Point or Not (1—Yes, 0—No) x1 | The Number of Decision Points Excluding the Construction Section x2 | The Number of Nodes That Intersect with the Construction Road x3 |
|---|---|---|---|
| 1 | 1 | 3 | 0 |
| 2 | 1 | 2 | 1 |
| 3 | 0 | 0 | 1 |
| 4 | 1 | 1 | 1 |
| 5 | 1 | 3 | 0 |
| 8 | 1 | 3 | 0 |
| 9 | 1 | 3 | 0 |
| 11 | 1 | 3 | 0 |
| 12 | 1 | 3 | 1 |
| 13 | 1 | 2 | 1 |
| 14 | 1 | 1 | 1 |
| 15 | 1 | 2 | 1 |
| 16 | 1 | 3 | 0 |
| 17 | 0 | 0 | 1 |
| 18 | 1 | 1 | 1 |
| 19 | 1 | 2 | 0 |
| 20 | 1 | 3 | 0 |
| 21 | 1 | 2 | 0 |
| 22 | 1 | 3 | 0 |
| 26 | 1 | 3 | 0 |
| 27 | 1 | 2 | 1 |
| 28 | 1 | 3 | 0 |
| 29 | 0 | 0 | 1 |
| ID | Decision Point or Not (1—Yes, 0—No) x1 | The Number of Decision Points Excluding the Construction Section x2 | The Number of Nodes that Intersect with the Construction Road x3 |
|---|---|---|---|
| 1 | 0.39 | 0.86 | 0.96 |
| 2 | 0.39 | −0.08 | −1.04 |
| 3 | −2.58 | −1.97 | −1.04 |
| 4 | 0.39 | −1.03 | −1.04 |
| 5 | 0.39 | 0.86 | 0.96 |
| 8 | 0.39 | 0.86 | 0.96 |
| 9 | 0.39 | 0.86 | 0.96 |
| 11 | 0.39 | 0.86 | 0.96 |
| 12 | 0.39 | 0.86 | −1.04 |
| 13 | 0.39 | −0.08 | −1.04 |
| 14 | 0.39 | −1.03 | −1.04 |
| 15 | 0.39 | −0.08 | −1.04 |
| 16 | 0.39 | 0.86 | 0.96 |
| 17 | −2.58 | −1.97 | −1.04 |
| 18 | 0.39 | −1.03 | −1.04 |
| 19 | 0.39 | −0.08 | 0.96 |
| 20 | 0.39 | 0.86 | 0.96 |
| 21 | 0.39 | −0.08 | 0.96 |
| 22 | 0.39 | 0.86 | 0.96 |
| 26 | 0.39 | 0.86 | 0.96 |
| 27 | 0.39 | −0.08 | −1.04 |
| 28 | 0.39 | 0.86 | 0.96 |
| 29 | −2.58 | −1.97 | −1.04 |
| ID | x1 | x2 | x3 | cj |
|---|---|---|---|---|
| 0.380 | 0.081 | 0.539 | ||
| 1 | 1 | 3 | 0 | 0.536 |
| 2 | 1 | 2 | 1 | 0.930 |
| 3 | 0 | 0 | 1 | 0.464 |
| 4 | 1 | 1 | 1 | 0.861 |
| 5 | 1 | 3 | 0 | 0.536 |
| 8 | 1 | 3 | 0 | 0.536 |
| 9 | 1 | 3 | 0 | 0.536 |
| 11 | 1 | 3 | 0 | 0.536 |
| 12 | 1 | 3 | 1 | 1.000 |
| 13 | 1 | 2 | 1 | 0.930 |
| 14 | 1 | 1 | 1 | 0.861 |
| 15 | 1 | 2 | 1 | 0.930 |
| 16 | 1 | 3 | 0 | 0.536 |
| 17 | 0 | 0 | 1 | 0.464 |
| 18 | 1 | 1 | 1 | 0.861 |
| 19 | 1 | 2 | 0 | 0.466 |
| 20 | 1 | 3 | 0 | 0.536 |
| 21 | 1 | 2 | 0 | 0.466 |
| 22 | 1 | 3 | 0 | 0.536 |
| 26 | 1 | 3 | 0 | 0.536 |
| 27 | 1 | 2 | 1 | 0.930 |
| 28 | 1 | 3 | 0 | 0.536 |
| 29 | 0 | 0 | 1 | 0.464 |
| Traffic Volume | Node Importance | Standard Deviation of Road Saturation | |
|---|---|---|---|
| Traffic volume | 1 | 1/1.75 | 3 |
| Node importance | 1.75 | 1 | 5 |
| Standard deviation of road saturation | 1/3 | 1/5 | 1 |
| NO | Nodes Location | Weights | Z | ||
|---|---|---|---|---|---|
| Traffic Volume | Node Importance | Standard Deviation of Road Saturation | |||
| 32.7% | 56.2% | 11.1% | |||
| 1 | north–1 | 0.293 | 0.536 | 0.394 | 0.441 |
| 2 | east–1 | 0.324 | 0.536 | 0.347 | 0.446 |
| 3 | 1–28 | 0.416 | 0.536 | 0.277 | 0.468 |
| 4 | 28–1 | 0.416 | 0.536 | 0.421 | 0.484 |
| 5 | north–2 | 0.403 | 0.930 | 0.379 | 0.697 |
| 6 | 1–2 | 1.000 | 0.930 | 0.419 | 0.896 |
| 7 | 2–3 | 0.556 | 0.464 | 0.000 | 0.443 |
| 8 | 3–2 | 0.541 | 0.930 | 0.412 | 0.745 |
| 9 | 2–27 | 0.616 | 0.930 | 0.673 | 0.799 |
| 10 | 27–2 | 0.483 | 0.930 | 0.068 | 0.688 |
| 11 | 3–4 | 0.633 | 0.861 | 0.554 | 0.752 |
| 12 | 4–3 | 0.619 | 0.464 | 0.000 | 0.463 |
| 13 | 5–4 | 0.629 | 0.861 | 0.610 | 0.757 |
| 14 | 4–18 | 0.052 | 0.861 | 0.294 | 0.533 |
| 15 | 18–4 | 0.025 | 0.861 | 0.056 | 0.498 |
| 16 | north–5 | 0.416 | 0.536 | 0.239 | 0.464 |
| 17 | 6–5 | 0.641 | 0.536 | 0.218 | 0.535 |
| 18 | 5–16 | 0.570 | 0.536 | 0.149 | 0.504 |
| 19 | 7–8 | 0.068 | 0.536 | 0.403 | 0.368 |
| 20 | north–8 | 0.206 | 0.536 | 0.401 | 0.413 |
| 21 | 8–9 | 0.054 | 0.536 | 0.383 | 0.361 |
| 22 | 9–8 | 0.168 | 0.536 | 0.211 | 0.380 |
| 23 | 8–13 | 0.260 | 0.930 | 0.065 | 0.615 |
| 24 | 10–9 | 0.179 | 0.536 | 0.265 | 0.389 |
| 25 | north–9 | 0.077 | 0.536 | 0.376 | 0.368 |
| 26 | 9–12 | 0.186 | 1.000 | 0.440 | 0.672 |
| 27 | 10–11 | 0.343 | 0.536 | 0.372 | 0.455 |
| 28 | west–11 | 0.198 | 0.536 | 0.936 | 0.470 |
| 29 | south–11 | 0.087 | 0.536 | 0.830 | 0.422 |
| 30 | 11–12 | 0.149 | 1.000 | 0.254 | 0.639 |
| 31 | 12–13 | 0.382 | 0.930 | 0.060 | 0.654 |
| 32 | 22–12 | 0.303 | 1.000 | 0.432 | 0.709 |
| 33 | 21–13 | 0.386 | 0.930 | 0.015 | 0.651 |
| 34 | 13–14 | 0.355 | 0.861 | 0.786 | 0.687 |
| 35 | 14–13 | 0.311 | 0.930 | 0.057 | 0.631 |
| 36 | 14–15 | 0.410 | 0.930 | 0.566 | 0.720 |
| 37 | 15–14 | 0.363 | 0.861 | 0.987 | 0.712 |
| 38 | 20–14 | 0.314 | 0.861 | 0.201 | 0.609 |
| 39 | 15–17 | 0.142 | 0.464 | 0.000 | 0.307 |
| 40 | 17–15 | 0.131 | 0.930 | 0.549 | 0.626 |
| 41 | 15–16 | 0.493 | 0.536 | 0.959 | 0.569 |
| 42 | 16–15 | 0.501 | 0.930 | 0.589 | 0.752 |
| 43 | 19–15 | 0.605 | 0.930 | 0.519 | 0.778 |
| 44 | 16–18 | 0.056 | 0.861 | 0.064 | 0.509 |
| 45 | 18–16 | 0.093 | 0.536 | 0.068 | 0.339 |
| 46 | 17–18 | 0.042 | 0.861 | 0.229 | 0.523 |
| 47 | 18–17 | 0.030 | 0.464 | 0.000 | 0.271 |
| 48 | 19–20 | 0.190 | 0.536 | 0.923 | 0.466 |
| 49 | 20–19 | 0.135 | 0.466 | 0.244 | 0.333 |
| 50 | 25–19 | 0.500 | 0.466 | 0.388 | 0.468 |
| 51 | 20–21 | 0.190 | 0.466 | 0.424 | 0.371 |
| 52 | 21–20 | 0.138 | 0.536 | 1.000 | 0.457 |
| 53 | 24–20 | 0.203 | 0.536 | 0.855 | 0.463 |
| 54 | 23–21 | 0.158 | 0.466 | 0.100 | 0.325 |
| 55 | west–22 | 0.357 | 0.536 | 0.606 | 0.485 |
| 56 | south–22 | 0.257 | 0.536 | 0.595 | 0.451 |
| 57 | west–26 | 0.592 | 0.536 | 0.204 | 0.517 |
| 58 | south–26 | 0.530 | 0.536 | 0.282 | 0.506 |
| 59 | 25–26 | 0.620 | 0.536 | 0.280 | 0.535 |
| 60 | 26–27 | 0.653 | 0.930 | 0.209 | 0.759 |
| 61 | east–28 | 0.200 | 0.536 | 0.194 | 0.388 |
| 62 | north–28 | 0.293 | 0.536 | 0.338 | 0.435 |
| 63 | 28–27 | 0.709 | 0.930 | 0.308 | 0.789 |
| 64 | east–29 | 0.351 | 0.464 | 0.000 | 0.376 |
Publisher’s Note: MDPI stays neutral with regard to jurisdictional claims in published maps and institutional affiliations. |
© 2021 by the authors. Licensee MDPI, Basel, Switzerland. This article is an open access article distributed under the terms and conditions of the Creative Commons Attribution (CC BY) license (https://creativecommons.org/licenses/by/4.0/).
Share and Cite
Wang, L.; Zhang, H.; Shi, L.; He, Q.; Xu, H. Optimization Model of Regional Traffic Signs for Inducement at Road Works. Sustainability 2021, 13, 6996. https://doi.org/10.3390/su13136996
Wang L, Zhang H, Shi L, He Q, Xu H. Optimization Model of Regional Traffic Signs for Inducement at Road Works. Sustainability. 2021; 13(13):6996. https://doi.org/10.3390/su13136996
Chicago/Turabian StyleWang, Lianzhen, Han Zhang, Lingyun Shi, Qingling He, and Huizhi Xu. 2021. "Optimization Model of Regional Traffic Signs for Inducement at Road Works" Sustainability 13, no. 13: 6996. https://doi.org/10.3390/su13136996