1. Introduction
Non-profit organizations play an important role in building and developing civil society in developed countries. The main goal of the organizations is to support social and health services, education, sports activities, human rights and democracy. In developed countries, we now see a significant increase in the importance of non-profit organizations to support sustainable development based on public initiative. Moreover, the boom of non-profit organizations is related to the impact of the external environment in the form of development agencies and state support, as non-profit organizations are dynamic and flexible entities that contribute to the effective functioning of civil society. On the other hand, the primary problems of non-profit organizations include legislation that does not motivate businesses to support non-profit entities, but also the lack of employees and volunteers. Beudean (2009) [
1] highlights the serious problem of recruiting and retaining employees in the non-profit sector compared to the for-profit sector. Managers can use money in the form of better pay and benefits as a tool to motivate and retain employees and the public sector can expect work protection and some other benefits. The non-profit sector can only offer a mission as a tool to retain employees. These factors have a significant impact on the financial vulnerability of non-profit organizations.
Nowadays, many non-profit organizations like to cooperate with companies, however, media and banking companies are careful in collaboration. In the past, there were instances of unfair financing on the American continent, but especially the poor financial management of the non-profit organizations according to Greenlee, Gordon and Keating (2007) [
2] and Seyam et al. (2018) [
3]. Many non-profit organizations rely exclusively on one donor, but the diversification of the revenue structure is extremely important from our perspective. The companies carefully select non-profit organizations to support corporate philanthropy as part of corporate social responsibility. Corporate philanthropy is a voluntary engagement of a company in publicly beneficial projects for the development of civil society.
The main objective of the paper is to propose a specific tool for estimating of financial status of all non-profit organizations using discriminant analysis regardless of economic activity as a new starting point for future research in Central Europe. The issue is very challenging because data on non-profit organizations are not available compared to companies in the for-profit sector.
The research is based on a comprehensive methodology. We identify potentially significant variables based on previous research and our professional experience. Then, we test the correlation and multicollinearity among the input variables. The initial sample is divided into the training and testing sample. Finally, we present a model estimating the financial status of non-profit organizations. The importance of the model is also emphasized by the growing importance of non-profit organizations in the Slovak Republic. We believe that the model is simple for routine application by donors, contributors, banks and other stakeholders. However, the advantage of this model is its applicability in Central Europe, as the models from previous studies involve administrative costs.
The results demonstrate that the financial status of non-profit organizations depends mainly on debt ratio and the share of subsidies in total revenues on the based publicly available financial statements on Slovak non-profit organizations. The model shows that non-profit organizations should not rely on contributions from the national or regional level. In other words, non-profit organizations should diversify their revenue structure mainly through self-financing. Moreover, the added value is the summary of theoretical and empirical knowledge from previous research. We find that theoretical and empirical evidence on risk management with a focus on non-profit organizations is limited compared to advanced research on companies from various industries. These studies assess the financial vulnerability of Americans as opposed to European nonprofit organizations. We find the gap in research in risk management in Central Europe based on research literature analysis. We cannot estimate financial vulnerability using these relevant models because the financial statements do not include the administrative costs. The advantage of the proposed model is applicability, as the presented models are not applicable due to the limited data on administrative costs in the financial statements. These results can contribute to the development of non-profit financial management in Central Europe.
2. Literature Review
The aim of non-profit organizations is to improve the living conditions of citizens, increase education, and enhance the environment. The origin of non-profit organizations is explained by many theories, such as theory of public goods, contract theory, welfare state theory, and independence theory, etc. Theory of public goods is based on governmental and market failures. According to contract failure theory, the consumer does not have much information for assessment of the quality of goods and services. Welfare state theory assumes that the importance of non-profit organizations will diminish for improving market mechanism and strengthening state responsibility in the future. On the other hand, interdependence theory demonstrates that the non-profit and for-profit sector are interdependent. These non-profit organizations can cooperate with other entities in health care, education, and social services. Sedivy and Medlikova (2009) [
4] claim that non-profit organizations are more closely monitored by the private sector, public institutions, and the public in terms of achieving higher performance levels and transparency. The important tool for assessing the effective functioning of a non-profit organization is the financial analysis based on financial statements to monitor the structure and development of assets, liabilities, income, and expenses. Financial analysis is one of the elementary methods that apply in various scientific research, regardless of the economic sector. Accounting, accounting conventions, and accounting legislation in the country play an important role in the selection of indicators. Matthiesen (2009) [
5] uses financial information from the IRC using the GuideStar database. According to Mattocks (2008) [
6], Guidestar is a source that is globally recognized as an important database of information about U.S. non-profit organizations. The representative samples consisted of organizations with gross revenues of more than
$25,000 that disclose their financial information. Specifically, the sample consisted of subgroups, the so-called food banks and food chambers based on the NTEE classification system in a total of 816 organizations.
Berta & Burger (2015) [
7] emphasize that Tuckman & Chang (1991) [
8] are pioneers in this research area as they provide the basic pillar for further studies. These authors used a linear probability model to understand the impact of several possible factors in the likelihood of negative changes to total returns as a prerequisite for financial vulnerability, based on multiple studies, namely Tuckman & Chang (1991) [
8], Greenlee & Trussel (2000) [
9], Trussel & Greenlee (2004) [
10] and Trussel (2002) [
11].
Table 1 shows various definitions of financial vulnerability from many relevant authors.
Although theoretical knowledge offers many definitions of the financial vulnerability of nonprofits, we use the financial status in the paper. Financial status is a comprehensive term for vulnerable and invulnerable non-profit organizations. We define that a vulnerable non-profit organization is an organization in liquidation. In the Slovak Republic, there are many types of non-profit organizations such as foundations, non-investment funds, civic associations, and non-profit organizations providing services of general interest. We focus only on foundations and non-investment funds. We explain non-profit organizations as private entities not focused on making a profit. The primary function of these organizations is not to make a profit, but to help people in need in particular. If the non-profit organization generates a profit, this profit is reinvested again. Kliestik et al. (2018) [
16] emphasize that bankruptcy prevention is an important prerequisite for alleviating legal and social changes. Moreover, Rybicka & Rybicki (2018) [
17] identify aspects of management and accounting. In the non-profit sector prediction is underdeveloped research compared to the for-profit sector. In the Slovak Republic Kovacova & Kliestik (2017) [
18], Valaskova et al. (2018) [
19], and Svabova et al. (2018) [
20] focus on estimating the financial distress of Slovak enterprises. Moreover, Valaskova et al. (2018) [
21] created a predictive model for modeling the sustainability of Slovak enterprises. In the prediction area, many authors apply statistical methods, such as discrimination and regression analysis, but also neural networks. Blanton (2018) [
22] used artificial intelligence approaches in health care. In general, prediction models are a suitable tool in the decision-making process in various sectors. Kantarelis (2018) [
23] proposed a rational approach for improving the decision-making process in screening stocks.
Tuckman & Chang (1991) [
8] explain that the financial condition of charitable non-profit organizations depends on many factors, such as generosity of supporters, revenue diversification, management skills, ability to withstand revenue fluctuations, and capital size. These factors also affect the choice of relevant indicators. The four indicators include equity, revenue concentration, administrative costs, and operating margin. Greenlee & Trussel (2000) [
9] expended study by Tuckman & Chang (1991) [
8]. According to Greenlee & Trussel (2000) [
9], financial vulnerability is a decline in program spending over three years. In addition, financial vulnerability as opposed to financial sustainability, financial health and financial existence. Vance (2010) [
24] prefers the non-profit existence or failure. On the other hand, Tuckman & Chang (1991) [
8] does not agree with these names. The model consists of four indicators, namely equity (E), revenue concentration (C), administrative cost (A), and operating margin (M). The equity is calculated atypically compared to the for-profit sector. In the non-profit sector, equity is calculated as the ratio of equity to total revenues, while in the private sector it is calculated as the ratio of equity to assets. The model is calculated based on Formula (1), which expresses the likelihood of financial vulnerability:
Later, Trussel & Greenlee (2004) [
10] created another model. A financially vulnerable non-profit organization is an organization in which net assets have decreased by more than 20% over three years, but according to the second model, an organization with a net asset decline of more than 50% is a financially vulnerable non-profit organization over three years. These authors used the same indicators, namely operating margin (M), revenue concentration (C), but also size (S) and debt ratio (D). The size of the organization is related to the total volume of assets, while an organization with a higher volume of assets can face financial distress. According to Trussel & Greenlee (2004) [
10], financial vulnerability is calculated based on the following model (Cordery, Sim & Baskerville, 2013) [
14]:
Trussel (2002) [
11] argues that financial vulnerability refers to a reduction in net assets, namely if net assets fall by more than 20% over three years. We assess the financial vulnerability based on the following model (Cordery, Sim & Baskerville, 2013) [
14]:
where: M (margin)—operating margin, C (concern)—revenue concentration, S (size)—assets, D (debt)—debt.
Interpretation. If the FVI is greater than 20%, the financial vulnerability index indicates strong vulnerability and vice versa, if the FVI is less than 10%, the financial vulnerability index does not indicate financial vulnerability. In the range of 10 to 20% is the so-called grey zone.
Trussel et al. (2002) [
13] expanded previous work by Greenlee & Trussel (2000) [
9] and Tuckman & Chang (1991) [
8] to predict the vulnerability of non-profit organizations. They created a model consisting of five financial indicators and a data sample with more than 94,000 organizations during 1997–1999, with 17,112 organizations financially vulnerable, representing 18%, and 76,890 organizations financially invulnerable, representing 82%. In their article, the authors explain that more than half of the organizations were used to create a logit model, and other organizations were used as a test sample. Trussel et al. (2002) [
13] define financial vulnerability as a 20% reduction in net assets over three years. This model is calculated using the formula (10). Trussel et al. (2002) [
15] demonstrate the financial fact that the purpose of the model is to screen and monitor (Cordery, Sim & Baskerville, 2013) [
14]. However, the primary aim is to predict the probability of financial vulnerability of organizations. Duan (2010) [
25] points out that this model’s predictive power is 65%. The result reflects the likelihood of financial vulnerability.
The results are: FVI > 20, a strong indicator of financial vulnerability; 10 < FVI < 20, grey zone; FVI < 10, a strong indicator of financial invulnerability.
Furthermore, Andres-Alonso, Garcia-Rodriquez & Romero-Merino (2016) [
15] analyzed the financial vulnerability of 228 U.K. non-profit organizations during 2008–2012 using FVI by Trussela et al. (2002) [
13].
Searing (2018) [
26], Hung & Hager (2019) [
27], Lu, Lin & Wang (2019) [
28], Fedele, Miniaci & Tortia (2021) [
29], and Garcia-Rodriguez & Santamaria-Mariscal (2021) [
30] developed current research on financial vulnerability with new perspectives. Searing (2018) [
26] applies financial ratios to estimate financial vulnerability of non-profit organizations using panel data. The results identify significant financial variables, such as equity ratio, surplus ratio, HHI, size, and age for improving profitability. Many studies focus on the impact of the revenue diversification/concentration strategy on the financial vulnerability of non-profit organizations. Hung & Hager (2019) [
27] investigated how to influence revenue diversification on financial health using meta-analysis of previous studies. They found out that financial health is the statistically significant dependent on revenue structure. Similarly, Lu, Lin & Wang (2019) [
28] examine the relationship between financial performance, such as financial capacity and vulnerability and diversification/concentration strategy. They found out diversification strategy has an effect on financial vulnerability. On the other hand, diversification has negative impact on financial capacity using bibliometric analysis and meta-analysis. According to some research, financial vulnerability is affected by the level of indebtedness of non-profit organizations. Similarly, this study emphasizes that a vulnerable non-profit organization should be careful about indebtedness and a high degree of concentration on contributions from state and other regional institutions. On the other hand, we find out that revenue diversification/concentration does not have an impact on financial status-based HHI. Fedele, Miniaci & Tortia (2021) [
29] analyse leverage and client orientation based on the ratio of voluntary workers to total workforce in the social care sector. The results of the study demonstrate leverage has a negative effect on client orientation. Garcia-Rodriguez & Santamaria-Mariscal (2021) [
30] explain the relationship between the financial vulnerability and board in non-profit organizations in Spain. The research shows experience and education of board structures do not have a significant impact on financial vulnerability.
3. Methodology
The research methodology is based on a wide range of relevant theoretical and empirical findings from leading researchers from around the world. We focus mainly on the sample, methods and financial indicators. Our research is based on Tuckman & Changa (1991) [
8], Greenlee & Trussel (2000) [
9], Trussel & Greenlee (2004) [
10], Trussela (2002) [
11]. Subsequently, most authors create, verify and compare results from previous studies. We believe that financial vulnerability depends on several financial indicators, such as equity, revenue concentration, debt ratio, and profit margin. However, these surveys are based on data from U.S. nonprofits. We are aware that the Slovak financial statements of non-profit organizations differ significantly from American organizations. In addition, we use specific financial indicators as opposed only to financial indicators from previous studies based on our professional experiences.
The aim of the paper is to propose a prediction model using discrimination analysis. Stankovicova & Vojtekova (2007) [
31] argue that the discriminatory analysis examines the dependence of one dependent (qualitative) variable on several independent variables. The primary aim is to find that independent variables are good indicators in estimating the financial vulnerability of Slovak non-profit organizations. If the model will have good results in the classification of non-profit organizations, the model is good at the prediction of financial vulnerability. In our case, financial vulnerability is a situation in which an organization is a liquidation according to Slovak legislation. The main parts of discriminatory analysis include analytical and classification roles. The analytical (descriptive) task is to find the most appropriate way of distinguishing between the groups. We identify a function that determines the existence of statistically significant differences between the groups’ averages. The classification task classifies individual non-profit organizations into relevant groups.
Stankovicova & Vojtekova (2007) [
31] recommend the use of step-discriminatory analysis, in which a larger number of independent variables enter. The steps determine the variables by which the discriminatory function is created. IBM SPSS Statistics 25 offers two options, including Independents Together and Stepwise Selection, which combines forward and backward selection. It means that variables gradually enter the discriminating function. This process is terminated when no other variable is entered and is not excluded from the discriminator function. When entering the variable into the model, Wilks λ is used, which expresses the ratio of intra-group variability to total variability. The variable that reaches the minimum value in each step is selected. In our case, we apply backward selection.
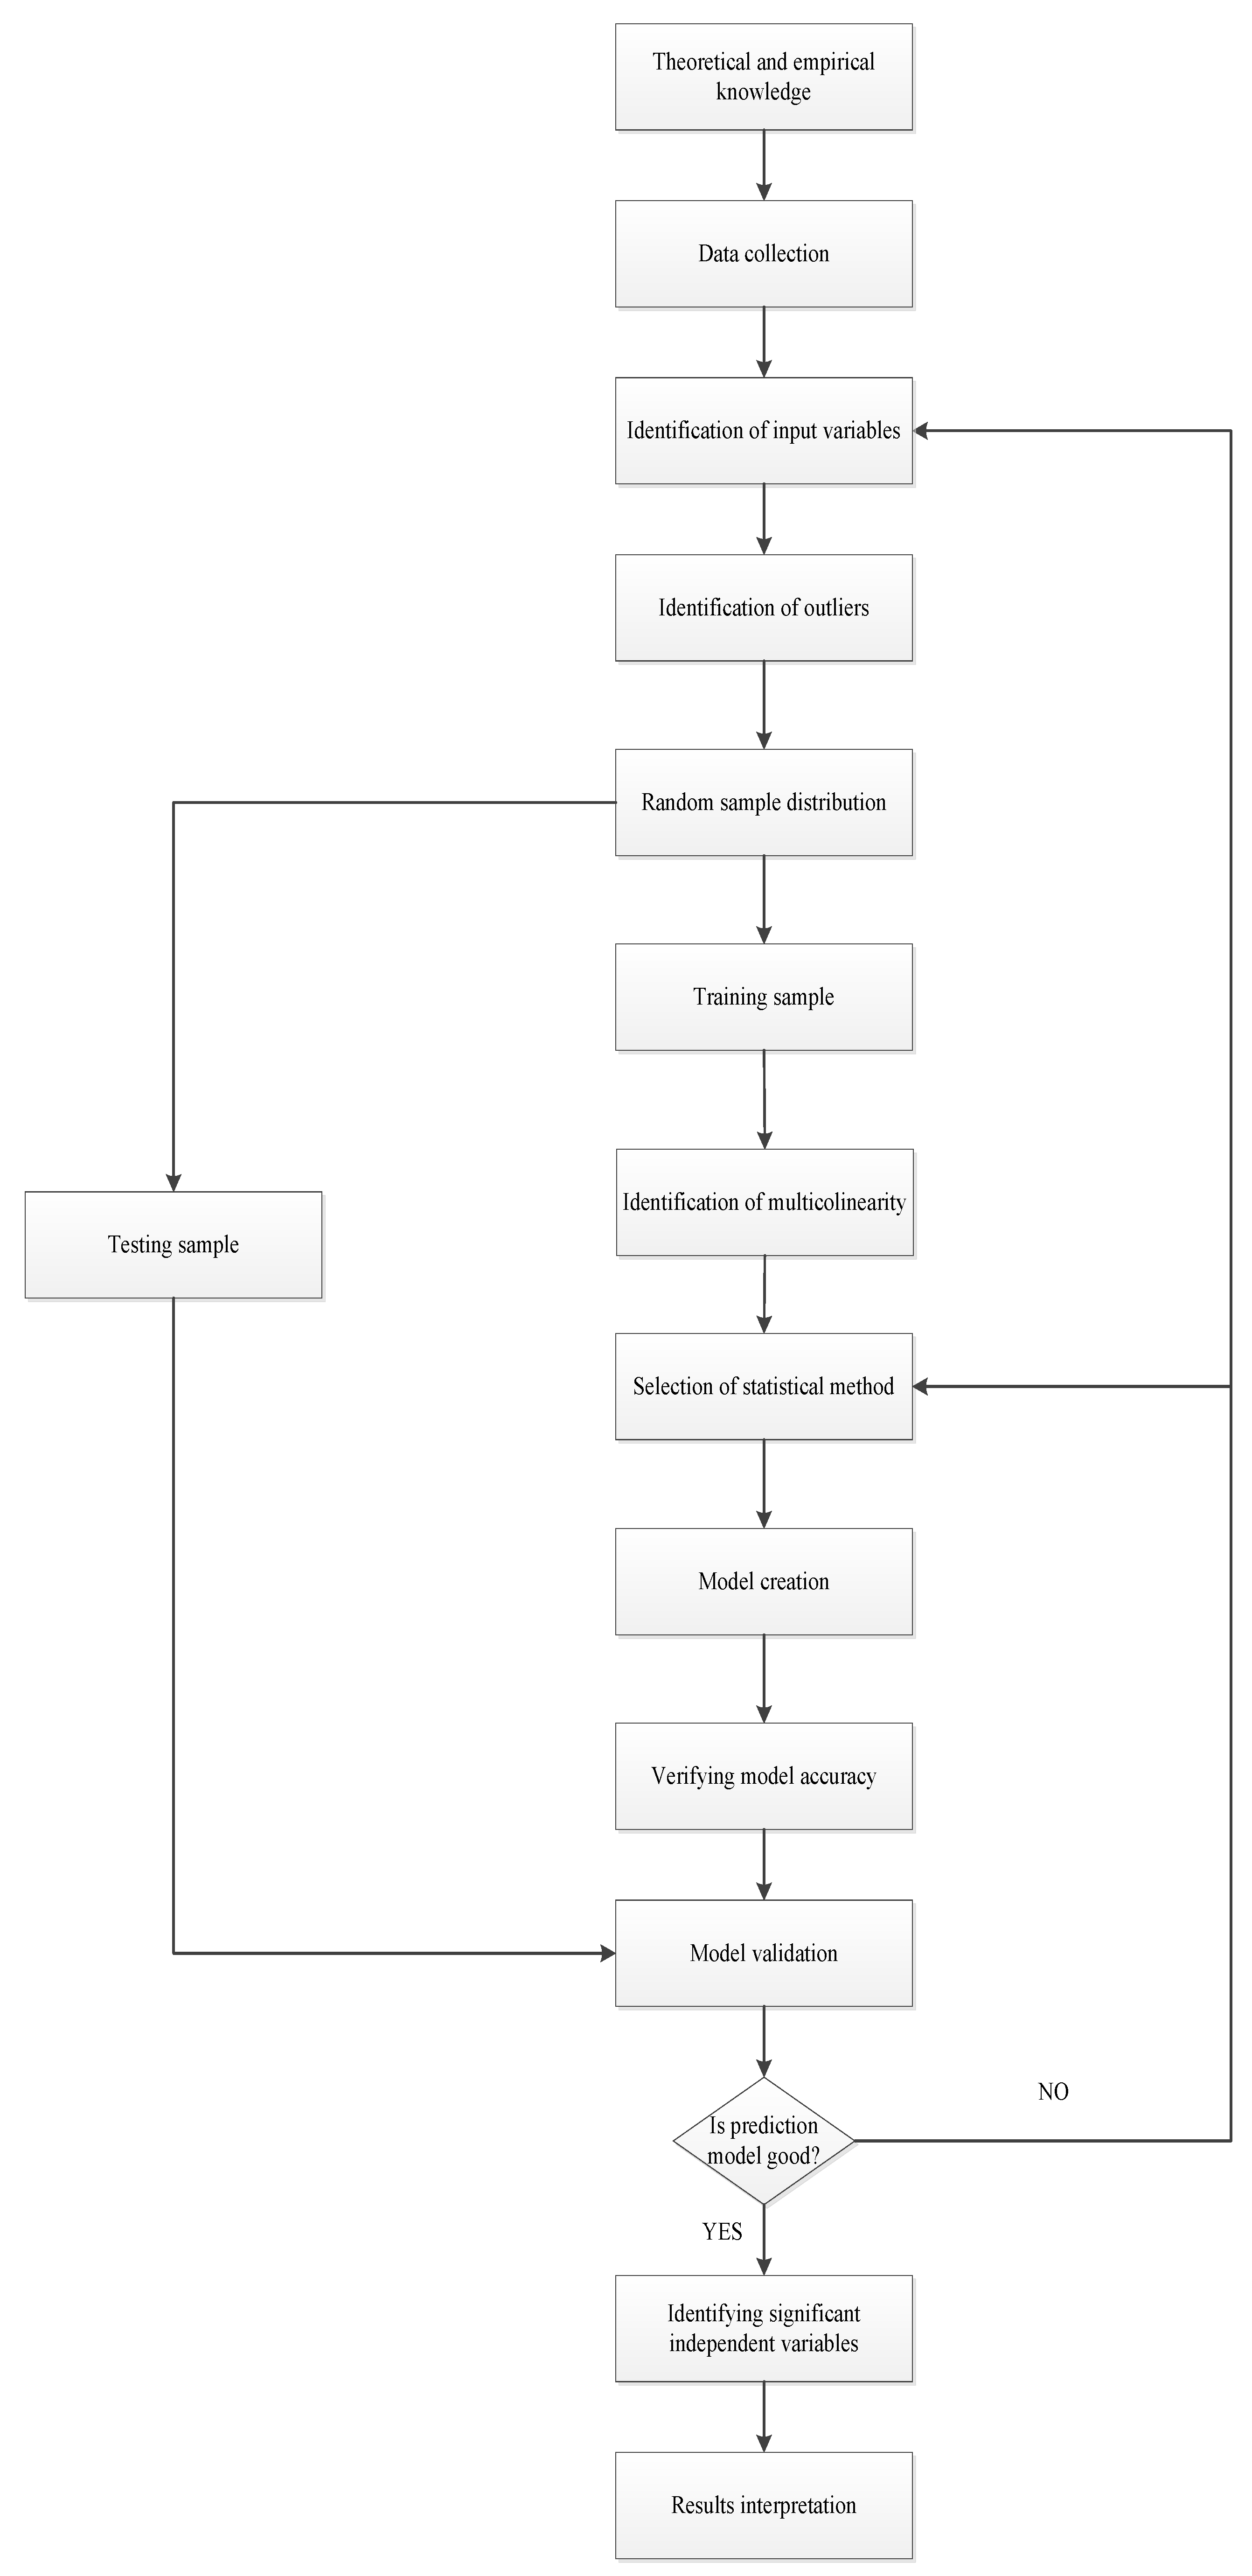
Figure A1 shows the main steps in creating the prediction model. Moreover, at the beginning of creating the prediction model, we make descriptive statistics, remove outliers in the sample on based Mahalanobis distance and calculate multicollinearity in the testing sample.
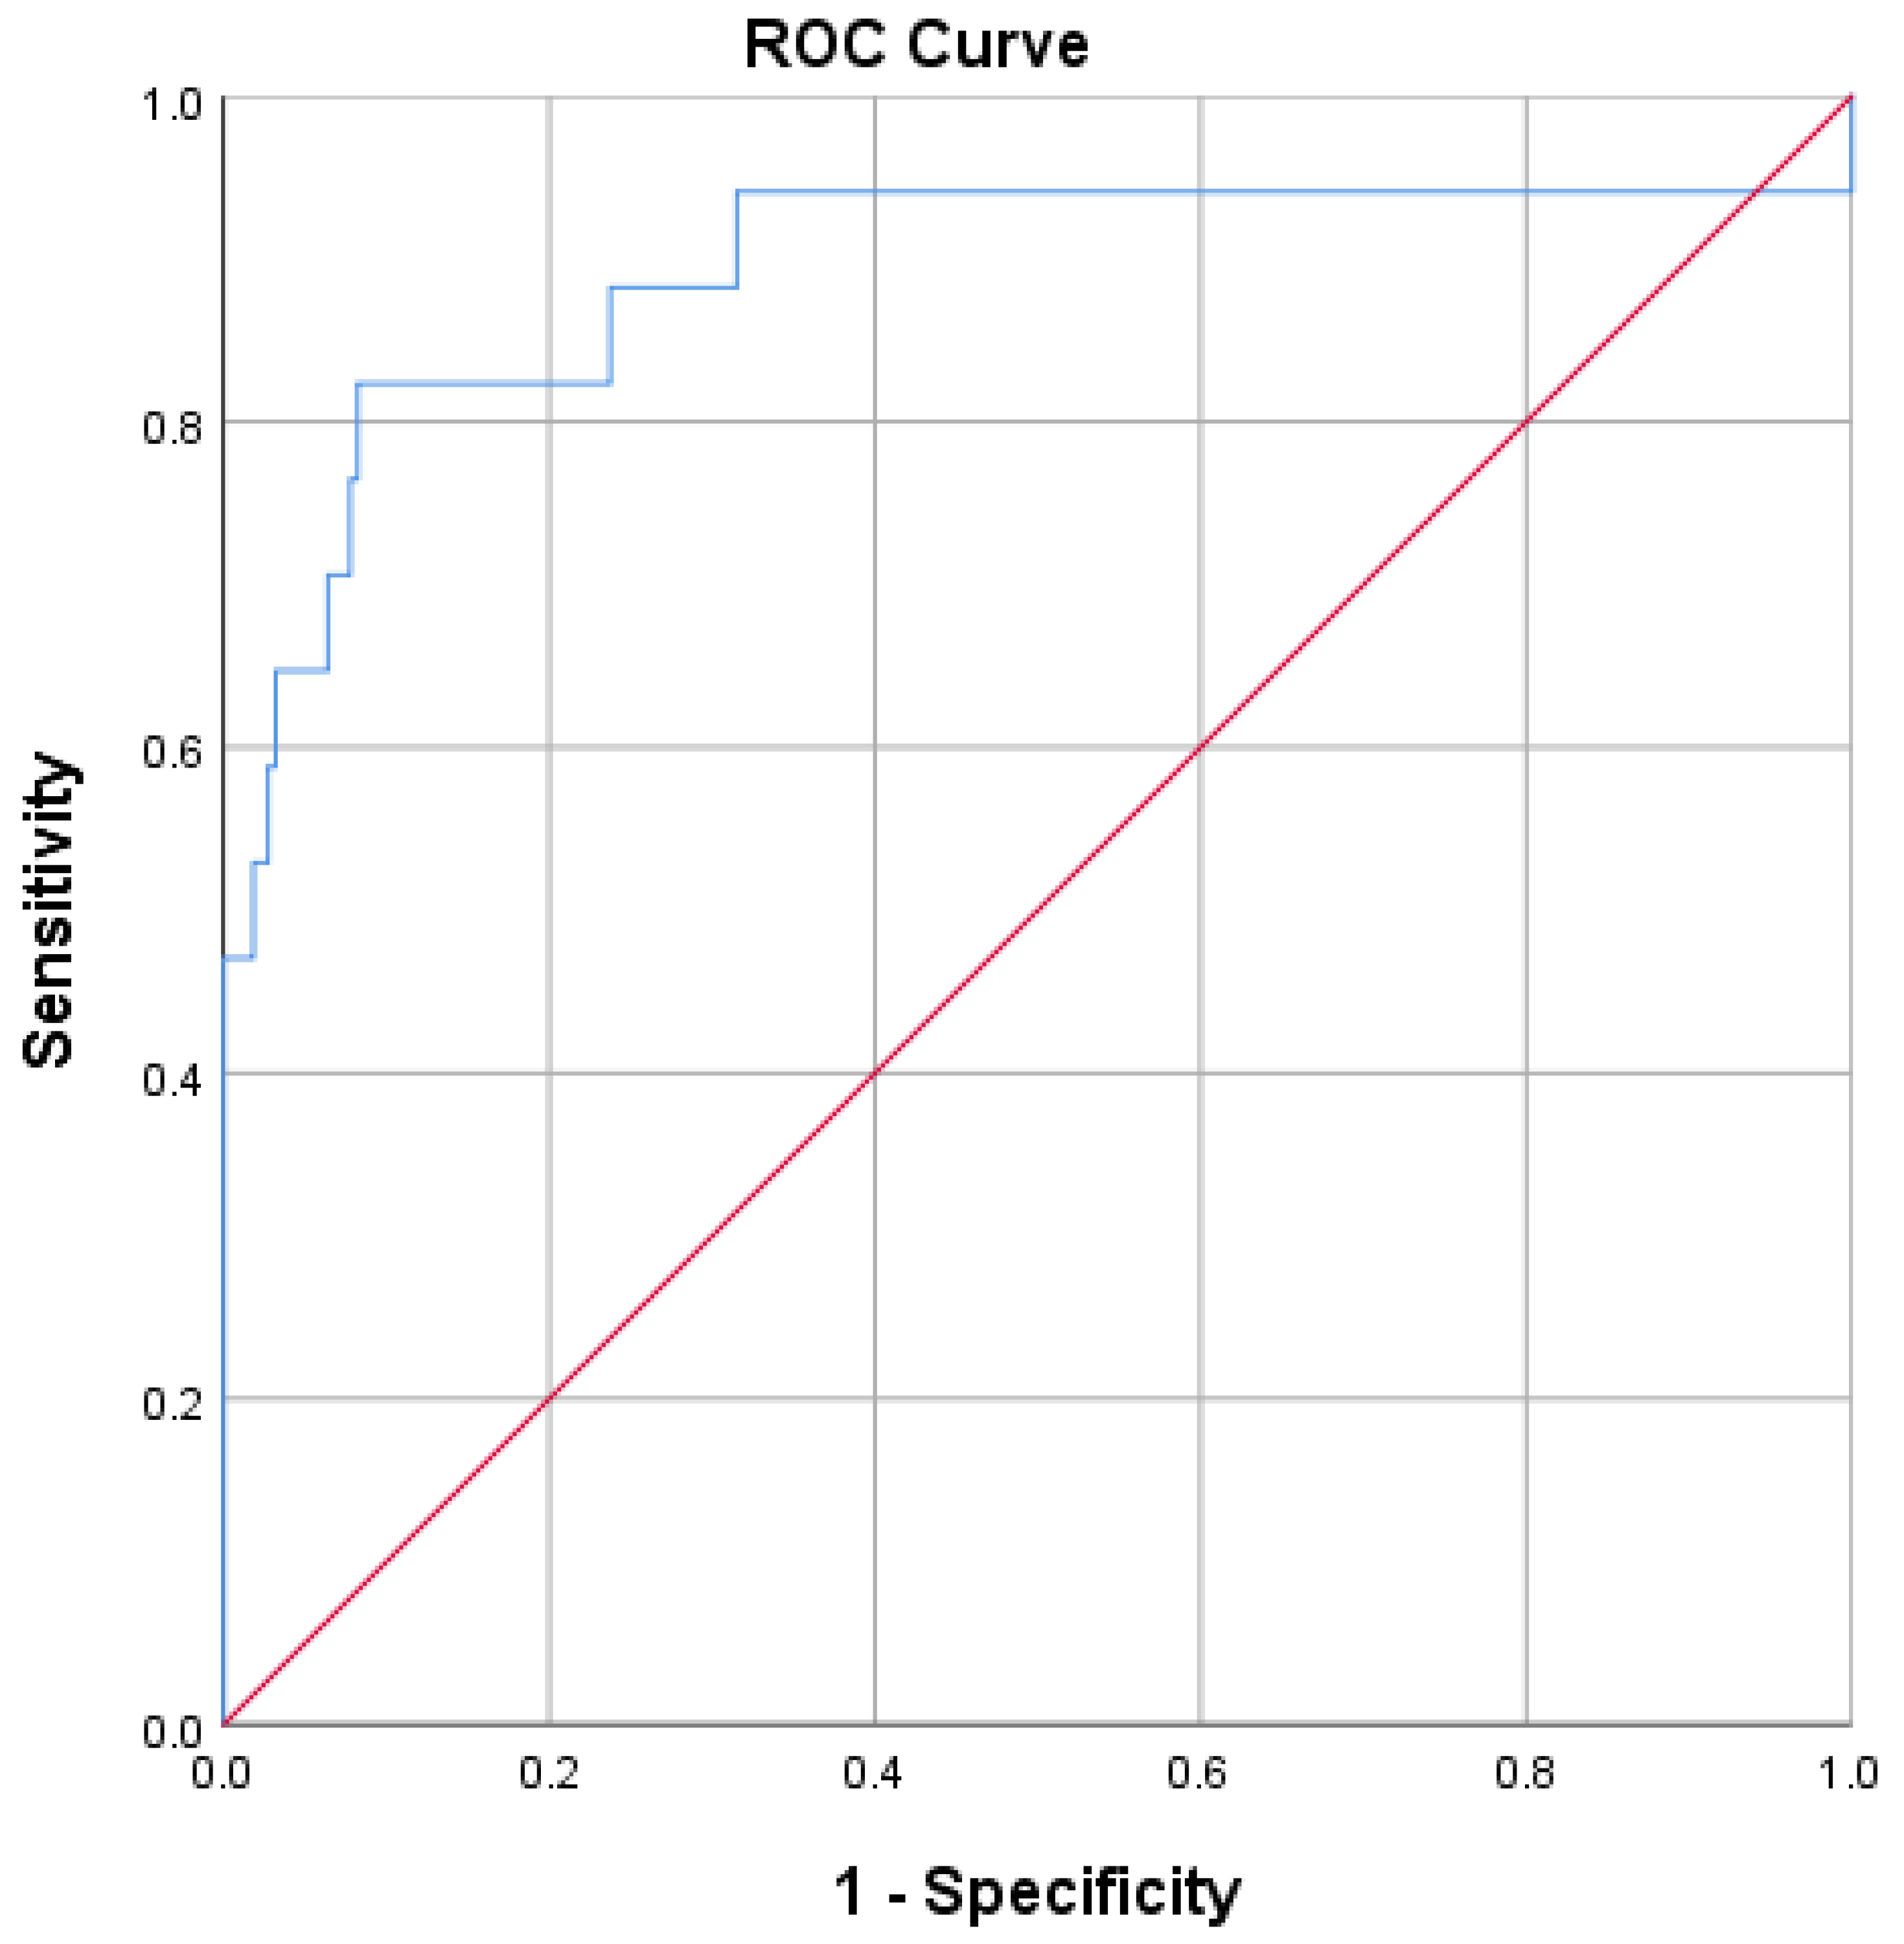
Finally, we verify the proposed model on the testing sample. Gupta (2017) [
32] argues that the validity of a model is assessed using ROC. If the metric is equal to 1, they indicate perfect (ideal) predictive accuracy. High values mean that the model estimates the high probability of a successful estimate. In our case, we use the ROC curve in SAS and IBM SPSS Statistics 25 because provides relevant results with graphical representation.
The sample consists of 351 Slovak non-profit organizations, namely foundations and non-investment funds. We determine independent variables and identify outliers before creating a model of the financial status of non-profit organizations. The initial sample is divided into two sub-samples, namely training and testing sub-sample. The main aim of the training sample is to create a model, then we verify the proposed model on the testing sample.
Table 2 shows that the training sample includes 236 organizations (80%), and the testing sample consists of 59 organizations (20%).
We collect a lot of financial data on based statements from various financial databases, such as Amadeus (2018) [
33] and Finstat (2018) [
34], but also from the Ministry of Finance of the Slovak Republic (2018) [
35] and the Ministry of Interior of the Slovak Republic (2018) [
36]. These data are necessary to calculate variables, such as liquidity indicators, activity indicators, debt ratios, profitability ratios, etc. These variables are selected from various relevant theoretical and empirical knowledge. Moreover, we choose other variables, such as contribution from tax paid to total revenues (CPTREV), dotation to total revenues (DOTREV), liquidity ratio (LIQRAT), non-current assets (NCUASS), net working capital to total assets (NWCASS), legal form of the non-profit organization (PRAFO) and type of non-profit organization (TYPKOD). Most of the independent variables are continuous variables except for PRAFO and TYPKOD. These variables are dichotomous indicators. We highlight that foundation is a reference group compared to a non-investment fund in terms of PRAFO and the non-commercial (non-profit) organization is a reference group compared to a commercial (non-profit) organization. According to Forum darcu (2016) [
37], the commercial (non-profit) organization is an organization established by at least one legal entity, such as a public company, limited partnership, limited liability company, and joint-stock company. The commercial (non-profit) organization means an organization that presents its activities together with the logo of the founding company, especially in the home region and the surrounding area. Many of these organizations are established primarily as a tool for building the concept of social responsibility. However, the benefits for major companies in the banking, insurance, and automotive industries are associated with contributions from taxes paid. These companies donate contributions from the tax paid to the “partner” non-profit organization, the contribution helps to build a good reputation in civil society based on tax law.
Table 3 shows all independent variables with the method of calculation. We assume that the long-known non-profit organization has more trust in citizens, so financial vulnerability is low. Moreover, we believe that the revenue structure affects the financial status of the non-profit organization. The typical financial variables take into account the revenue structure include CPTREV, DOTREV, and SALREV.
We also focus on the property structure because the organization is able to provide better services to the public if the organization has tangible assets. The independent variables also include the logarithm of the assets. We apply a logarithm of assets compared to assets because the volume of assets is very different among the organizations in the initial sample. The logarithm eliminates these differences. We expect a non-profit organization with a larger volume of assets to be less vulnerable.
Furthermore, non-profit organizations monitor liquidity indicators mostly in contrast to profitability. We assume that liquidity has a significant impact on the financial status of the organization, because if the organization is not liquid, this situation threatens its daily activities and projects.
Finally, we include non-financial input variables as the legal form and type of non-profit organization. The financial situation of non-profit organizations varies greatly between foundations and non-investment funds. We believe that foundations are less vulnerable because they rely on more donors. Furthermore, in our opinion, commercial (non-profit) organizations are more vulnerable to others because they generally rely on only one key donor.
We find out on based descriptive statistics that the sample includes very different non-profit organizations in terms of selected independent variables.
Table 4 shows detailed results of descriptive statistics of the initial sample, the primary purpose is to explain the current state of the Slovak non-profit sector. The results show that the revenue concentration (CONREV) is relatively high, as the non-profit organization reaches an average HHI of more than 65%. In addition, 25% of non-profit organizations rely on one revenue item mainly contribution from the tax paid on total revenues (CPTREV). The ratio shows that contribution represents almost 37% of total revenues in the non-profit sector. Furthermore, many non-profit organizations do not use debt to finance assets. The median debt is 0.025, representing 2.5%. We demonstrate that less than 25% of non-profit organizations use debt ranging from 2.5 to almost 16%. The non-profit sector does not use debt because banks are not willing to provide loans to non-profit organizations. The average operating margin is (−) 19,806 because many non-profit organizations have more costs than revenues. This result is due to extreme values, as only 25% of non-profit organizations achieve an operating margin higher than (−) 0.219. These results are likely to affect the existence of non-profit organizations, as the average non-profit organization is over 13 years old. We find that the average and the median age of a non-profit organization are almost identical. Kaba (unknown year) [
38] claims that the data usually contain one or more values that are too different from other data. These extreme values can significantly affect the quality of the statistical analysis. We remove the extraordinary values in the sample. Kaba (unknown year) [
38] recommends the distance of Mahalanobis. We will exclude 10 non-profit organizations from the original sample using the Mahalanobis distance. Moreover, 46 observations are also excluded as the discriminant analysis is sensitive to the absence of some values in the independent variables.
Based on the scientific question: “Which quantitative and qualitative variables are considered statistically significant in the estimation of the financial status of non-profit organizations through discriminant analysis?” we formulate hypotheses:
| H0AGEORG: | AGEORG does not have statistically significant impact on the financial status of NPOs. |
| H0CONREV: | CONREV does not have statistically significant impact on the financial status of NPOs. |
| H0CPTREV: | CPTREV does not have statistically significant impact on the financial status of NPOs. |
| H0DEBRAT: | DEBRAT does not have statistically significant impact on the financial status of NPOs. |
| H0DOTREV: | DOTREV does not have statistically significant impact on the financial status of NPOs. |
| H0EQUREV: | EQUREV does not have statistically significant impact on the financial status of NPOs. |
| H0LIQRAT: | LIQRAT does not have statistically significant impact on the financial status of NPOs. |
| H0LOGASS: | LOGASS does not have statistically significant impact on the financial status of NPOs. |
| H0NCUASS: | NCUASS does not have statistically significant impact on the financial status of NPOs. |
| H0NWCASS: | NWCASS does not have statistically significant impact on the financial status of NPOs. |
| H0OPEMAR: | OPEMAR does not have statistically significant impact on the financial status of NPOs. |
| H0PRAFO: | PRAFO does not have statistically significant impact on the financial status of NPOs. |
| H0SALREV: | SALREV does not have statistically significant impact on the financial status of NPOs. |
| H0TYPKOD: | TYPKOD does not have statistically significant impact on the financial status of NPOs. |
4. Results
The complex process of creating a prediction model consists of several steps. First, we test a correlation among financial indicators (see
Table A1). The correlation matrix shows that there is a very low to medium correlation among the input variables. Rimarcik (2007) [
39] recommends VIF (variance inflation factor).
Table 5 shows that there is no multicollinearity among independent variables. In other words, the variables are suitable for estimating the financial status of non-profit organizations. Multicollinearity is calculated on the training sample. Moreover, we test multicollinearity using condition index (see
Table A2). The confidence index demonstrates moderate multicollinearity. We decided to create a model with all variables and with variables without NWCASS and NCUASS. However, we find that both prediction models have the same coefficients because the discriminant analysis uses the “stepwise method” as a method for selecting the relevant variables. We present a model using all potential input variables.
Second, we apply the Box test which tests the equality of group means of independent variables. We expect the
p-value (>0.05) to indicate that the covariance matrices do not differ significantly in terms of normal multidimensional character.
Table 6 clearly shows that covariance matrices cannot be deemed identical. We use assumption of different covariance matrices in the IBM SPSS Statistics 25. The log-determinants of the covariance-variance matrices of individual groups are distant.
Third, we verify the match of mean values of independent variables between groups. If the mean values are not statistically significantly different, so the variables will discriminate incorrectly between the groups. The fact has an impact on the model’s low classification capability.
We test whether an independent variable can be considered a suitable discriminator. Based on the p-value of F-statistics, each independent variable is assessed for the difference in mean values between the groups, in other words, we identify the variable that is significant at the relevant significance level. For a large sample set of at least 50 units, ANOVA is sufficiently robust to violate the assumption of normality, but even if the variable does not satisfy the p-value < α, it is part of the stepwise method and the accuracy of rejection from the resulting discriminatory function is confirmed.
Table 7 shows that this assumption was not met for all selected discriminatory variables, except for the four variables, the debt ratio (DEBRAT), the networking capital ratio on assets (NWCASS), the share of income subsidies (DOTREV), and the liquidity ratio (LIQRAT). In the case of these variables, we reject the null hypothesis. On the other hand, we do not reject the null hypothesis in the other variables. These variables are significant discriminators. In other words, invulnerable non-profit organizations differ in the average values of the statistical variables considered.
In this section, we explain the process of modeling using discriminatory analysis. This model was created through a training sample consisting of 236 non-profit organizations. In addition, this model was verified on a testing sample consisting of 59 organizations. We stratified the sample to make the percentage of invulnerable and vulnerable non-profit organizations comparable in both samples. The model is created using independent variables.
Table 8 shows the results of the canonical correlation in the discriminatory analysis and
Table 9 demonstrates the results of the statistical significance of the correlation. We evaluate the overall quality of the model based on these results. In other words, we find out whether canonical discriminatory functions sufficiently distinguish groups of invulnerable and vulnerable non-profit organizations. In our case, we have two groups of non-profit organizations, so there is only one discriminatory function. The canonical correlation for a given model is 0.632, indicating a relatively strong correlation between discriminatory function and independent variables, this correlation is statistically significant (
p < 0.001). We demonstrate that the value of the canonical correlation coefficients in the discriminatory analysis is at a low or medium level, in other words, this discriminatory function may be considered appropriate.
Table 10 shows that the model consists of two variables, namely the debt ratio (DEBRAT) and the share of revenue subsidies to total revenues (DOTREV).
These variables form an equation of a discriminatory equation.
Table 11 classifies non-profit organizations to the group whose centroid is closest to the calculated discriminatory score. We recommended that a non-profit organization be included in the same number of individual group measurements based on the Z-score to the respective centroid. On the other hand, it is recommended a weighted average of centroids with unequal observations in groups. In general, weights are expressed by the number of observations. If the model also contains a constant, the result is an average discriminatory score of 0. If the Z-score is negative, so the non-profit organization is invulnerable. If the Z-score is a positive number, then the non-profit organization belongs to a group of vulnerable non-profit organizations. We established 14 scientific hypotheses about the impact of selected independent variables on the financial status of non-profit organizations. This effect is tested using stepwise methods as one of the two methods in discriminant analysis in SPSS25.
Table 11 shows significant variables in model using discrimination analysis. The results of the discrimination analysis based on the “stepwise method” achieve better results compared to “enter independents together.”
The discriminatory ability of the indicators is obtained based on the absolute values of the standardized coefficients of the canonical discriminatory function. These results are extended by correlation coefficients between discriminatory functions and independent variables, they form the final prediction model for non-profit organizations in Slovakia. We find that the debt ratio indicator (DEBRAT) is the biggest impact based on the values of standardized coefficients of canonical discriminatory function.
Table 12 and
Table 13 show that the correlation is strong for the debt ratio variable (DEBRAT) and low for the total income ratio (DOTREV).
We estimate the future development of a non-profit organization by including organizations in a group of invulnerable or vulnerable organizations based on a discriminatory equation.
The accuracy of the prediction model. In general, prediction models are created for practical purposes.
Table 14 shows that the discriminatory analysis model correctly classifies 201 non-profit organizations without financial invulnerability from 219 invulnerable non-profit organizations, representing 91.78%. On the other hand, 13 out of 17 vulnerable non-profit organizations classify discriminatory analysis, representing 76.47%. In other words, the discriminatory analysis predicts correctly 214 out of 236 organizations, indicating a total accuracy of 90.68%. These results are generated in the training sample. We calculate the Type I error and Type II error based on
Table 14. Type I error represents a ratio of four to 205, which represents 1.95%, with error II. type is 18 to 31, which is 58.06%.
Figure 1 shows ROC results, the area under the curve is large enough. The value is 0.891 with a confidence interval of 0.776 to 1.
Table 15 indicates that the model has a good classification capability.
Model validation. We verify the model of discriminatory analysis on the testing sample.
Table 16 shows that the model correctly classifies 43 out of 55 invulnerable organizations, representing 78.18%, and all vulnerable organizations, representing 100.00%. In addition, we find that Type I error is 0%, which is a ratio of 0 to 43 organizations and Type II error is the ratio of 12 to 16 organizations, representing 75%. The results show that the model correctly estimated 47 out of 59 non-profit organizations, representing 79.66%.
We argue that discriminatory analysis is suitable for predicting financial vulnerability because all vulnerable organizations are correctly estimated, but overall success is less than 80%, which is mainly due to Type II error.
5. Discussion
In general, the economy consists of the state, public and non-profit sector. Non-profit organizations and organizations of the social economy have a greater impact on long-term sustainability. Chaves & Monzon (2012) [
40] analyze the social economy as the third major sector between the public and private sector. They argue that social enterprises offer new scientific, social, and economic visions to ensure sustainable economic growth. The social economy offers many economic, political, and social benefits, such as removing economic barriers, improving social policy, generating social capital, and more. In addition, they emphasize that the social economy is a new pillar of a new economically and environmentally sustainable model and creates the potential for innovation. We emphasize that a few authors focus on sustainability in the non-profit sector. It means that sustainability in the non-profit sector has significant potential in future research. Jones & Mucha (2013) [
41] claim that non-profit organizations serve the public goods. Many NGOs, but also for-profit organizations voluntarily assess the environmental, cultural, economic, and social outcomes of growing public awareness of sustainability. On the other hand, sustainability assessment is particularly popular in the profit sector compared to non-profit organizations. Sustainability has an environmental or financial form. Ceptureanu, Ceptureanu & Orzan (2017) [
42], Lee (2017) [
43], Pirson (2015) [
44], Jones & Mucha (2013) [
41] and Chi-kan & Ong (2012) [
45] focus on sustainability in the non-profit sector all over the world.
Fukas & Gustafik (2005) [
46] argue that private companies are aware of their responsibility to the society in which they play an important role. Many entities contribute to support publicly beneficial projects, which in the past were mainly financed by the non-profit sector. Moreover, Fukas & Gustafik (2005) [
39] assume that the apparent dividing line between the profit and non-profit sector will gradually disappear because these organizations will work together. Trust in non-profit financial management is extremely important for future collaboration. We offer the prediction model which assesses the financial status of Slovak non-profit organizations. The prediction models are extremely important to indicate potential financial problems which threaten long-term sustainability. The main aim of the model is to warn on problems in advance because many organizations in the for-profit and non-profit sectors can prepare for the financial crisis. The proposed prediction model is sustainable innovation in the Slovak non-profit sector because Slovak scientists focus on only the for-profit sector. We find out that significant discriminator variables are the ratio (DEBRAT) and the share of income subsidies to total revenues (DOTREV). These results demonstrate that if the debt ratio increases, the financial vulnerability increases, too. Similarly, if a non-profit organization is very dependent on subsidies from state or regional agencies, the likelihood of financial vulnerability increases.
The financial sustainability of non-profit organizations can be assessed in relation to diversification and concentration strategies. In general, many studies show that the revenue concentration is dangerous due to the share of subsidies in total revenues. It is clear that if a non-profit organization relies exclusively on contributions from state and regional institutions together with external sources, the risk of financial vulnerability increases. The high level of indebtedness threatens a non-profit organization in the same way as organizations in for-profit sector. However, the goal of non-profit organizations is not to capitalize on external resources through commercial activities. Banks are aware that a non-profit organization applies for a loan to support a charity project. In most cases, non-profit organizations act as risk entities from the perspective of these institutions. If banks approve a loan, the loan is very expensive.
Some research focuses on funding non-profit organizations to support multi-source funding to ensure day-to-day operations. These steps reduce the revenue concentration and encourage the diversification of total contributions from multiple donors and contributors. However, our results show the rate of revenue concentration according to the HHI index does not have a statistically significant impact on the financial status of Slovak non-profit organizations.
Table 17 summarizes the results of testing independent variables.
Our objective was to create a specific model that can identify the financial vulnerability of a non-profit organization based on training and testing sub-samples. This issue is much less developed compared to businesses, many studies focusing on U. S. nonprofits. In addition, the prediction model must be able to determine other organizations outside of the sample. We identify 76.47% of non-profit organizations with financial vulnerability in the training sample. Moreover, we find out that the model achieved 100% of prediction ability of non-profit organizations with financial vulnerability based on the testing sample. On the other hand, we demonstrate the discriminatory analysis model is suitable for estimating financial status because the overall accuracy is almost 80% for the testing sample due to Type II error.
Table 18 summarizes the main research results.
The issue of risk management is demanding on dataset on accounting and financial variables-based balance and income statements. The model is relevant for the non-profit sector in the Slovak Republic. In future research, we can verify the model on a sample of non-profit organizations from other countries in Central Europe. However, we do not currently have access to a relevant sample of non-profit organizations using international databases, most of the data on non-profit organizations is obtained from a regional database from Finstat (2019) [
34]. We believe that this model is relevant for the non-profit sector in the Slovak Republic because performance metrics show good results.
We hope that this paper will draw the attention of non-profit organizations to improving non-profit management. The results clearly show that non-profit organizations should be more active towards the individual and other private donors as opposed to state institutions. Based on these results, we are convinced that the independence theory has a significant position in today’s society. Although companies and non-profit organizations are independent organizations, they must work together to achieve a synergy effect.
Table 19 demonstrates a proposed model with models from previous research. As can be seen, the proposed model differs significantly from other models, as the model consists of only two significant variables, namely, the debt ratio and the share of subsidies from state and regional institutions in total revenues. Other variables such as equity, revenue concentration, operating margin, size do not affect the financial status of Slovak non-profit organizations.
Limitations. First, research is done on a relatively low number of non-profit organizations compared to American studies. However, we believe that the total number of non-profit organizations is high in terms of specific conditions of the Slovak Republic. The reason is that Slovak law does not require publishing financial statements from most non-profit organizations because the only foundation and non-investment funds are obliged to publish statements. The research on nonprofits is very limited to unavailable data from financial statements around the world. In short, research on the prediction of financial vulnerability is very specific in our region. Second, a few authors deal with the prediction of financial vulnerability in the non-profit sector abroad, while Slovak authors focus mainly on the role of non-profit organizations in society, in other words, macroeconomic perspective. Third, we considered various kinds of financial indicators for a long time because discrimination analysis is sensitive to the absence of independent variables.
Future research. Future research offers several opportunities. First, we can compare the predictive power of the proposed model with predictive models from foreign authors on based the initial sample. Second, data on non-profit organizations is limited. However, we would verify the presented model on a sample from other countries in future research. Unfortunately, we do not have data on financial indicators from other countries. We look currently for a relevant database offering data on European non-profit organizations. Our data are obtained from various sources, such as Finstat [
34], Register of financial statements by Ministry of Finance of the Slovak Republic [
35], and Amadeus [
33], but most of the data is drawn from the financial statements from the Register of financial statements Ministry of finance of the Slovak Republic [
35]. These financial statements are in pdf files. Third, we can apply the statistical method—survival analysis, namely Life tables, Kaplan-Meier estimate, or Cox regression, which is used mainly in medicine, but this method is also popular in the prediction of the financial health of enterprises. The method differs from discriminatory analysis or logistic regression. The main difference is that this method estimates the time to occurrence of the event compared to discrimination analysis or logistic regression.
6. Conclusions
Many non-profit organizations are hybrid organizations that move on the border between the for-profit and non-profit sector. Nowadays, non-profit organizations cooperate more closely with companies. We think that the interdependence theory has the potential for the future because collaboration among non-profit and other organizations tends to be more effective.
Scientists have verified various scientific hypotheses about the for-profit sector but also about non-profit organizations. In our case, we focused on predicting the financial vulnerability of non-profit organizations. In general, prediction models use statistical methods that improve decision-making and sustainable development.
This study represents one of the initial contributions in the field of predicting the financial status of non-profit organizations for researchers in Central Europe. We propose a model for a specific region based on a wide range of theoretical and empirical knowledge from renowned authors from around the world. We summarize theoretical knowledge to describe definitions of financial vulnerability, potentially significant financial indicators, and statistical methods, and our professional experience in risk management. These findings are applied to create a predictive model with excellent performance capabilities based on the classification of organizations into invulnerable and vulnerable non-profit organizations and ROC results. In other words, the complete methodology offers a comprehensive model. The advantages of the model lie in the simple calculation and obviously the interpretability. The model helps in making donation decisions from many donors and contributors.
We believe that the paper is the basic pillar as starting study for the non-profit sector in Central Europe as opposed to the for-profit sector. The value added represents new theoretical and empirical knowledge for future research in risk management. In addition, we demonstrate a new specific tool for determining financial vulnerability in the non-profit sector based on Slovak non-profit organizations. This tool is applicable to the difference of models from previous research.
The main reason for creating a prediction model is mainly related to filling the gap in the research of non-profit organizations in Central Europe. The results show that non-profit organizations should focus on commercial activity, such as the sale of goods and services because most organizations rely mainly on state and regional donations. We find that a vulnerable non-profit organization is characterized by high indebtedness and a high share of subsidies from state and regional institutions in total revenues. We point out that non-profit organizations should rely more on each other than on other entities. Based on descriptive statistics, we find that many non-profit organizations rely on contributions from taxes paid, but this indicator is not a statistically significant variable in the model using discriminatory analysis. In addition, many non-profit organizations achieve very low self-financing rates. Finally, the high debt ratio has a negative impact on the financial vulnerability of non-profit organizations. Although banks are reluctant to lend to organizations due to volatile revenues. In other words, non-profit organizations are highly dependent on public and for-profit organizations providing contributions to ensure day-to-day operations.
The research shows that non-profit organizations should not rely solely on contributions from national and regional institutions. Non-profit organizations should focus on contributions from their own resources, as these resources can be affected by management of the non-profit organization. If organizations rely on grants along with high indebtedness, managers face a high degree of financial vulnerability. Poor financial management of the organization leads to significant problems in terms of sustainability of planned activities.


