Article

Determining an Improved Traffic Conflict Indicator for Highway Safety Estimation Based on Vehicle Trajectory Data

1
School of Transportation, Wuhan University of Technology, 1178 Heping Avenue, Wuhan 430063, China
2
School of Civil Engineering and Architecture, Wuhan Institute of Technology, Wuhan 430205, China
*
Author to whom correspondence should be addressed.
Sustainability 2021, 13(16), 9278; https://doi.org/10.3390/su13169278
Submission received: 12 July 2021 / Revised: 12 August 2021 / Accepted: 15 August 2021 / Published: 18 August 2021

Abstract

:
Currently, several traffic conflict indicators are used as surrogate safety measures. Each indicator has its own advantages, limitations, and suitability. There are only a few studies focusing on fixed object conflicts of highway safety estimation using traffic conflict technique. This study investigated which conflict indicator was more suitable for traffic safety estimation based on conflict-accident Pearson correlation analysis. First, a high-altitude unmanned aerial vehicle was used to collect multiple continuous high-precision videos of the Jinan-Qingdao highway. The vehicle trajectory data outputted from recognition of the videos were used to acquire conflict data following the procedure for each conflict indicator. Then, an improved indicator Ti was proposed based on the advantages and limitations of the conventional indicators. This indicator contained definitions and calculation for three types of traffic conflicts (rear-end, lane change and with fixed object). Then the conflict-accident correlation analysis of TTC (Time to Collision)/PET (Post Encroachment Time)/DRAC (Deceleration Rate to Avoid Crash)/Ti indicators were carried out. The results show that the average value of the correlation coefficient for each indicator with different thresholds are 0.670 for TTC, 0.669 for PET, and 0.710 for DRAC, and 0.771 for Ti, which Ti indicator is obviously higher than the other three conventional indicators. The findings of this study suggest TTC often fails to identify lane change conflicts, PET indicator easily misjudges some rear-end conflict when the speed of the following vehicle is slower than the leading vehicle, and PET is less informative than other indicators. At the same time, these conventional indicators do not consider the vehicle-fixed objects conflicts. The improved Ti can overcome these shortcomings; thus, Ti has the highest correlation. More data are needed to verify and support the study.

1. Introduction

Traffic conflict indicators are used as surrogate safety measures to assess the severity of every traffic conflict. At present, the most common single indicators of traffic conflicts are as follows: The first measures risk aversion behavior and determines whether there is a conflict by observing whether an aversion behavior exists as well as the severity based on the urgency. Most of the assessments are qualitative, and generally include steering and obvious deceleration (indicated by the turning on of rear (brake and park) lights) [1]. The second measures the proximity in space and time. The two most common indicators of this type are the time-to-collision (TTC) [2,3,4] and the post-encroachment time (PET) [4]. The third measures characteristics of the vehicle’s own movement, such as deceleration. The most common indicator of the vehicle’s own movement characteristics is the deceleration rate to avoid crash (DRAC) [5,6,7]. In addition, in recent years, some studies have begun to use combined indicators for conflict identification [8,9,10,11]. In general, these traffic conflict indicators have played a significant role in the promotion and application of traffic conflict techniques. However, at this stage, these indicators have their own advantages, limitations and suitability, and there are differences in the selection of traffic conflict indicators and corresponding thresholds (see literature review for details).
The road traffic flows in highways have the following characteristics: a large area that enables the coexistence of car following and merging, many rear-end conflicts, lane changes conflicts and fixed objects conflicts with little study. Therefore, two questions follow: First, how can we better recognize when multiple traffic conflicts coexist? Second, how can we verify and compare the different conflict indicators in terms of their capability to estimate traffic safety? In response to the above two questions, this study first improves the conventional indicators based on their characteristics, advantages, and limitations, and establishes a conflict identification indicator that is more suitable for highways. As for collection methods, Unmanned aerial vehicles (UAVs) are used to collect high-precision videos in multiple areas to overcome the deficiencies of the previous cross-section conflict data collection, and then a large amount of continuous conflict data is obtained using video recognition and conflict recognition programs. Finally, a conclusive relationship between serious conflicts and accidents with different thresholds for each indicator is established based on the real accident data. The aim is to judge the safety estimation ability of each conflict indicator through the magnitude of correlation, and try to analyze and explain the reason.
The remainder of the paper is organized as follows. Following the introduction, a literature review containing traffic conflict indicator, collection methods and processing means, conflict-accident correlation is presented in Section 2. Section 3 describes data collection and processing. Section 4 introduces the proposal of improvement indicator Ti and verification process with other indicators, followed by the results of correlation under different thresholds of each indicator in Section 5. A discussion and analysis of the results appears in Section 6. Section 7 concludes the research findings.

2. Literature Review

2.1. Traffic Conflict Indicator

In the past, most research on traffic safety was based on historical accident data, and although they are logical and reasonable, there are certain limitations. (1) This method requires a large amount of historical traffic accident data. Compared with foreign countries, traffic accident data in China are relatively scarce and insufficient. For some newly built roads that have not been in operation for long periods, or roads that are in work zones, it is even more difficult to collect accident data. (2) Traffic accidents are inherently random and contingent. If the amount of accident data is insufficient and does not meet statistical requirements, the factors that influence traffic accidents cannot be analyzed, and it is difficult to arrive at useful conclusions on traffic safety estimation and improvement [12,13,14]. (3) Minor accidents or serious traffic conflicts that did not lead to accidents are often not recorded. For example, Hauer et al. [15] found that 60% of minor accidents were not recorded although they often contained a lot of potentially useful information. (4) The explanation and description of the causes of the accident are often based on people’s subjective perceptions and judgments. These shortcomings will affect the estimation based on traffic accidents [16]. (5) Analyses can only be done after accidents, which is of a post-hoc nature. In response to the above shortcomings, international scholars proposed the concept of traffic conflicts in the 1960s and 1970s, giving a summary of the Traffic Conflict Technique (TCT) [17]. The TCT can be used to observe and obtain a large amount of data before an accident and has the statistical advantages of large sample size, short period, small area, and high confidence level [18].
Current single indicators for measuring the severity of traffic conflicts are mainly divided into the following categories: (1) risk aversion behavior; (2) proximity in space and time; and (3) characteristics of the vehicle’s own movement, such as deceleration. The advantages, advantages, and applicability of each indicator are summarized in Table 1.
The threshold values for serious conflicts according to each common indicator are summarized in Table 2.
It can be seen from Table 1 and Table 2 that different scholars have differences in the selection of traffic conflict indicators and their respective thresholds in different scenarios, and each indicator also has its own advantages, limitations, and suitability.
The prerequisite for measurement indicators such as the TTC/DRAC/TA is that the traffic participants have a predetermined collision course, such that keeping with the current and constant driving speeds (where the speed of the vehicle behind is faster than the vehicle in front) and direction, a collision will inevitably occur according to geometric calculations. However, Svensson [27] and Tarko et al. [36] found that when two vehicles approach each other when lane change occurs, even at this moment, no conflict point can be predicted according to the definition of TTC. The drivers may feel that they are on a collision course and may thus commit risk aversion behaviors that ultimately lead to collision. This phenomenon illustrates two problems: First, the non-collision course, which considers that both vehicle speed and direction can often identify only rear-end, whereas it is difficult to identify certain dangerous lane-changing behaviors based on the definition. The assumption of a predetermined collision course is not sufficient to describe all accident risks, and traffic conflicts in a non-predetermined collision course need to be considered. Secondly, a traffic conflict is a continuous process in both space and time, and it is necessary to consider the changes in the vehicles’ motion state caused by the different drivers’ risk aversion behaviors. These changes may cause the conflict to become weaker and even disappear, or to become more serious. However, the definition and indicators of TTC describe only the state at a given instance in time, and it is thus necessary to splice these scattered “points” into “lines”, which can be realized with a large amount of continuous vehicle trajectory data.
Compared with TTC, PET has a simple definition and can be easily extracted or estimated using photometric analysis in video or simulated environment [4]. PET do not need to calculate a predetermined collision course but only a common area. However, PET can only be calculated when the rear vehicle passes through the common area, making them only applicable to post-conflict estimation, and nothing can be done before the conflict occurs [37]. Another weakness is that these indicators do not consider the real-time micro data of the two vehicles, which are not easily applied to studies on the interaction between vehicles.
It should be noted that in recent years, some scholars have proposed new conflict indicators, such as T2 [26]. T2 is defined as the maximum time required for two traffic participants to pass the intersecting point of their current directions assuming that the speed and path direction of the traffic participants remain unchanged. This indicator combines certain characteristics of both TTC and PET. For example, similar to PET, it only considers the current directions of the two traffic participants for the common area. As long as the directions intersect, the calculation is carried out. In this way, the risks of both the collision course and the non-collision course are included. At the same time, as both the TTC and PET indicators require microscopic data from the two conflicting vehicles, the traffic conflict state at all times can be obtained, and a pre-conflict estimation can be carried out. These all make up for the shortcomings of PET. However, this indicator has yet to be widely promoted, and more application scenarios are needed for verification.
In addition, in recent years, some research has begun to use composite indicators for identification [8]. For example, Behbahani et al. [9] combined the time exposed time-to-collision (TET) with the time integrated time-to-collision (TIT) and applied it to the collision avoidance system, which effectively reduced driving errors and rear-end. Alhajyaseen [10] used the changes in total kinetic energy, collision angle, and PET before and after the collision to derive a new conflict indicator and proposed safety measures that consider the probability of the accident and expected severity comprehensively. Wang et al. [11] made predictions based on extreme value theory and found that the predicted effects of identification indicators (compared with real accident situations) for different types of conflicts (such as rear-end and lane changing) are different, and composite indicators are better than single indicators. Using a bivariate extreme value model, Zheng et al. [8] found that from among several composite indicators, the composite indicator of TTC and PET is most relevant to real accidents. This composite indicator can overcome certain shortcomings of each single indicator and makes the measurement more scientific and accurate, providing an important idea for future research.

2.2. Traffic Conflict Data Collection Methods and Processing Means

There are three main types of acquisition methods: A. Field Observation, B. Naturalistic Driving, and C. Traffic Simulation. Considering the cost and some shortcomings of traffic simulation, this paper only considers the field observation method. The raw data that we collect will be processed to get the traffic conflict data. We use analysts who have completed observation training, or a computer with an automatic detection recognition.
Previously, conflict data processing work was mostly completed manually by the investigators and processing of large, subjective data components was mostly manual. Thus, the data accuracy and the collection of conflict data types were low. Later, with the development of computer video recognition technology, automatic identification of traffic conflict data in video recordings began through video detection technology [16,38,39]. The technology generally consists of two parts: video vehicle identification and traffic conflict identification. Due to the limited height of the camera in most cases, the measurement range of the method is small, usually around 100 m to 200 m. In addition, due to the problem of large vehicles blocking, the method is generally applicable to low-density traffic. The method also has requirements for camera lens resolution, placement angle, weather, environmental brightness, and so on. These traditional methods often observe cross-section or small-area conflict data, whether collected manually or by video recording.
It is worth mentioning that in recent years, some papers have been published on automatic conflict detection through video identification by unmanned aerial vehicle flying at high altitude above research subjects [11]. Compared with traditional cameras, this device has a good view at high altitude, no shooting angle or blocking problems, and a large shooting range, which can collect continuous large range vehicle trajectory data with obvious advantages.

2.3. Conflict-Accident Correlation

Traffic accident data is the most intuitive and logical indicator of traffic safety. If we want to use traffic conflict technique for reliable estimation and prediction, we must determine whether there is a connection between traffic conflicts and accidents. There are three main views on whether there is a strong correlation between traffic conflicts and accidents: (1) Walsh et al. [40] showed that traffic conflicts and accidents exhibit linear characteristics. Glauz et al. [41] found a good correlation between various types of traffic conflicts and accidents, and Hauer et al. [42] obtained the distribution coefficients of conflicts and accidents by maximum likelihood estimation. Karim et al. [43] also found a strong correlation between traffic conflicts and accidents based on data from 51 signalized intersections in Canada. (2) However, other studies have found no strong correlation between conflicts and accidents [44,45]. Possible reasons for this contradiction include: a. There are omissions and inaccuracies in traffic accident data records; b. There are problems with the method of collecting traffic conflict data; c. Traffic conflicts often collect data for a small period of time and location, which does not fully coincide with the time and location of the traffic accident [1]. (3) Still other scholars believe that the validity argument for traffic conflict techniques is unnecessary. They argue that the most important aspect of traffic safety research is accident prevention rather than accident prediction, and that traffic conflict techniques can be used as a tool for diagnosis and estimation and analysis of road traffic safety without the need to translate traffic conflicts into accidents [46]. Usama et al. [47] found that the correlation between serious conflicts and accidents under different TTC thresholds is different. Peesapati et al. [48] obtained similar findings on the PET. Yajie Zou et al. [49] take uncertainty into consideration when constructing models for clearance time after accidents by using a Bayesian Model Averaging (BMA) model. Ashutosh Arun et al. [50] established rigorous relationships between conflicts and crashes, developing ways to capture road user behaviors into a surrogate-based safety assessment.

2.4. Literature Summary

It can be seen from the above summary that: (1) At present, there is no unified standard for the selection of traffic conflict indicators and the selection of severe conflict thresholds. They often need to be determined according to the actual situation, and each indicator has its own advantages, limitations, and suitability. (2) Many scholars have obtained many useful conclusions based on traffic conflict technology at intersections and ordinary roads, but there are fewer studies on highways with more complex and special environments and multiple traffic conflicts. Moreover, there are road facilities in highways, so a large number of vehicle accidents occur with road facilities, but there is almost no research on the recognition of conflicts of fixed objects; (3) Traffic conflict is a continuous process in time and space, but at present, many traffic conflict methods often obtain cross-section or small area conflict data. Thus, we need better collection methods; (4) The conflict and accident correlation analysis can be used to verify the reliability.

3. Data

Two main types of data are collected: 1. Traffic conflict data (See Section 3.1, Section 3.2 and Section 3.3 for details). The conflict data are obtained using conflict identification programs for video recognition, where the videos are collected by high-altitude high-precision UAV. Compared with conventional cross-section video capture, UAV have a good high-altitude view and a relatively large shooting range without the problems caused by shooting angle and obstacles. Most importantly, they can collect a large amount of continuous data on vehicle course, overcoming the inability to obtain continuous changes of conflict risk between cross sections accurately from cross-sectional videos. 2. Traffic accident data (See Section 3.4 for details). The accident data are provided by the local traffic police, road administration department, and Shandong Hi-Speed Group.

3.1. Video Capture Location and Time

The video data were collected at the Jinan-Qingdao Highway in Shandong Province, China from 20 August to 8 September 2017. The data collection period includes the morning peak hours (9–11 a.m.) and the evening peak hours (3–5 p.m.). During the collection period, the first phase of the expansion project, namely the construction of the roadbed, was underway. In this phase, both sides of most of the roads were extended and filled with widened roadbeds. While the original roads remained in use, the normal guardrails on both sides were removed and replaced by temporary guardrails, the lateral clearance was compressed by temporary cones at the same time, so fixed object conflicts may increase. The roads have four lanes in both directions, with each lane having a width of 3.75 m and a speed limit of 80 km/h. The highway sections collected in this paper are shown in Figure 1. The specific segments and locations for the data collection used in this paper are shown in Table 3. The locations close to each other are grouped into one segment (e.g., K51 + 500 and K52 + 200 are grouped into Segment 1). For each segment, the traffic environment, traffic volume, and traffic composition are relatively stable within a certain range.

3.2. Video Capture Equipment

The equipment used is a PHANTOM 4 PRO UAV by DJI, which flies at a maximum altitude of 500 m and has a maximum flight time of 30 min. The maximum video resolution of the lens is 4 K/60 P. The UAV can take videos while hovering, and GPS was used for positioning. In the experiment, the UAV was hovering while taking videos with the camera vertically down and flying at a height ranging from 350 m to 450 m. Based on the viewing angle parameters of the UAV’s lens, the shooting range is approximately 600 m to 700 m in length and 300 m to 350 m in width. The video captured by UAV is as shown in Figure 2.

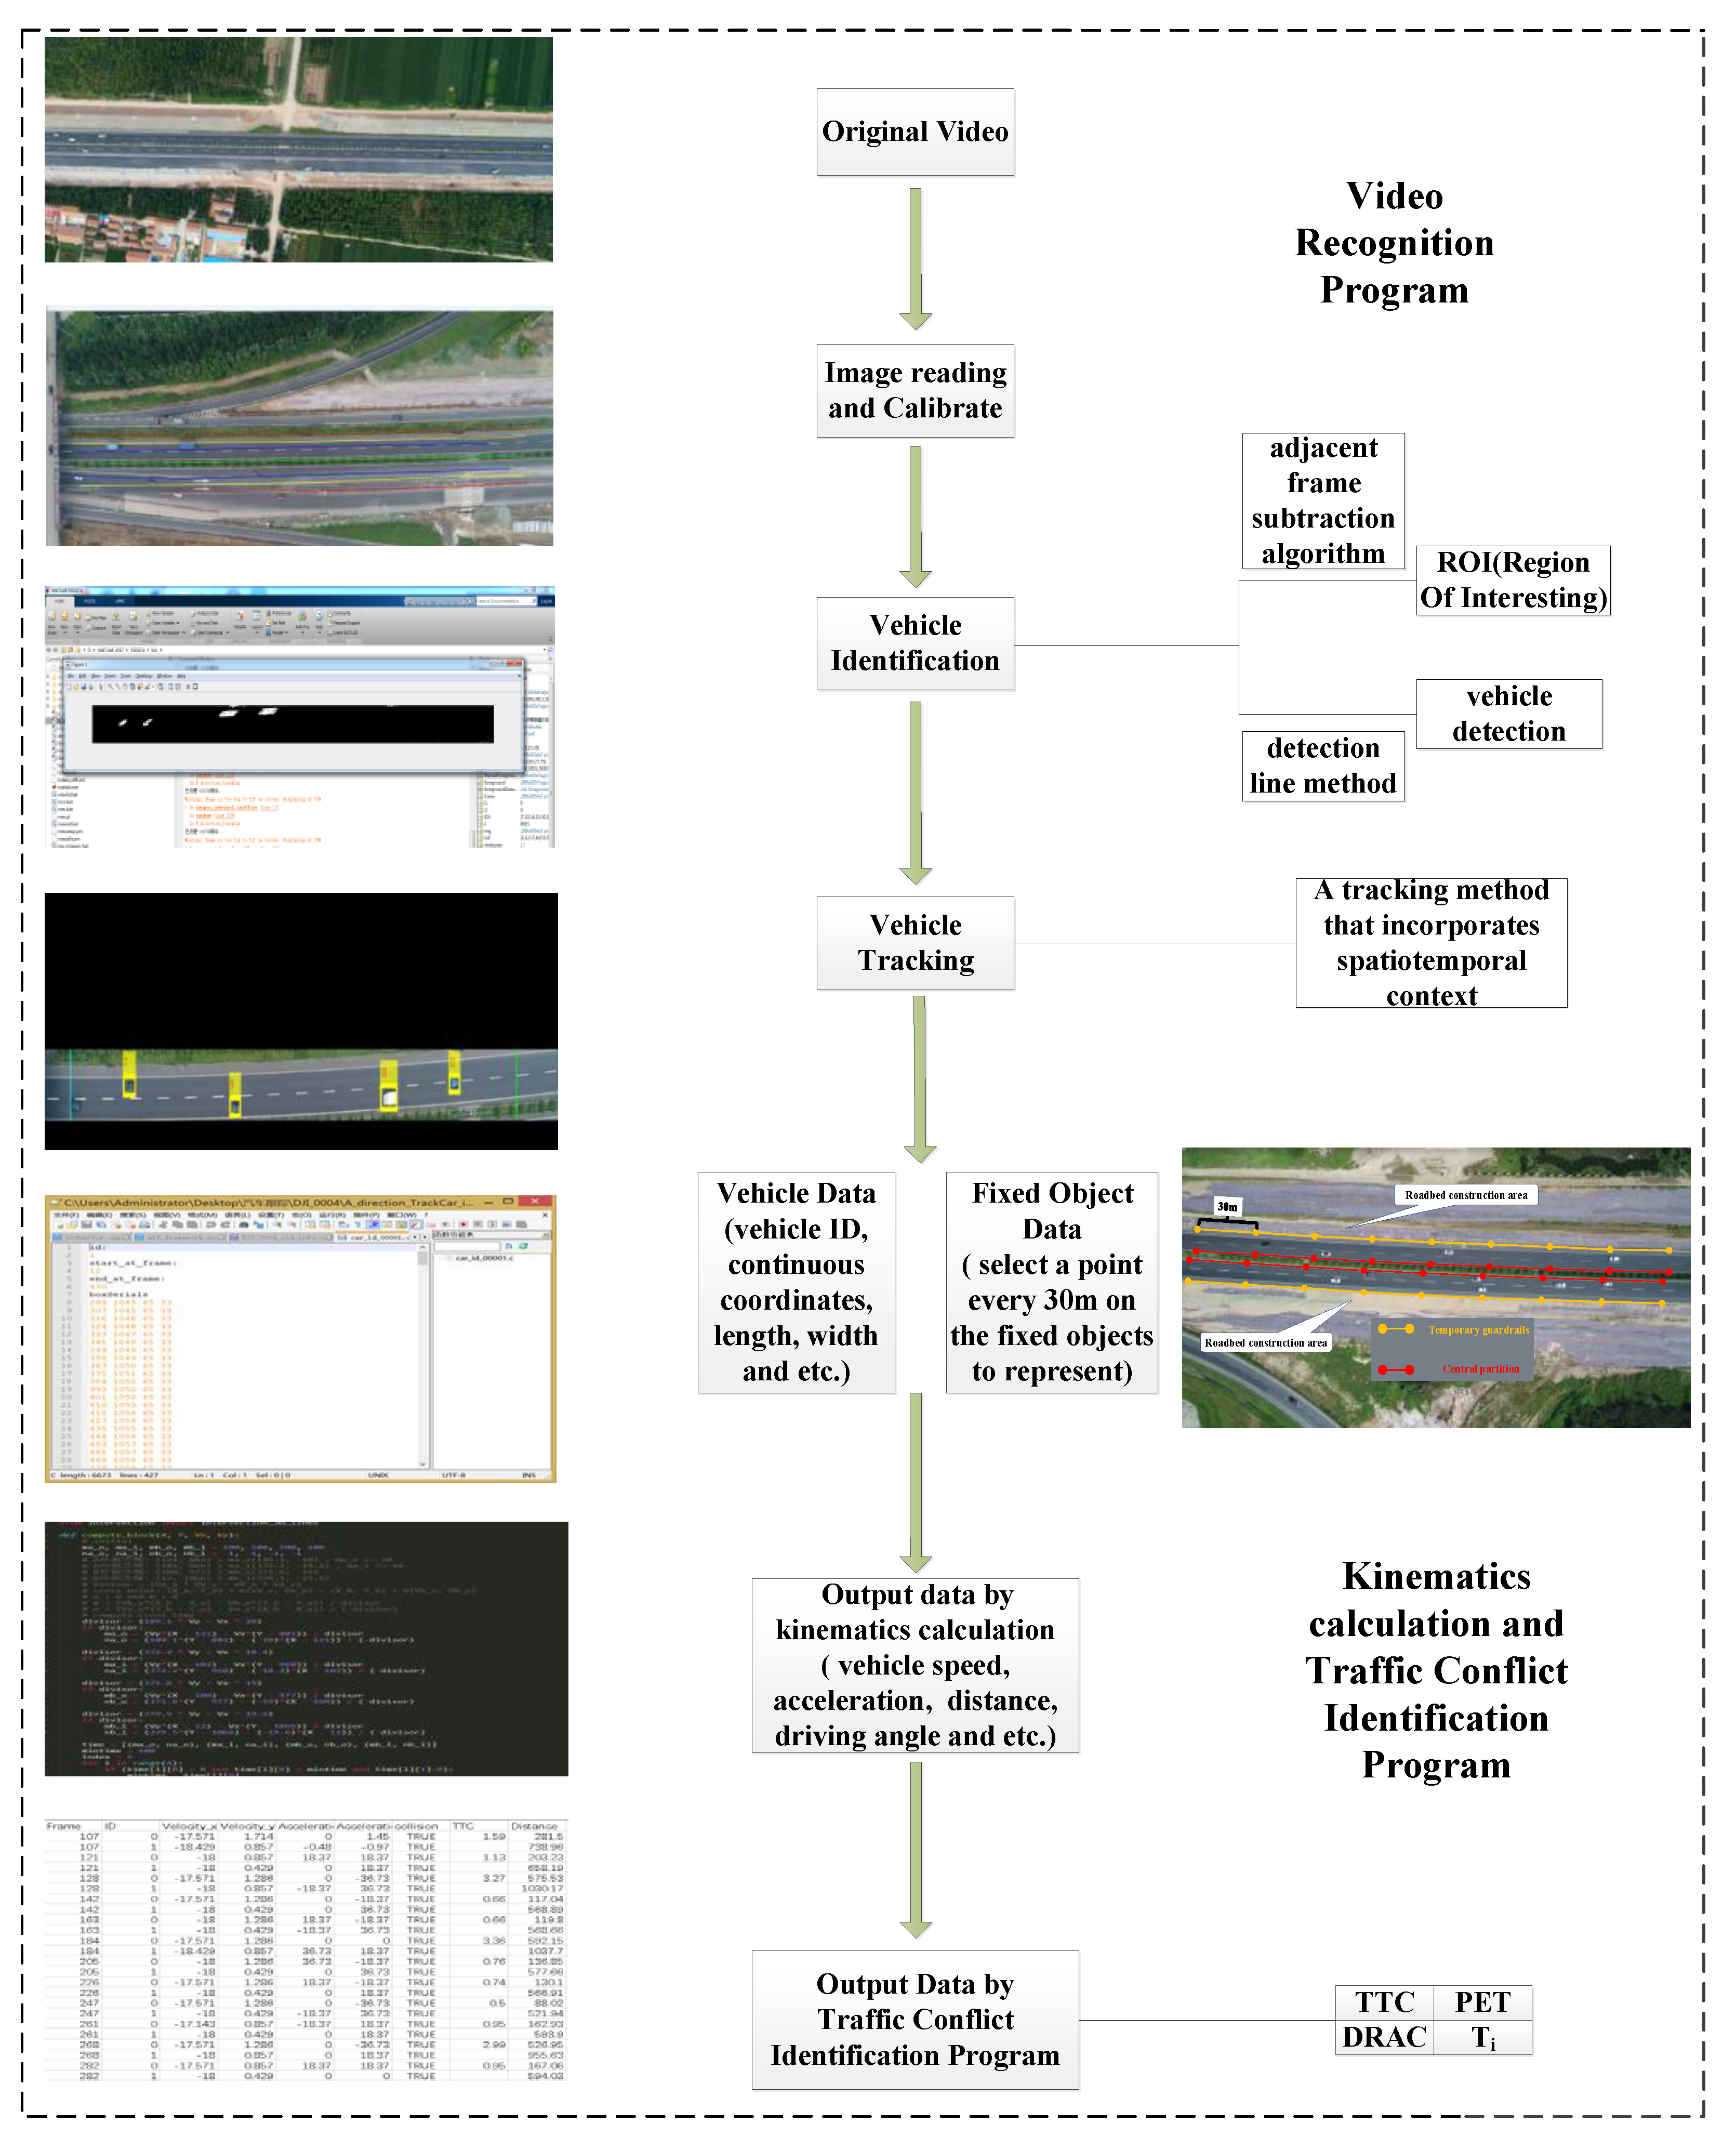
3.3. Video Recognition and Conflict Identification Processes

After shooting the video, the next step is to identify the conflicts using video recognition and conflict identification. The specific process is as shown in Figure 3.
Video recognition process
Image reading and calibration. Owing to the changes in airflow at high altitude as well as operational issues, the videos captured by the UAV shook slightly, such that the subsequent images gradually deviated from the original image. Therefore, it was necessary to match the subsequent images to the frame of the first image as a reference. A relative coordinate system was established based on the obvious fixed markers (roads or lane lines) in the first image of each video. Operations such as rotation were carried out based on the affine transformation relationship between the image frames, and the subsequent images were calibrated with the first image to eliminate the possible effect of lens shake as much as possible.
Vehicle identification. Vehicle identification includes region of interest (ROI) extraction and vehicle detection. Based on the characteristics of the Jinan-Qingdao Highway with many large vehicles being driven at high speeds, relatively frequent vehicle diverging and merging, in a dusty environment with relatively low visibility, an adjacent frame subtraction algorithm was adopted as the ROI extraction method. Compared with the background frame subtraction algorithm, this method has an advantage in that moving objects can be detected well when the background changes, its calculation is simple, and the method is not easily affected by changes in ambient light. However, it is easy for this method to fail in the detection of moving objects at a low speed (although there are almost no slow vehicles on the highway). These characteristics make the adjacent frame subtraction method more suitable for this research. For vehicle detection, the detection line method was adopted owing to its simplicity, efficiency, and compatibility with the highway traffic scene.
Vehicle tracking. Current vehicle tracking methods can be categorized roughly into region-based methods, dynamic contour-based methods, and feature-based methods. The region-based tracking methods work better when the number of vehicles is small [3], the dynamic contour-based tracking methods have a poor effect in the presence of shadows and road congestion [4], while the feature-based methods require stable images despite its relatively high accuracy. The number of feature points continues to decrease during the tracking process, and the feature points need to be re-searched at regular intervals. The tracking effect of feature point matching is not ideal. Taking into consideration the actual characteristics of the Jinan-Qingdao Highway, a tracking method that incorporates spatiotemporal context was selected [5]. This method obtains the optimal target position by maximizing the target position likelihood function, and it uses fast Fourier transform for learning. Compared with other mainstream methods, this method is more accurate and reliable and is considered more effective in implementation.
Result output. Each vehicle is identified and tracked according to the above procedure, and real-time continuous trajectory coordinates (X/Y), vehicle length and width, vehicle ID, etc. of all vehicles in the area are output.
Fixed object data. As shown in Figure 4, the fixed objects include the guardrails and central partition. Since the coordinates of the fixed objects are lacking in the video recognition, we take a manual marking method to select a point every 30 m on the fixed objects. Each point is connected by a straight line. Then we use the PICPICK software to obtain the coordinates of the points to represent the position data of the fixed objects.
Recognition rate and identification accuracy verification
Recognition rate verification. For verification, a total of 148 min of video that was shot at randomly selected locations K51 + 500, K52 + 200, K112 + 500, K131 + 500, and K133 + 500 was used. From data analysis, it was found that the video recognition software identified 1429 vehicles in total, and continuously tracked 1370 vehicles, while a total of 1536 vehicles were observed with the manual observation. Therefore, the initial successful recognition rate is about 93.0%, and the continuous tracking rate is about 89.2%. The specific data are as shown in Table 4.
Identification accuracy verification. As shown in Figure 5, all the highway lane lines (white dotted line) in China are 6 m long, and the distance between adjacent segments of the dotted line is 9 m. Therefore, the accuracy and reliability of the video recognition program can be assessed using this reference.
Five hundred vehicles appeared in the videos taken at locations, and K51 + 500, K52 + 200, K112 + 500, K131 + 500, and K133 + 500 are randomly selected, and their displacements in the X/Y axes within 2 s and corresponding coordinates are recorded. At the same time, the location of each vehicle in the video is manually marked for comparison using the software PicPick. From the comparison, it was found that 6.2% of the trajectory errors are less than 0.3 m, 23.5% are less than 0.5 m, 48.7% are less than 0.7 m, and 84.5% are less than 1 m. In general, most of the trajectory errors can be controlled within 1 m.
Conflict identification
The TTC was calculated according to the conventional definition. For vehicles encountering conflicts during lane change in angle, this definition requires that the shape of the vehicle be considered and that the x and y coordinates be decomposed before calculation. This is illustrated in Figure 6.
The formula is as follows.
T T C n = { n u l l , S n ( l n 1 B n cos θ ) v n x v ( n 1 ) x > L n y v n y or L n y v n y < S n + B n cos θ v n x v ( n 1 ) x   L n y v n y , S n ( l n 1 B n cos θ ) v n x v ( n 1 ) x < L n y v n y < S n + B n cos θ v n x v ( n 1 ) x
where v n x is the x-axis component of the instantaneous speed of the n vehicle, v n y is the y-axis component of the instantaneous speed of the n vehicle, S n is the headway between the n-th vehicle and the n − 1 vehicle in the x-direction, l n 1 is the length of the n − 1 vehicle, B n is the width of the n vehicle, θ is the angle between the speeds of the two vehicles, L n y is the distance between the n vehicle and the n − 1 vehicle in the y-axis direction.
The PET is calculated according to its conventional definition. In actual operation, the following two situations may occur simultaneously. The same two vehicles result in a relatively large PET in a certain common area, indicating low risk, but a relatively small PET in a different common area, indicating high risk. In other words, the value of the PET between the two vehicles changes with the location of the common area, causing the potential conflict risk to change correspondingly. Therefore, the use of only one cross section cannot accurately describe the operation status and potential conflict risk of the entire road segment. Nevertheless, incorporating too many common areas leads to a huge computation cost. To solve this problem, each target road segment is divided into 10 cross sections perpendicular to the road, and these are set as the common areas.
DRAC is calculated according to its conventional definition, and its principles and assumptions are essentially the same as those of TTC.
The improved indicator Ti is calculated according to the formula of Ti in Section 4.
For indicators such as TTC and Ti, which are continuous, once the value is below a certain threshold, a serious conflict is recorded once. When the value increases above the threshold and decreases again to below the threshold, another serious conflict is recorded. This is as shown in Figure 7.
Since almost no one used conventional indicators to study vehicle-fixed object conflicts before, there is no vehicle-fixed object conflicts calculation formula for TTC, PET, and DRAC in this article.

3.4. Accident Data Collection

The accident data are provided by the local traffic police, road administration department, and Shandong Hi-Speed Group. The data include the time of accident occurrence, the location of the accident occurrence, the vehicle type, the type of accident (rear-end/roll over/vehicle-fixed objects such as temporary roadside guardrails, central partition guardrails, etc.), weather, degree of severity, number of deaths/injuries, and damage to road furniture/features. Table 5 shows some of the traffic accident data.
At the same time, in order to meet the required data sample size (If only the accident data from 20 August to 8 September 2017 is collected during the time period of video data, the amount of accident data is too small), an attempt is made to ensure that the accident data selected occurs within a certain time period around when the conflict data is collected. The conflict data were collected from November 2016 to November 2017, when the road segment was still in the first stage of reconstruction and expansion, and the main work was construction of the roadbed on both sides. At this stage, factors such as traffic volume, traffic composition, lateral clearance, and traffic organization changed very little. In addition, only accident data within a 5 km range before and after the target road segment was used. For example, as shown in Table 3 Segment 1 (video location K51/K52), the range of the collected accident data is K45–K55. In Table 3 Segment 2 (video location K57/K58), the range of the collected accident data is K55–K65.
The overall statistics are as follows:
The number of accidents between vehicles and fixed objects (hit against temporary roadside guardrails/central partition guardrails) accounted for 22% of the total number of accidents, and the number of accidents between vehicles accounted for 78% (Figure 8a). The financial losses caused by vehicle and fixed object accidents accounted for 27% (Figure 8b). It can be seen that the proportion of vehicle-fixed object accidents in the highway is not small, and the consequences are serious. This is in line with our research purpose—the vehicle-fixed object conflict in the highway needs to be studied.

4. Methods

The method used is shown as a flowchart in Figure 9.

4.1. Definition and Calculation of Improved Conflict Indicator Ti

From the above literature review, it can be seen that there are currently three problems with conflict indicators. While the TTC indicator often fails to identify lane change conflicts, it clearly defines the rear-end risk. The PET indicator easily misjudges rear-end conflicts, as even when the speed of the rear car is slower than that of the front car, the PET value will also be generated. In addition, although it is easy to calculate the PET, the intermediate microscopic process is missing (only the time difference between the vehicles passing through the common area is necessary), making it impossible to know whether the conflict risk changes continuously.
Based on the characteristics of the above indicators and inspired by the idea reported by T2, this study builds on their advantages to define a new improved traffic conflict indicator called Ti. According to the video recognition and the conflict identification program, it is judged whether it is a rear-end conflict or a lane change conflict based on the current direction angle of the two conflict vehicles. Then, if the current direction of the vehicle intersects with the road fixed objects, it is regarded as a vehicle-fixed objects conflict. The specific definition and calculation of Ti are as follows:
Ti (rear-end conflict)
In the case of an rear-end conflict, the Ti indicator has the same definition as the TTC indicator, and the problem with the PET indicator does not occur. In other words, when the speed of the rear vehicle is slower than the speed of the front vehicle, there will be no conflict according to this indicator.
Ti (lane change conflict)
In the case of a lane change conflict, the Ti indicator combines the characteristics of PET (common area) and takes the intersection of the current driving directions of the two vehicles as the potential conflict point. Thus, a Ti value is generated when the two vehicles change lanes, and the potential risk due to lane change conflict is not neglected, as with the conventional TTC definition. Moreover, the conflict risk information with Ti is more abundant than PET because of calculation all the time based on continuous trajectory data.
Judge whether rear-end or lane change conflict
First of all, we can obtain the current driving direction of the vehicle through the continuous coordinate data of the vehicle, and then judge whether it is a rear-end conflict or a lane change conflict according to the angle θ between the driving directions of the two vehicles, shown in Figure 10. In theory, an angle θ of 0° is a rear-end conflict, and an angle θ of 0–90° is a lane change conflict. However, according to the actual data accuracy error, when we are processing the data, we define θ at 0–2° as a rear-end conflict and θ at 2–90° as a lane change conflict. See the figure below for details.
Ti (vehicle-fixed objects conflict)
Considering that vehicles may have a conflict or accident with fixed objects in the highways (such as temporary roadside guardrails, central partition guardrails, etc.), cases involving contact between vehicles and fixed objects has been included.
The line on the right shows the fixed objects on the roadside, and the conflict point is the intersection between the extension line of the vehicle’s driving direction at the current moment and the fixed objects.
The definition and calculation are shown in Figure 11.

4.2. Conflict and Accident Rates in Correlation Analysis

To exclude the influence of other factors, we use the conflict and accident rates to calculate Pearson correlation for the 10 segments in Table 3.
Serious conflict rates
The formula is as follows:
r c = 1 n C i / q i L i n
where r c is serious conflict rate of segments, C i is total number of serious conflicts identified during sampling period at location of capture i (based on every threshold), q i is through-traffic volume during the sampling period at location of capture I (2 h of morning and 2 h of evening peak at each location of capture), L i is the length of the i location of capture, n is number of locations of caption included in each segments(e.g., Segment 1 in Table 3 contains two locations of caption, K51 + 500 and K52 + 200).
Accident rates
Statistics on historical accident data for a total of 10 km, approximately 5 km before and after each capture locations of the road. (Segment 1: K45–K55, Segment 2: K55–K65, Segment 3: K110–K120, Segment 4: K125–K135, Segment 5: K180–K190, Segment 6: K190–K200, Segment 7: K250–K260, Segment 8: K260–K270, Segment 9: K270–K280, Segment 10. K280–K290).
To calculate the road accident rate, the formula is as follows:
r a = A n q n
where r a is accident rate of the segments, A n is the total number of accidents each segment (November 2016–November 2017), q n is average daily traffic during the sampling period at each segment (November 2016–November 2017).
In addition, considering that other conflict indicators do not consider vehicle-fixed object conflicts, vehicle-vehicle and vehicle-fixed object conflict-accident correlation are considered separately, and only Ti performs vehicle-fixed object correlation analysis.
Pearson correlation formula
This article uses Pearson correlation analysis, and the calculation formula of the correlation coefficient is as follows:
r x y = i = 1 n ( x i x ˉ ) ( y i y ˉ ) ( i = 1 n x i x ˉ ) 2 i = 1 n y i y ˉ ) 2
In the formula, x ¯ , y ¯ are the mean values of the variables x and y respectively, x i and y i are the i-th observation of variables x and y respectively.

5. Results

Calculation of serious conflict-accident correlation at different thresholds for each indicator are as follows:

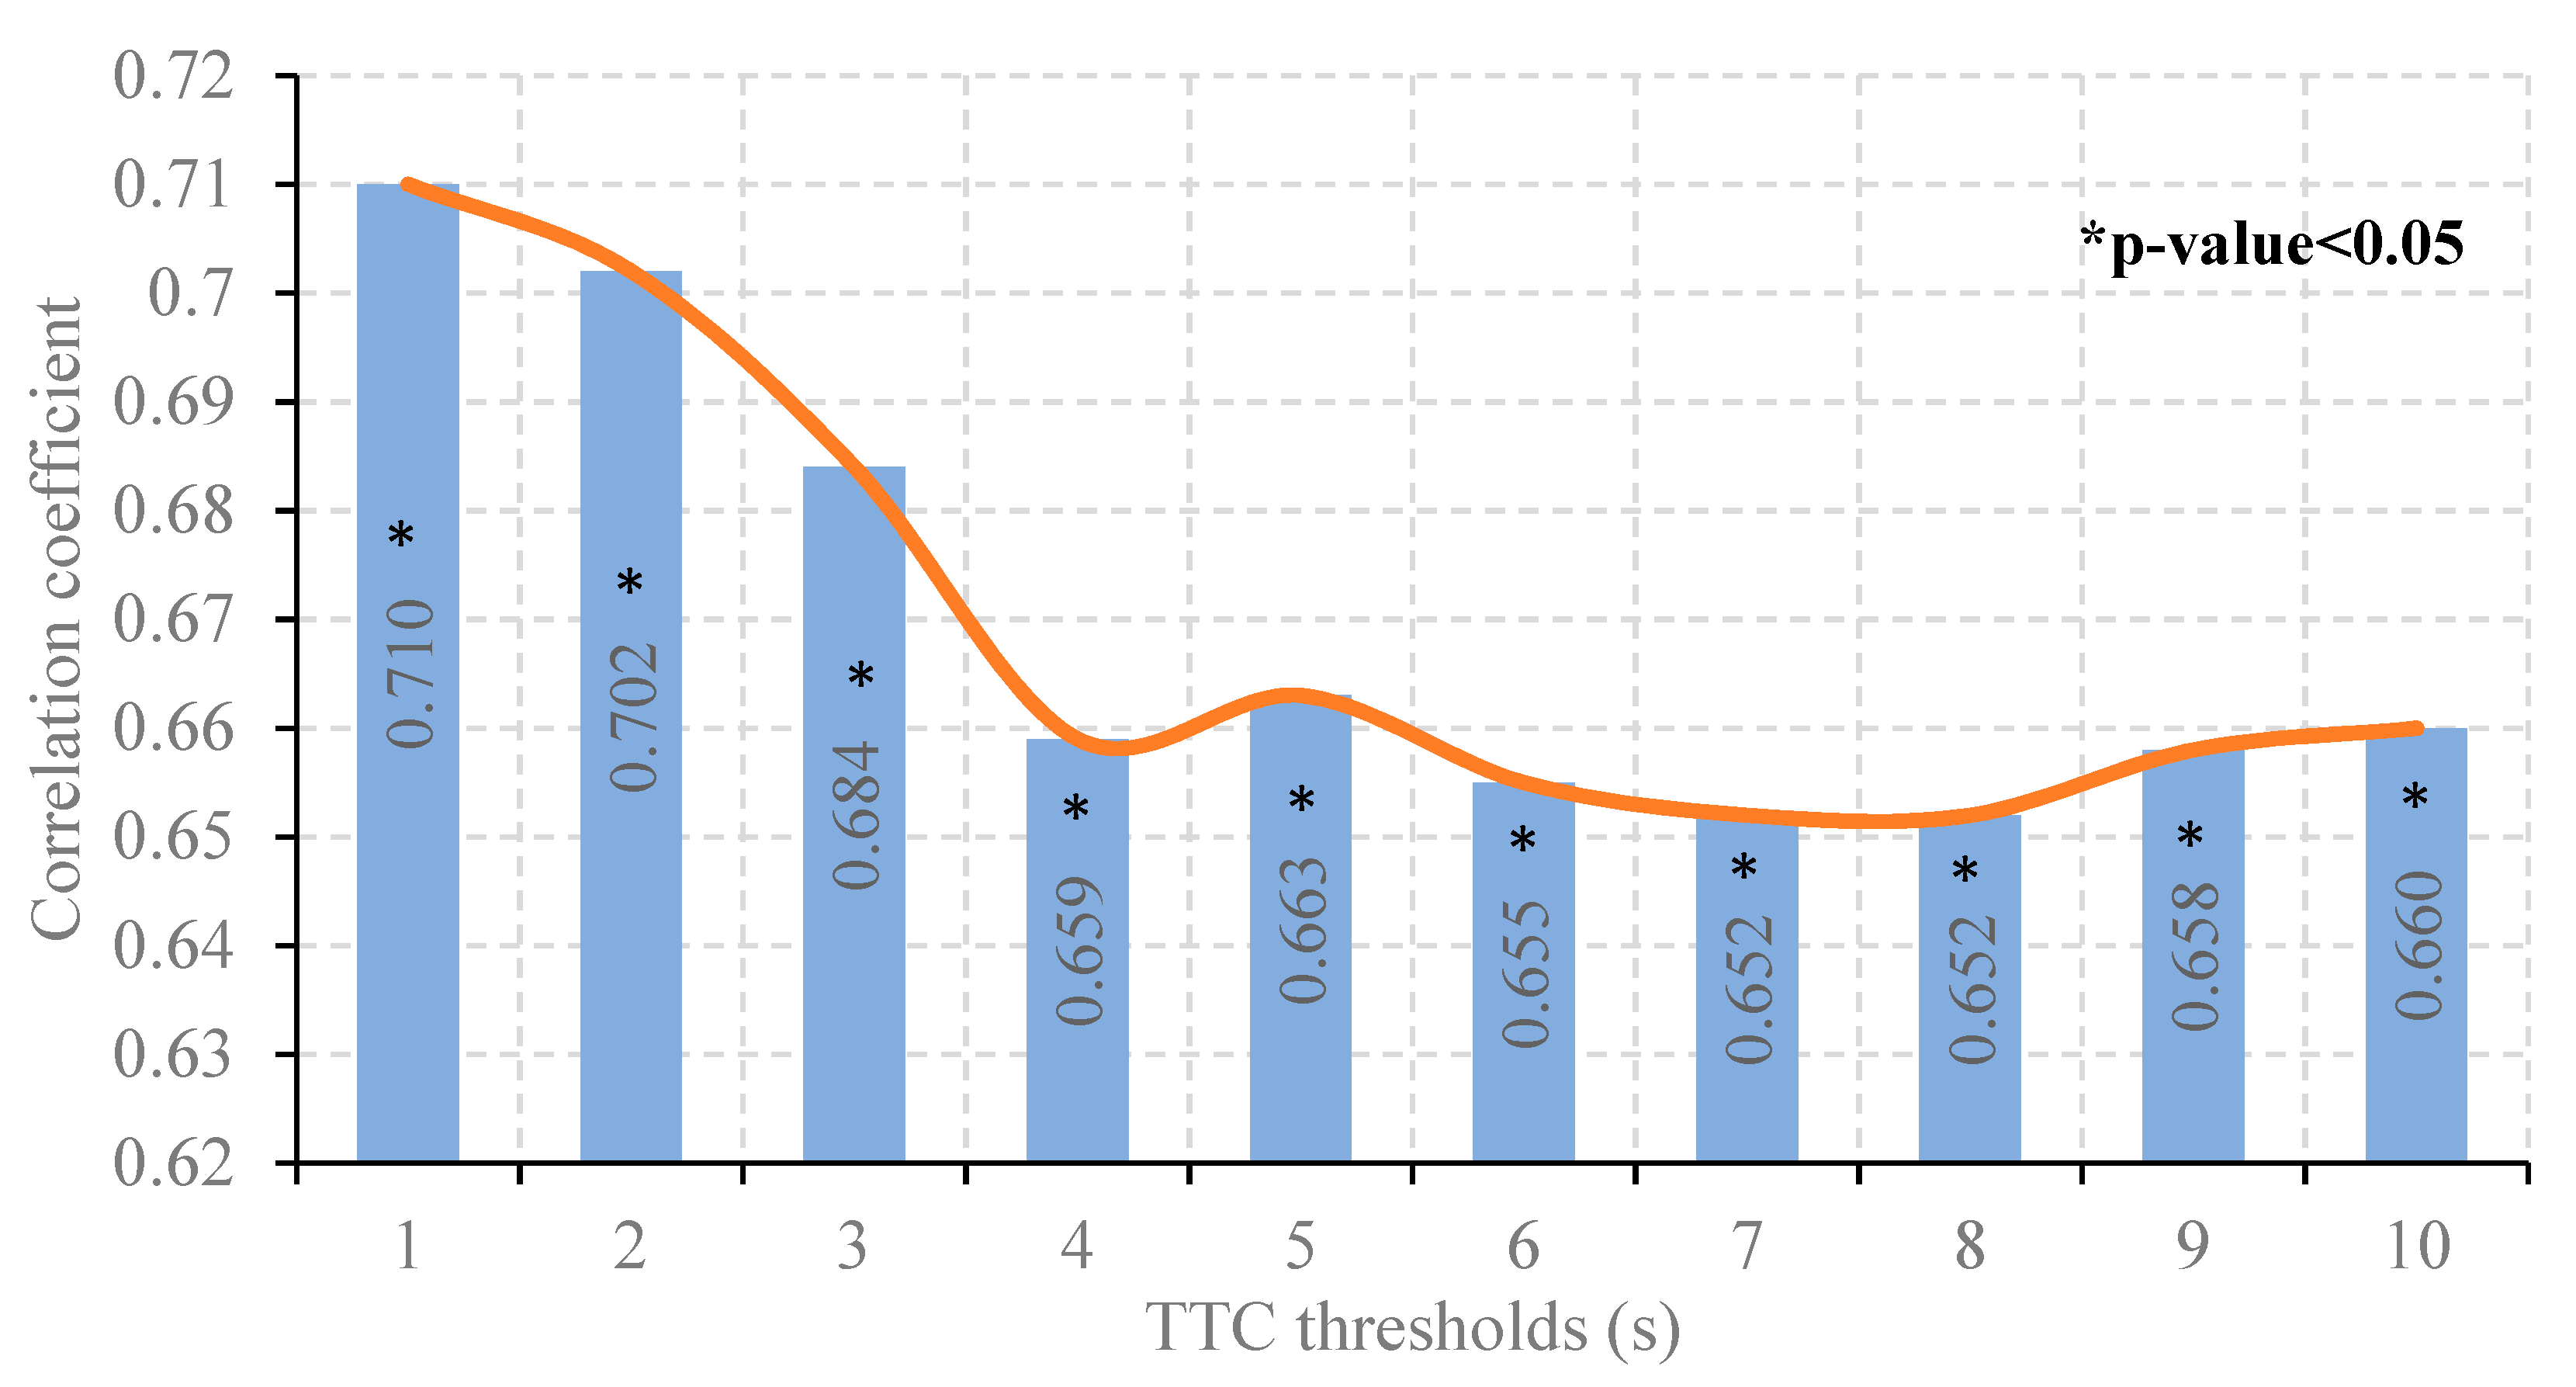
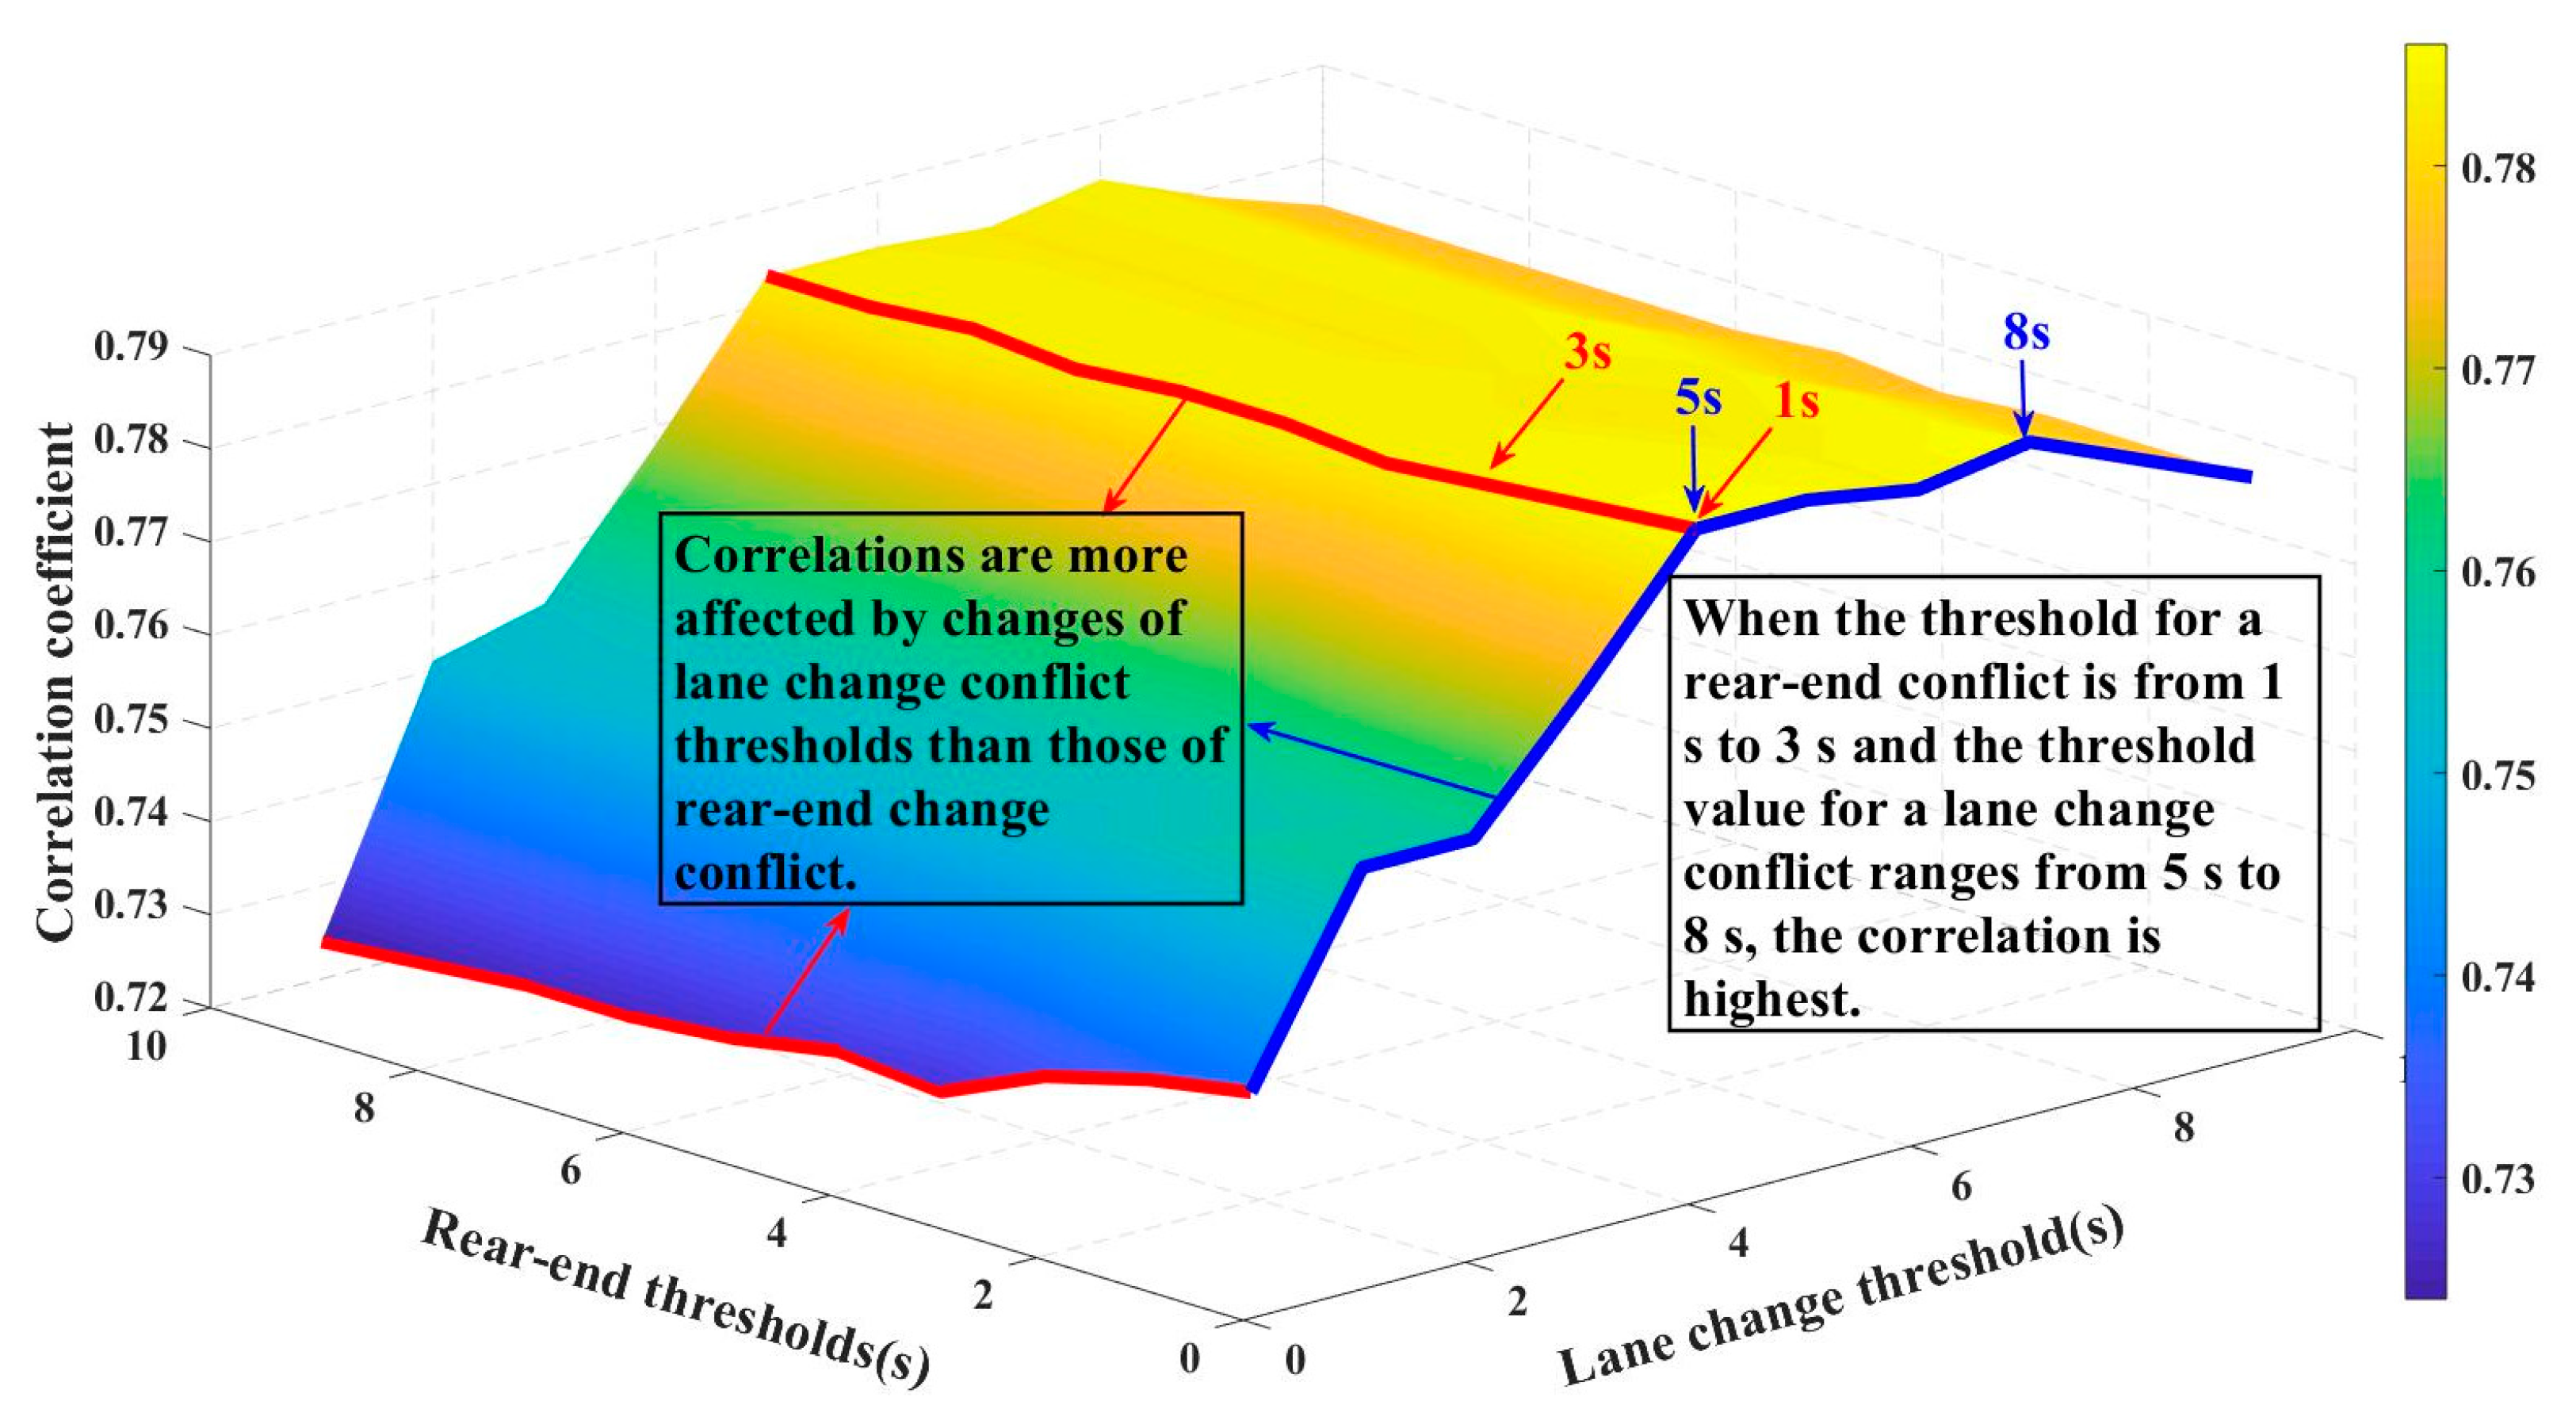
5.1. Conflict-Accident Correlation at Different Thresholds for Each Indicator

TTC
TTC is used as the traffic conflict indicator, and the correlation between the serious conflict rate and the accident rate with different threshold values for each road segment is compared. The results are shown in Figure 12. For threshold values ranging from 1 s to 10 s, the correlation decreases with increase in the threshold value, stabilizes at 4 s and above, and the highest correlation occurs when the threshold value is 1 s. This phenomenon shows that the reliability of identifying the risk of traffic conflicts is low when the TTC indicator is at a high threshold.
Theoretically, this phenomenon occurs because all conflicts that are detected are close to collisions when the TTC threshold is infinitely small. If a sufficient amount of accurate data is used, all collision accidents can be identified, such that the correlation between the serious collision rate and the accident rate becomes close to 1. Conversely, when the TTC threshold is assumed to be infinitely large, although all collisions can be identified, many traffic conflicts with almost no actual risk (for example, TTC 20 s) are also included because the threshold is too high, which will reduce the correlation between the serious collision rate and the accident rate. In summary, the smaller the threshold value, the higher the ability of TTC to identify traffic accidents.
PET
PET is used as the traffic conflict indicator, and the correlation between the serious conflict rate and the accident rate with different threshold values for each road segment is compared. The results are shown in Figure 13. For threshold values ranging from 1 s to 20 s, the correlation gradually increases with the increase of the threshold value, reaching a maximum after 8–10 s. This phenomenon shows that the PET indicator has a relatively good reliability in terms of identifying the risk of traffic conflicts with a high threshold, but the growth in correlation slows down after reaching a certain threshold value.
The reason for this diametrically opposite phenomenon compared with that of TTC may be because PET obtains cross-sectional observation data, unlike TTC, which obtains a continuous value (supported by continuous trajectory data). As mentioned in the literature review, the cross-sectional observation values only reflect the risk when passing through the corresponding cross-section during the process of conflict, neglecting the complete evolution of the traffic conflict with less risk information; thus, a higher threshold value is required to include enough data.
DRAC
Here DRAC is used as the traffic conflict indicator, and the correlation between the serious conflict rate and the accident rate with different threshold values for each road segment is compared. The results are shown in Figure 14. Within the range of 1–10 m/s2, the correlation increases with the increase of the threshold value, and the highest correlation occurs at a threshold value of 10 m/s2.
The reason for this phenomenon is similar to that of TTC because the principles and assumptions of DRAC are basically the same as those of TTC. When a traffic conflict occurs, the vehicle needs to decelerate within a short period of time to avoid the traffic conflict. The more serious the traffic conflict, the higher the vehicle deceleration required to ensure safety. When DRAC is infinitely large, the detected conflict at this time is close to the collision. Therefore, the higher the threshold value, the greater the ability of DRAC to identify traffic accidents.
Ti
Because the Ti indicator combines the definitions and calculation methods for three types of traffic conflicts (rear-end collision, lane change conflict, and vehicle-fixed object conflict), it is necessary to set different thresholds for the different types of traffic conflicts when verifying the correlation.
The correlation between the serious conflict rates and the accident rates for each road segment with different rear-end collision thresholds (under the average of each lane change conflict threshold) of Ti indicator is compared. The results are shown in Figure 15. From 1 s to 10 s, the correlation decreases with the increase of the threshold value, and it stabilizes at 6 s, with the highest correlation occurring at a threshold value of 1 s. Because the calculation formula for Ti is consistent with that for TTC in the case of rear-end collision, the trends are similar.
The correlation between the serious conflict rate and the accident rate for each road segment with different lane change conflict thresholds (under the average of each rear-end conflict threshold) of Ti indicator is compared. The results are shown in Figure 16. From 1 s to 5 s, the correlation increases with the increase of the threshold value, and it stabilizes at 5 s, and then decreases. Therefore, the optimal threshold value can be set as 5 s.
The results of correlation coefficient with different combinations of thresholds for rear-end and lane change conflict of Ti are shown in Figure 17: when the threshold for a rear-end conflict is from 1 s to 3 s and the threshold value for a lane change conflict ranges from 5 s to 8 s, the correlation is highest.
Using Ti as the traffic conflict indicator, for each road segment with different threshold values, the correlation between the serious conflict rate with fixed objects and the accident rate with fixed objects is compared. The results are shown in Figure 18. From 1 s to 10 s, the correlation first increases and then decreases as the threshold value increases. The highest correlation at a threshold of 0.704 occurs at 5 s.

5.2. Comparison of Various Indicators

For comparison with other indicators, the Ti indicator with the same threshold value of the rear-end conflict and lane change conflict is chosen. The result is shown in Figure 19. The highest value of the conflict-accident correlation with different threshold values among the four indicators is 0.784, which is obtained when the Ti indicator has a threshold value of 5 s. The average value of the conflict-accident correlation with different threshold values of the four indicators is 0.771 for Ti, 0.670 for TTC, 0.669 for PET, and 0.710 for DRAC. The average value of the conflict-accident correlation of Ti indicator is significantly higher than that of the other three indicators. Therefore, with the target conditions of this study, the Ti indicator is better than the conventional TTC, PET, and DRAC indicators, as it can truly reflect the traffic risks in the Jinan-Qingdao Highway better.

6. Discussion

6.1. Case Analysis

Scenario 1 (lane change conflict):
Where V l X is the speed in the y-axis direction of the leading vehicle, V l Y is the speed in the x-axis direction of the leading vehicle, V f X is the speed in the x-axis direction of the following vehicle.
Scenario 1 (Figure 20) show a possible lane change conflict. Based on the TTC definition, the velocity of the lane-changing vehicle is decomposed into its x and y components, and calculations are carried out to determine whether it will collide with vf (also decomposed into x and y components). DRAC is similar too.
In this case, it was found that the two vehicles do not collide (in x and y axes) with TTC-based calculation (1). As shown in Figure 20a, two vehicles (N and N-1) with dashed line did not create conflict point and collide. However, a Ti value can be obtained according to the Ti definition for lane change conflict as shown in Figure 20b. It shows that Ti can better identify the risk of lane change conflict compared with TTC.
Scenario 2 and Scenarios 3 (rear-end conflict):
Where V l is the speed of the leading vehicle, V f is the speed of the following vehicle.
Scenarios 2 and 3 (Figure 21) show the vehicle following situation at a certain time. According to the definition of PET, its value is the time difference between the leading and following vehicles passing through the common area. In scenario 2, the speed of the following vehicle is slower than leading vehicle ( V f = 76 km/h < V l = 79 km/h). In this scenario, no conflict is expected, but a PET value will still be generated (PET = 1.89 s in this scenario). This shows that PET leads to invalid values in some scenarios (actually, a safe situation in scenario 2). In scenario 3, the speed of leading vehicle V l = 73 km/h and the speed of the following vehicle V f = 76 km/h; PET = 1.85 s in this scenario. Considering scenarios 2 and 3, it can be seen that, to obtain the PET value, only the time difference between the two vehicles passing through the common area needs to be calculated, while other microscopic data (such as leading and following vehicle speeds, acceleration, etc.) are not required. As a result, there is too little information available. As shown in the above example, the two PET values are almost the same, but the actual risks of vehicle rear-end conflict differs in the two scenarios (the former scenario has no risk).
Where V l is the speed of the leading vehicle, V f is the speed of the following vehicle.
In the same example, the Ti indicator is used to identify and find that there is no conflict risk under scenario 2 as the following vehicle is slower than the leading vehicle based on Ti definition and calculation formula in Section 4.1 (Figure 22a). In scenario 3, the Ti value can be calculated according to the definition (Figure 22b).
Scenario 4 (vehicle-fixed object conflict)
Where V is the speed of the vehicle.
From scenario 4 (Figure 23), it can be seen that the Ti value for vehicle-fixed object conflict can be obtained using the definition of Ti on the conflict with fixed objects.

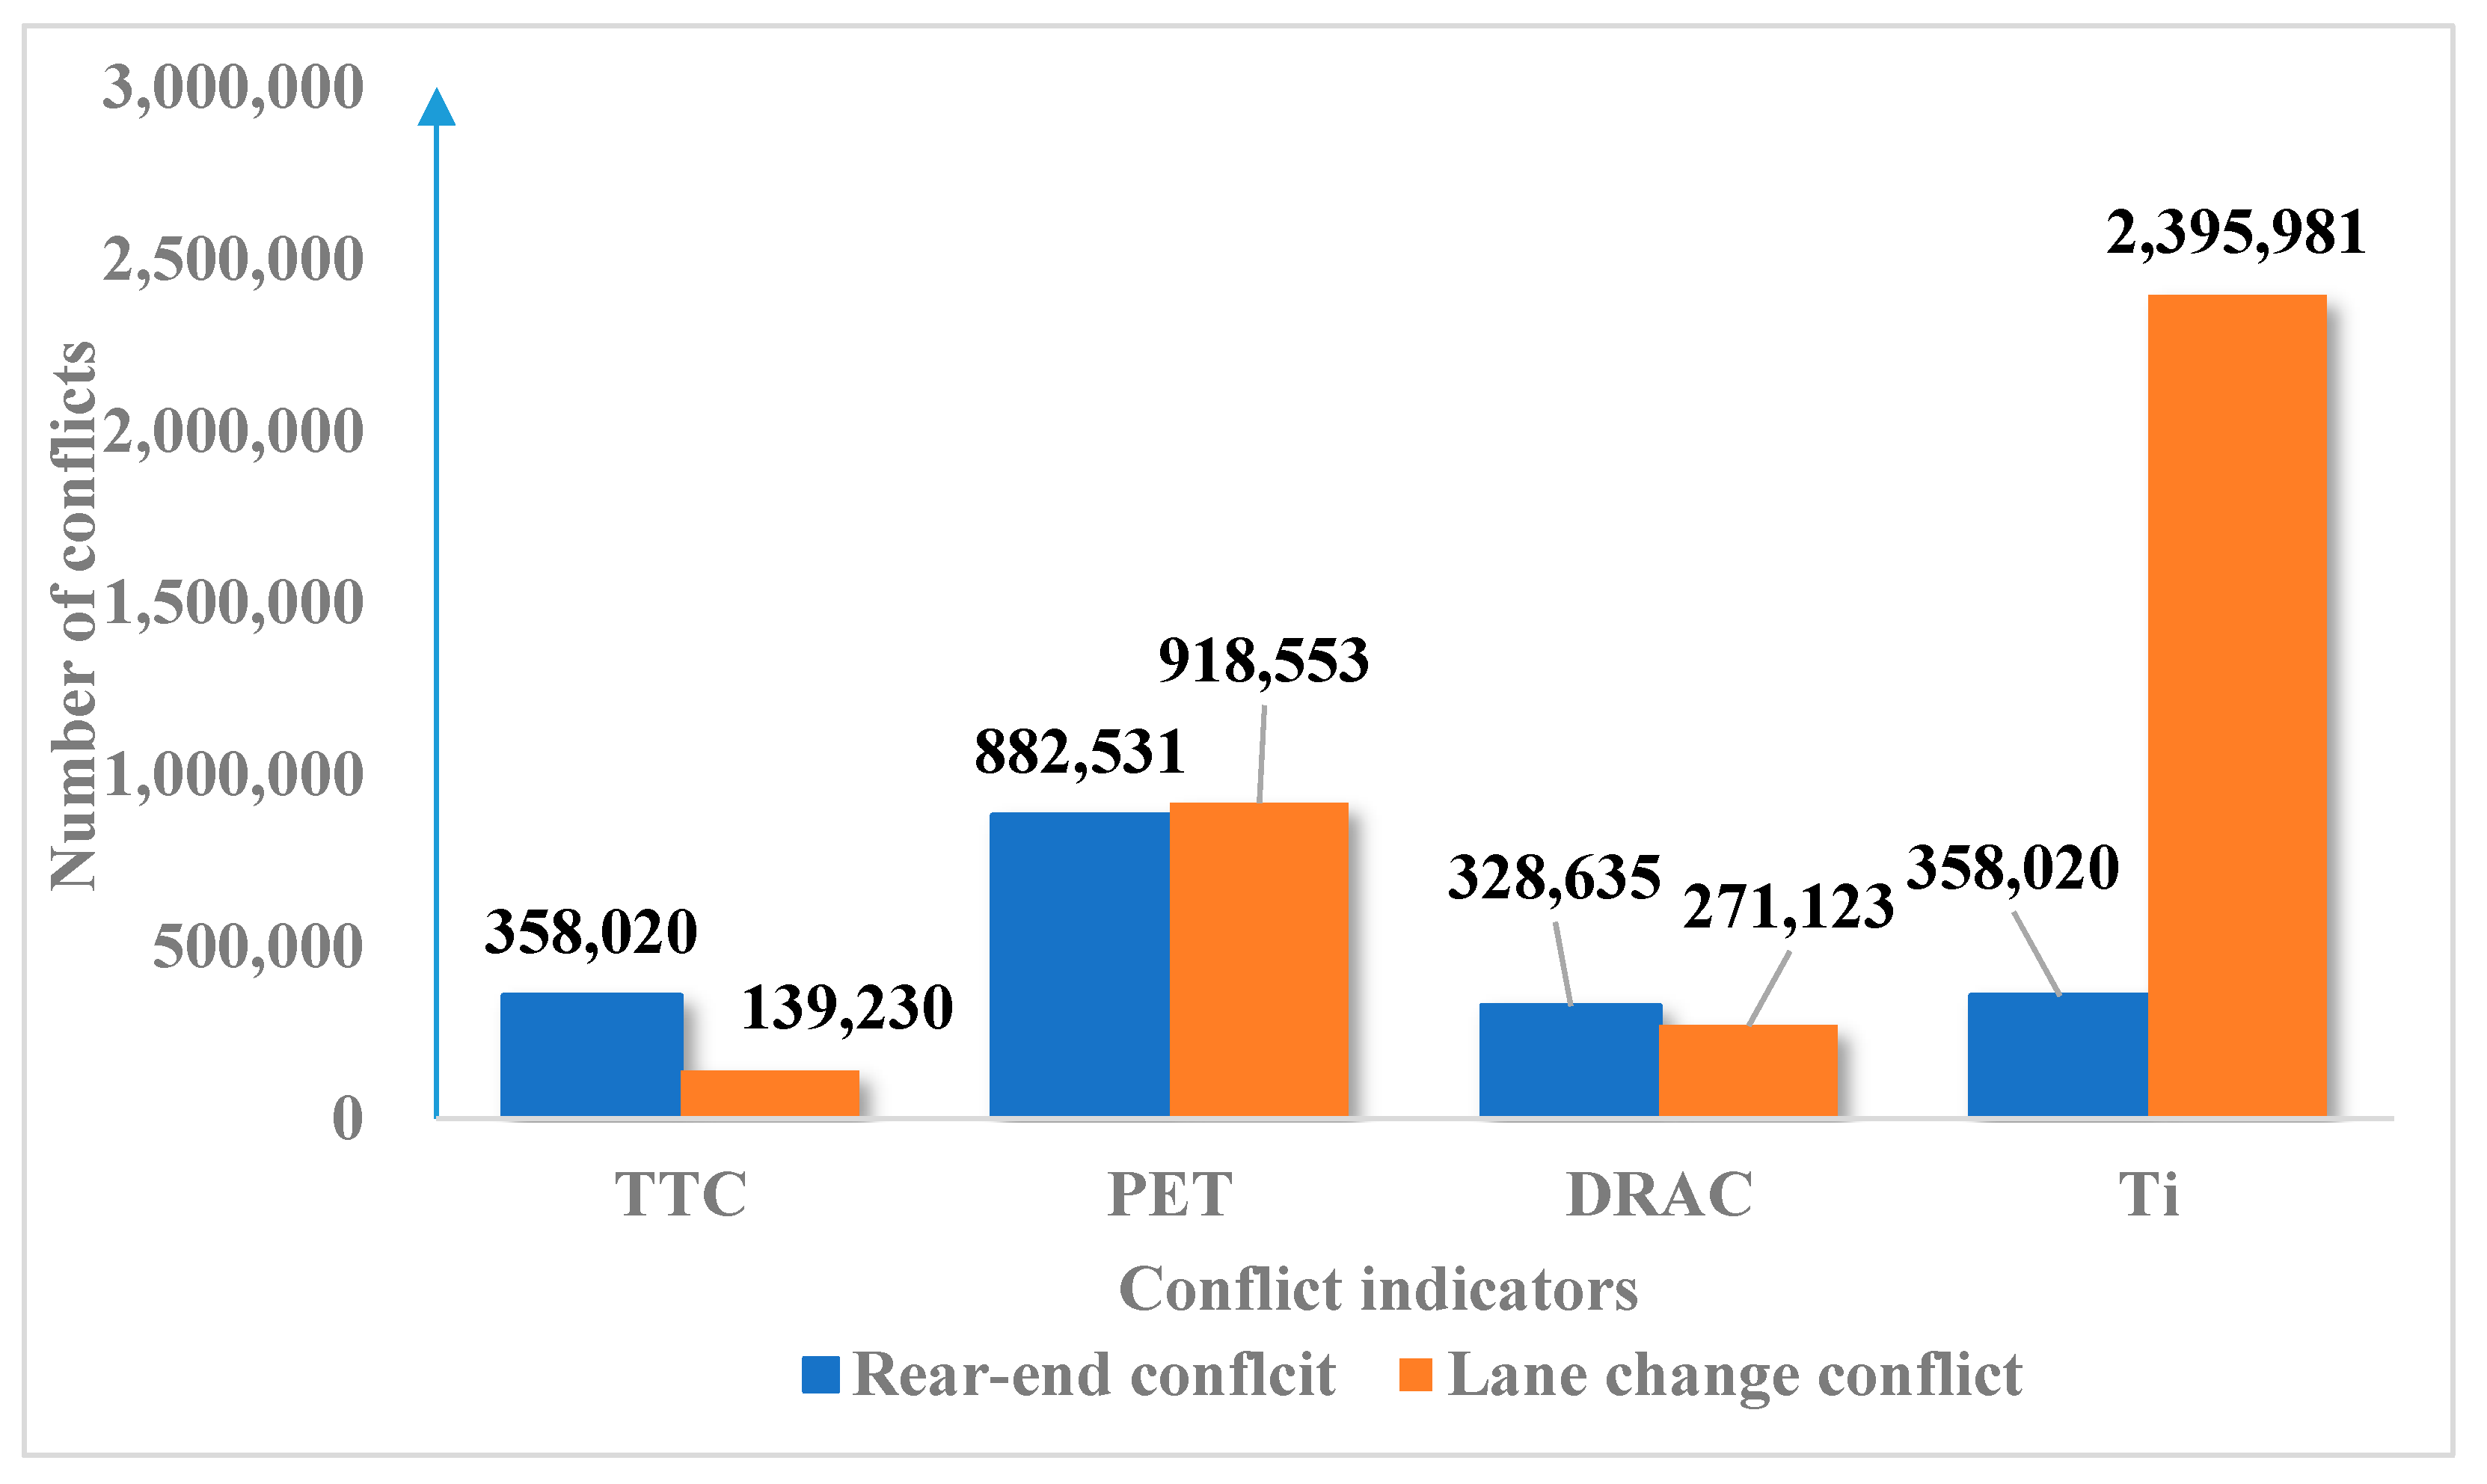
6.2. Proportion of Conflicts and Accidents Based on Various Indicators

The following figures show the proportion of conflict types based on various indicators and the actual accident types:
It can be seen from Figure 24 that compared with PET and Ti, TTC and DRAC has a weaker ability to recognize lane change conflicts, which is also in agreement with the characteristics of the TTC indicator itself. In contrast, Ti can identify most conflicts which consist of more lane change conflicts than other indicators. This may be the reason why the average value of the conflict-accident correlation of Ti indicator is significantly higher than that of the other three indicators.
At the same time, neither TTC nor PET nor DRAC indicators are used to identify vehicle-fixed object conflicts. It can be seen from Figure 8a and Figure 25 that in the actual accident data, the proportion of vehicle-fixed object accidents in the Jinan-Qingdao Highway reaches 78%, which is much higher than that of vehicle-vehicle accidents. Conventional indicators such as TTC and PET cannot identify conflicts between vehicle and fixed objects. The number of vehicle-fixed object conflicts identified by the Ti indicator accounts for 71% of the total number of conflicts, which is closer to the real situation. From the perspective of the type recognition rate, Ti can better identify vehicle-fixed object conflicts.
Overall, TTC and DRAC are prone to fail to identify many lane change conflicts, PET is prone to produce some misjudge for rear-end conflicts where the leading vehicle is faster, and PET is less informative than other indicators.
The improved Ti were both able to overcome the deficiencies of the TTC and PET extension indicators, so this may be the reason for their highest relevance. This phenomenon is also reflected in other papers, such as Wang et al. [15] who collected intersection conflict data by UAV and made predictions based on extreme value theory, and found that the predictive performance (compared with real accidents) of the recognition metrics under different types of conflicts (e.g., rear-end and lane change) was different. TA (similar to TTC) and PET combinations have nearly the highest correlation coefficients for real-end and lane change accidents, higher than single TTC, TA, PET, and DRAC. The study [12] proposes a bivariate extreme value model to integrate different traffic conflict indicators for road safety estimation, and the model is validated with actual crash data. Based on video data collected from four signalized intersections in two Canadian cities, computer vision techniques were utilized to identify rear-end traffic conflicts using several indicators. The results show that TTC&PET has the most accurate crash estimates.
It is seen that the combination of TTC and PET tends to identify traffic risks better. This paper is from the characteristics of TTC, PET and other indicators, improved indicators Ti to complement the shortcomings, so the accident correlation is stronger.

7. Conclusions

In this paper, multiple sections of continuous high-precision video of the Jinan-Qingdao highway are collected by high-altitude unmanned aerial vehicle. The vehicle trajectory data outputted from the video recognition are further obtained through each conflict indicator procedure to obtain the conflict data under different conflict indicators. Based on the advantages, disadvantages and applicability of the conventional indicators, an improved indicator Ti is proposed, which includes the definition and calculation of three types (rear-end, lane change and vehicle-fixed object conflict).
The results show that under the selected threshold range in this paper, TTC, PET and DRAC have the highest correlation when the threshold is 1 s, 8–10 s and 10 m/s2 respectively, and the improved indicator Ti has the highest correlation when the rear-end conflict threshold is 1–3 s, the lane change conflict threshold is 5–8 s and the vehicle-fixed object conflict threshold is 5 s. At the same time, the average values of accident correlation of the indicators under different thresholds are: Ti is 0.771, TTC is 0.670, PET is 0.669 and DRAC is 0.710. The average value of correlation of Ti indicators is obviously higher than the remaining three conventional indicators, which can better reflect the real traffic risk.
The findings of this study suggest that TTC and DRAC are prone to misjudge lane change conflicts, PET is prone to fail to identify rear-end conflicts where the leading vehicle is faster, and PET is less informative than other indicators. At the same time, none of these indicators take into account vehicle-fixed object conflicts. The improved Ti all overcome these deficiencies, so the Ti are relatively most relevant, and their safety evaluation capabilities are stronger.
It is noted that there are several limitations of this study. Due to practical reasons such as cost and other limitations, the conflict data were collected from a relatively small number of locations (18 in total) and for a relatively short period of time (2 h per location for the morning and evening peaks). It is not possible to correspond to the location and time of the accident data collection. Although we control for other variables to remain relatively stable by trying to ensure that the location and time period is as close as possible to that of the conflict data collection, there is still a more or less adverse effect. The solution to this problem would be to subsequently collect as much location and time range data on traffic conflicts and accidents as possible to make the correlation study more convincing. The ideal situation would be to collect continuous traffic conflict data for the whole period and the whole road. More data validation of other locations is needed.

Author Contributions

Conceptualization, R.J. and S.Z.; methodology, R.J.; software, H.C.; validation, H.C., J.W. and N.D.; formal analysis, N.D.; investigation, B.L.; resources, B.L.; data curation, J.Q.; writing—original draft preparation, S.Z.; writing—review and editing, R.J.; visualization, H.C.; supervision, J.W.; project administration, R.J.; funding acquisition, S.Z., N.D., B.L. All authors have read and agreed to the published version of the manuscript.

Funding

This research has received funding from the China National Natural Science Foundation (grant No 71771183) and China National Natural Science Foundation (grant No 71901166) and China National Natural Science Foundation (grant No 71801176).

Data Availability Statement

Data available on request due to restrictions privacy. The data presented in this study are available on request from the corresponding author. The data are not publicly available due to the data used in this study is provided and approved by Shandong Hi-speed Group and Shandong Highway Traffic Police, and we signed privacy clauses.

Conflicts of Interest

The authors declare no conflict of interest.

References

  1. Zheng, L.; Ismail, K.; Meng, X. Traffic Conflict Techniques for Road Safety Analysis: Open Questions and Some Insights. Can. J. Civ. Eng. 2014, 41, 633–641. [Google Scholar] [CrossRef]
  2. Hayward, C. Near-Miss Determination through Use of a Scale of Danger. Highw. Res. Rec. 1972, 384, 24–34. [Google Scholar]
  3. Michiel, M.; Piet, B. Extended Time-to-collision Measures for Road Traffic Safety Assessment. Accid. Anal. Prev. 2001, 33, 89–97. [Google Scholar]
  4. Mahmud, S.S.; Ferreira, L.; Hoque, M.S.; Tavassoli, A. Application of proximal surrogate indicators for safety evaluation: A review of recent developments and research needs. IATSS Res. 2017, 41, 153–163. [Google Scholar] [CrossRef]
  5. Cunto, F.; Saccomanno, F. Calibration and Validation of Simulated Vehicle Safety Performance at Signalized. Accid. Anal. Prev. 2008, 40, 1171–1179. [Google Scholar] [CrossRef]
  6. Weng, J.X.; Meng, Q.; Yan, X.D. Analysis of Work Zone Rear-end Crash Risk for Different Vehicle-following Patterns. Accid. Anal. Prev. 2014, 72, 449–457. [Google Scholar] [CrossRef]
  7. Zhao, P.; Chris, L. Assessing Rear-end Collision Risk of Cars and Heavy Vehicles on Freeways Using a Surrogate Safety Measure. Accid. Anal. Prev. 2018, 113, 149–158. [Google Scholar] [CrossRef]
  8. Zheng, L.; Tarek, S.; Mohamed, E. Validating the Bivariate Extreme Value Modeling Approach for Road Safety Estimation with Different Traffic Conflict Indicators. Accid. Anal. Prev. 2019, 123, 314–323. [Google Scholar] [CrossRef]
  9. Hamid, B.; Navid, N.; Hooman, A. Developing a New Surrogate Safety Indicator Based on Motion Equations. Promet Traffic Raffico 2014, 26, 371–381. [Google Scholar]
  10. Alhajyaseen, M. The Development of Conflict Index for the Safety Assessment of Intersections Considering Crash Probability and Severity. Procedia Comput. Sci. 2014, 32, 364–371. [Google Scholar] [CrossRef] [Green Version]
  11. Wang, C.; Xu, C.; Dai, Y. A Crash Prediction Method Based on Bivariate Extreme Value Theory and Video-based Vehicle Trajectory Data. Accid. Anal. Prev. 2019, 123, 365–373. [Google Scholar] [CrossRef]
  12. Svensson, A.; Hyden, C. Estimating the Severity of Safety Related Behaviour. Accid. Anal. Prev. 2006, 38, 379–385. [Google Scholar] [CrossRef] [PubMed]
  13. Tarko, A.; Davis, G.; Saunier, N.; Sayed, T.; Washington, S. White Paper Surrogate Measures of Safety; Safety Data Evaluation and Analysis: Washington, DC, USA, 2009.
  14. Laureshyn, A.; Svensson, A.; Hyden, C. Evaluation of Traffic Safety, Based on Micro-level Behavioural Data: Theoretical Framework and First Implementation. Accid. Anal. Prev. 2010, 42, 1637. [Google Scholar] [CrossRef]
  15. Hauer, E.; Hakkert, A. The Extent and Implications of Incomplete Accident Reporting. Transp. Res. Rec. 1989, 1186, 1–10. [Google Scholar]
  16. St-Aubin, P.; Saunier, N. Large-scale Automated Proactive Road Safety Analysis Using: Video Data. Transp. Res. Part C 2015, 58, 363–379. [Google Scholar] [CrossRef]
  17. Glauz, W.D.; Migletz, D.J. Application of Traffic Conflict Analysis at Intersections; Transportation Research Board: Washington, DC, USA, 1980. [Google Scholar]
  18. Sun, L.-Y. Research on Urban Road Intersections—Accident Prediction Model and Algorithm; Beijing Jiaotong University: Beijing, China, 2011. [Google Scholar]
  19. Parker, M.R.; Zegeer, C.V. Traffic Conflict Techniques for Safety and Operations—Observers Manual; Federal Highway Administration: Washington, DC, USA, 1989.
  20. Xiang, Q.-J.; Lu, J.; Lu, C.; Ge, X. Road Traffic Conflict Analysis Technology and Application; Science Press: Beijing, China, 2008. [Google Scholar]
  21. Luo, S.-G.; Zhou, W. Research on Road Traffic Conflict Technique. J. Highw. Transp. Res. Dev. 2001, 18, 6–9. [Google Scholar]
  22. Gettman, D. Surrogate Safety Measures from Traffic Simulation Models, Final Report; Federal Highway Administration: Washington, DC, USA, 2003.
  23. Muhlrad, N. Traffic Conflict Techniques and Other Forms of Behavioural Analysis: Application to Safety Diagnoses; ICTCT: Salzburg, Austria, 1993. [Google Scholar]
  24. Lin, L.-P. Research on Traffic Conflict Prediction and Safety Evaluation of Freeway Merging Area; Harbin Institute of Technology: Harbin, China, 2017. [Google Scholar]
  25. Xiang, Q.-J.; Chuan, L.U.; Qun, W.U.; Jian, L.U. Traffic Safety Evaluation on Highway Intersection Based on Severity Division of Traffic Conflict. J. Highw. Transp. Res. Dev. 2008, 25, 128–131. [Google Scholar]
  26. Laureshyna, A. In Search of the Severity Dimension of Traffic Events: Extended Delta-v as a Traffic Conflict Indicators. Accid. Anal. Prev. 2017, 98, 46–56. [Google Scholar] [CrossRef] [Green Version]
  27. Svensson, A. A Method for Analysing the Traffic Process in a Safety Perspective; Lund University: Lund, Sweden, 1998. [Google Scholar]
  28. Cheol, O.; Taejin, K. Estimation of Rear-end Crash Potential Using Vehicle Trajectory Data. Accid. Anal. Prev. 2010, 42, 1888–1893. [Google Scholar]
  29. Davis, G.A.; Hourdos, J.; Xiong, H.; Chatterjee, I. Outline for a Causal Model of Traffic Conflicts and Crashes. Accid. Anal. Prev. 2011, 43, 1907–1919. [Google Scholar] [CrossRef]
  30. Gerald, R.B. Traffic Conflicts for Road User Safety Studies. Can. J. Civ. Eng. 1994, 21, 1–15. [Google Scholar]
  31. Gettman, D.; Pu, L.; Sayed, T.; Shelby, S.G.; Energy, S. Surrogate Safety Assessment Model and Validation; Transportation Research Board: Washington, DC, USA, 2008. [Google Scholar]
  32. Kaan, O.D.; Bekir, B. Derivation and Validation of New Simulation-Based Surrogate Safety Measure. Transp. Res. Rec. J. Transp. Res. Board 2008, 20, 105–113. [Google Scholar]
  33. Shariat-Mohaymany, A.; Tavakoli-Kashani, A.; Nosrati, H.; Ranjbari, A. Identifying Significant Predictors of Head-on Conflicts on Two-lane Rural Roads Using Inductive Loop Detectors Data. Traffic Inj. Prev. 2011, 12, 636–641. [Google Scholar] [CrossRef] [PubMed]
  34. Autey, J.; Sayed, T.; Zaki, M.H. Safety Evaluation of Right-turn Smart Channels Using Automated Traffic Conflict Analysis. Accid. Anal. Prev. 2012, 45, 120–130. [Google Scholar] [CrossRef] [PubMed]
  35. Mamdoohi, A.R.; Fallah Zavareh, M.; Hydén, C.; Nordfjærn, T. Comparative Analysis of Safety Performance Indicators Based on Inductive Loop Detector Data. Traffic Transp. 2014, 26, 139–149. [Google Scholar] [CrossRef] [Green Version]
  36. Songchitruksa, P.; Tarko, A.P. Practical Method for Estimating Frequency of Right-angle Collisions at Traffic Signals. Transp. Res. Rec. 2006, 1953, 89–97. [Google Scholar] [CrossRef]
  37. Chongjing, S.; Feifei, X. An Overview of the Conflict Indicators between Vehicles and Pedestrians. J. Transp. Inf. Saf. 2016, 34, 9–16. [Google Scholar]
  38. Saunier, N.; Sayed, T.; Lim, C. Probabilistic collision prediction for vision-based automated road safety analysis. In Proceedings of the 2007 IEEE Intelligent Transportation Systems Conference, Bellevue, WA, USA, 30 September–3 October 2007; pp. 872–878. [Google Scholar]
  39. Van der Horst, A.R.A.; de Goede, M.; de Hair-Buijssen, S.; Methorst, R. Traffic Conflicts on Bicycle Paths: A Systematic Bbservation of Behaviour from Video. Accid. Anal. Prev. 2014, 62, 358–368. [Google Scholar] [CrossRef]
  40. Walsh, K. Traffic Conflict Studies: A Tool for Accident Assessment. Highw. Transp. 1986, 33, 22–25. [Google Scholar]
  41. Glauz, W.D.; Migletz, D.J. Analysis of Traffic Conflict and Collisions. J. Transp. Res. Board 1978, 1, 67–73. [Google Scholar]
  42. Hauer, E.; Garder, P. Research into the Validity of the Traffic Conflicts Technique. Accid. Anal. Prev. 1986, 18, 471. [Google Scholar] [CrossRef]
  43. Karim, E.B.; Tarek, S. Safety Performance Functions Using Traffic Conflicts. Saf. Sci. 2013, 51, 160–164. [Google Scholar]
  44. Williams, M.J. Validity of the Traffic Conflicts Technique. Accid. Anal. Prev. 1981, 13, 133–145. [Google Scholar] [CrossRef]
  45. Tiwari, G.; Mohan, D.; Fazio, J. Conflict Analysis for Prediction of Fatal Crash Locations in Mixed Traffic Streams. Accid. Anal. Prev. 1998, 30, 207–215. [Google Scholar] [CrossRef]
  46. Guo, Y.-Y. Safety Evaluation Technology of Signalized Intersection Based on Traffic Conflict Theory; Southeast University: Nanjing, China, 2016. [Google Scholar]
  47. Shahdah, U.; Saccomanno, F.; Persaud, B. Application of Traffic Microsimulation for Evaluating Safety Performance of Urban Signalized Intersections. Transp. Res. Part C Emerg. Technol. 2015, 60, 96–104. [Google Scholar] [CrossRef]
  48. Peesapati, L.N.; Hunter, M.P.; Rodgers, M.O. Evaluation of Post Encroachment Time as Surrogate for Opposing Left-turn Crashes. Transp. Res. Rec. 2013, 2386, 42–51. [Google Scholar] [CrossRef] [Green Version]
  49. Zou, Y.; Lin, B.; Yang, X.; Wu, L.; Muneeb Abid, M.; Tang, J. Application of the Bayesian Model Averaging in Analyzing Freeway Traffic Incident Clearance Time for Emergency Management. J. Adv. Transp. 2021, 2021, 6671983. [Google Scholar] [CrossRef]
  50. Arun, A.; Haque, M.M.; Bhaskar, A.; Washington, S.; Sayed, T. A systematic mapping review of surrogate safety assessment using traffic conflict techniques. Accid. Anal. Prev. 2021, 153, 106016. [Google Scholar] [CrossRef]
Figure 1. Jinan-Qingdao Highway Schematic Diagram.
Sustainability 13 09278 g001
Figure 2. (a) Video captured by UAV, (b) UAV.
Sustainability 13 09278 g002
Figure 3. Video recognition and traffic conflict identification.
Sustainability 13 09278 g003
Figure 4. Fixed objects’ coordinates data.
Sustainability 13 09278 g004
Figure 5. Video recognition accuracy.
Sustainability 13 09278 g005
Figure 6. TTC suitability in the case of the lane change conflict.
Sustainability 13 09278 g006
Figure 7. Serious conflict identified.
Sustainability 13 09278 g007
Figure 8. (a) Proportion of vehicle-vehicle and vehicle-fixed object actual accidents. (b) Proportion of vehicle-vehicle and vehicle-fixed object actual accidents of financial losses.
Sustainability 13 09278 g008
Figure 9. Flowchart showing the method used.
Sustainability 13 09278 g009
Figure 10. Angle θ between the driving directions of the two vehicles.
Sustainability 13 09278 g010
Figure 11. Ti definition and calculation formula.
Sustainability 13 09278 g011
Figure 12. Conflict-accident correlation coefficient with different thresholds of TTC.
Sustainability 13 09278 g012
Figure 13. Conflict-accident correlation coefficient with different thresholds of PET.
Sustainability 13 09278 g013
Figure 14. Conflict-accident correlation coefficient with different thresholds of DRAC.
Sustainability 13 09278 g014
Figure 15. Conflict-accident correlation coefficient with different rear-end conflict thresholds of Ti.
Sustainability 13 09278 g015
Figure 16. Conflict-accident correlation coefficient with different lane change conflict thresholds of Ti.
Sustainability 13 09278 g016
Figure 17. Conflict-accident correlation coefficient with different combinations of thresholds for rear-end and lane change conflict of Ti.
Sustainability 13 09278 g017
Figure 18. Conflict-accident correlation coefficient with different vehicle-fixed object conflict thresholds of Ti.
Sustainability 13 09278 g018
Figure 19. Conflict-accident correlation coefficient with different thresholds of various indicators.
Sustainability 13 09278 g019
Figure 20. (a) TTC cannot identify lane change conflict in scenario 1. (b) Ti can identify lane change conflict in scenario 1.
Sustainability 13 09278 g020
Figure 21. PET will misjudge some rear-end conflict in scenario 2 and 3.
Sustainability 13 09278 g021
Figure 22. (a) Ti can identify there is no rear-end conflict in scenario 2. (b) Ti can identify rear-end conflict in scenario 3.
Sustainability 13 09278 g022
Figure 23. Ti can identify vehicle-fixed objects in scenario 4.
Sustainability 13 09278 g023
Figure 24. Rear-end and lane change conflicts with different conflict indicators (sum of all locations).
Sustainability 13 09278 g024
Figure 25. (a) Proportion of vehicle-vehicle and vehicle-fixed object conflicts with Ti. (b) Proportion of vehicle-vehicle and vehicle-fixed object actual accidents.
Sustainability 13 09278 g025
Table 1. Advantages and Limitations of Different Conflict Indicators and the Suitable Environment.
Classification of Conflict IndicatorsTypical IndicatorAdvantagesLimitationsSuitable Environment
Indicators of risk aversion behavior Signs of conflict (lights on for steering and braking) [19] Intuitive and straightforward, ideal for early situations where high-precision equipment is not available.Difficult to define and observe with high precision quantitatively [1]. Traffic conflict observations suitable for manual investigation.
Indicators based on proximity in space and time Distance indicators (collision distance [20], non-full stopping distance [21], parking distance ratio [22])Simpler to calculate than time indicators.If distance and speed are considered separately, there may be situations where distance and speed are both very small / large, for which traffic conflicts may not be severe. Time indicators that consider both distance and speed factors are more scientific indicators.Currently less frequently used, replaced by time indicators.
Speed indicators
(conflicting vehicle speeds)
Time indicators
(TTC and derived indicators such as TIT, TET, TA [2,3])
Capable of calculating the process of conflict between the vehicles at various time intervals.It is more difficult to identify vehicles that encounter angled lane change conflicts, and the risk of Non-Collision Course is neglected [27,28]. TTC was more
informative than PET [4].
More applicable to conflicts between vehicles on the same trajectory, that is rear-end conflicts.
Time indicators
(PET-derived indicators [23,24,25])
Simple definition, with no need to calculate a collision course, but only a common area, unlike TTC.Only applicable to calculations when the rear vehicle passes through the common area, i.e., in post-conflict estimation, but not applicable to pre-conflict estimation [29]
Real-time microscopic data of the two vehicles are not taken into account; not applicable to studies of the interaction between vehicles (In a situation where the rear car is slower than the front car, it still considers the scenario risky even though logically no collision would take place).
Better suited for studies on conflicts due to vehicle merging at intersections.
Time indicators [26]Combines advantages of TTC and PET indicatorsApplication still at the theoretical stage and needs to be supported by more data.Wider application scope compared to TTC and PET indicators.
Indicators of vehicle’s own movement characteristicsDeceleration Rate to Avoid Crash (DRAC) [5]Similar to TTC, DRAC reflects the risk of a Rear-end conflict per vehicle in most cases
Table 2. Serious conflict thresholds for common indicators.
Research LiteratureConflict IndicatorsType of Road FacilitySerious Conflict Threshold
Brown (1994) [30]TTC Intersection1.5 s
Svensson (1998) [27]TTC Intersection1.5 s
GETTMAN D et al. [31]PET /5.0 s
Ozbayet et al. (2008) [32]Modified TTC Road section4.0 s
Gurleyet et al. (2011) [33]TTC Road section3.0 s
Auteyet et al. (2012) [34]TTC Intersection3.0 s
Amir Reza Mamdoohi et al. (2014) [35]TH /2.0 s
TTC 1.5 s
PSD 1 m
DRAC 3.4 m/s2
Table 3. Segment, video capture locations and road conditions.
SegmentLocation of CaptureOn-Site PicturesRoad Conditions
1K51 + 500
K52 + 200
Sustainability 13 09278 i001Normal road, widened on both sides, temporary guardrail and cones on both sides, speed limit 80 km/h
2K57 + 580
K58 + 600
Sustainability 13 09278 i002Located in a traffic diversion zone, widened on both sides, temporary guardrails and cones on both sides, speed limit 80 km/h
Normal road, widened on both sides, temporary guardrail and cones on both sides, speed limit 80 km/h
3K112 + 500 Sustainability 13 09278 i003Normal road, widened on both sides, temporary guardrail on both sides, speed limit 80 km/h
4K130 + 500
K131 + 500
K133 + 200
Sustainability 13 09278 i004
Sustainability 13 09278 i005
Normal road, widened on both sides, temporary guardrail and cones on both sides, speed limit 80 km/h
5K182 + 000
K186 + 000
Sustainability 13 09278 i006Normal road, widened on both sides, temporary guardrail and cones on both sides, speed limit 80 km/h
6K192 + 500 Sustainability 13 09278 i007Normal road, widened on both sides, temporary guardrail on both sides, speed limit 80 km/h
7K255 + 000
K257 + 700
K258 + 260
Sustainability 13 09278 i008
Sustainability 13 09278 i009
Normal road, widened on both sides, temporary guardrail and cones on both sides, speed limit 80 km/h
Normal road, widened on both sides, temporary guardrail on both sides, speed limit 80 km/h
Located in a traffic diversion zone, with intersections, widened on both sides, temporary guardrail and cones on both sides, speed limit 80 km/h
8K266 + 800 Sustainability 13 09278 i010Normal road, widened on both sides, temporary guardrail on both sides, speed limit 80 km/h
9K271 + 620
K278 + 300
Sustainability 13 09278 i011Normal road, widened on both sides, temporary guardrail and cones on both sides, speed limit 80 km/h
10K287 + 000 Sustainability 13 09278 i012Normal road, widened on both sides, temporary guardrail and cones on both sides, speed limit 80 km/h
Table 4. Vehicle recognition rate.
LocationVideo FramesVideo Duration (s) Vehicles Identified InitiallyVehicles Tracked ContinuouslyVehicles by Manual ObservationInitial Recognition Rate (%)Continuous Tracking Rate (%)
K51 + 50033,420 1114 175 165 186 94.1 88.7
K52 + 20027,030 901 167 158 172 97.1 91.9
K112 + 50089,880 2996 491 476 543 90.4 87.7
K131 + 50051,930 1731 223 211 247 90.3 85.4
K133 + 50063,990 2133 373 360 388 96.1 92.8
Total266,250 8875 1429 1370 1536 93.0 89.2
Table 5. Chart of historical traffic accident data (Partial translation display).
NumberTime of Accident OccurrenceLocation of Accident Occurrence (Stake Number/Orientation)Vehicle Type of AccidentType of AccidentWeatherLevel of SeverityNumber of DeathNumber of InjuredRoad Financial Loss ($)
12016/9/15Direction from Qingdao to Jinan
K64 + 700
small car and truckraer-endsunnyslight00120
22016/9/20Direction from Qingdao to Jinan
K81 + 100
small car and small carraer-endsunnyordinary00715
32016/9/24Direction from Jinan to Qingdao K105 + 200truckroll-oversunnyordinary00415
42016/9/24Direction from Qingdao to Jinan
K81 + 180
small carroll-oversunnyordinary00280
52016/9/27Direction from Jinan to Qingdao K101 + 600small carroll-oversunnyordinary00580
62016/9/29Direction from Qingdao to Jinan
K55 + 100
truckfiresunnyordinary001760
72016/10/1Direction from Qingdao to Jinan
K76 + 100
small carhit the central partition guardrailsunnyordinary00980
82016/10/5Direction from Jinan to Qingdao K44 + 100truck and truckraer-endsunnyordinary00515
Publisher’s Note: MDPI stays neutral with regard to jurisdictional claims in published maps and institutional affiliations.

