Article

Effectiveness of Pedestrian Safety Service Provision Using Sensing Technology

1
Department of Highway & Transportation Research, Korea Institute of Civil Engineering and Building Technology, Goyang-si 10223, Korea
2
Jeju Research Institute, Jeju 63147, Korea
*
Author to whom correspondence should be addressed.
Sustainability 2021, 13(16), 9333; https://doi.org/10.3390/su13169333
Submission received: 22 June 2021 / Revised: 11 August 2021 / Accepted: 12 August 2021 / Published: 19 August 2021

Abstract

:
In this study, we describe the results of an analysis of the effectiveness of providing pedestrian safety services, in terms of reducing pedestrian traffic accidents. We conducted our analysis by investigating the speed of vehicles at two different demonstration points, where the same system and service were provided. For this purpose, we selected a child protection zone and a point on a general road section where a raised crossing is installed. We conducted vehicle speed surveys at the point adjacent to the crosswalk and the points where the driver is expected to be fully provided with information, in order to examine the change in vehicle approach speed, depending on the provision of the service. Overall, the analysis showed that the vehicle’s speed at the point and approaching speed decreased when the pedestrian safety service was provided; however, the effect was more pronounced in the child protection zone, considering the characteristics of the demonstration points. From these results, we conclude that it is necessary to provide services and develop guidelines considering the surrounding environment, such as traffic safety facilities and road safety facilities, according to the characteristics and classification of each point, in order to provide efficient pedestrian safety services.

1. Introduction

In Korea, the number of drivers continues to increase, due to the increase in population and improved socio-economic conditions. Over the past decade, the population has increased by 0.47% annually, from about 49.6 million people in 2010 to about 51.7 million people in 2019 [1]. Meanwhile, the number of registered vehicles has increased by 3.13% annually, from about 17,941 thousand vehicles in 2010 to about 23,677 thousand vehicles in 2019 [1], more than six times the population growth rate. Amid these social changes, traffic accidents caused by vehicles are a very big problem. In particular, pedestrian traffic accidents, which are likely to develop into relatively serious accidents, have become a serious issue.
According to the statistics on pedestrian traffic accidents in Korea [1], out of 229,600 traffic accidents in 2019, there were 46,150 pedestrian traffic accidents (i.e., vehicle-to-person), accounting for 20.10%, which appeared to be reduced by 1.65%, compared to 21.75% in 2010, and reduced by 0.87% compared to the annual average over the past decade. On the other hand, considering the death toll from pedestrian traffic accidents, the death toll from pedestrian accidents out of 3349, as the death toll from the overall traffic accidents in 2019 accounted for 1271 (i.e., 37.95%), which appeared to increase by 1.44%, compared to 36.51% in 2010.
Table 1 shows the trend of traffic accidents and pedestrian accidents in Korea over the past decade, indicating that the death toll from pedestrian accidents has increased by 0.43% annually, on average.
Pedestrian accidents, which have a high fatality rate, lead to social and economic losses; therefore, in Korea, various pedestrian safety information services have been developed and applied to reduce pedestrian accidents. Typical services are visual information-providing services, which provide pedestrian notification messages to drivers and approaching vehicle notification messages to pedestrians. In addition, visual services are supplemented by providing vehicle approach information, such as using sound effects to alert pedestrians, and providing services using smartphone notifications (vibration and sound) to drivers. Research has been conducted using various sensor technologies, in order to provide service information, along with data collection and processing.
The purpose of providing such pedestrian safety services is two-fold. One is to avoid accidents by alerting both pedestrians and vehicle drivers to collision risks in advance, through providing them with vehicle approach information, and the other is to prevent any fatal accidents, by reducing the speed of vehicles in the event of an unavoidable accident situation, even if the information has been provided to the vehicle driver. In particular, the speed of a vehicle is one of the key contributing factors in pedestrian traffic accidents. Nilsson [2] has shown that a 5% decrease in vehicle speed reduces injury accidents by 10% and death accidents by 20%. Sin et al. [3] and Jang et al. [4], in studies analyzing problems in child protection zones, proposed to prescribe vehicle speed limits below 30 km/h while defining it as a risk factor. Additionally, Maycock and Brocklebank [5], who analyzed the association between vehicle speed and traffic accidents, concluded that, when the vehicle speed increases by 1%, the number of accidents increases by 13.1%. Quimby et al. [6], in a study considering specific vehicles, emphasized the association between speed and accidents, presenting that a speed increase by 1% leads to an accident rate increase of 7.8%. Durkin et al. [7] found that the survival rate in traffic accidents with the vehicle’s speed at 30 km/h is 95% but 10% at 64 km/h. Brian [8], in a study on the severity of pedestrian accidents caused by vehicles, presented that serious injuries occur 10% at 17.1 mph, 25% at 24.9 mph, 50% at 33.0 mph, 75% at 40.8 mph, and 90% at 48.1 mph and that the average mortality risk is 10% at 24.1 mph and 90% at 54.6 mph. As such, a number of studies have shown that the speed of vehicles in the event of a traffic accident is closely related to the severity of the accident.
However, in Korea, although nationwide pedestrian safety services and systems to provide them are currently being established, studies verifying their effectiveness at the actual sites are insufficient. Therefore, the purpose of this study is to quantitatively present the effect of providing sensor fusion-based pedestrian safety services developed to ensure the traffic safety of vehicle drivers, as well as pedestrians.

2. Literature Review

2.1. Analysis of Pedestrian Traffic Accidents

According to a statistical report by the Korea Road Traffic Authority [1], which provides statistical information on traffic accidents in Korea, the number of pedestrian accidents was 46,150 in 2019, 39.2% of which were crossing accidents (18,101). And the number of pedestrian casualties was 48,677, 39.5% of which were crossing accidents (19,229). In detail, 652 out of 1271 deaths were from crossing accidents, which accounted for 51.3% of total pedestrian accident deaths, and 18,577 (39.2%) out of 47,406 injuries occurred while crossing.
Looking at the trend of changes in pedestrian accidents over the past decade, as shown in Table 2, 39.2% to 55.3% of all pedestrian accidents occurred while crossing, accounting for the highest percentage of the types of pedestrian accidents, except for other pedestrian accidents of unidentified type. In a similar pattern, casualties while crossing showed the highest proportion (39.1% to 55.5%) among the total pedestrian casualties, at this time the percentage of deaths caused by road crossing was 47.8% to 65.3%.
Comparing the statistics of an annual number of accidents and the number of deaths for each type of accident, we can see that the rate of deaths while crossing was relatively higher than the rate of accidents while crossing in all years, which means that traffic accidents while crossing had a higher mortality rate than other types of accidents.

2.2. Review of Precedent Studies

Prior to reviewing the precedent studies, the definition of pedestrian safety services in Korea has been presented, in [9], as a service that protects pedestrians from accidents due to vehicles, lowers the pedestrian accident rate, and reduces the social and economic losses resulting from traffic accidents. The services are classified in Table 3 below.
The Pedestrian Safety Support Service (PSSS) [10] of the Korea Telecommunications Technology Association, having a similar meaning, is a term defined in more detail. It includes services involving pedestrian accident prevention and emergency aid. It uses roadside devices to detect any pedestrian present at an intersection, provides information to approaching vehicles, and automatically sends a notification to an emergency center in case of a disease outbreak or the occurrence of any emergency. In other words, the walking safety service can be defined as services that provide information to pedestrians and vehicle drivers, to ensure pedestrian traffic safety on the road, which includes systems for collecting and processing information using various sensor devices and technologies, such as detectors, thermal image cameras, video information, and radars. In this study, we review the studies using such systems and precedent studies on the facilities for enhancing pedestrian safety.
Jeon et al. [11] analyzed the effectiveness of the pedestrian auto-detecting crosswalk system in Jeonju-si. As for effectiveness metrics, they used the pedestrian waiting time, signal violations of pedestrians and vehicles, and jaywalking. They performed an analysis considering three aspects: before system installation, after system installation, and after living lab application. According to the analysis, the indicators for pedestrians improved after applying the living labs at points outside and inside the city, while those for the vehicles improved after installing the system and applying the living lab; however, the difference in effect between after system installation and after living lab application was insignificant.
Kim et al. [12] analyzed the impact of the installation of variable speed limit signs and beacons on the vehicle travel speed in pedestrian protection zones (including child protection zones) for schools in Seoul-si and Gyeonggi-do Province. According to the analysis, the vehicle travel speed decreased by 8.3 km/h (from 51.7 km/h before installation of the signs to 43.3 km/h after installation), but the speed increased by 0.8 km/h (from 41.5 km/h before installation of the beacons to 42.3 km/h after installation).
Yoon et al. [13], using a comparison group method, conducted an effectiveness analysis of the road and traffic safety facilities installed to prevent traffic accidents in 4171 locations, where improvement projects against frequent traffic accidents had been completed from 2004 to 2013. According to the analysis, accidents were reduced by 4.45% with traffic islands, by 32.17% with raised pavement markers, and by 24.13% with speed cameras in all traffic accidents; however, the accidents partially increased with the installation of anti-jaywalk facilities and anti-slip pavement.
Godavarthy et al. [14] analyzed the effectiveness of pedestrian hybrid beacon (PHB) use in mid-block crosswalks in Lawrence, Kansas, from the vehicle driver’s point of view, and presented that unnecessary delays caused by the signals were reduced by more than 90%.
Using Bluetooth and solar modules, Jin et al. [15] conducted an effect assessment of the installation of a crossing safety support system that provides LED crosswalk lights, text indicators, and voice guidance information to pedestrians and drivers. As for indicators, they used the travel speed of target vehicles and changes in pedestrian behavior and showed that the travel speed of vehicles decreased by 0.79 km/h (1.39%) in the daytime and by 2.78 km/h (4.54%) at night. Furthermore, in the analysis of pedestrian crossing behaviors, they presented that the frequency of looking right and left increased from 27.94% in the daytime and 36.04% at night before system installation to 62.90% in the daytime and 58.73% at night after installation.
Kim et al. [16] presented the results of a survey about differentiating the speed limit, according to the physical environment of the road. If the speed limit (set in three stages) is lowered overall, about 70% to 80% of respondents forecasted it would have the effect of reducing both the number of accidents and severity of accidents.
Lee [17] conducted a study on improving crosswalk lighting, using a survey to ensure the safety of crosswalk walking. According to the survey, 82.0% of drivers preferred illuminated sidewalks as well as crosswalks, and 82.8% considered that illuminating crosswalks can help to prevent traffic accidents, through pedestrian detection.
Kim et al. [18] analyzed the effect of accident reduction and transition by accident type, through the use of accident status data at intersections with diagonal crosswalks installed in South Korea. According to the analysis, the installation of diagonal crosswalks had an accident reduction effect related to all types of accidents, and the number of person-to-vehicle accidents was reduced by 52.9%.
Park et al. [19] performed an itemized effect analysis of traffic safety facilities through a case study using driving simulations. The analysis items included anti-slip pavement and installation of safety signs (reduction of travel speed), installation of front signal lights (enhancing of driver’s cognitive response), to improve the driving environment, and the installation of crosswalk illumination (enhancing night-time visibility), to improve the pedestrian environment. According to the analysis, the average travel speed in the section decreased by 11 km/h due to speed reduction facilities, and the deceleration point increased by 8 m due to the driver’s cognitive response facilities and by 13 m, due to night-time visibility-enhancing facilities.
Park [20] analyzed the effect of the installation of a crosswalk lighting facility using traffic accident data for one year before and after installation in Nam-gu, Gwangju Metropolitan City. Intensive lighting facilities were divided into three types: floodlights installed alone, floodlights and pedestrian warning signs installed together, and floodlights and pedestrian warning LED signs installed together. According to the analysis, total person-to-vehicle traffic accidents decreased by 10.11% at day and decreased by 37.74% at night.
FHWA [21] analyzed the effectiveness of pedestrian hybrid beacons at 21 intersections and presented that all collisions were reduced by 29% and pedestrian collisions were reduced by 69%.
According to the NHTSA [22], the unmanned speed control in child protection zones was analyzed to slow down the vehicle speed by about 6.4–8.0 km/h. When applied after being linked to beacons, the vehicle speed decreased by about 12.9–14.5 km/h.
Gates [23] showed that the installation of beacons to improve traffic safety in child protection zones was effective in keeping vehicles to the speed limits, with the proportion of vehicles decreasing the limit by 20 mph falling by 16.7% and that exceeding by 30 mph decreasing by 75%.

3. Plan to Configure a Pedestrian Safety System and Provide Services

3.1. Configuration of the Pedestrian Safety System

The pedestrian safety system applied in this study utilizes a radar detection sensor, a vehicle information collection device, and a thermal image recognition sensor (a pedestrian information collection device) for data collection. The data collected from each sensor are processed on the mainboard, to provide information to pedestrians and drivers. Specifically, the individual devices (sensors) are used as shown in Table 4.
① Pedestrian detection sensors are installed on both sides of the crosswalk to determine the presence of pedestrians.
② A vehicle approaching the crosswalk is detected through the vehicle detection sensor.
③ The information collected from each detection sensor is transmitted to the mainboard, and the main board determines whether the vehicle’s approach speed is 10 km/h or more when a pedestrian is detected, then provides notification information to both drivers and pedestrians.
Figure 1 shows a conceptual diagram of system application using the devices (or sensors) in Table 4, and Figure 2 shows a system configuration diagram detailing information collection, processing, and provision.

3.2. Plan to Provide the Services

The services provided through the collected information were designed as shown in Table 5. First, a service plan was prepared to provide triple warning information to pedestrians and drivers, using visual, auditory, and tactile senses, respectively. As an information provision strategy, when a pedestrian is detected in a crosswalk, a small variable message sign (VMS), a visual road light sign, and an LED floor warning light on the road surface are used to provide pedestrian risk information to driving vehicles. Information provision using a small VMS serves to provide intuitive information to drivers, to prevent confusion in information delivery that may occur when only LED floor warning lights on the road are provided.
As information is provided to pedestrians, when a vehicle with a speed of 10 km/h or more approaches, a message using an LED screen is provided, and a warning notification service using a speaker is provide as audible information. In addition, a system was built to provide smartphone notifications with tactile information to pedestrians using smartphones. Smartphone notification information takes into account the frequent ‘smomby’ (smartphone zombie) accidents that occur in Korea. Pedestrian-related accidents using smartphones in Korea increased 1.6 times between 2013 and 2018 [24]. Therefore, there has been a trend to reduce accidents through smartphone use ban signs and applications. The system proposed in this study incorporates these functions.

4. Demonstration Analysis

4.1. Analysis of Demonstration Point Status

We selected demonstration points to analyze the effectiveness of providing pedestrian safety services in this study. The crosswalk in front of Wollang Elementary School in Nohyeong-dong, Jeju-si (hereinafter referred to as Wollang Elementary School), and the crosswalk in front of Borim Pharmacy in Ildo 1-dong (hereinafter referred to as Borim Pharmacy) were considered. Thus, the selection of demonstration points reflected the characteristics of a point in a school zone (Wallang Elementary School) and a point on a general road (Borim Pharmacy). Preliminary testing of the two demonstration points resulted in demands such as noise problems due to nearby shopping malls and residents and, in the case of information provision using smartphones, there were limitations in the process of cooperating with residents, such as passive responses to App installation. Therefore, after listening to the opinions of the local residents, we chose to provide visual services only and conducted the service delivery effect analysis of this study by providing only two types of visual warning display service information: floor lighting and small VMS.

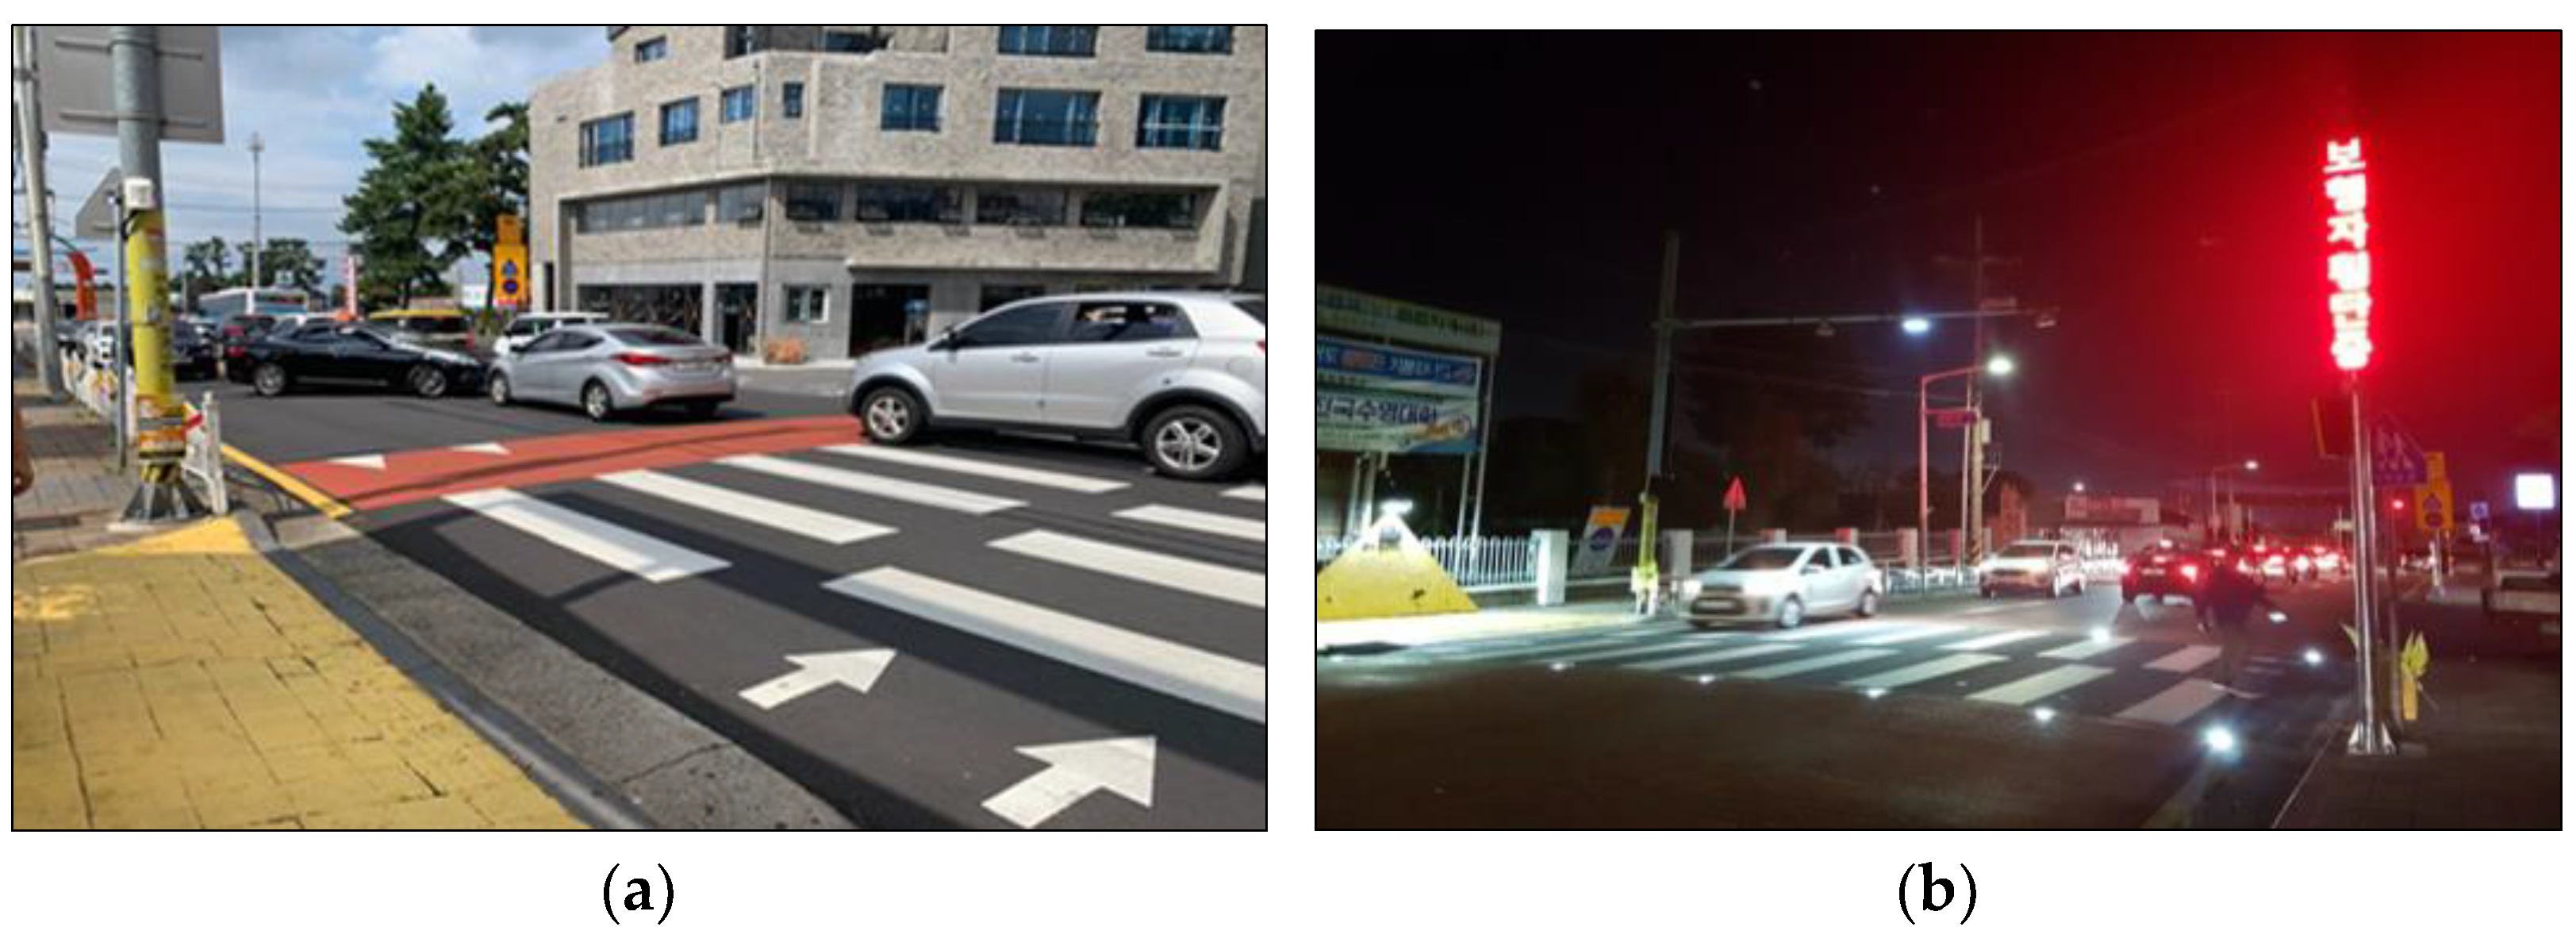
4.1.1. Wollang Elementary School

North of Wollang Elementary School, there is a seven-lane local road—Line 1132 (Ilju-seoro)—and Namnyeong-ro, where the main gate of the elementary school is located, has three lanes (South to North, 2 lanes; North to South, 1 lane). As a major traffic safety facility, we found a child protection zone (school zone) with road surface signs, safety signs, crosswalks, and safety fences installed in the direction of the main gate; while, the sidewalks opposite the main gate had no safety fences installed and, at that point, there were no signals or signal lights installed. As for traffic characteristics, in addition to a large number of elementary school pedestrians under the age of 13 years old to and from school at the main gate location, there are many pedestrians from middle and high schools located within a 500 m radius of the elementary school, as well as many general pedestrians from commercial and residential facilities. Figure 3 is a diagram of the status of Wollang Elementary School before/after system installation.

4.1.2. Borim Pharmacy

We also considered Borim Pharmacy, located on Danil-ro, with a four-lane road section of a downhill slope from the east to the west on the east-west axis of Jeju City. In addition, we found that it was a point with pedestrians and vehicles separated and with no pedestrian fence installed. Furthermore, no signal was installed (as was the case at Wollang Elementary School), but it did feature a raised crossing, one of the traffic-calming techniques installed to physically reduce the travel speed of vehicles. We found, in our investigation, that due to the regional characteristics of residential areas located in the old city center, there were a large number of transportation-vulnerable residents, especially elderly pedestrians. Figure 4 is a diagram of the status of Borim Pharmacy before/after system installation.

4.2. Determination of Analysis Scenario and Verification of Collected Data

4.2.1. Determination of Analysis Scenario

As mentioned earlier, the main purpose of the pedestrian safety service is to reduce the travel speed of vehicles, in order to prevent serious pedestrian traffic accidents and to reduce the risk of collision with pedestrians and vehicle drivers. Therefore, we analyzed the effectiveness of the service by comparing the travel speed of vehicles before and after the service provision, at the speed survey points shown in Figure 5, at the point adjacent to the crosswalk (2 m apart from the crosswalk; point 1), and at the point separated by 19 m (point 2) from the crosswalk, where the driver was expected to be fully informed. We measured the speed of the same vehicle. For the speed survey, equipment from the KICT (Korea Institute of Civil engineering and building Technology) was used; that is, a portable roadway detector evaluation system. The vehicle speed was investigated, as shown in Figure 6, with a measuring device using the radar wave Doppler effect.
There were some limitations, such as the need to consult with local governments to conduct vehicle speed surveys in the same time band as installing survey equipment, but we decided the time band and characterized it into day and night, as shown in Table 6. The system installed at the two points provides information based on visual services. Accordingly, visibility can be secured when information is provided to the driver during nighttime. However, in the case of the daytime, the effect may be relatively reduced, compared to the night-time period; as such, the investigation was conducted separately between daytime and night-time. We conducted the final surveys on 22 October 2019, before providing the services, and on 14 November 2019, after providing the services.
Measuring the speed separately at two points, divided into day and night, has two implications. First, a vehicle speed survey at two survey points enabled us to confirm the decrease in speed before and after the service was provided; secondly, we could compare the difference in service delivery effect between daytime and night-time.
We performed the demonstration analysis using indicators of the vehicle speeds at the points and, so, we did not collect information on the presence of pedestrians at the service delivery points. Here, we encountered limitations, in that it was difficult to determine whether the change in vehicle speed at point 2 or point 1 was due to the pedestrian safety services provided, depending on the presence of pedestrians, or due to the driver’s driving habits after recognizing a crosswalk, even though there are no pedestrians. In addition, there may be vehicles that do not slow down in speed, even if a pedestrian is walking, based on the driver’s judgment that there will be no conflict with the pedestrian in the direction of the vehicle relative to the centerline.
Therefore, in this study, a scenario analysis was performed as shown in Table 7. First, scenario 1 was analyzed for all vehicles collected in the vehicle speed survey. In the case of scenario 2, among the vehicles approaching from point 2 to point 1, vehicles with reduced speed were analyzed.

4.2.2. Data Verification

The collected data included the time when and the speed at which each vehicle passed each point. From the data collected at Wollang Elementary School, the number of vehicles was 337 in the daytime and 213 at night-time before providing pedestrian safety services, and 296 in the daytime and 202 at night-time after providing the service. In the case of Borim Pharmacy, it was 213 in the daytime and 150 at night-time before the service was provided, and 143 in the daytime and 202 at night-time after the service was provided. After reviewing the data, we performed an analysis excluding the data with abnormal speed values at survey point 1 and some data at survey point 2, whose collection time was later than survey point 1, and the final collected data (including duplicate errors) are as shown in Table 8.
Prior to analyzing the change in vehicle speed due to the provision of pedestrian safety services by point, we conducted a t-test for the difference in average speed (by time band and by point) before and after service provision. From the results of the analysis in the case of Wollang Elementary School, as shown in Table 9, we found it to be significant at the level of 1% (0.01). In addition, in the case of Borim Pharmacy, we found the average point speed at point 2 in the daytime was significant at the level of 1% (0.01), and significant at the level of 5% (0.05) at point 1 at night-time, whereas it was not significant at point 1 in the daytime and point 2 at night-time.

4.3. Effect Analysis of Providing the Pedestrian Safety Services

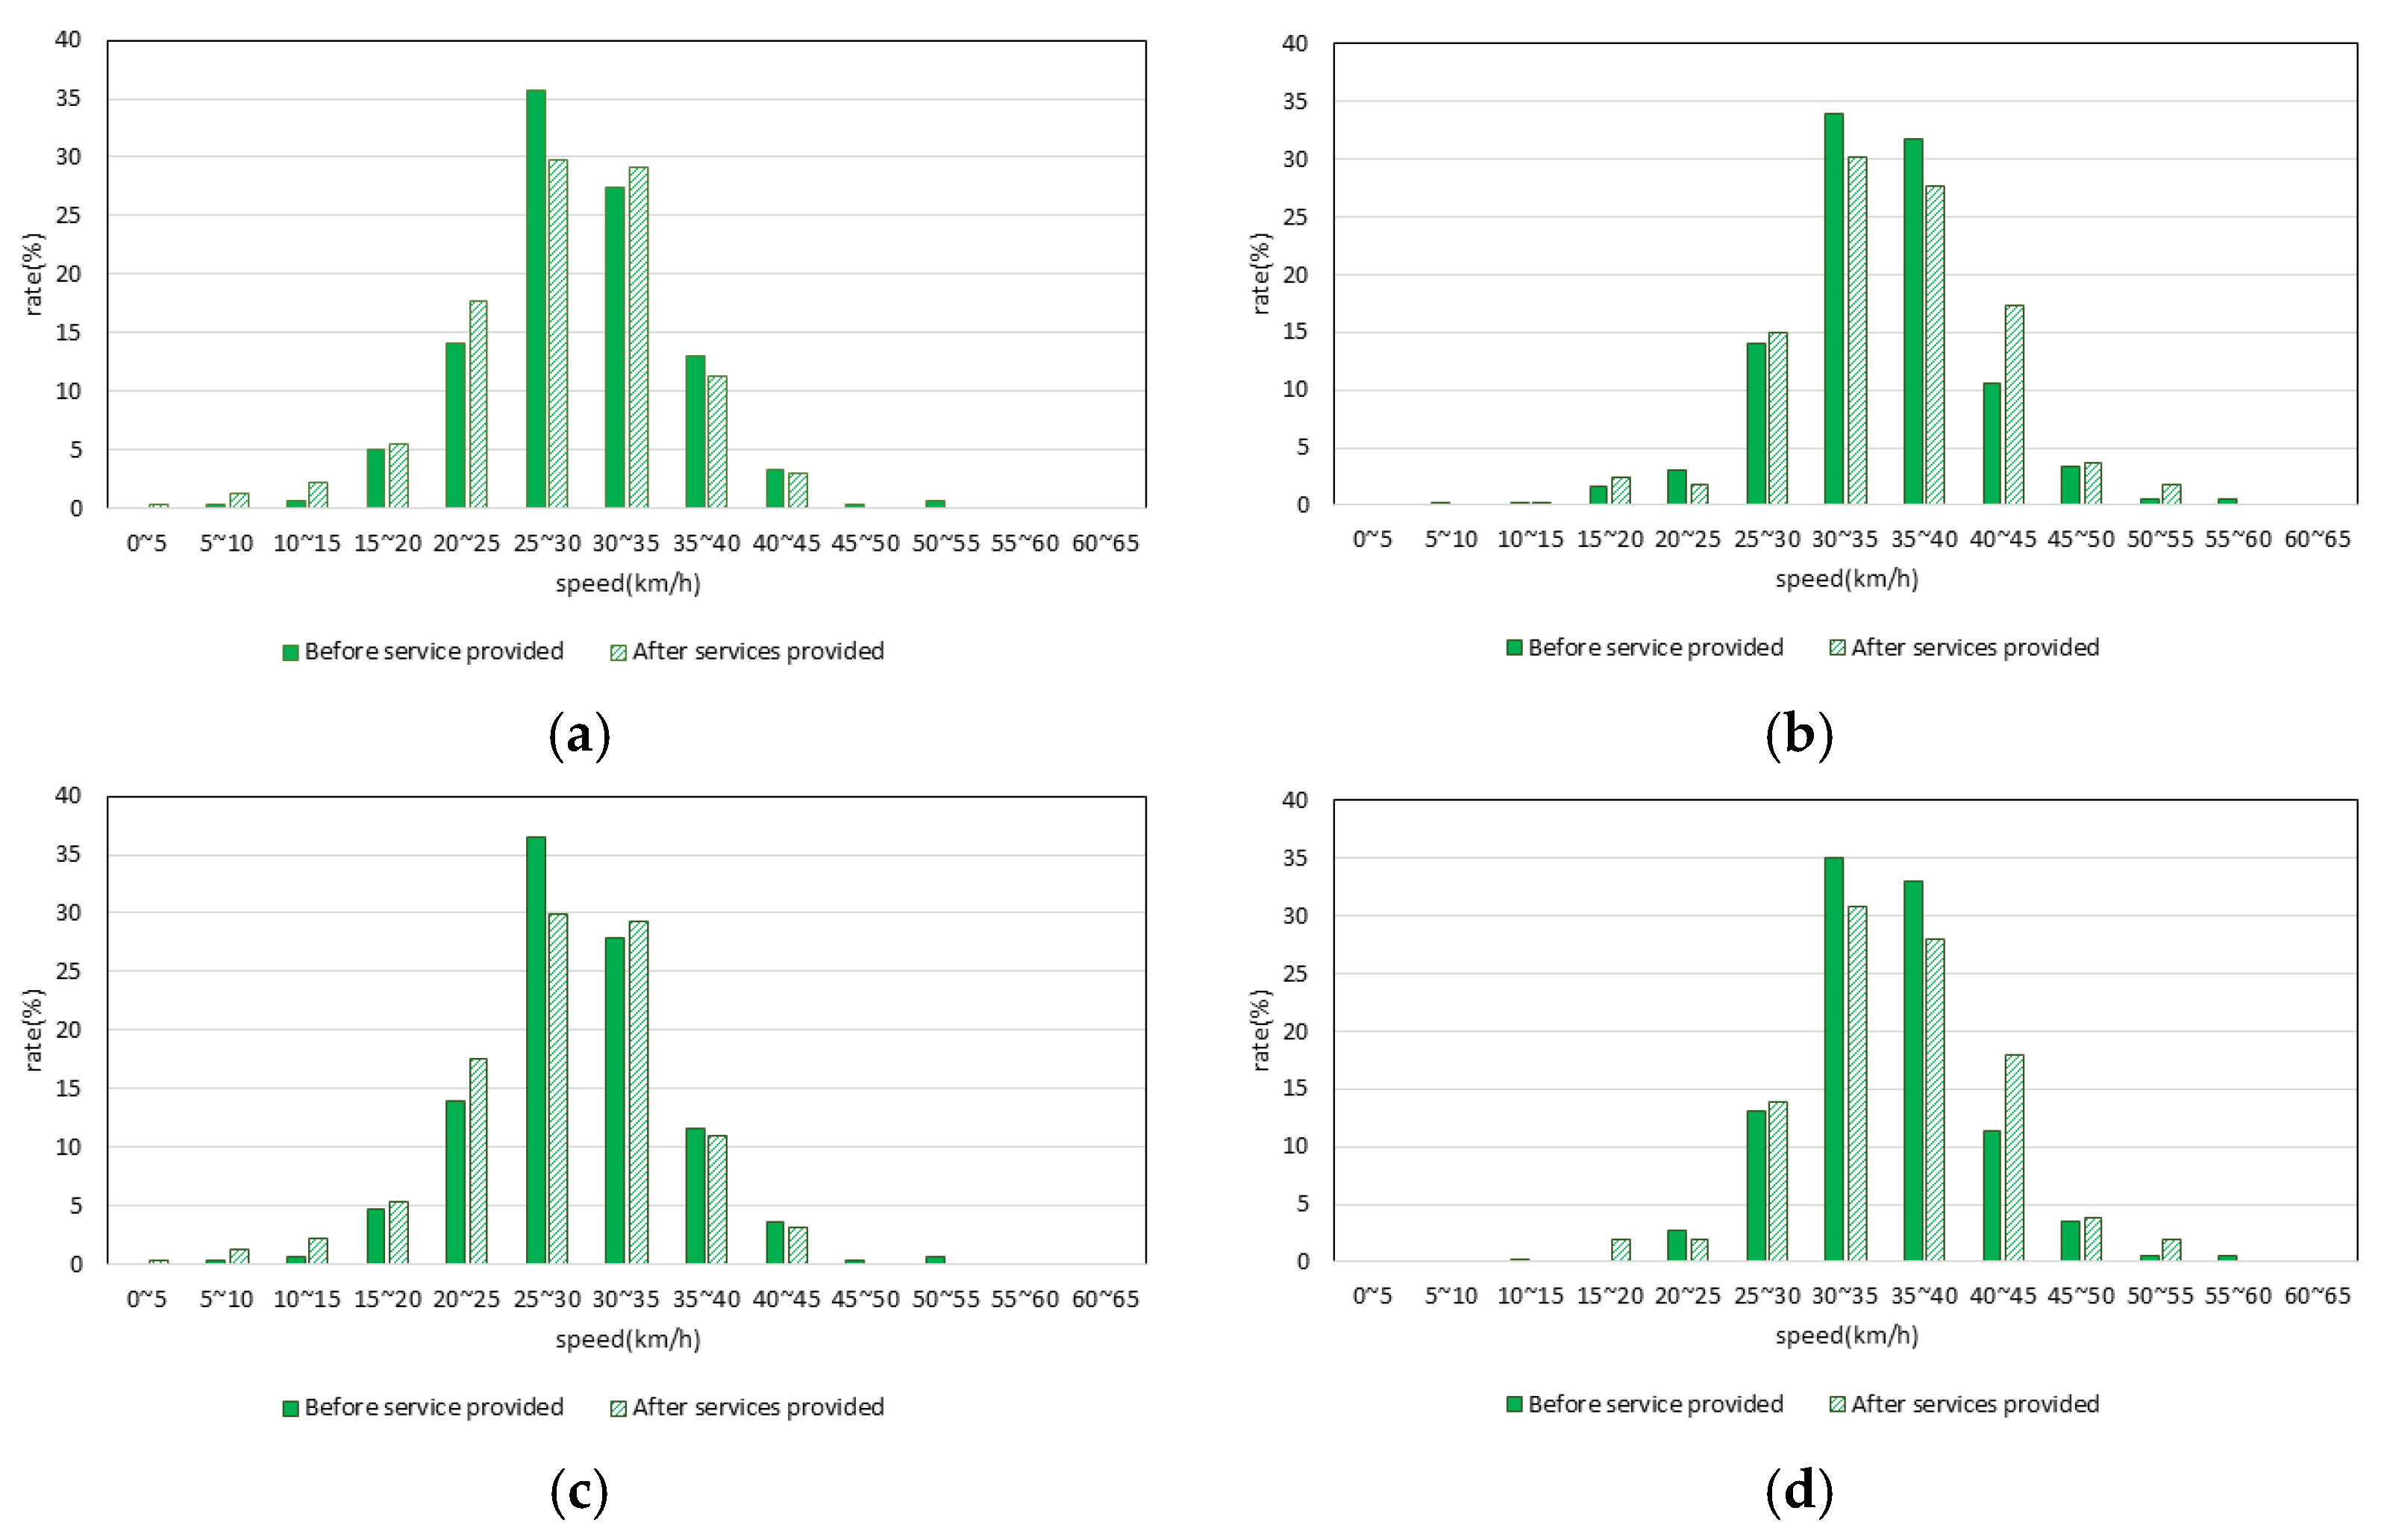
4.3.1. Wollang Elementary School

When looking into the analysis of the basic statistics of Wollang Elementary School by time band/survey point, as shown in Table 10, the daytime average point speed before service provision was 24.01 km/h at point 1 and 25.29 km/h at point 2, while that at night-time before service provision was 24.94 km/h at point 1 and 26.09 km/h at point 2. At both points, the average point speed was higher at night-time than in the daytime. After the service provision, it was 21.67 km/h at point 1 and 23.47 km/h at point 2 in the daytime, and 22.69 km/h at point 1 and 23.61 km/h at point 2 at night-time. In the same way, before the service provision, it was higher at night-time compared to the daytime. Looking at the change in the average point speed due to service provision, the average point speed decreased by 2.34 km/h at point 1 and 1.82 km/h at point 2, compared to before service provision in the daytime. In the case of night-time, it decreased by 2.26 km at point 1 and 2.49 km/h at point 2. Overall, the average point speed of vehicles after the service provision was found to decrease by 7.18% to 9.76%, compared to before the service provision.
In scenario 2, the average daytime speed of the vehicle was 23.07 km/h at point 1 and 26.71 km/h at point 2 before the service provision, and the average night-time speed of the vehicle was 24.40 km/h at point 1 and 27.46 km/h at point 2, thus being higher at night-time, as in scenario 1. After the service provision, it was 19.31 km/h at point 1 and 25.05 km/h at point 2 in the daytime, and 21.88 km/h at point 1 and 26.00 km/h at point 2 at night-time. Analysis of the average speed change after the service provision showed a decrease of 3.76 km/h at point 1 and 1.66 km/h at point 2 in the daytime, and a decrease by 2.52 km/h at point 1 and 1.46 km/h at point 2 at night-time. Overall, they decreased by 5.30% to 10.31% from before the service provision.
Looking at the characteristics of the change in average point speed by scenario, both scenarios showed a greater average point speed reduction at point 1 than at point 2 in the daytime; however, at night-time, scenario 1 showed a greater average point speed reduction at point 2, whereas scenario 2 showed a greater average point speed reduction at point 1.
Looking at the change in the speed of the vehicles approaching from point 2 to point 1, as shown in Table 11 and Figure 7, the average point speed before the service (548 vehicles) in scenario 1 decreased by 1.23 km/h (4.80%) from point 2 (25.60 km/h) to point 1 (24.37 km/h) and, after the service (492 vehicles), decreased by 1.45 km/h (6.17%) from point 2 (23.53 km/h) to point 1 (22.07 km/h). Looking at the change in average point speed due to service availability at the same point, at point 1 decreased by 2.29 km/h (9.42%) while, at point 2, it decreased by 2.07 km/h (8.10%).
In scenario 2, before the service (335 vehicles), it decreased by 3.40 km/h (12.61%) from point 2 (27.01 km/h) to point 1 (23.60 km/h), while after the service (288 vehicles) it decreased by 5.11 (20.12%) from point 2 25.42 km/h to point 1 20.30 km/h. In addition, analysis at the same point showed a decrease at point 1 by 3.30 km/h (13.99%) and point 2 by 1.59 km/h (5.90%). Analysis of the change in speed at different points in the direction of the vehicle’s progress showed that, for both scenarios, a decrease in the speed of the vehicle at all points was clearly observed.
Looking at the speed distribution of individual vehicles by survey point and by scenario, as shown in Table 12 and Figure 8, before the service provision at point 1, for scenario 1, it was 30.84% in the 20–25 km/h section and 29.93% in the 25–30 km/h section; for scenario 2, it was 32.96% in the 20–25 km/h section and 25.63% in the 25–30 km/h section. In the case of point 2, scenario 1 showed 27.92% in the 20–25 km/h section and 32.66% in the 25–30 km/h section; for scenario 2, we observed 25.63% in the 20–25 km/h section and 34.93% in the 25–30 km/h section.
The speed distribution after the service provision at point 1 for scenario 1 showed 23.17% in the 15–20 km/h section and 23.98% in the 20–25 km/h section; while scenario 2 showed 22.57% in the 15–20 km/h section and 27.08% in the 20–25 km/h section. In the case of point 2, scenario 1 showed 25.20% in the 20–25 km/h section and 27.44% in the 25–30 km/h section; while scenario 2 showed 34.03% in the 20–25 km/h section and 29.51% in the 25–30 km/h section.
Meanwhile, in the child protection zone before Wollang Elementary School, vehicles are regulated to travel below the speed limit of 30 km/h. Looking at the ratio of the vehicles keeping the speed limit before and after the service provision, in the case of point 1 for scenario 1, it increased from 82.66% before to 83.74% after service provision; for scenario 2, it increased from 84.51% before to 90.63% after service provision. In addition, in the case of point 2 for scenario 1, the proportion of vehicles complying with the prescribed speed limit increased from 77.37% before to 82.11% after service provision and 71.27% before to 79.51% after service provision.

4.3.2. Borim Pharmacy

According to a basic statistical analysis by survey time band/point of Borim Pharmacy, as shown in Table 13, the average vehicle speed in the daytime before service provision in scenario 1 was 29.56 km/h at point 1 and 34.09 km/h at point 2, while that at night-time was 29.53 km/h at point 1 and 35.12 km/h at point 2. The average point speed at point 2 at night-time was higher, while that at point 1 was higher in the daytime. After the service provision, the average speed at both points was lower at night, compared to daytime, with 29.47 km/h at point 1 and 36.19 km/h at point 2 in the daytime, and 27.74 km/h at point 1 and 34.16 km/h at point 2 at night-time. Looking at the change in the average point speed due to service provision, the average point speed of the vehicle decreased by 0.31 km/h at point 1 and increased by 2.10 km/h at point 2 in the daytime. In the case of night-time, it decreased by 1.79 km/h at point 1 and decreased by 0.96 km at point 2, indicating that it increased or decreased by −6.06% to 6.17%, compared to before service provision.
In scenario 2, it was 29.56 km/h at point 1 and 34.79 km/h at point 2 in the daytime prior to service provision, and it was 29.41 km/h at point 1 and 35.38 km/h at point 2 at night-time. The average point speed change showed similar patterns to scenario 1. After the service provision, it was 29.67 km/h at point 1 and 36.70 km/h at point 2 in the daytime while, at night, it was 27.59 km/h at point 1 and 34.31 km/h at point 2. Analyzing the average point speed change resulting from service provision showed an increase by 0.11 km/h at point 1 and 1.91 km/h at point 2 in the daytime, and a decrease by 1.82 km/h at point 1 and 1.06 km/h at point 2 at night-time. Overall, it showed a −6.19–5.50% increase or decrease, compared to before service provision.
Looking at the characteristics of the change in average point speed by scenario, in the daytime, scenario 1 showed decreased point speed at point 1, while scenario 2 showed increased point speed at point 1, and both scenarios showed an increase in the average point speed of the vehicle at point 2. At night, two scenario analyses showed that the average point speed reduction of the vehicle at point 1 was greater than at point 2.
Looking at the change in the speed of vehicles when approaching from point 2 to point 1 at Borim Pharmacy, as shown in Table 14 and Figure 9, the average point speed before service provision (362 vehicles) in scenario 1 decreased from 34.51 km/h at point 2 to 29.55 km/h at point 1 (14.39%), and the average point speed after service provision (329 vehicles) decreased from 35.02 km/h at point 2 to 28.47 km/h at point 1. Looking at the change in the average point speed due to the service provider for the same point, at point 1, it decreased by 1.08 km/h (3.65%) while, at point 2, it increased by 0.50 km/h (1.46%).
In scenario 2, the average point speed before service provision (337 vehicles) decreased by 5.54 km/h (15.82%), from 35.04 km/h at point 2 to 29.50 km/h at point 1; while, after service provision (318 vehicles), it decreased by 6.85 km/h (19.40%), from 35.33 km/h at point 2 to 28.47 km/h at point 1. Analysis for the same point showed that, at point 1, it decreased by 1.02 km/h (3.46%); while, at point 2, it increased by 0.29 km/h (0.82%).
Looking at the speed distribution of individual vehicles by survey point and scenario, as shown in Table 15 and Figure 10, before service point 1 showed 35.64% in the 25–30 km/h section and 27.35% in the 30–35 km/h section for scenario 1; for scenario 2, it was 36.50% in the 25–30 km/h section and 27.89% in the 30–35 km/h section. For both scenarios, it was highest in the 25–30 km/h section. At point 2, for Scenario 1, 33.98% in the 30–35 km/h section and 31.77% in the 35–40 km/h section were observed; in Scenario 2, it was 35.01% in the 30–35 km/h section and 32.94% in the 35–40 km/h section.
The point 1 after-service speed distribution was 29.79% in the 25–30 km/h section and 29.18% in the 30 km/h section for scenario 1; while it was 29.87% in the 25–30 km/h section and 29.25% in the 30 km/h section for scenario 2. In case of point 2, scenario 1 showed 30.09% in the 30–35 km/h section and 27.66% in the 35–40 km/h section; while scenario 2 showed 30.82% in the 30–35 km/h section and 27.99% in the 35–40 km/h section.
Meanwhile, as Borim Pharmacy plans to limit the speed to 50 km/h, according to the domestic “Safety Speed 5030” [25] policy, we analyzed the ratio of vehicles that complied with the speed limit before and after service at 50 km/h. As a result of the analysis, in scenario 1 at point 1, it increased from 99.45% before to 100.00% after service provision; in scenario 2, it increased from 99.41% before to 100.00% after service provision. On the other hand, in the case of point 2, in scenario 1, it decreased from 98.90% before to 98.18% after service provision; while in scenario 2, it decreased from 98.81% before to 98.11% after service provision.

4.4. Preliminary Conclusions

In the analysis of the approaching speed change of vehicles at crosswalks for Wollang Elementary School, for scenario 1 it decreased by 6.17% after service provision, while it decreased by 4.80% before service provision; for scenario 2, it decreased by 20.12% after service provision, while it decreased by 12.61% before service provision. The service increased the reduction in the vehicle approaching speed at crosswalks. In addition, we found that the proportion of vehicles complying with the vehicle speed limit of 30 km/h in the child protection zone increased by 1.08% to 8.24%, depending on the survey point and the scenario. For Borim Pharmacy, for scenario 1, the approaching speed at crosswalks decreased by 18.69% after service provision, while it decreased by 14.39% before service provision; for scenario 2, it decreased by 15.82% before service provision, while it decreased by 19.40% after service provision. In a similar manner as Wollang Elementary School, the service provision increased the reduction in the vehicle approaching speed at crosswalks. The proportion of vehicles complying with the vehicle speed limit of 50 km/h for both scenarios increased by 0.55% to 0.59% at point 1, and decreased by 0.70 to 0.72% at point 2.
On the other hand, a collision of a vehicle with a pedestrian using a human model at different speeds test, conducted in Korea [26], has shown that the possibility of serious injury is 72.7% at a vehicle speed of 50 km/h, which is reduced to 15.4% at 30 km/h. Based on these results, it is necessary to look at the change in the proportion of vehicles traveling below 30 km/h, when considering the service provision effect in this study. First, at Wollang Elementary School, it increased by about 1.08% at point 1 and about 4.74% at point 2 for Scenario 1, due to the service provision, and about 6.12% at point 1 and about 8.24% at point 2 for Scenario 2. In addition, at Borim Pharmacy, it increased by about 1.01% at point 1 and about 0.09% at point 2 for Scenario 1, and about 0.51% at point 1, and about 1.59% at point 2 for Scenario 2. Therefore, as mentioned in the introduction, we derived results corresponding to our secondary purpose of providing pedestrian safety services. However, considering the extent of effect by demonstration point, Wollang Elementary School, with the characteristics of a child protection zone, showed a greater effect than Borim Pharmacy, with a general road characteristic.

5. Conclusions

In this study, we aimed to quantitatively analyze the effectiveness of providing pedestrian safety services developed to improve pedestrian traffic safety. We performed a demonstration analysis by installing pedestrian safety service systems consisting of the same set-up at two different sites (Wollang Elementary School and Borim Pharmacy). As the effectiveness indicators of the analysis, we selected the speed of vehicles, which is closely related to the fatality rate of pedestrian accidents, and compared and analyzed the changes in the point speed of the vehicles near the crosswalk (point 1) and at the point where sufficient information recognition is deemed possible (point 2).
According to the analysis, the average point speed of the vehicles approaching Wollang Elementary School—a demonstration site in a child protection zone—reduced for both scenarios in the daytime and at night-time, at the survey points, compared to before service provision. At Borim Pharmacy, it was found that the average vehicle speed increased in the daytime point 2 of scenario 1 and the daytime points 1 and 2 of scenario 2, but we found that, during the night-time, it decreased at each point in all scenarios.
In terms of changes in the speed of vehicles approaching from point 2 to point 1, at both Wollang Elementary School and Borim Pharmacy we saw a greater rate of decrease in the point speed of vehicles, compared to before service provision. Furthermore, analysis of the speed distribution change at each demonstration point showed an increase in the percentage of vehicles complying with the speed limit (30 km/h or less) for all survey points at Wollang Elementary School, compared to before service provision; however, a partial decrease in the percentage of vehicles complying with the speed limit (50 km/h or less) was observed for point 2 at Borim Pharmacy.
Considering the above analysis results, we believe that the provision of pedestrian safety services is not only effective in reducing the speed of vehicles but is also able to contribute significantly to improving pedestrian safety.
However, despite the same facilities and services, there may be points or time bands where or when they do not affect the speed reduction of the vehicle, as in the results of the daytime band analysis in Borim Pharmacy. There may be several factors to this effect but, in the case of Borim Pharmacy, we cannot rule out the effect of daytime driving characteristics with sufficient visibility, compared to night-time, and raised crossings that physically reduce the speed of the vehicle. In addition, looking at the characteristics of the demonstration points, it is necessary to consider the surrounding environment of traffic safety facilities when providing services on general roads, where the effect of providing pedestrian safety services was relatively insignificant, compared to areas with child protection zone characteristics, such as Wollang Elementary School.
Therefore, we presume that pedestrian safety services should be provided, in consideration of established traffic safety facilities or traffic-calming techniques. Furthermore, it is necessary to prevent indiscriminate system installation or service provision, by preparing guidelines for installing pedestrian safety systems and rules, including operation methods, in the future, as well as establishing systematic and standardized evaluation methods. In addition, we believe it is necessary to develop comprehensive analysis techniques that reflect the qualitative evaluation of local residents, such as applying a satisfaction survey in actual users, or by operating a Living Lab (as has been applied recently in the transportation sector). We did not carry out such evaluations in this study. In the future, it will be necessary to look more comprehensively at the results derived from data collection and analysis, for a large number of sites where such a system is installed and where the service is provided.

Author Contributions

Conceptualization, J.-H.K.; methodology, S.-H.S. and K.-M.H.; investigation, J.-H.K.; data analysis, K.-M.H. and S.-H.S.; visualization, K.-M.H.; writing—original draft preparation, K.-M.H.; writing—review and editing, J.-H.K., S.-H.S. and K.-M.H.; supervision, J.-H.K. All authors have read and agreed to the published version of the manuscript.

Funding

The APC was funded by Korea Institute of Civil Engineering and Building Technoloty (KICT).

Institutional Review Board Statement

Not applicable.

Informed Consent Statement

Not applicable.

Data Availability Statement

The data presented in this study are available on request from the corresponding author. The data are not publicly available due to data that also forms part of an ongoing study.

Conflicts of Interest

The authors declare no conflict of interest.

References

  1. The Road Traffic Authority. Statistic Analysis of Traffic Accident; The Road Traffic Authority: Wonju-si, Korea, 2010. [Google Scholar]
  2. Nilsson, G. Traffic Safety Dimensions and the Power Model to Describe the Effect of Speed on Safety; Bulletin 221; Lund Institute of Technology, Department of Technology and Society, Traffic Engineering: Lund, Switzerland, 2004. [Google Scholar]
  3. Shin, D.C.; Kim, H.M.; Choi, D.H. A Study on problems and countermeasures for School Zone. In Proceedings of the 34th Conference of KST, Korean Society of Transportation, Suwon-si, Korea, 7 November 1998. [Google Scholar]
  4. Jang, M.S.; Park, J.Y.; Kim, M.J.; Jeong, D.J. Improvement measures for traffic safety at school zone by roadway and accident characteristics. Korean Soc. Transp. Transp. Technol. Policy 2010, 7, 91–98. [Google Scholar]
  5. Maycock, G.; Brocklebank, P.; Hall, R. Road Layout Design Standards and Driver Behavior; Transport Research Laboratory Report, No. 332; Transportation Research Board: Crowthome, UK, 1998. [Google Scholar]
  6. Quimby, A.; Maycock, G.; Palmer, C.; Buttress, S. The Factors That Influence a Drivers’s Choice of Speed; Transport Research Laboratory Report, No. 325; Transportation Research Board: Crowthome, UK, 1999. [Google Scholar]
  7. Durkin, M.; Pheby, T. Aiming to Be the UK’s First Traffic Calmed City in Traffic Management and Road Safety; PTRC Education and Research Services Ltd.: London, UK, 1992. [Google Scholar]
  8. Brian, C.T. Impact speed and a pedestrian’s risk of severe injury or death. Accid. Anal. Prev. 2013, 50, 871–878. [Google Scholar]
  9. Ministry of Land, Infrastructure and Transport. Smart City National Model City Service Roadmap 1.0; Ministry of Land, Infrastructure and Transport: Sejong-si, Korea, 2019.
  10. IT Glossart. Available online: http://terms.naver.com/entry.nhn?docId=857175&cid=50376&categoryID=50376 (accessed on 3 May 2021).
  11. Jeon, N.Y.; Kim, S.J.; Choo, S.H.; Lee, H.S. A study on the application of living lab in transportation: Focused on the auto-image sensing signal system for pedestrian. J. Korea Inst. Intell. Transp. Syst. 2018, 17, 1–17. [Google Scholar] [CrossRef]
  12. Kim, J.H.; Ha, D.I.; Park, M.C.; Song, W.C.; Ha, T.J. Analysis of traffic safety facilities in pedestrian protection area: Focusing on variable speed limit signs and beacons. J. Korea Inst. Intell. Transp. Syst. 2017, 16, 121–133. [Google Scholar] [CrossRef]
  13. Yoon, Y.I.; Lee, S.B.; Lim, J.B.; Park, K.S.; Moon, J.S. Estimating traffic accident reduction effect of road safety facilities in intersections. J. Korean Soc. Transp. 2017, 35, 129–142. [Google Scholar] [CrossRef] [Green Version]
  14. Godavarthy, R.P.; Russell, E.R. Study of pedestrian hybrid beacon’s effectiveness for motorists at midblock pedestrian crossings. J. Traffic Transp. Eng. 2016, 6, 531–539. [Google Scholar] [CrossRef] [Green Version]
  15. Jin, M.S.; Lee, S.K. Pedestrians and drivers behaviour change by installation of crossing safety assistant system. J. Korea Inst. Intell. Transp. Syst. 2016, 15, 85–93. [Google Scholar] [CrossRef]
  16. Kim, S.O.; Kim, S.Y.; Lee, C.K.; Kim, I.S. A legislative proposal of speed limit in urban area. Korean Soc. Transp. Transp. Technol. Policy 2014, 11, 11–18. [Google Scholar]
  17. Lee, S.K. Alternative to improve the lighting of crosswalk on rural highways. J. Contents Assoc. 2013, 13, 435–443. [Google Scholar] [CrossRef] [Green Version]
  18. Kim, H.S.; Lee, Y.I. Accident Reduce Effect Analysis of Intersection Installing Scrambled Crosswal. In Proceedings of the 65th Conference of KST, Korean Society of Transportation, Goyang-si, Korea, 20–21 November 2011. [Google Scholar]
  19. Park, H.W.; Oh, Y.T.; Nam, B. Traffic Safety Facility Quantitative Effect Evaluation Methodology. In Proceedings of the 65th Conference of KST, Korean Society of Transportation, Goyang-si, Korea, 20–21 November 2011. [Google Scholar]
  20. Park, J.C. Analysis on the Effect for Prevention Facilities on Crosswalk Accident. Master’s Dissertation, Chonnam National University, Gwangju-si, Korea, 2007. [Google Scholar]
  21. Federal Highway Administration. Safety Effectiveness of the HAWK Pedestrian Crossing Treatment; Report No. FHWA-HRT-10-042; Federal Highway Administration: McLean, VA, USA, 2010.
  22. National Highway Traffic Safety Administration. Demonstration of Automated Speed Enforcement in School Zones in Porland, Oregon; Report DOT HS 810 764; U.S. Department of Transportation: Washington, DC, USA, 2006.
  23. Gates, T.J.; Hawins, H.G.; Ewart, R.T. Effectiveness of a Rear-Facing Flashing beacon in School Speed Limit Sign Assemblies. In Proceedings of the TRB 83rd Annual Meeting, Washington, DC, USA, 11–15 January 2004. [Google Scholar]
  24. Hyundai Marine & Insurance. Available online: https://blog.hi.co.kr/1747 (accessed on 29 July 2021).
  25. Korea National Police Agency & Ministry of Land, Infrastructure and Transport. Safety Speed 5030 Design Operation Manual; Korea National Police Agency & Ministry of Land, Infrastructure and Transport: Sejong-si, Korea, 2019.
  26. KOTSA (Korea Transportation Safety Authority). Available online: http://www.kotsa.or.kr/ind/prt/InqDetNANNewsData.do?bbsCd=203&bbsSn=11949 (accessed on 21 June 2021).
Figure 1. Conceptual diagram of field application.
Sustainability 13 09333 g001
Figure 2. Configuration of a pedestrian safety system.
Sustainability 13 09333 g002
Figure 3. Wolllang Elementary School, a demonstration point: (a) Before the system was installed; and (b) After the system was installed.
Sustainability 13 09333 g003
Figure 4. Borim Pharmacy, a demonstration point: (a) Before the system was installed; and (b) After the system was installed.
Sustainability 13 09333 g004
Figure 5. Vehicle speed survey points for analyzing the effect of the proposed system.
Sustainability 13 09333 g005
Figure 6. Vehicle speed survey equipment: (a) Wolllang Elementary School; and (b) Borim Pharmacy.
Sustainability 13 09333 g006
Figure 7. Average point speed change (Wollang Elementary School).
Sustainability 13 09333 g007
Figure 8. Wollang Elementary School, distribution of vehicle speed by point and scenario: (a) Scenario 1, Point 1; (b) Scenario 1, Point 2; (c) Scenario 2, Point 1; and (d) Scenario 2, Point 2.
Sustainability 13 09333 g008
Figure 9. Average point speed change (Borim Pharmacy).
Sustainability 13 09333 g009
Figure 10. Borim Pharmacy, distribution of vehicle speed by point by scenario: (a) Scenario 1, Point 1; (b) Scenario 1, Point 2; (c) Scenario 2, Point 1; and (d) Scenario 2, Point 2.
Sustainability 13 09333 g010
Table 1. Trend of traffic accidents and pedestrian accidents from 2010 to 2019 [1].
YearNumber of AccidentsNumber of Death
Persons (A)
Number of Injured
Persons (B)
Number of
Casualties (A + B)
TotalPedestrianRatioTotalPedestrian RatioTotalPedestrianRatioTotalPedestrianRatio
2010226,87849,35321.755505201036.51352,45850,39614.30357,96352,40614.64
2011221,71149,70122.425229199838.21341,39150,90714.91346,62052,90515.26
2012223,65650,11122.415392197736.67344,56551,46214.94349,95753,43915.27
2013215,35449,13022.815092192837.86328,71150,23515.28333,80352,16315.63
2014232,55250,31521.644762184338.70337,49751,59015.29342,25953,43315.61
2015232,03550,98021.974621176438.17350,40052,27014.92355,02154,03415.22
2016220,91748,48921.954292166238.72331,72049,74515.00336,01251,40715.30
2017216,33546,72821.604185161738.64322,82947,82714.81327,01449,44415.12
2018217,14845,24820.843781144338.16323,03746,45614.38326,81847,89914.66
2019229,60046,15020.103349127137.95341,71247,40613.87345,06148,67714.11
Average annual rate of change0.13−0.74−0.87−5.37−4.970.43−0.34−0.68−0.33−0.41−0.82−0.41
Source: Traffic accidents statistical analysis, Road Traffic Authority, 2010–2019.
Table 2. Pedestrian traffic accident trends [1].
DivisionNumber of Accidents and Number of Casualties% of Accidents and Number of Casualties
While CrossingWalking on StreetWalking on RoadsideWalking on SidewalkOthersSumWhile CrossingWalking on StreetWalking on RoadsideWalking on SidewalkOthersSum
2010No. of accidents21,78855914237291314,82449,35344.1511.338.595.9030.04100.00
Casualties23,145
(1063)
5853
(263)
4510
(145)
3152
(83)
15,746
(456)
52,406
(2010)
44.16
(52.89)
11.17
(13.08)
8.61
(7.21)
6.01
(4.13)
30.05
(22.69)
100.00
(100.00)
2011No. of accidents20,20545854093257918,23949,70140.659.238.245.1936.70100.00
Casualties21,530
(1028)
4829
(212)
4318
(121)
2816
(66)
19,412
(571)
52,905
(1998)
40.70
(51.45)
9.13
(10.61)
8.16
(6.06)
5.32
(3.30)
36.69
(28.58)
100.00
(100.00)
2012No. of accidents19,53739043577239920,69450,11138.997.797.144.7941.30100.00
Casualties20,876
(1003)
4138
(174)
3793
(94)
2622
(83)
22,010
(623)
53,439
(1977)
39.07
(50.73)
7.74
(8.80)
7.10
(4.75)
4.91
(4.20)
41.19
(31.51)
100.00
(100.00)
2013No. of accidents18,16533353119221622,29549,13036.976.796.354.5145.38100.00
Casualties19,374
(922)
3501
(162)
3280
(89)
2385
(58)
23,623
(697)
52,163
(1928)
37.14
(47.82)
6.71
(8.40)
6.29
(4.62)
4.57
(3.01)
45.29
(36.15)
100.00
(100.00)
2014No. of accidents17,54430592872218824,65250,31534.876.085.714.3549.00100.00
Casualties18,721
(883)
3207
(146)
3030
(80)
2410
(45)
26,065
(689)
53,433
(1843)
35.04
(47.91)
6.00
(7.92)
5.67
(4.34)
4.51
(2.44)
48.78
(37.38)
100.00
(100.00)
2015No. of accidents21,91343774567266817,45550,98042.988.598.965.2334.24100.00
Casualties23,347
(954)
4606
(183)
4762
(134)
2876
(47)
18,443
(446)
54,034
(1764)
43.21
(54.08)
8.52
(10.37)
8.81
(7.60)
5.32
(2.66)
34.13
(25.28)
100.00
(100.00)
2016No. of accidents26,82336223544162712,87348,48955.327.477.313.3626.55100.00
Casualties28,516
(1085)
3799
(146)
3692
(65)
1757
(31)
13,643
(335)
51,407
(1662)
55.47
(65.28)
7.39
(8.78)
7.18
(3.91)
3.42
(1.87)
26.54
(20.16)
100.00
(100.00)
2017No. of accidents25,38137473017162112,96246,72854.328.026.463.4727.74100.00
Casualties26,975
(974)
3907
(193)
3143
(68)
1756
(36)
13,663
(346)
49,444
(1617)
54.56
(60.24)
7.90
(11.94)
6.36
(4.21)
3.55
(2.23)
27.63
(21.4)
100.00
(100.00)
2018No. of accidents18,39047423196219416,72645,24840.6410.487.064.8536.97100.00
Casualties19,589
(794)
4944
(205)
3339
(69)
2371
(41)
17,656
(334)
47,899
(1443)
40.9
(55.02)
10.32
(14.21)
6.97
(4.78)
4.95
(2.84)
36.86
(23.15)
100.00
(100.00)
2019No. of accidents18,10147652705233518,24446,15039.2210.335.865.0639.53100.00
Casualties19,229
(652)
4944
(180)
2817
(41)
2504
(37)
19,183
(361)
48,677
(1271)
39.5
(51.30)
10.16
(14.16)
5.79
(3.23)
5.14
(2.91)
39.41
(28.40)
100.00
(100.00)
Average annual rate of changeNo. of accidents−2.04−1.76−4.86−2.432.33−0.74-
Casualties−2.04
(−5.29)
−1.86
(−4.13)
−5.09
(−13.09)
−2.52
(−8.59)
2.22
(−2.56)
−0.82
(−4.97)
Note: The number in ( ) shows the number of deaths and percentage of deaths by accident type. Source: Traffic accidents statistical analysis, Road Traffic Authority, 2010–2019.
Table 3. Classification and details of pedestrian safety services [9].
ClassificationDetails
Smart crosswalkProtect pedestrians through pedestrian detection system and vehicle detection system at crosswalks
School zone safety servicesProvide students with safety through vehicle speed control and crosswalk safety services in school zones
Smart road surface information sign serviceDisplay traffic sign information on the road surface near the crosswalk, providing it to pedestrians who intend to cross the crosswalk with their head down while using a smartphone
Source: Smart City National Model City Service Roadmap 1.0 (in Korean), Ministry of Land, Infrastructure, and Transport.
Table 4. System devices (or sensors).
No.Device & SensorSpecificationsImage
Pedestrian detection
(Thermal imaging camera)
-
Resolution: 160 × 120
-
Frame rate: 9 frames
-
Detector distance: 0–12 m
-
Input power: 12–42 V AC/DC
-
Power consumption: 3 W
Sustainability 13 09333 i001
Vehicle detection
(Radar sensor)
-
Input power: DC 7–12 V
-
Driving Current: Max. 400 mA
-
Output: On/Off or RS232 Serial Interface
-
Method: 24 GHz k-band
-
Operating temperature: −40–+85 °C
Sustainability 13 09333 i002
Provide information
(for driver/vehicle)
-
VMS
Size: width 400 mm, length 2000 mm, width 30 mm
Weight: 2.3 kg
LED Color: Red
Exterior/Internal Material: Aluminum
Operation temperature: −20–75 °C
Sustainability 13 09333 i003
-
LED floor warning light
Size: Diameter 160 mm, Height 60 mm
Weight: 2.2 kg
LED: 1 W per LED, 3 LEDs per side
Color: Yellow
Top plate/Bottom Plate material: Stainless 304/die-cast aluminum alloy
Operation temperature: −40–75 °C
Sustainability 13 09333 i004
Provide information
(for pedestrian)
-
VMS
Size: 330 mm (horizontal) × 330 mm (vertical)
LED Color: Yellow, Green, Red
Specification: High-brightness 5Φ LED
Case size: 400 mm × 800 mm × 60 mm
Sustainability 13 09333 i005
-
Speaker & Amplifiers
Specification: 15 W 8 ohm
Maximum input: RMS 15 W
Play band: 400–15,000 Hz
Size: 87 mm × 87 mm × 32 mm
Amplifier output: RMS 15 W mono
Sustainability 13 09333 i006
-
Warning Application
Bluetooth 4.0-based Advertising Broadcasting
Android only
Interlocking with external sensor signal
Smartphone sound, light, alarm pop-up control
Sustainability 13 09333 i007
Table 5. Pedestrian traffic safety system.
DivisionSystem
Information collecting
  • Pedestrian detector: Thermal image sensor-based image recognition sensor
  • (Driving) vehicle detector: Radar sensor
Information processing
  • Controller (information processing, peripheral device controlling, communication, and so on)
Information providingPedestrians
  • When a vehicle approaches at over 10 km/h,
[Vision]: Display alert images (logojector) on crosswalk floor
[Hearing]: Speaker notification information
[Touch sensation]: Output a vibration and alerting messages by smartphone App.
Vehicles
(Drivers)
  • When a pedestrian is detected in the crosswalk
[Floor alerting light]: Buried LED floor warning lamp switched on both sides of the crosswalk
[Road electrical sign]: Small Variable Message Sign (VMS) providing notifications and alerts
Table 6. Survey date and time span and day/night distinguished.
DivisionLocationDay or NightDate and Time Band
Before service providedWollang Elementary SchoolDay22 October 2019, 13:50–14:50
Night22 October 2019, 20:50–22:04
Borim PharmacyDay22 October 2019, 16:06–17:14
Night22 October 2019, 18:04–18:56
After services providedWollang Elementary SchoolDay14 November 2019, 14:11–15:25
Night14 November 2019, 19:46–20:40
Borim PharmacyDay15 November 2019, 10:00–11:00
Night14 November 2019, 18:06–19:03
Table 7. Analysis scenario.
DivisionDetails
Scenario 1Targeting the entire investigation data, from which the error data has been removed
Scenario 2Targeting the vehicles that reduced their speed while approaching from point 2 to point 1, when considering the data in scenario 1
Table 8. Speed data collected and their verification results.
DivisionLocationDaytime or Night-TimeData CollectedSpeed Error DataData Collection Time Error
(Point 2 > Point 1)
Final Data
Before service providedWollang Elementary SchoolDaytime33700337
Night-time21302211
Borim PharmacyDaytime21301212
Night-time15000150
After service providedWollang Elementary SchoolDaytime29601295
Night-time20215197
Borim PharmacyDaytime14304139
Night-time202111190
Table 9. T-test analysis of average point speed before and after service provided.
-Wollang Elementary SchoolBorim Pharmacy
DayNightDayNight
Survey Point 1Survey Point 2Survey Point 1Survey Point 2Survey Point 1Survey Point 2Survey Point 1Survey Point 2
t-statistic3.973.323.393.630.14−2.982.461.42
p-value8.3 × 10−59.7 × 10−47.5 × 10−43.2 × 10−48.9 × 10−13.2 × 10−31.4 × 10−21.6 × 10⁻¹
Table 10. Basic statistical analysis by time band/survey point (Wollang Elementary School).
-Scenario 1Scenario 2
Ave. SpeedStd. DeviationMin. SpeedMax. SpeedNo. of SamplesAve. SpeedStd. DeviationMin. SpeedMax. SpeedNo. of Samples
Before service (A)DayPoint 124.015.803.3239.6733723.076.023.3239.67213
Point 225.295.806.0040.7526.715.2113.8540.75
NightPoint 124.946.895.6546.2621124.407.105.6543.03142
Point 226.096.884.7143.2127.466.1312.7543.21
After service (B)DayPoint 121.678.583.2960.2329519.317.953.2937.23177
Point 223.477.683.5449.9225.055.9412.3949.92
NightPoint 122.696.535.2940.0819721.886.395.2939.67111
Point 223.616.954.5741.0726.005.0611.6041.07
Difference
(B-A)
DayPoint 1−2.34
(−9.76%)
-−3.76
(−16.30%)
-
Point 2−1.82
(−7.18%)
−1.66
(−6.22%)
NightPoint 1−2.26
(−9.05%)
−2.52
(−10.31%)
Point 2−2.49
(−9.53%)
−1.46
(−5.30%)
The figures inside ( ) mean the decrease rate of the vehicle average point speed, compared to before the service provision.
Table 11. Analysis of average point speed change (Wollang Elementary School).
-Scenario 1Scenario 2
VehiclesPoint 1 (C)Point 2 (D)Diff.
(D-C)
VehiclesPoint 1 (C′)Point 2 (D′)Diff.
(D′-C′)
Before service (A)548
(Day 337 + Night 221)
24.3725.60−1.23
(−4.80%)
355
(Day 213 + Night 142)
23.6027.01−3.40
(−12.61%)
After service (B)492
(Day 295 + Night 197)
22.0723.53−1.45
(−6.17%)
288
(Day 177 + Night 111)
20.3025.42−5.11
(−20.12%)
Diff
(B-A)
-−2.29
(−9.42%)
−2.07
(−8.10%)
--−3.30
(−13.99%)
−1.59
(−5.90%)
-
The value in parentheses is the average speed reduction rate of vehicles compared to before service provision.
Table 12. Distribution of vehicle average point speed change (Wollang Elementary School).
SpeedScenario 1Scenario 2
Before ServiceAfter ServiceBefore ServiceAfter Service
Point 1Point 2Point 1Point 2Point 1Point 2Point 1Point 2
Vehicle%Vehicle%Vehicle%Vehicle%Vehicle%Vehicle%Vehicle%Vehicle%
0~530.5510.1871.4230.6130.8500.0072.4300.00
5~1061.0991.64285.69265.2861.6900.00269.0300.00
10~15325.84162.92499.96367.32246.7661.693512.1593.13
15~207914.426612.0411423.178016.265916.62329.016522.573712.85
20~2516930.8415327.9211823.9812425.2011732.969125.637827.089834.03
25~3016429.9317932.669619.5113527.449125.6312434.935017.368529.51
30~357613.879417.156012.207014.234612.967721.69227.644716.32
35~40173.10244.38173.46163.2582.25205.6351.74103.47
40~4510.1861.0910.2010.2010.2851.4100.0010.35
45~5010.1800.0010.2010.2000.0000.0000.0010.35
50~5500.0000.0000.0000.0000.0000.0000.0000.00
55~6000.0000.0000.0000.0000.0000.0000.0000.00
60~6500.0000.0010.2000.0000.0000.0000.0000.00
Total548100548100492100492100355100355100288100288100
≤3045382.6642477.3741283.7440482.1130084.5125371.2726190.6322979.51
Table 13. Basic statistical analysis by time band/survey point (Borim Pharmacy).
-Scenario 1Scenario 2
Ave. SpeedStd. DeviationMin. SpeedMax. SpeedNo. of SamplesAve. SpeedStd. DeviationMin. SpeedMax. SpeedNo. of Samples
Before service (A)DayPoint 129.566.0114.4743.3321229.565.9814.4743.33194
Point 234.096.119.1548.3134.795.4020.3448.31
NightPoint 129.536.389.0852.5915029.416.369.0852.59143
Point 235.126.1910.9058.2335.386.0310.9058.23
After service (B)DayPoint 129.475.9711.4442.9713929.675.8511.4442.97135
Point 236.196.7111.3651.3036.705.9725.8851.30
NightPoint 127.747.013.5144.8719027.597.063.5144.87183
Point 234.166.2417.0250.5634.316.2617.0250.56
Difference
(B-A)
DayPoint 1−0.09
(−0.31%)
-0.11
(0.39%)
-
Point 22.10
(6.17%)
1.91
(5.50%)
NightPoint 1−1.79
(−6.06%)
−1.82
(−6.19%)
Point 2−0.96
(−2.74%)
−1.06
(−3.01%)
The figures in ( ) mean the decrease rate of the vehicle average point speed, compared to before the service provision.
Table 14. Analysis of average point speed change (Borim Pharmacy).
-Scenario 1Scenario 2
VehiclesPoint 1 (C)Point 2 (D)Diff. (D-C)VehiclesPoint 1 (C′)Point 2 (D′)Diff. (D′-C′)
Before service (A)362
(Day 212 + Night 150)
29.5534.51−4.97
(−14.39%)
337
(Day 194 + Night 143)
29.5035.04−5.54
(−15.82%)
After service (B)329
(Day 139 + Night 190)
28.4735.02−6.55
(−18.69%)
318
(Day 135 + Night 183)
28.4735.33−6.85
(−19.40%)
Diff.
(B-A)
-−1.08
(−3.65%)
0.50 (1.46%)--−1.02
(−3.46%)
0.29 (0.82%)-
The value in parentheses is the average speed reduction rate of vehicles, compared to before service provision.
Table 15. Average speed change distribution (Borim Pharmacy).
SpeedScenario 1Scenario 2
Before ServiceAfter ServiceBefore ServiceAfter Service
Point 1Point 2Point 1Point 2Point 1Point 2Point 1Point 2
Vehicle%Vehicle%Vehicle%Vehicle%Vehicle%Vehicle%Vehicle%Vehicle%
0~500.0000.0010.3000.0000.0000.0010.3100.00
5~1010.2810.2841.2200.0010.3000.0041.2600.00
10~1520.5510.2872.1310.3020.5910.3072.2000.00
15~20184.9761.66185.4782.43164.7500.00175.3561.89
20~255114.09113.045817.6361.824713.9592.675617.6161.89
25~3012935.645114.099829.794914.8912336.504413.069529.874413.84
30~359927.3512333.989629.189930.099427.8911835.019329.259830.82
35~404712.9811531.773711.259127.663911.5711132.943511.018927.99
40~45123.313810.50103.045717.33123.563811.28103.145717.92
45~5010.28123.3100.00123.6510.30123.5600.00123.77
50~5520.5520.5500.0061.8220.5920.5900.0061.89
55~6000.0020.5500.0000.0000.0020.5900.0000.00
60~6500.0000.0000.0000.0000.0000.0000.0000.00
Total362100362100329100329100337100337100318100318100
≤5036099.4535898.9032910032398.1833599.4133398.8131810031298.11
Publisher’s Note: MDPI stays neutral with regard to jurisdictional claims in published maps and institutional affiliations.

