Improving Residential Load Disaggregation for Sustainable Development of Energy via Principal Component Analysis

 ,
,  ,
, 
 and
and 
Abstract
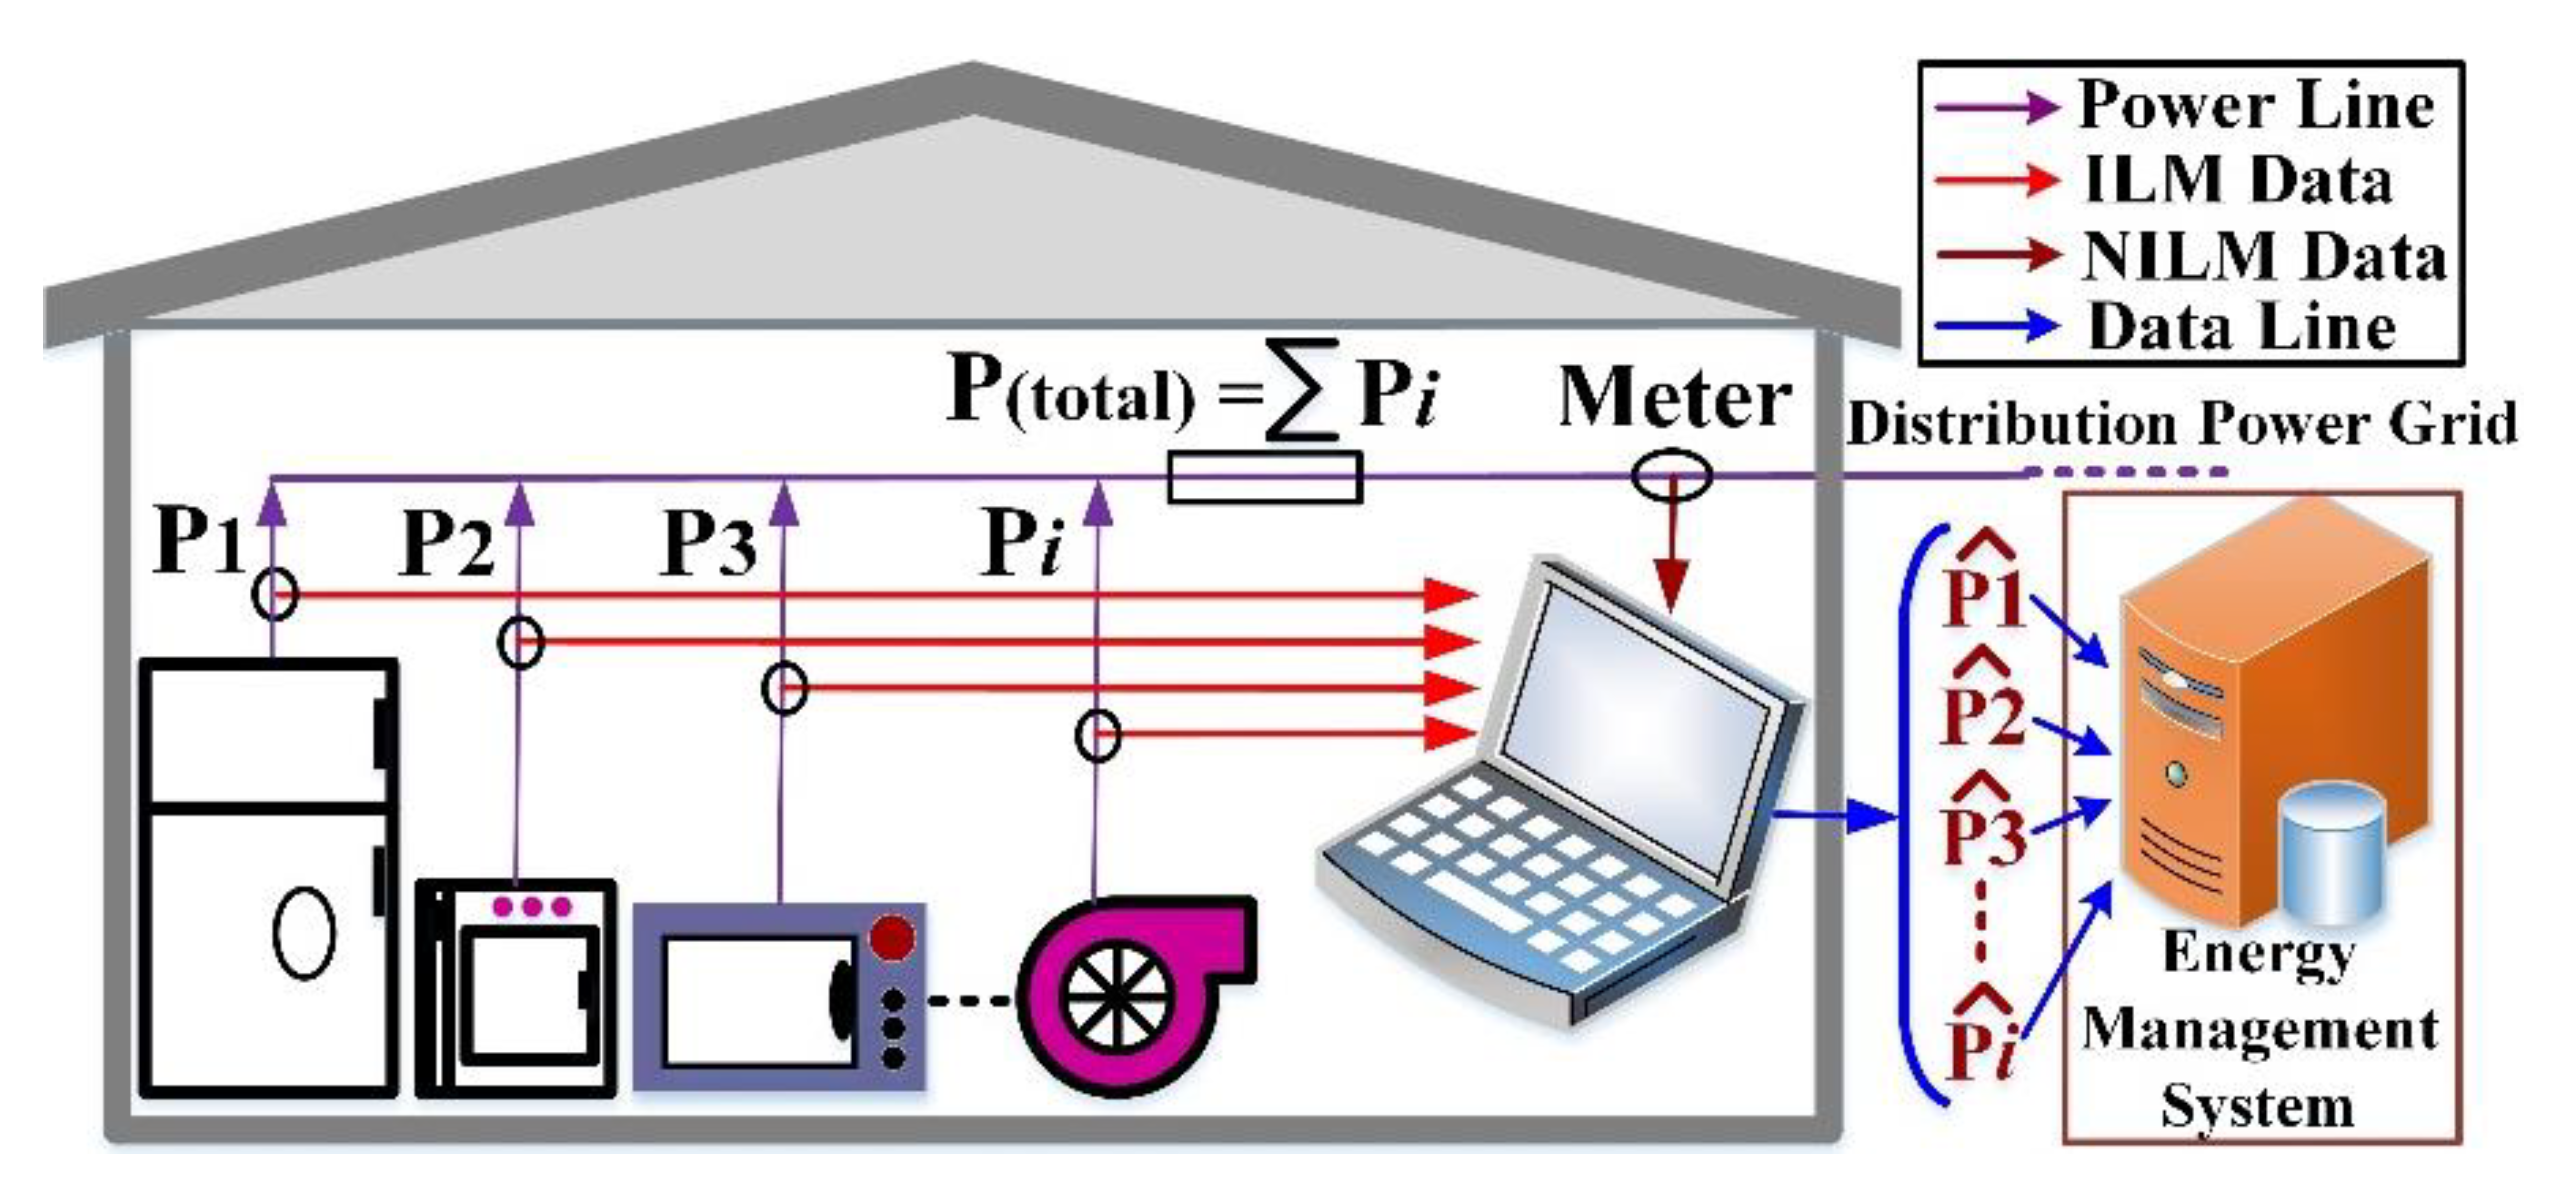
:1. Introduction
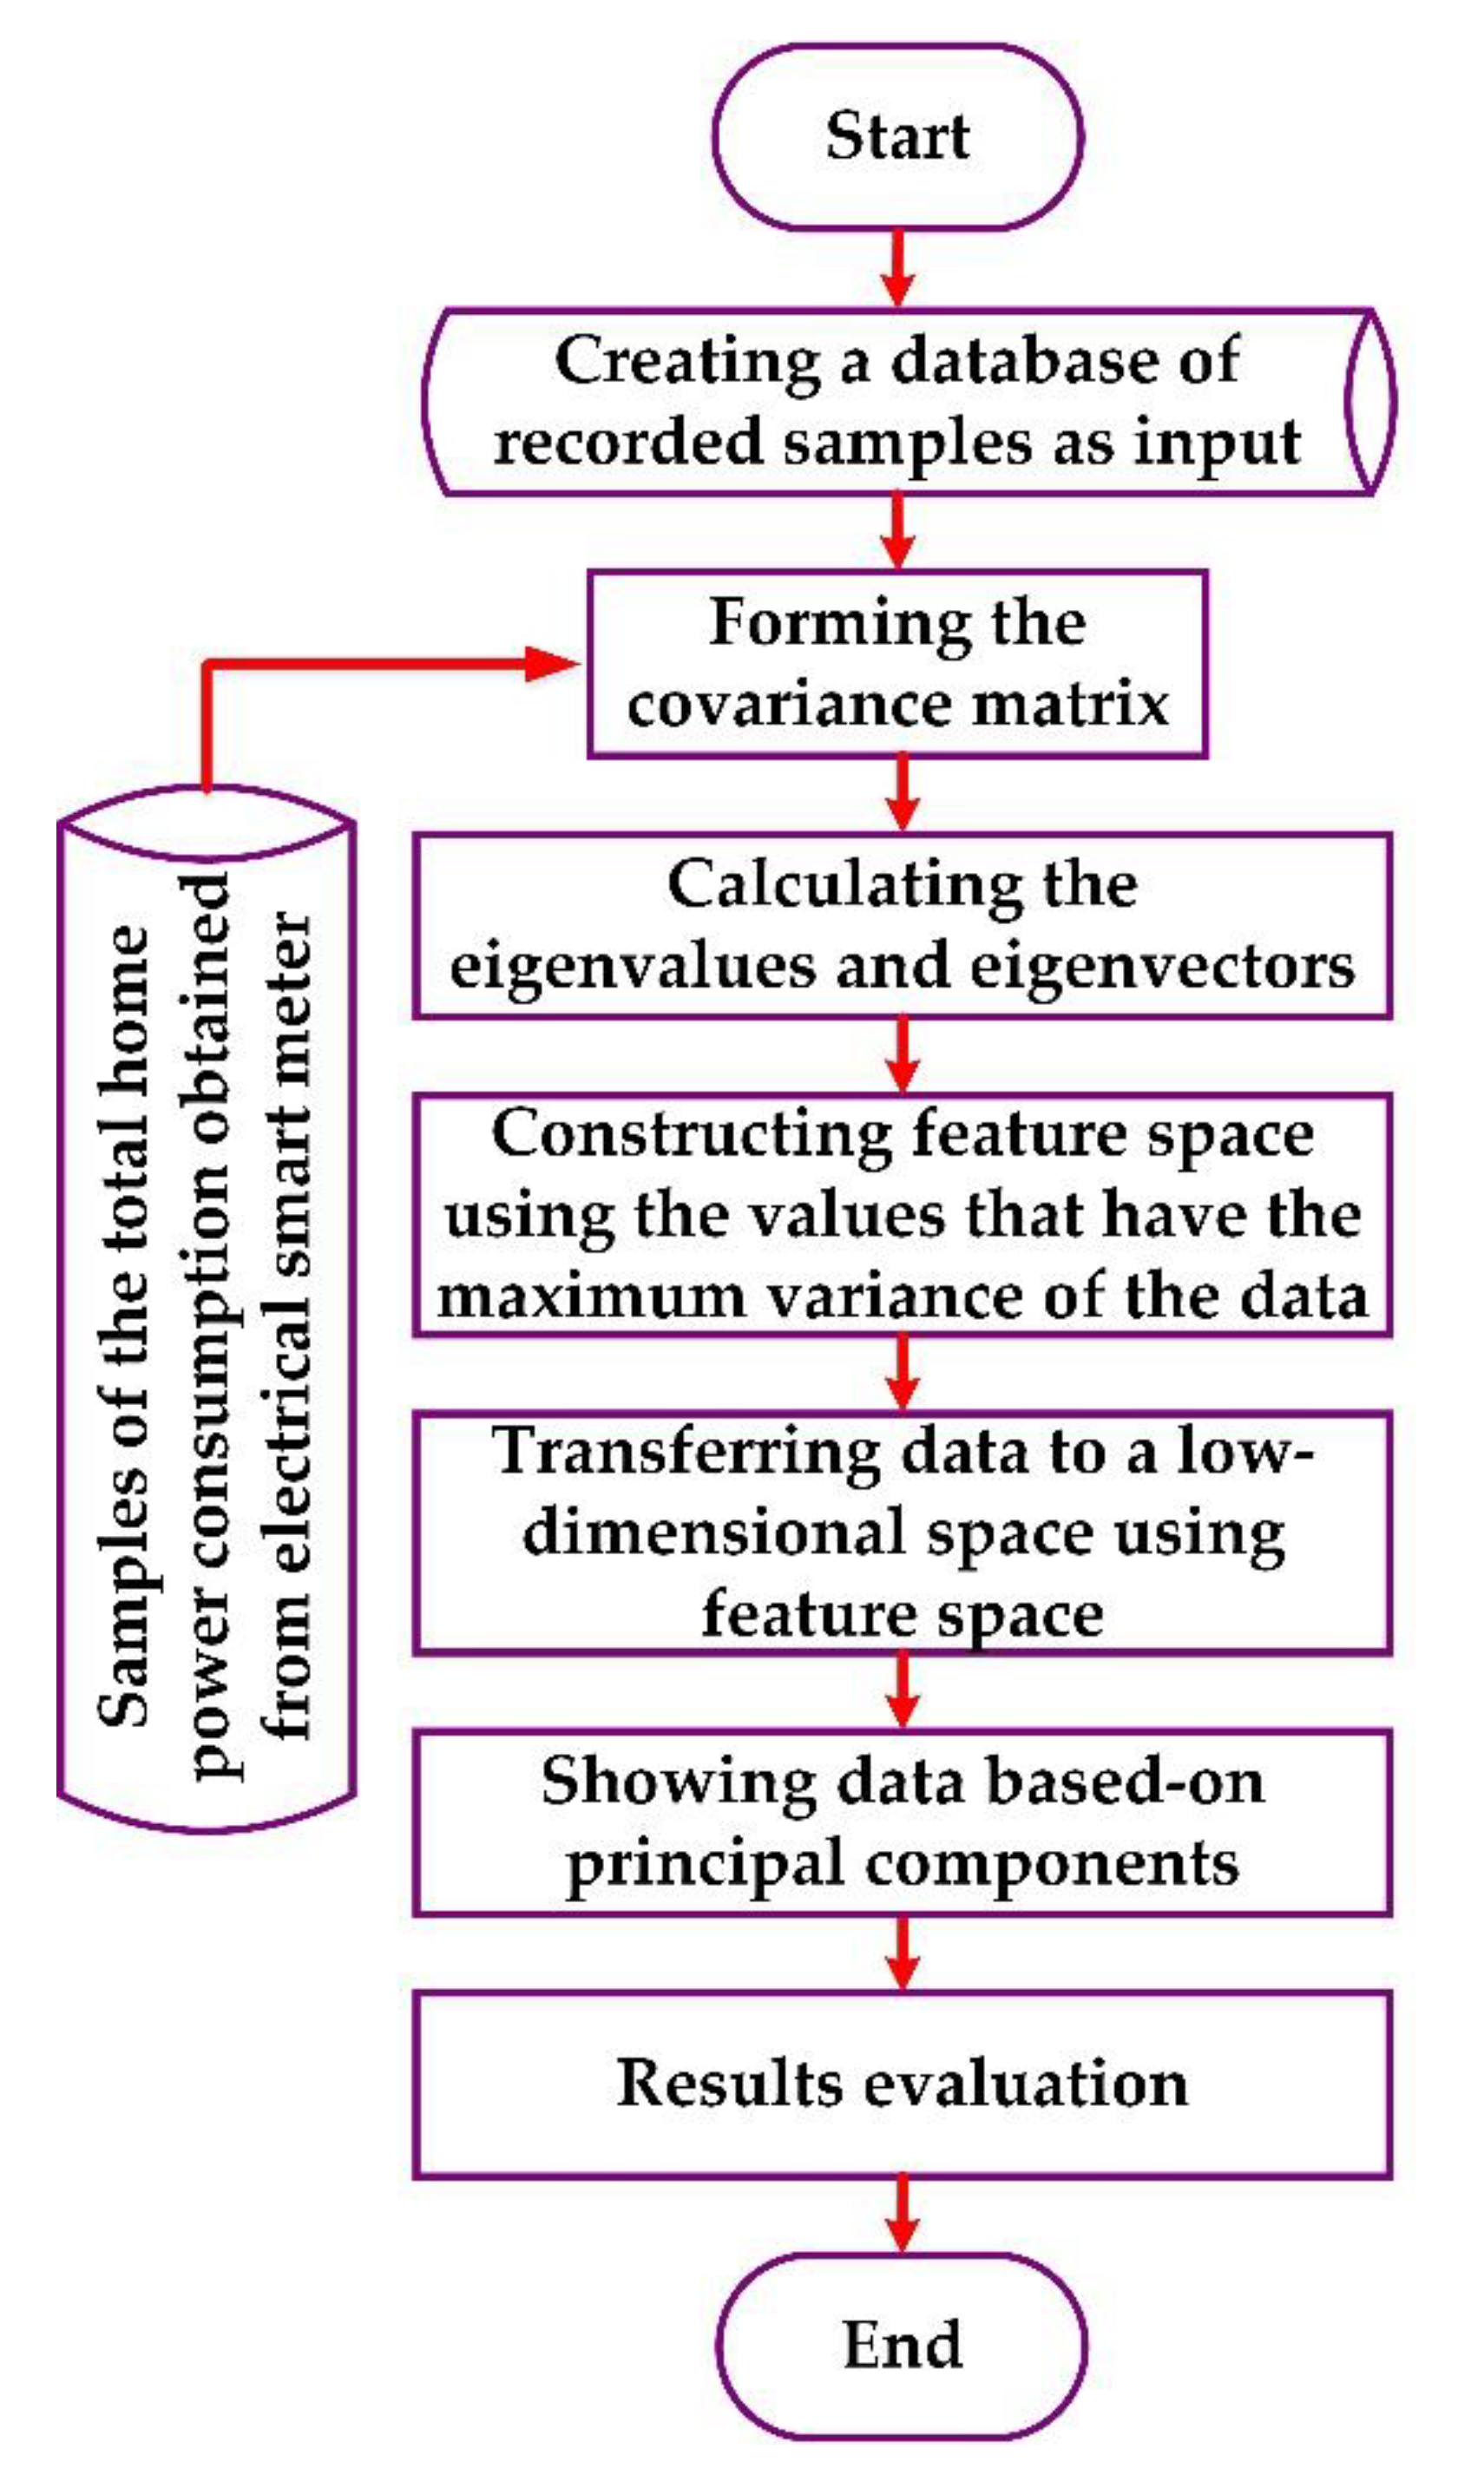
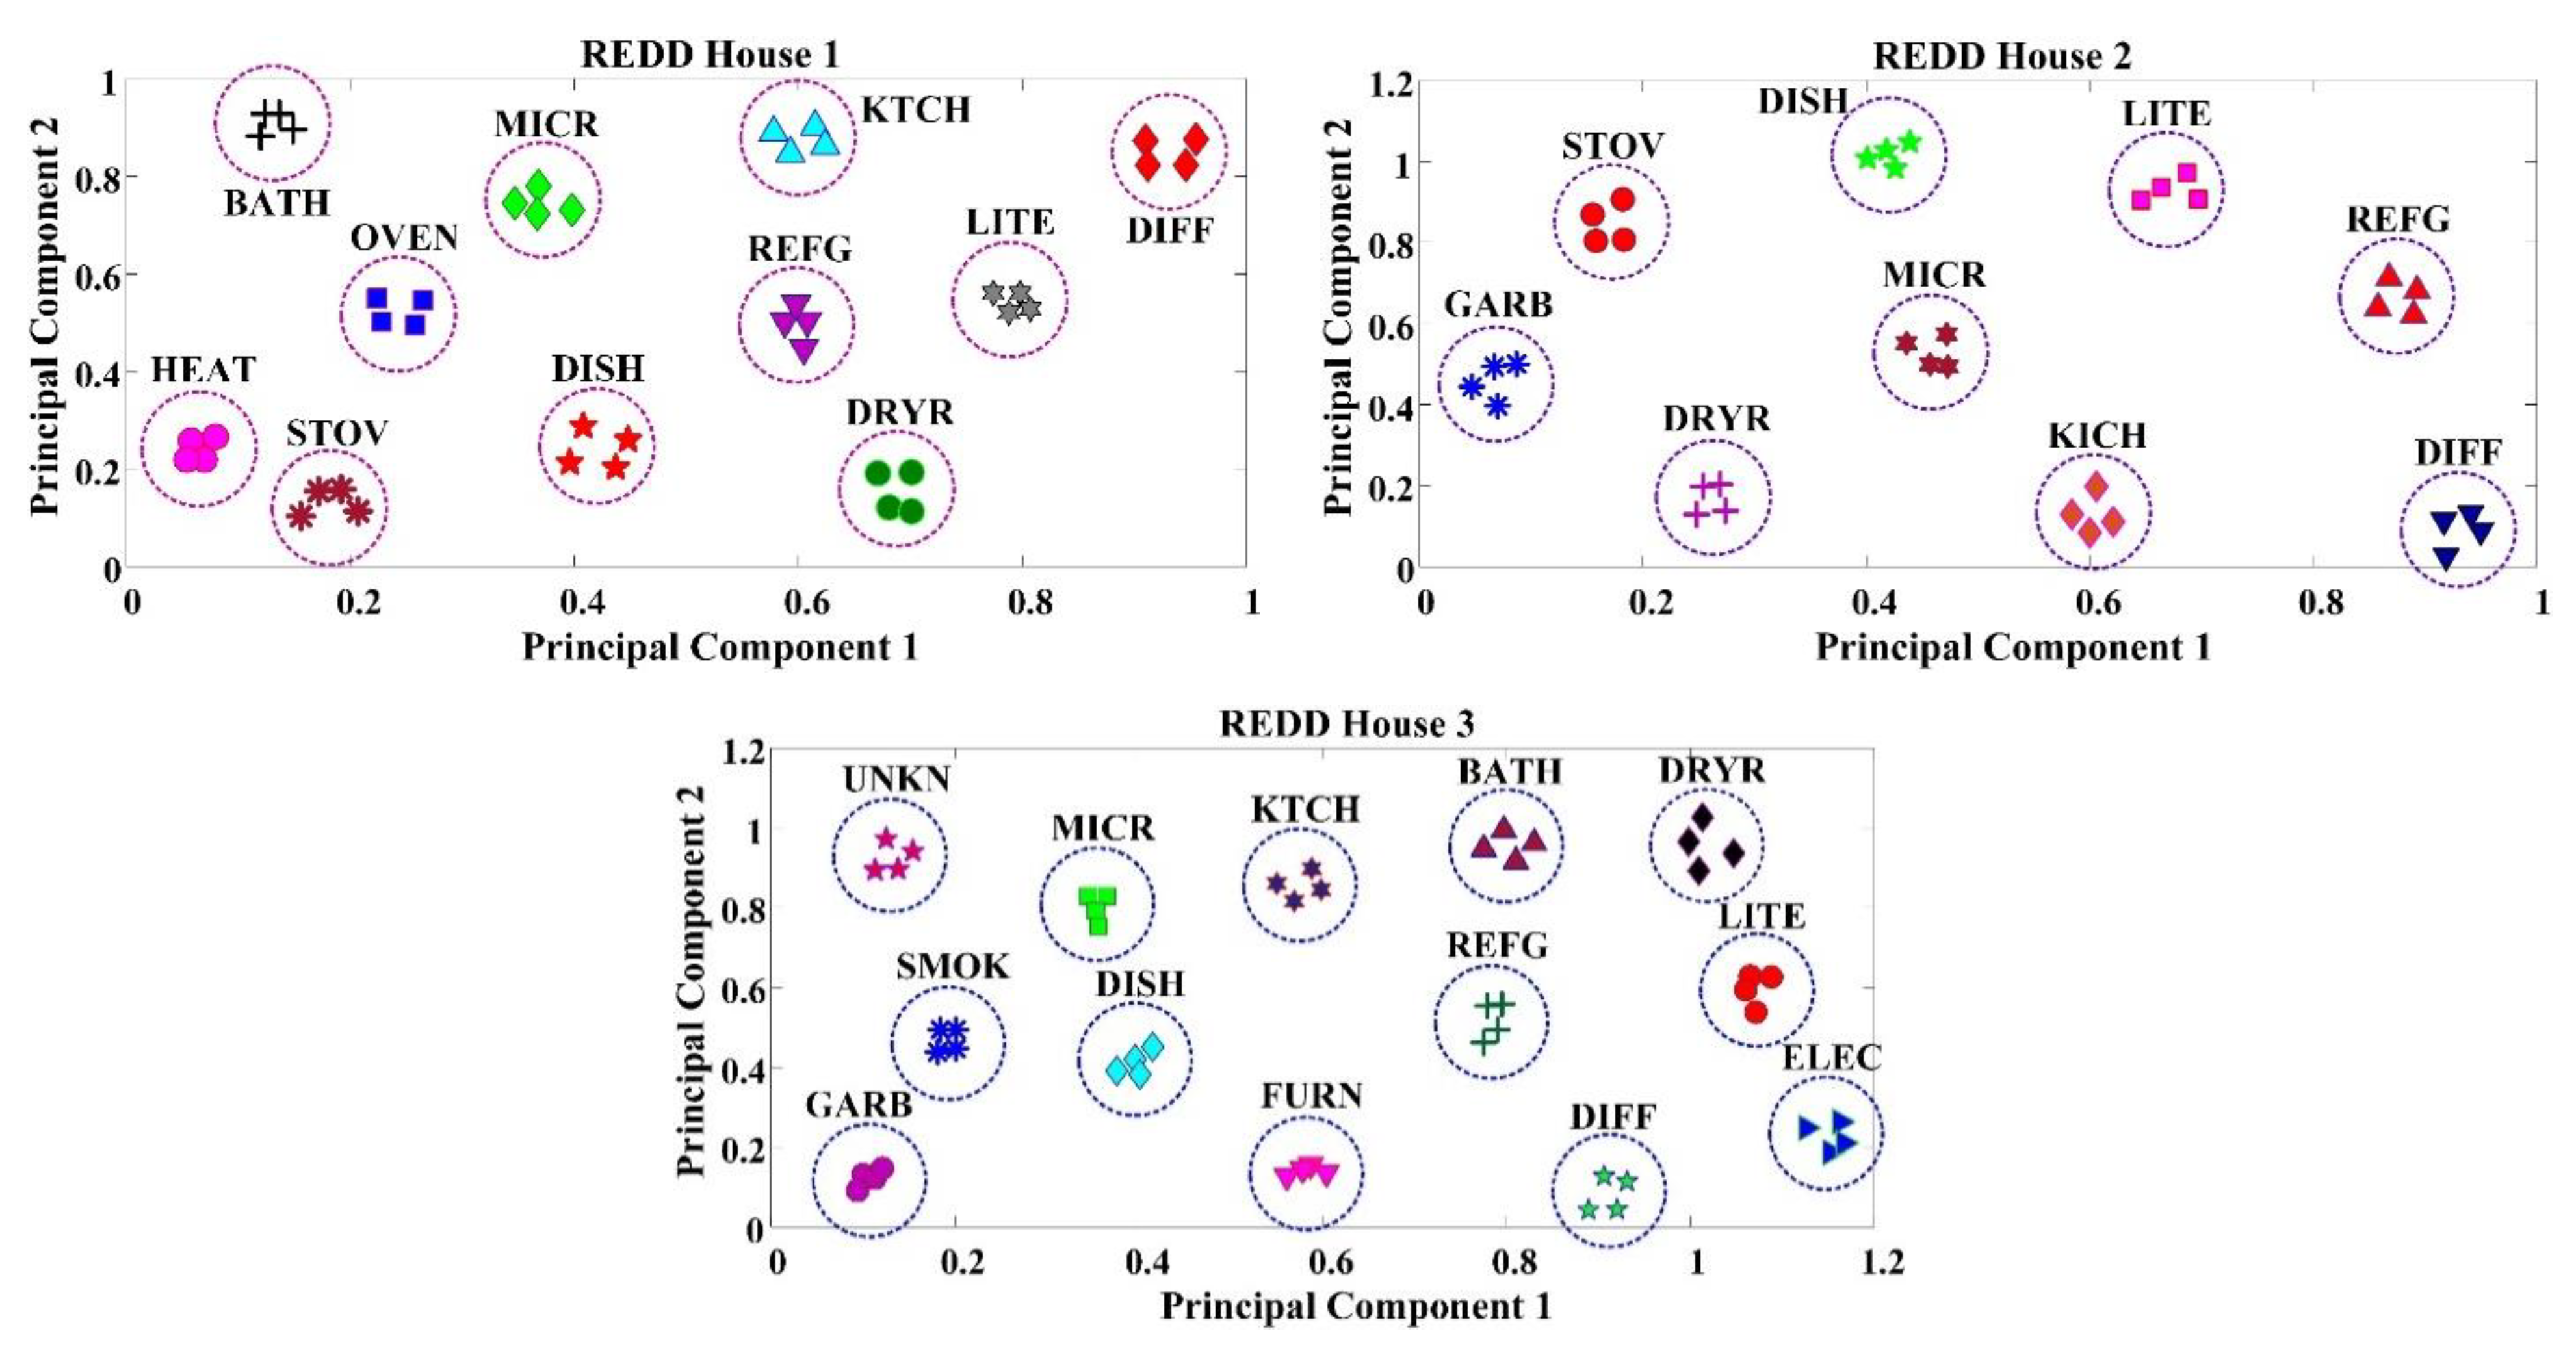
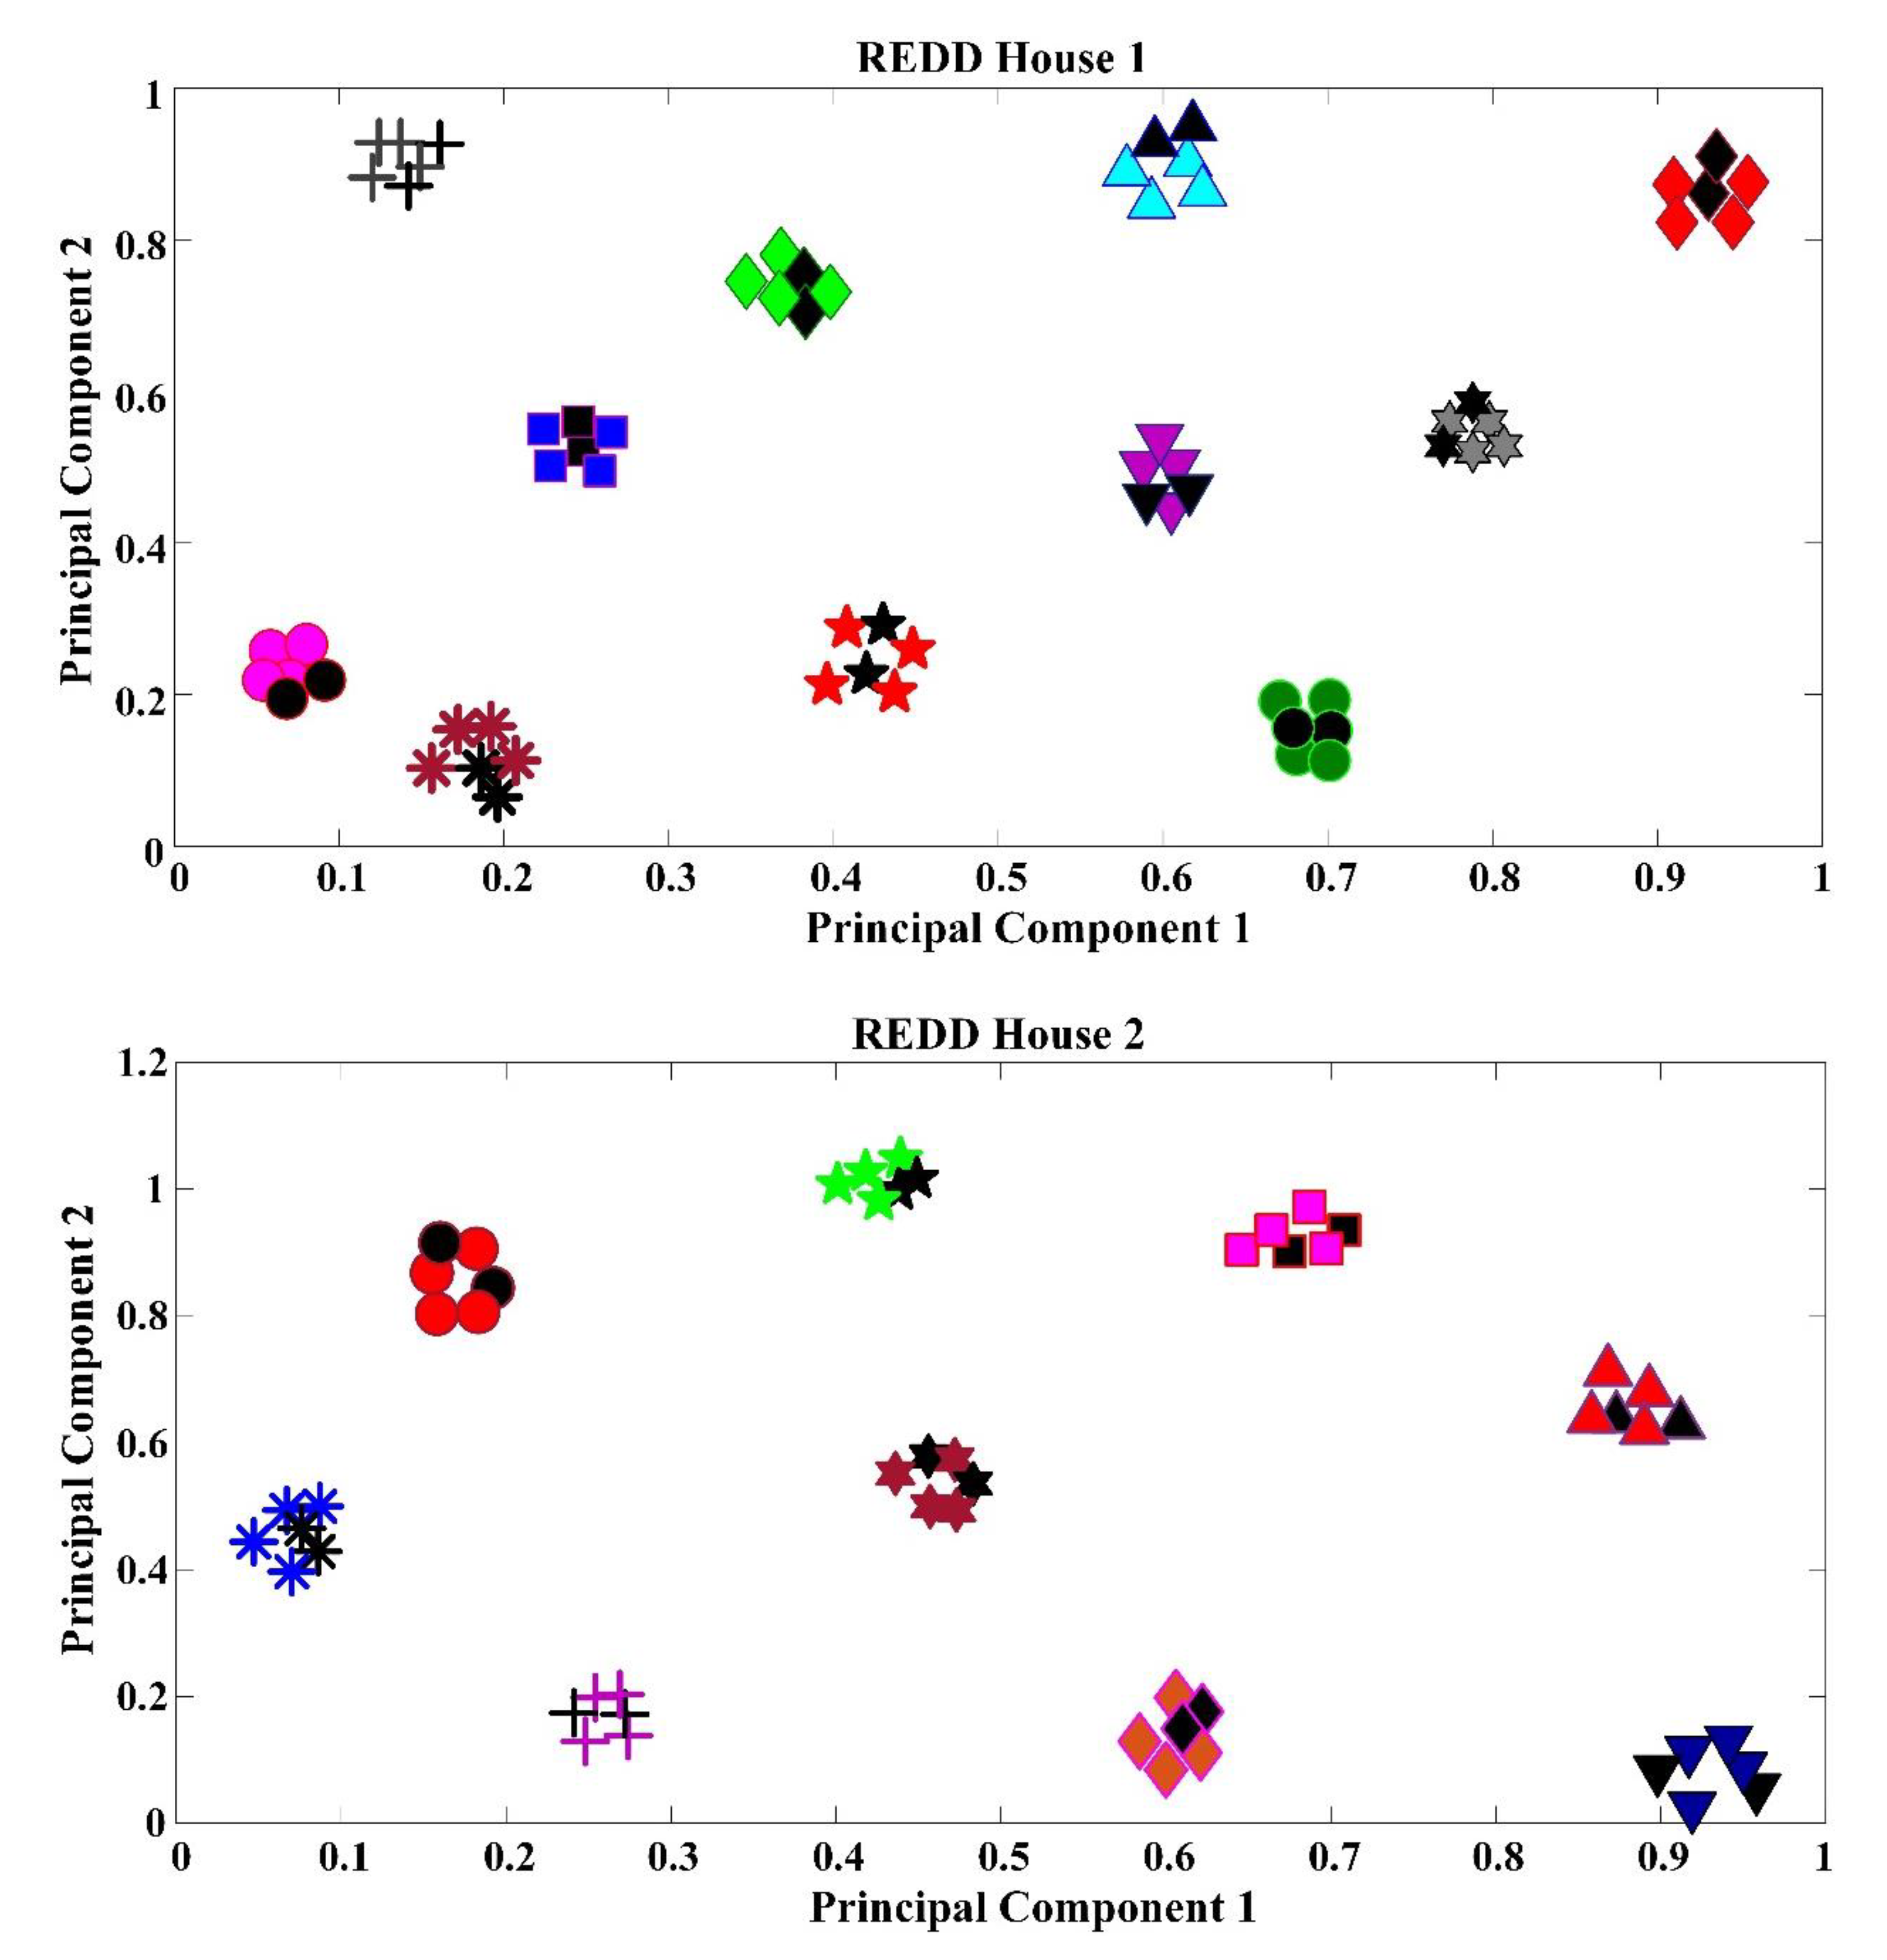
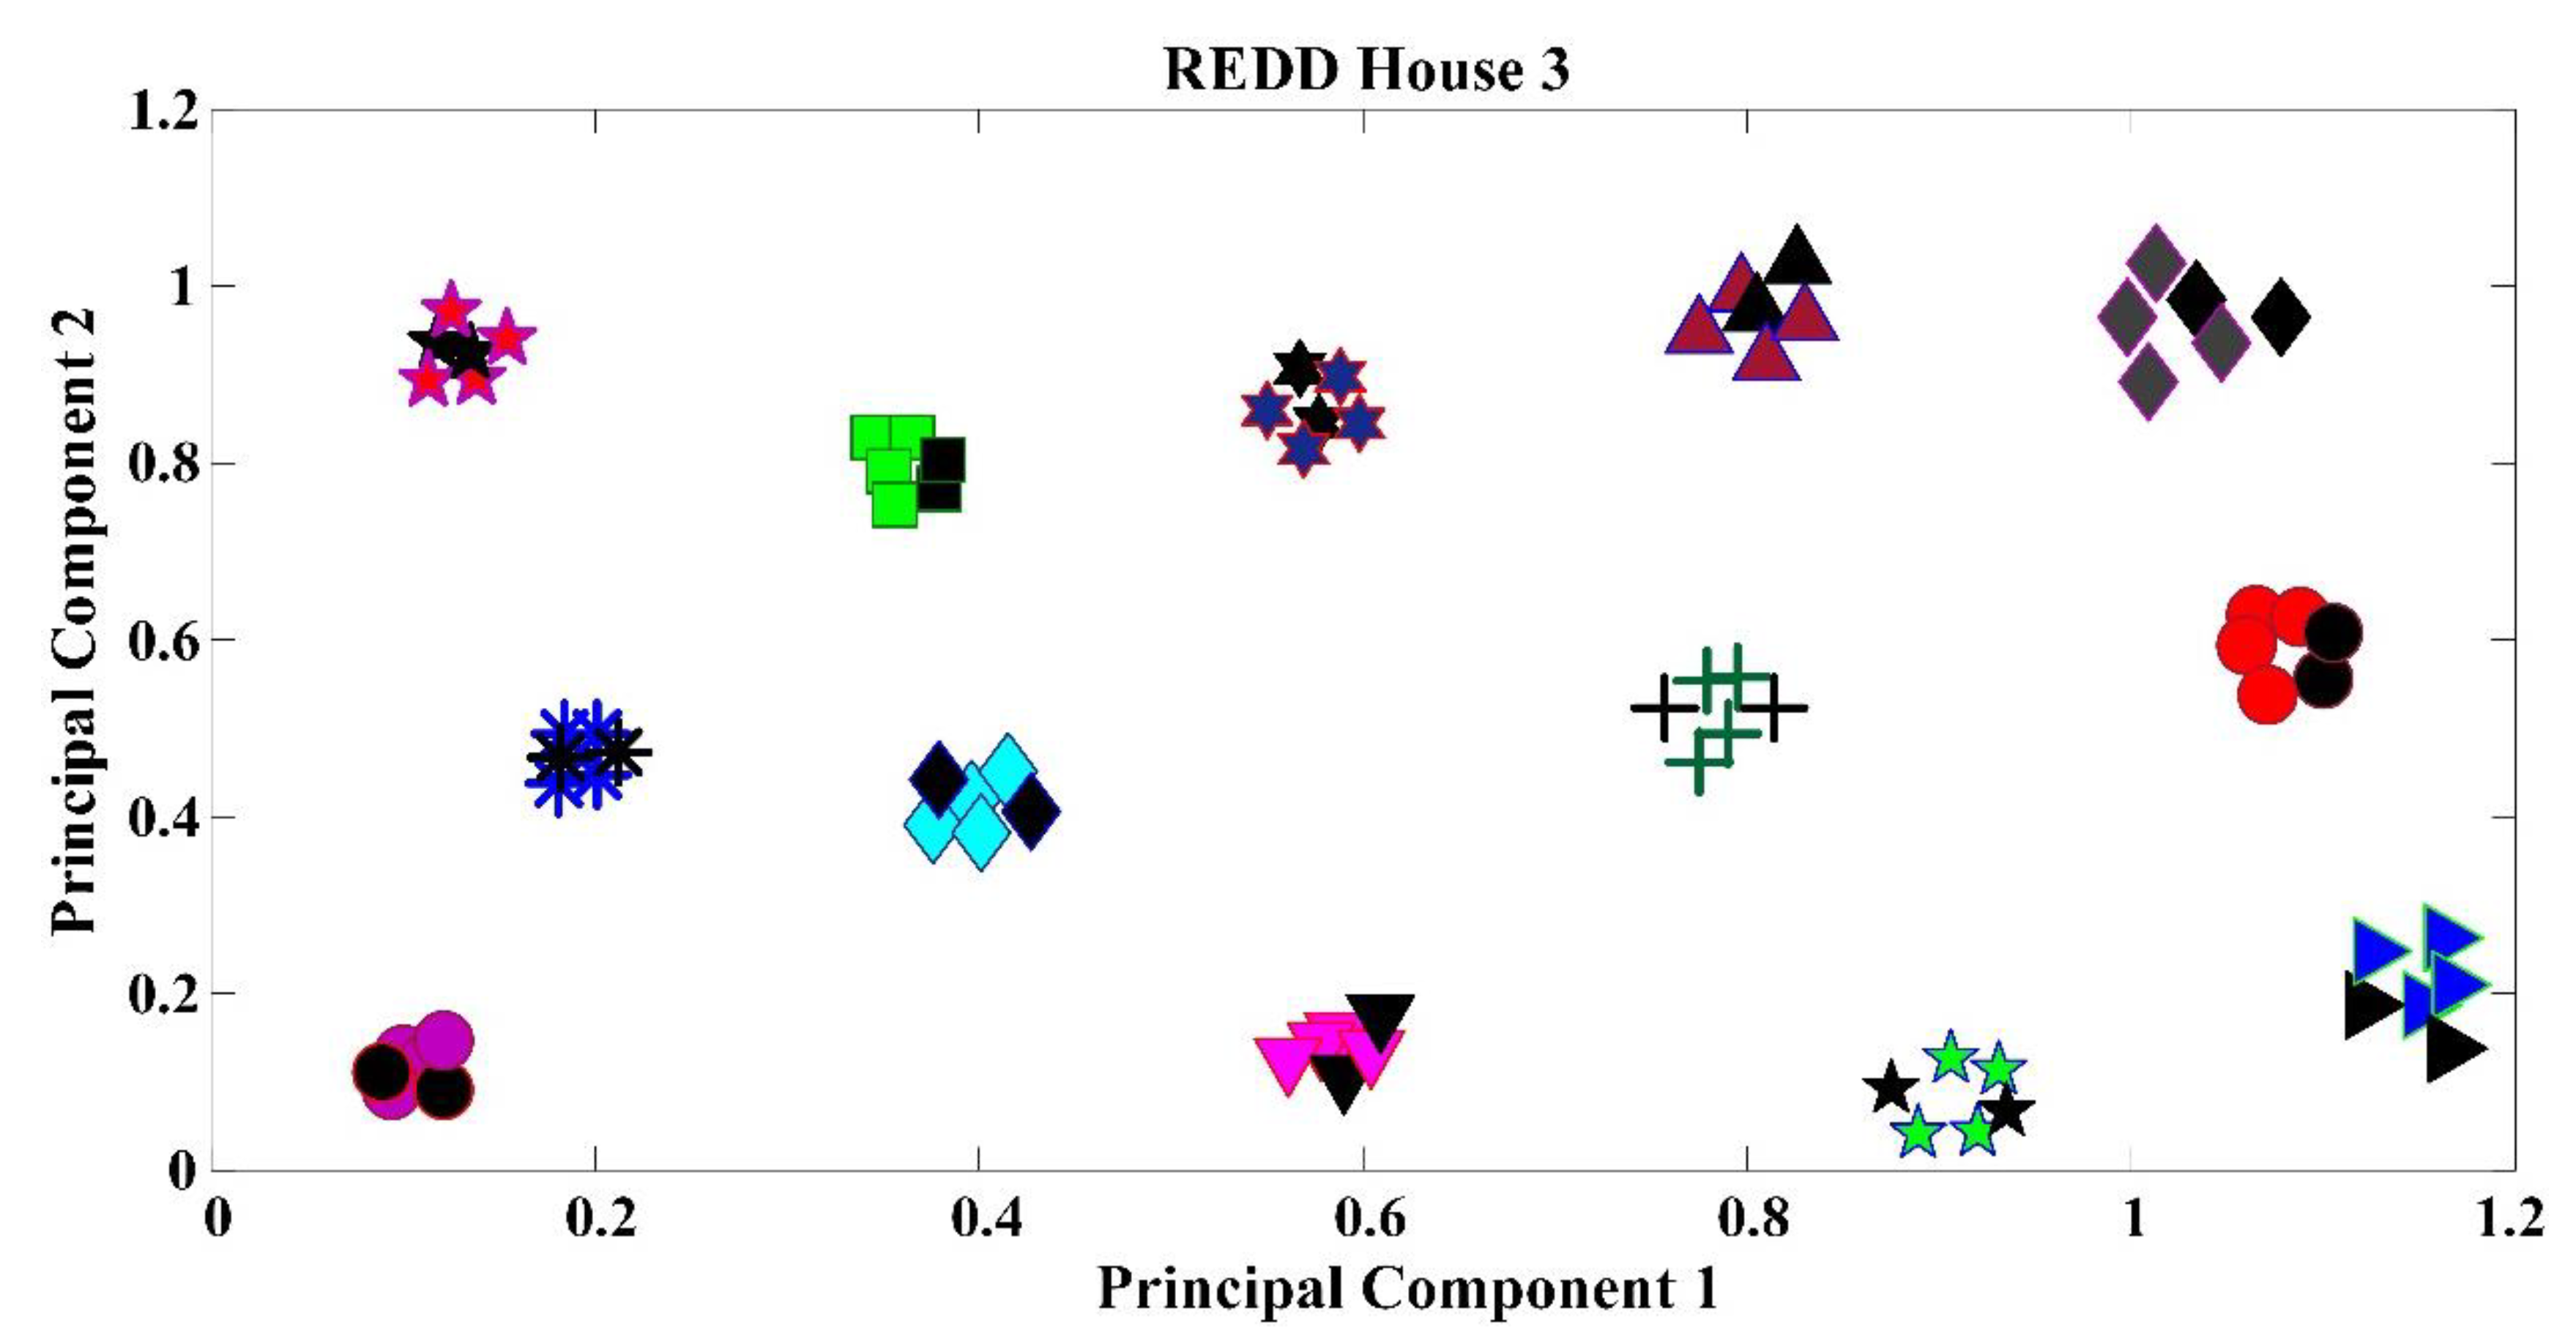
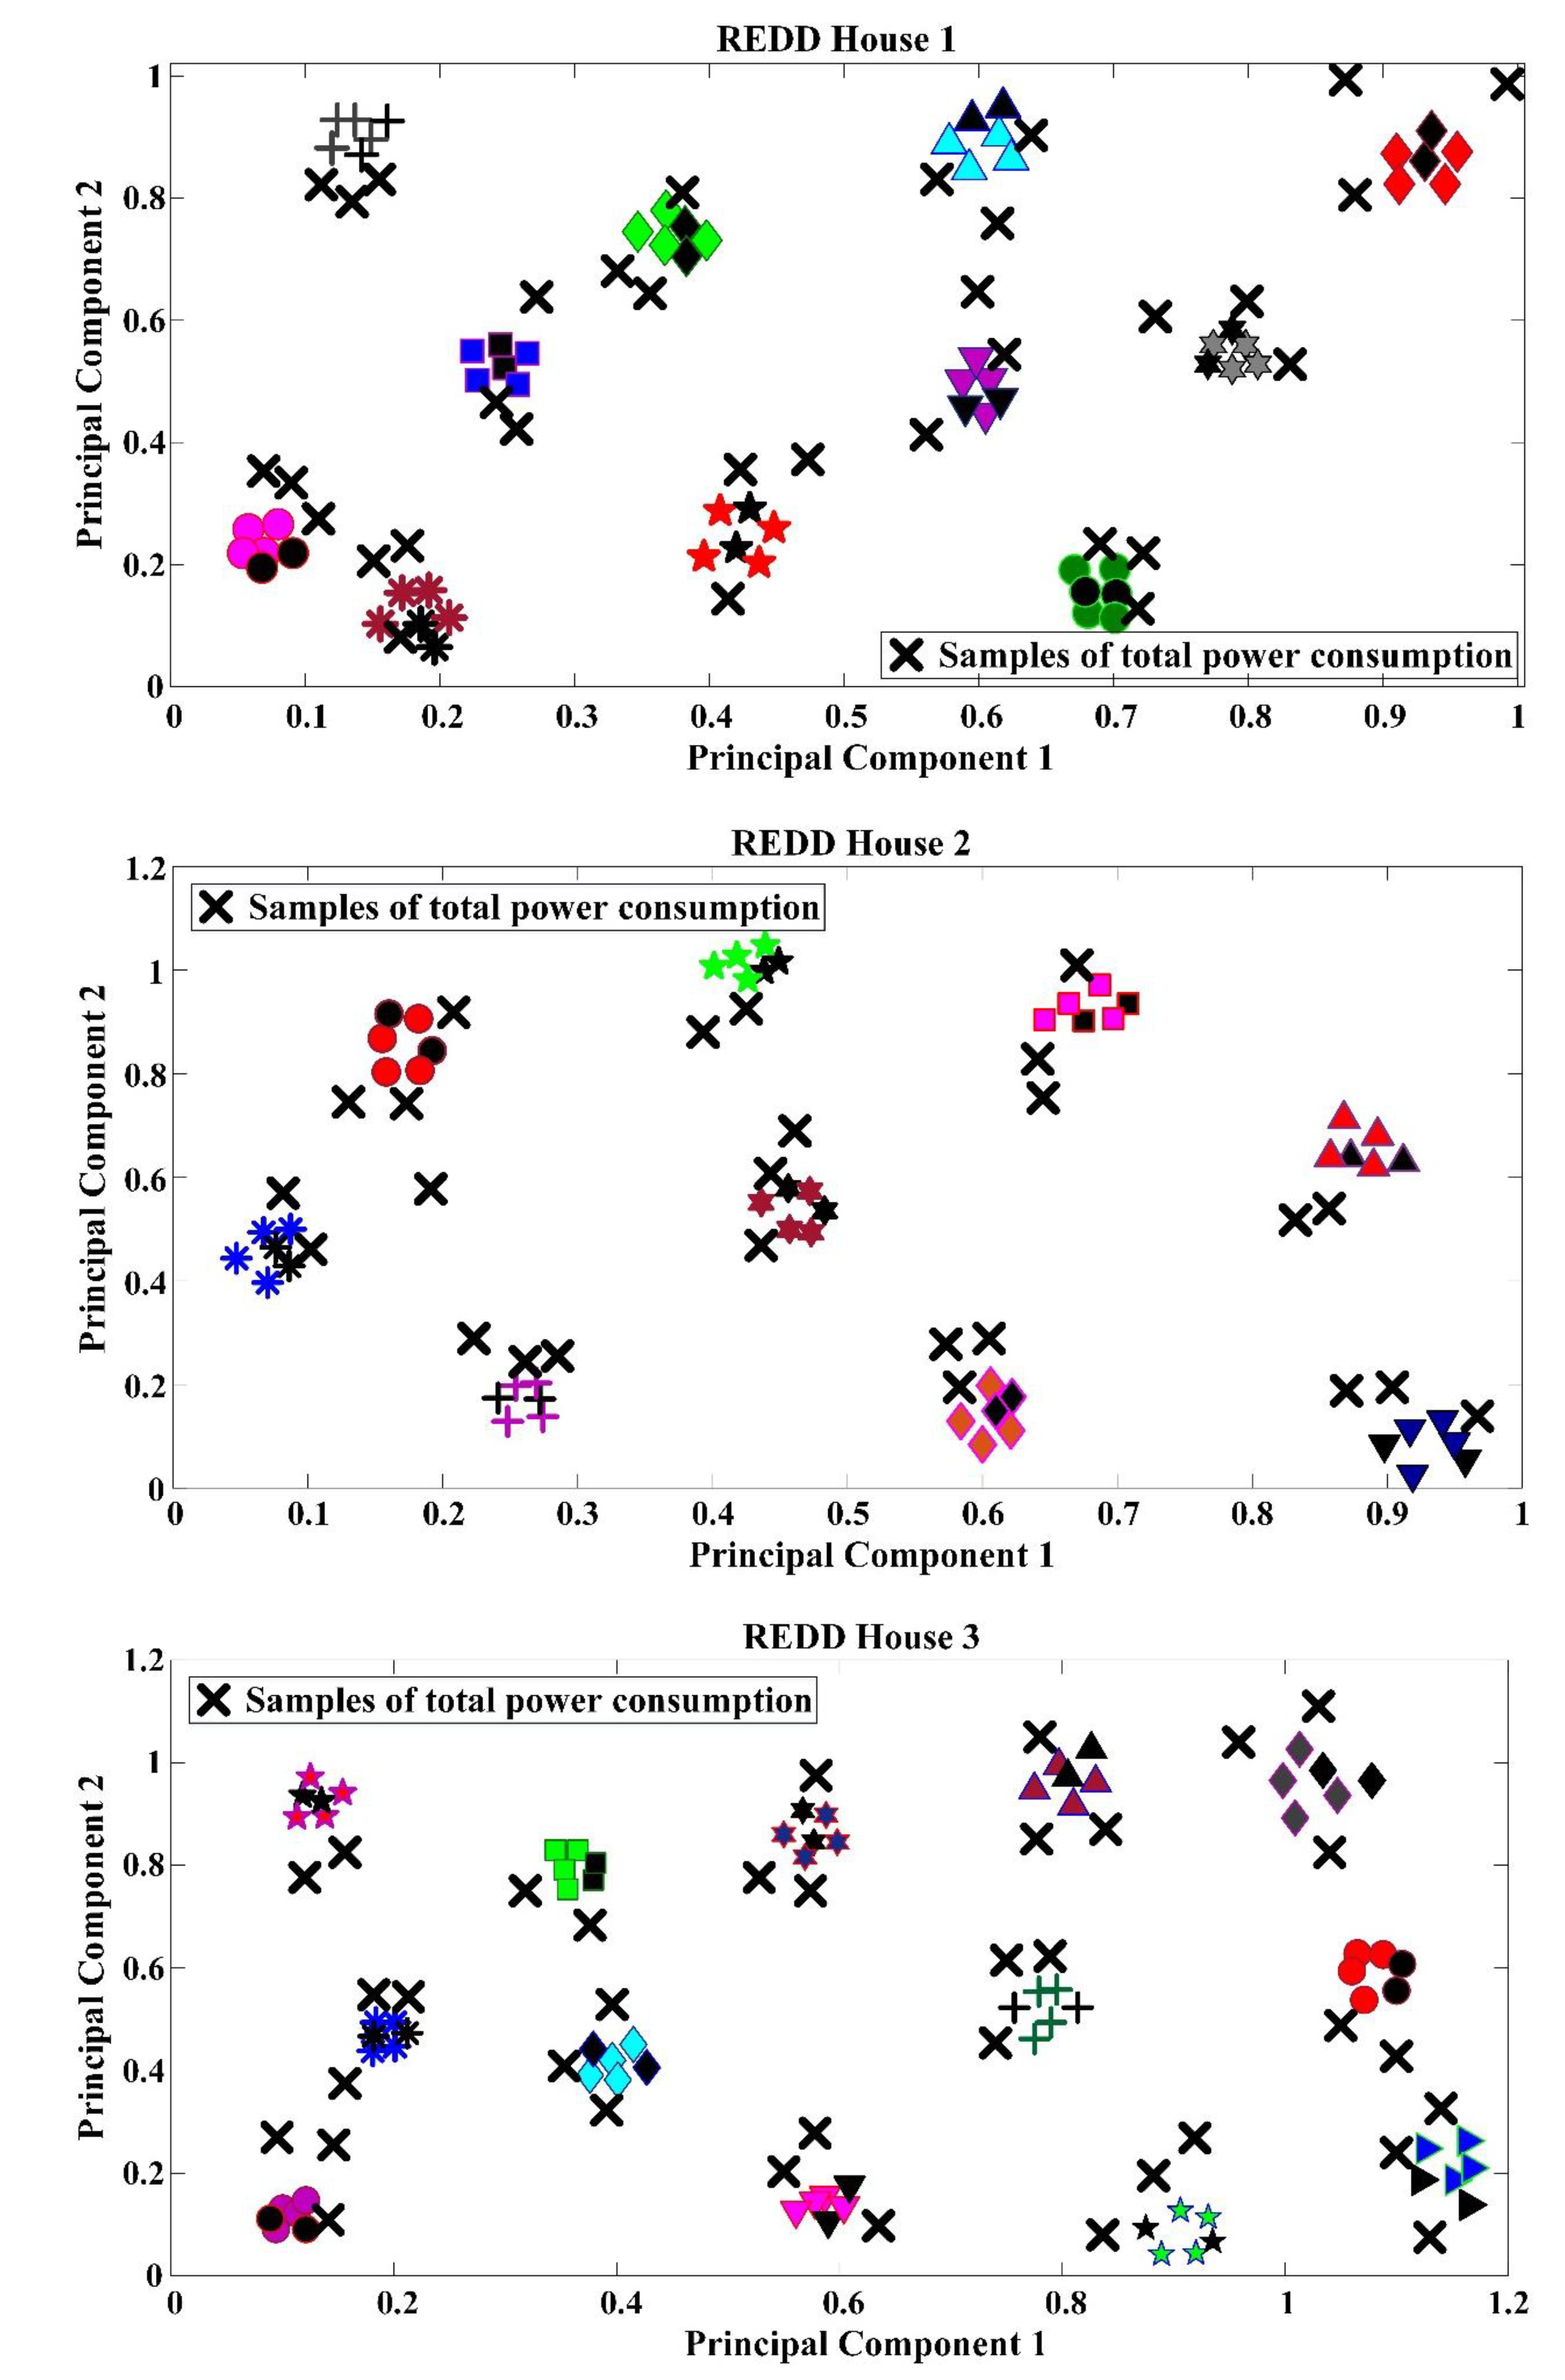
2. Principal Component Analysis
- approximation of the CM,
- eigen-dissociation of the CM and selecting the k highest eigenvalues,
- building the feature matrix via respective eigenvectors, and
- mapping the main power consumption curves to the k-dimensional vector space by applying the .
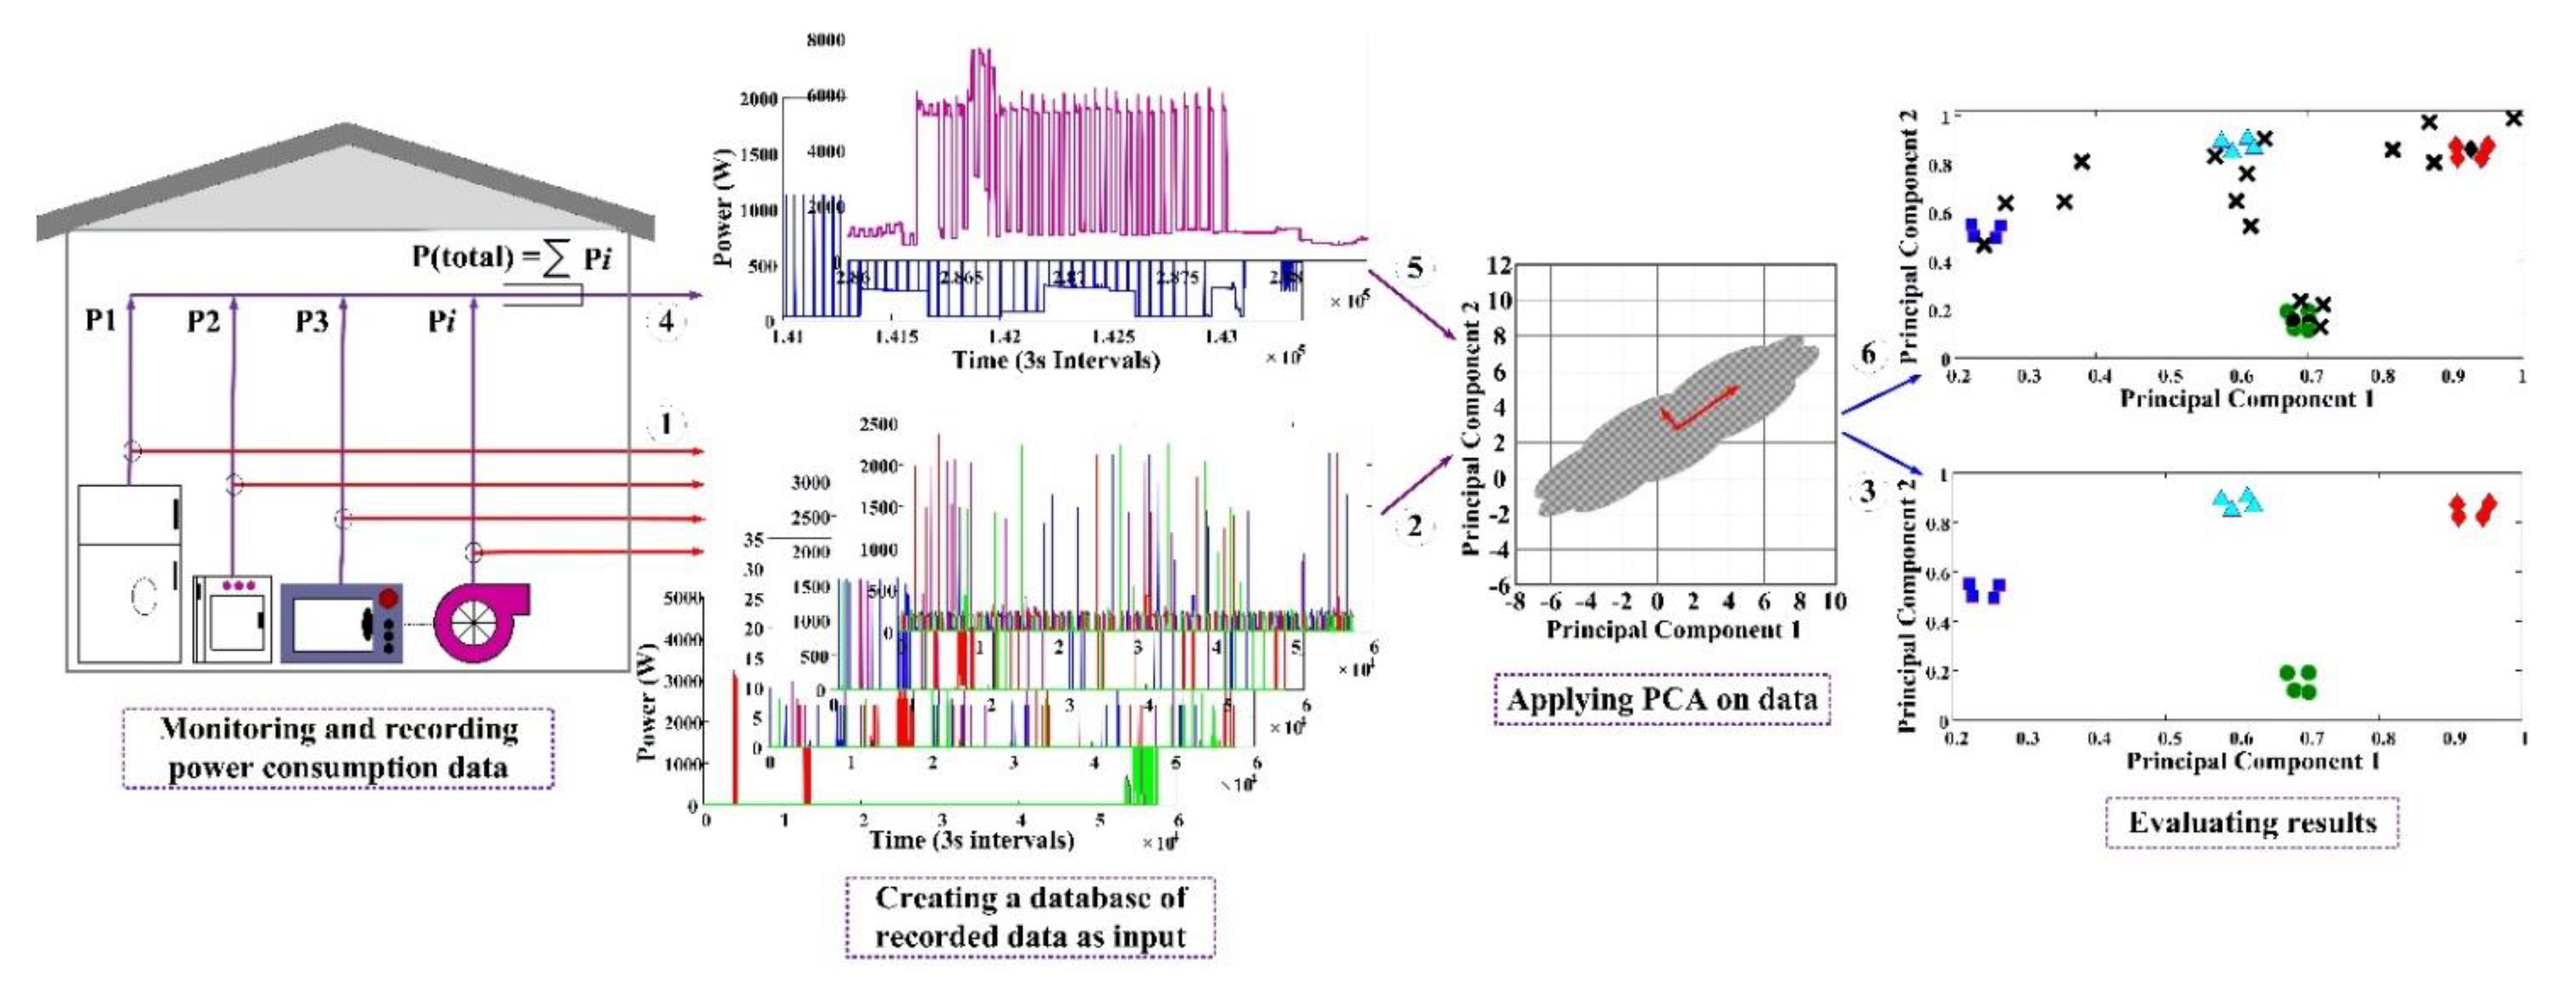
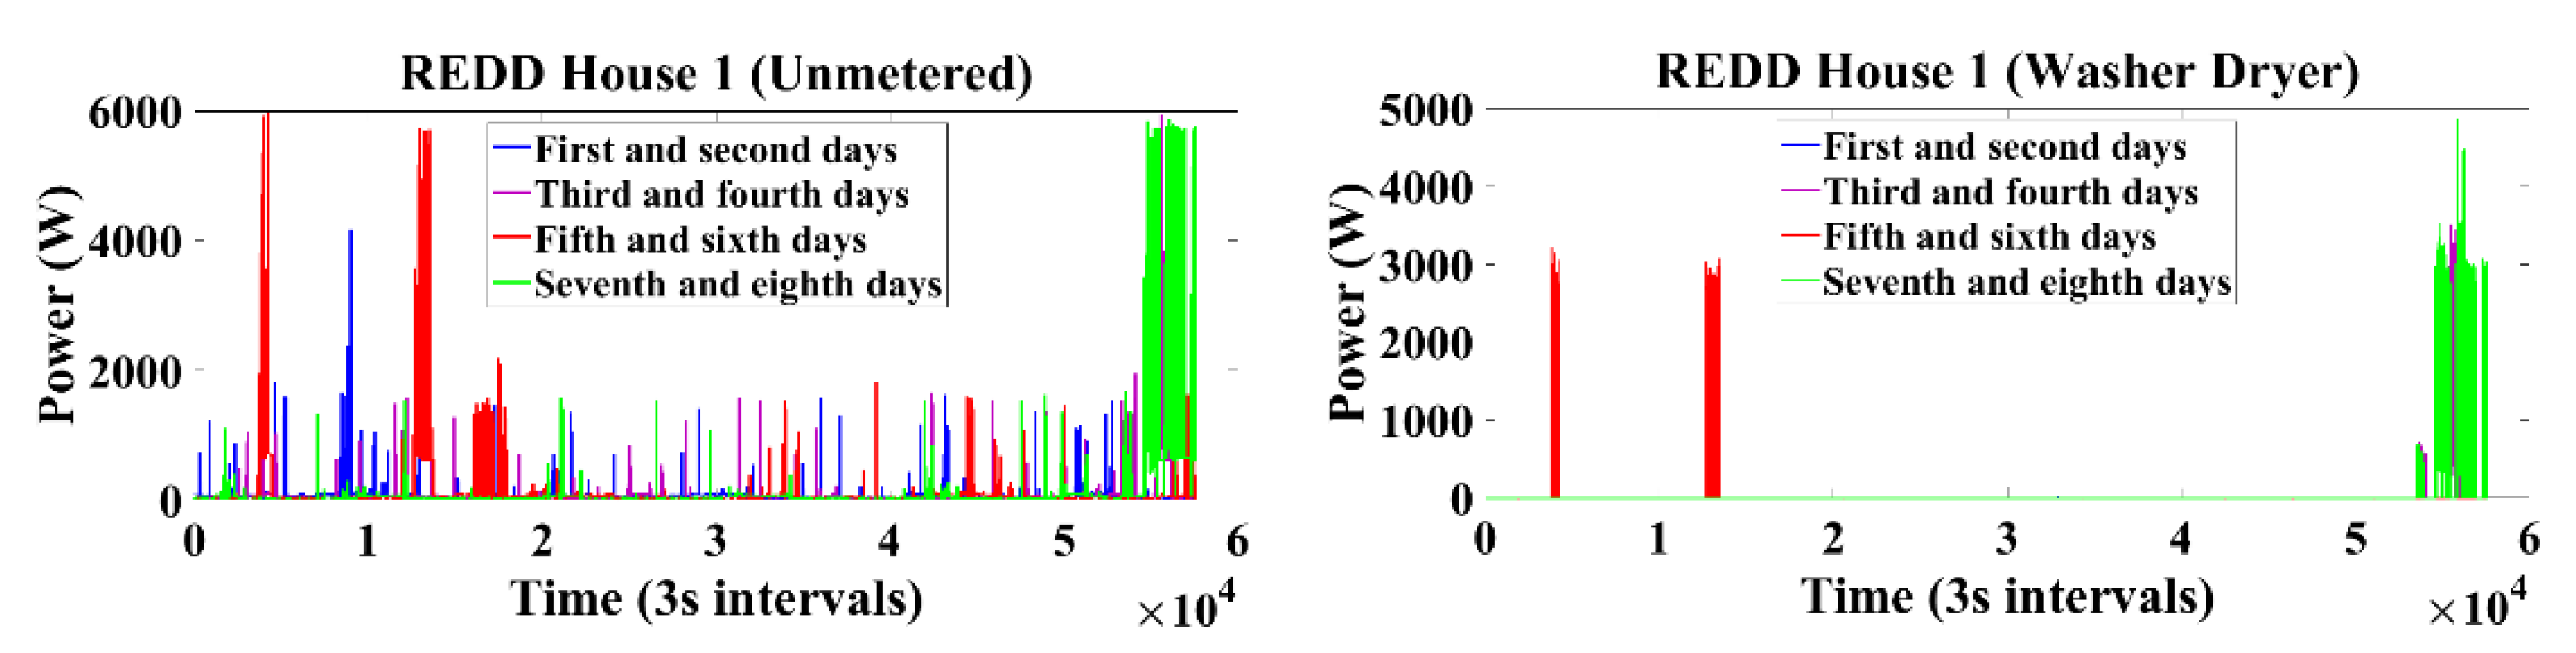
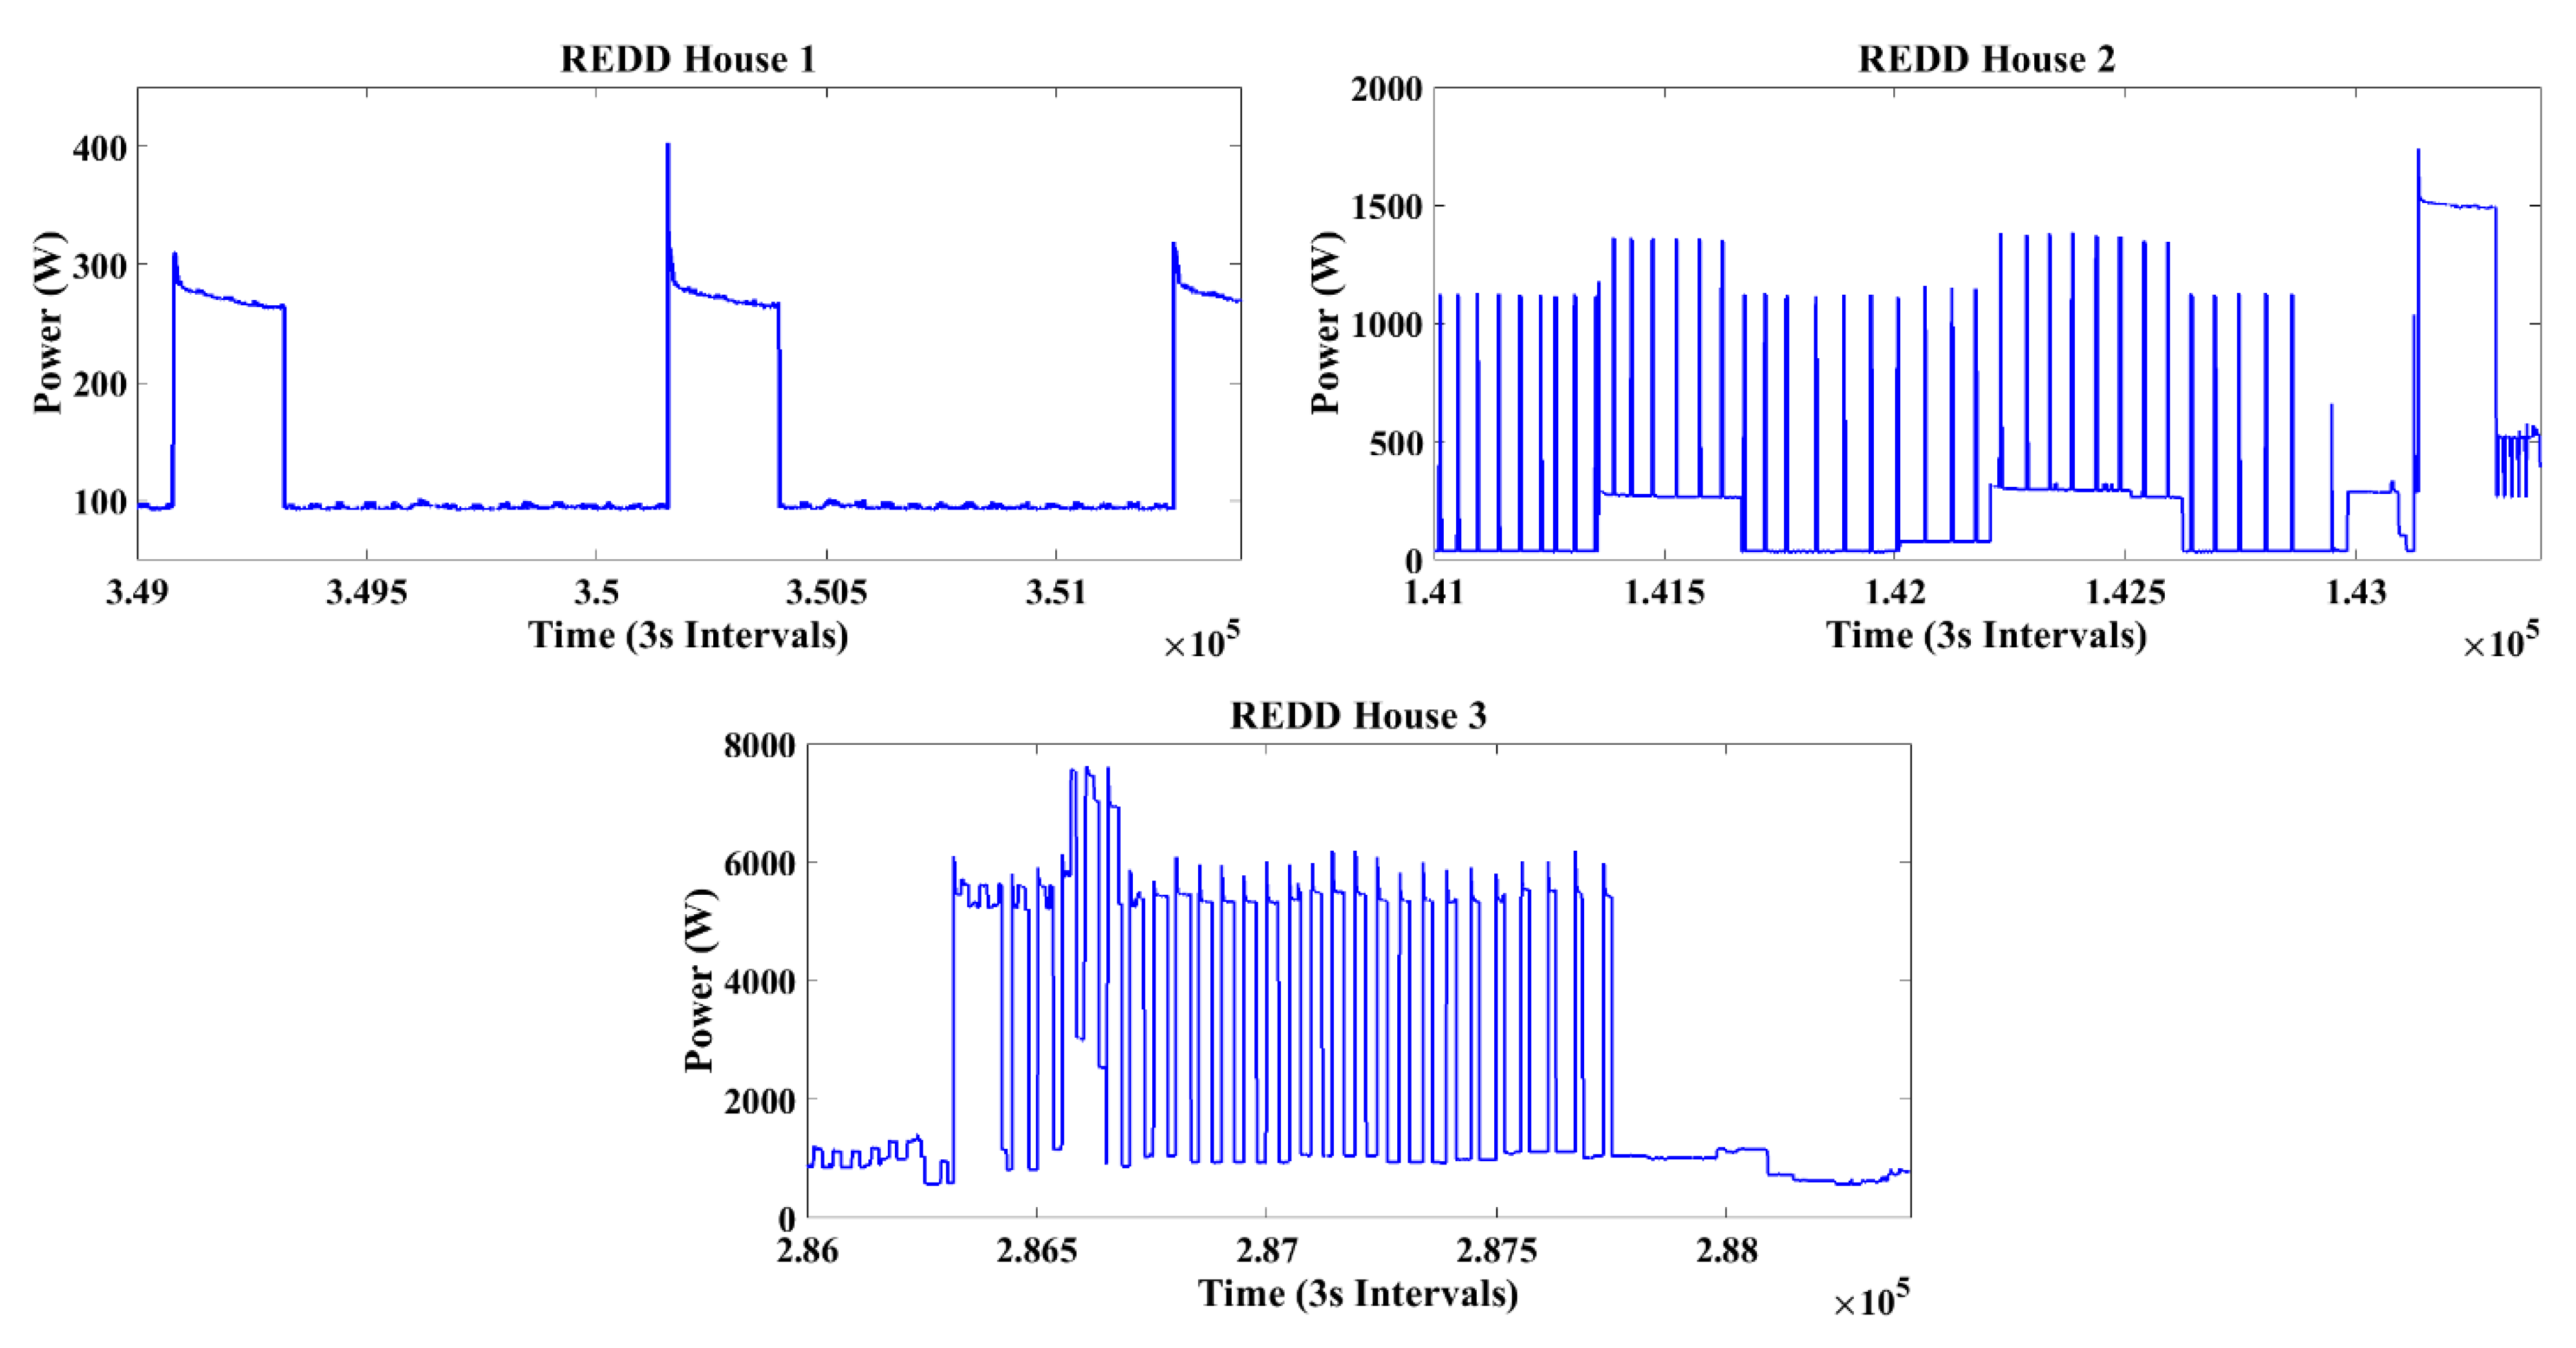
3. Case Study
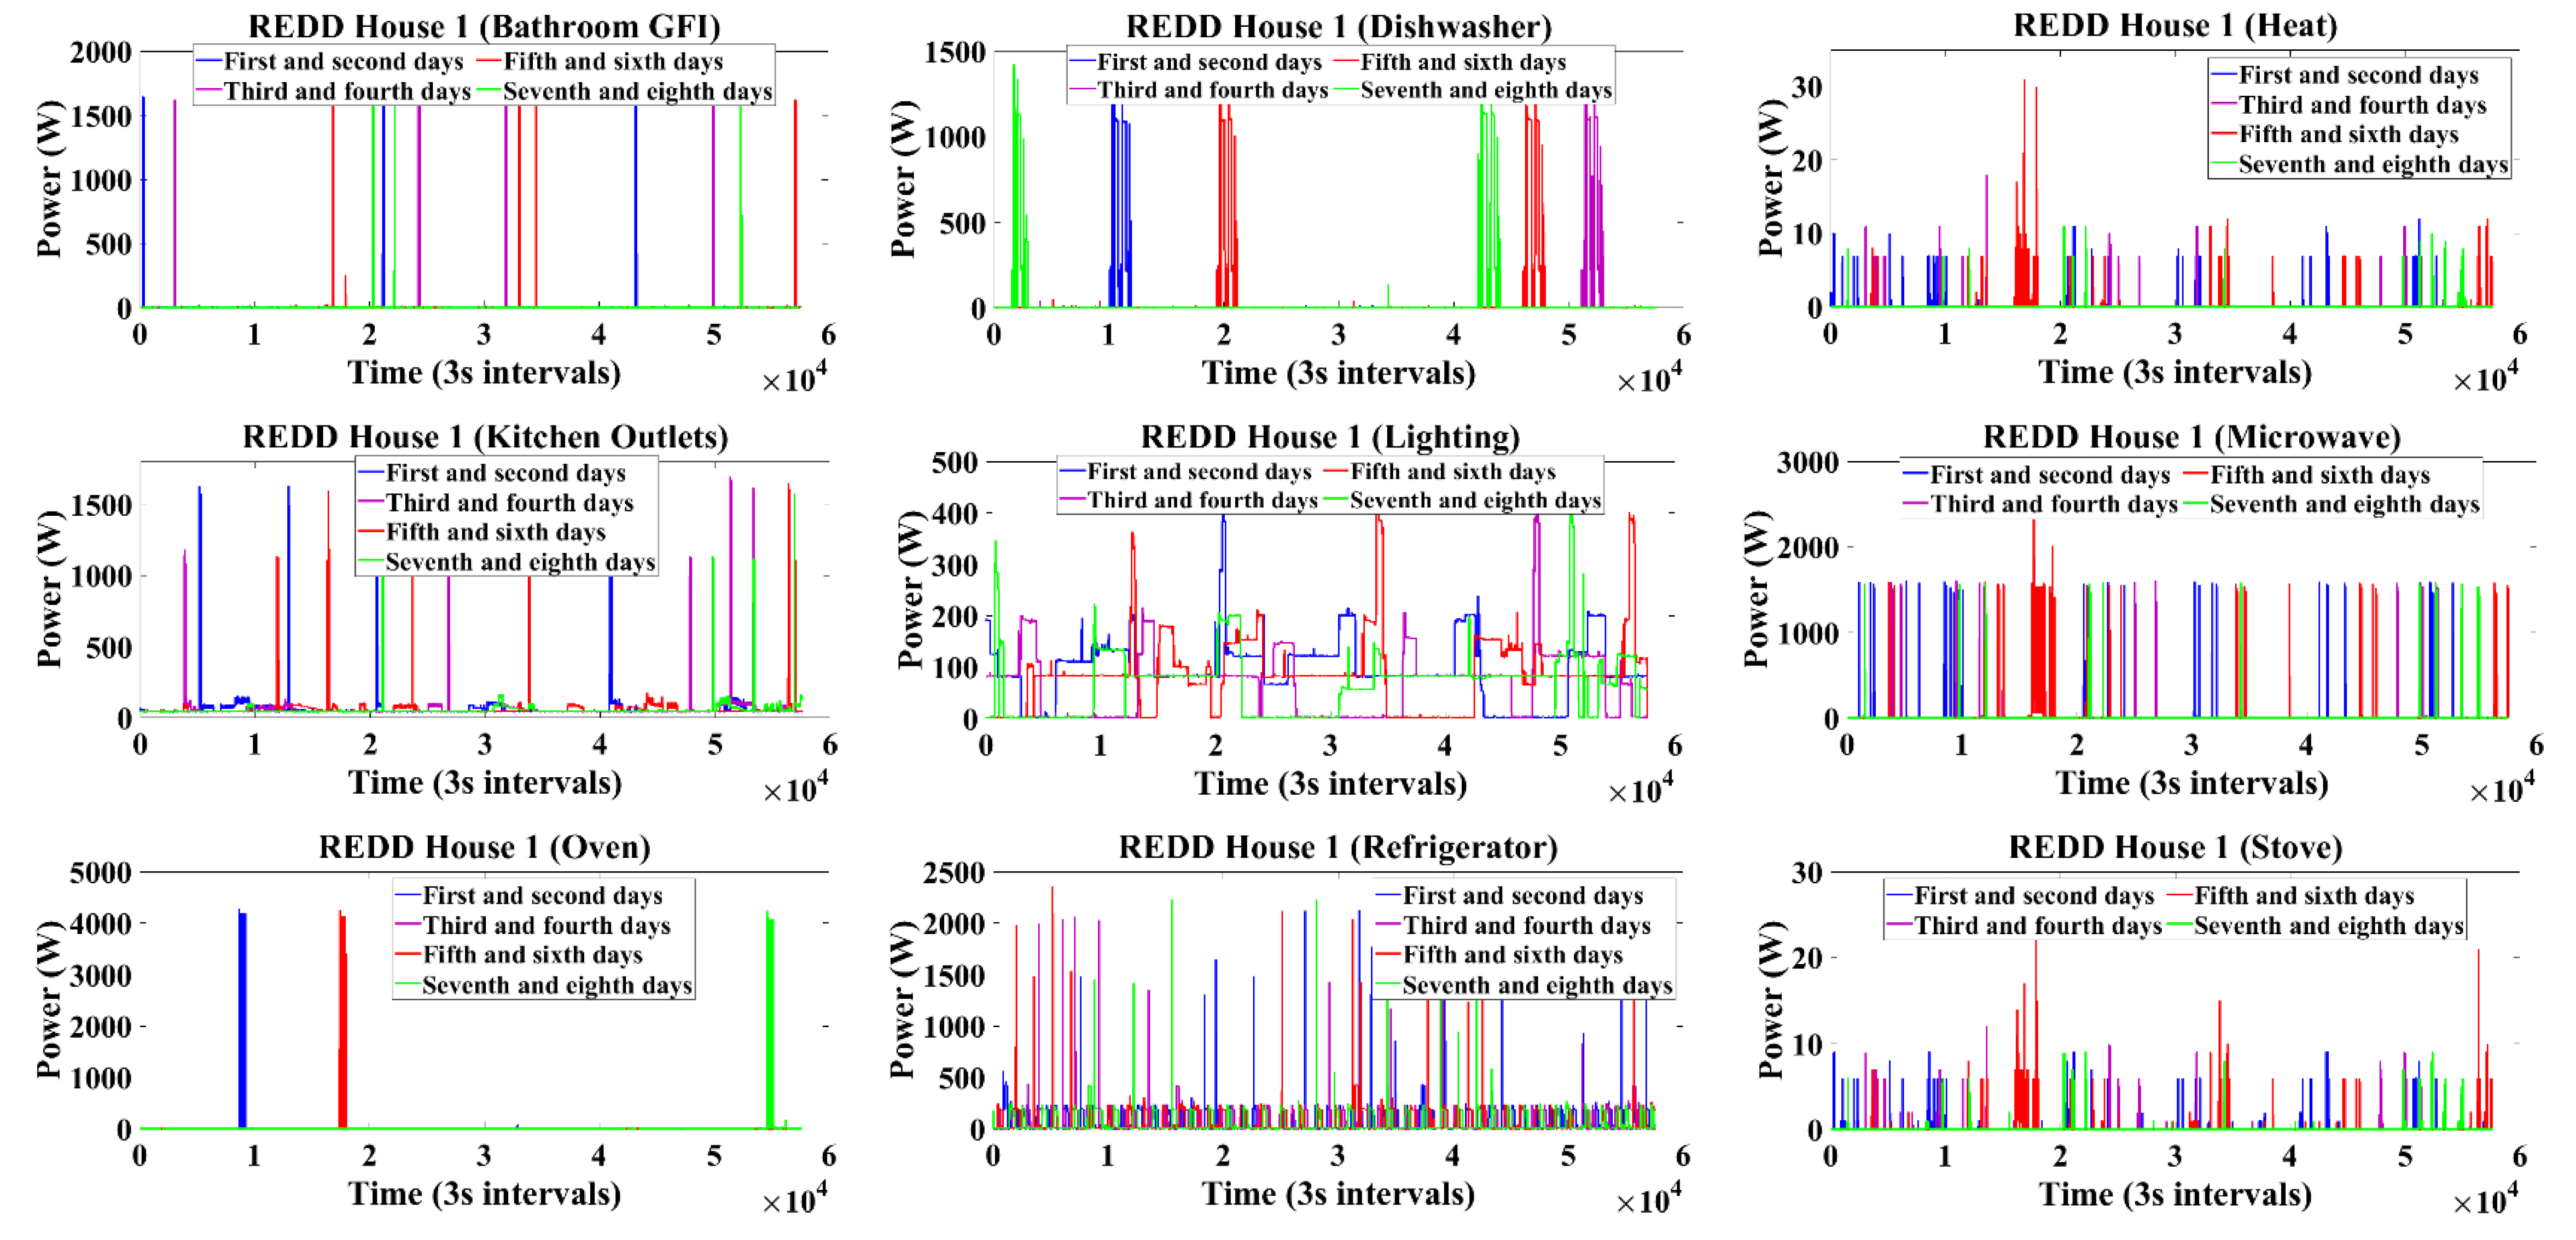
4. Experimental Results
5. Conclusions
Author Contributions
Funding
Conflicts of Interest
References
- Anvari-Moghaddam, A.; Mohammadi-ivatloo, B.; Asadi, S.; Guldstrand Larsen, K.; Shahidehpour, M. Sustainable Energy Systems Planning, Integration, and Management. Appl. Sci. 2019, 9, 4451. [Google Scholar] [CrossRef] [Green Version]
- Liu, Y.; Wang, X.; Zhao, L.; Liu, Y. Admittance-based load signature construction for non-intrusive appliance load monitoring. Energy Build. 2018, 171, 209–219. [Google Scholar] [CrossRef]
- Nazari-Heris, M.; Mirzaei, M.A.; Mohammadi-Ivatloo, B.; Marzband, M.; Asadi, S. Economic-environmental effect of power to gas technology in coupled electricity and gas systems with price-responsive shiftable loads. J. Clean. Prod. 2020, 244, 118769. [Google Scholar] [CrossRef]
- Miyasawa, A.; Fujimoto, Y.; Hayashi, Y. Energy disaggregation based on smart metering data via semi-binary nonnegative matrix factorization. Energy Build. 2019, 183, 547–558. [Google Scholar] [CrossRef]
- Devlin, M.A.; Hayes, B.P. Non-Intrusive Load Monitoring and Classification of Activities of Daily Living Using Residential Smart Meter Data. IEEE Trans. Consum. Electron. 2019, 65, 339–348. [Google Scholar] [CrossRef]
- He, K.; Stankovic, L.; Liao, J.; Stankovic, V. Non-Intrusive Load Disaggregation Using Graph Signal Processing. IEEE Trans. Smart Grid 2018, 9, 1739–1747. [Google Scholar] [CrossRef] [Green Version]
- D’Incecco, M.; Squartini, S.; Zhong, M. Transfer Learning for Non-Intrusive Load Monitoring. IEEE Trans. Smart Grid 2020, 11, 1419–1429. [Google Scholar] [CrossRef]
- Aiad, M.; Lee, P.H. Unsupervised approach for load disaggregation with devices interactions. Energy Build. 2016, 116, 96–103. [Google Scholar] [CrossRef]
- Zeinal-Kheiri, S.; Shotorbani, A.M.; Mohammadi-Ivatloo, B. Residential Load Disaggregation Considering State Transitions. IEEE Trans. Ind. Inform. 2020, 16, 743–753. [Google Scholar] [CrossRef]
- Quek, Y.T.; Woo, W.L.; Logenthiran, T. Load Disaggregation Using One-Directional Convolutional Stacked Long Short-Term Memory Recurrent Neural Network. IEEE Syst. J. 2020, 14, 1395–1404. [Google Scholar] [CrossRef]
- Wang, Y.; Pandharipande, A.; Fuhrmann, P. Energy Data Analytics for Nonintrusive Lighting Asset Monitoring and Energy Disaggregation. IEEE Sens. J. 2018, 18, 2934–2943. [Google Scholar] [CrossRef]
- Morais, L.R.; Castro, A.R.G. Competitive Autoassociative Neural Networks for Electrical Appliance Identification for Non-Intrusive Load Monitoring. IEEE Access 2019, 7, 111746–111755. [Google Scholar] [CrossRef]
- Kong, W.; Dong, Z.Y.; Ma, J.; Hill, D.J.; Zhao, J.; Luo, F. An Extensible Approach for Non-Intrusive Load Disaggregation with Smart Meter Data. IEEE Trans. Smart Grid 2018, 9, 3362–3372. [Google Scholar] [CrossRef]
- Ji, T.Y.; Liu, L.; Wang, T.S.; Lin, W.B.; Li, M.S.; Wu, Q.H. Non-Intrusive Load Monitoring Using Additive Factorial Approximate Maximum a Posteriori Based on Iterative Fuzzy c-Means. IEEE Trans. Smart Grid 2019, 10, 6667–6677. [Google Scholar] [CrossRef]
- Alcala, J.; Urena, J.; Hernandez, A.; Gualda, D. Event-Based Energy Disaggregation Algorithm for Activity Monitoring from a Single-Point Sensor. IEEE Trans. Instrum. Meas. 2017, 66, 2615–2626. [Google Scholar] [CrossRef]
- Pöchacker, M.; Egarter, D.; Elmenreich, W. Proficiency of power values for load disaggregation. IEEE Trans. Instrum. Meas. 2016, 65, 46–55. [Google Scholar] [CrossRef] [Green Version]
- Kong, W.; Dong, Z.Y.; Hill, D.J.; Luo, F.; Xu, Y. Improving Nonintrusive Load Monitoring Efficiency via a Hybrid Programing Method. IEEE Trans. Ind. Inform. 2016, 12, 2148–2157. [Google Scholar] [CrossRef]
- Kong, S.; Kim, Y.; Ko, R.; Joo, S.K. Home appliance load disaggregation using cepstrum-smoothing-based method. IEEE Trans. Consum. Electron. 2015, 61, 24–30. [Google Scholar] [CrossRef]
- De Baets, L.; Ruyssinck, J.; Develder, C.; Dhaene, T.; Deschrijver, D. On the Bayesian optimization and robustness of event detection methods in NILM. Energy Build. 2017, 145, 57–66. [Google Scholar] [CrossRef] [Green Version]
- Piga, D.; Cominola, A.; Giuliani, M.; Castelletti, A.; Rizzoli, A.E. Sparse Optimization for Automated Energy End Use Disaggregation. IEEE Trans. Control Syst. Technol. 2016, 24, 1044–1051. [Google Scholar] [CrossRef]
- Machlev, R.; Levron, Y.; Beck, Y. Modified Cross-Entropy Method for Classification of Events in NILM Systems. IEEE Trans. Smart Grid 2018, 10, 4962–4973. [Google Scholar] [CrossRef]
- Sadeghianpourhamami, N.; Ruyssinck, J.; Deschrijver, D.; Dhaene, T.; Develder, C. Comprehensive feature selection for appliance classification in NILM. Energy Build. 2017, 151, 98–106. [Google Scholar] [CrossRef] [Green Version]
- Mauch, L.; Yang, B. A new approach for supervised power disaggregation by using a deep recurrent LSTM network. In Proceedings of the 2015 IEEE Global Conference on Signal and Information Processing, GlobalSIP, Orlando, FL, USA, 14–16 December 2015; pp. 63–67. [Google Scholar]
- Zhang, C.; Zhong, M.; Wang, Z.; Goddard, N.; Sutton, C. Sequence-to-point learning with neural networks for non-intrusive load monitoring. In Proceedings of the 32nd AAAI Conference on Artificial Intelligence, AAAI 2018, Louisiana, NO, USA, 2–7 February 2018; pp. 2604–2611. [Google Scholar]
- Altrabalsi, H.; Stankovic, L.; Liao, J.; Stankovic, V. A low-complexity energy disaggregation method: Performance and robustness. In Proceedings of the IEEE Symposium on Computational Intelligence Applications in Smart Grid, CIASG, Orlando, FL, USA, 9–12 December 2014; Volume 2015-Janua. [Google Scholar]
- Kong, W.; Dong, Z.Y.; Wang, B.; Zhao, J.; Huang, J. A practical solution for non-intrusive type II load monitoring based on deep learning and post-processing. IEEE Trans. Smart Grid 2020, 11, 148–160. [Google Scholar] [CrossRef]
- Singhal, V.; Maggu, J.; Majumdar, A. Simultaneous Detection of Multiple Appliances from Smart-Meter Measurements via Multi-Label Consistent Deep Dictionary Learning and Deep Transform Learning. IEEE Trans. Smart Grid 2019, 10, 2969–2978. [Google Scholar] [CrossRef] [Green Version]
- Gaur, M.; Majumdar, A. Disaggregating transform learning for non-intrusive load monitoring. IEEE Access 2018, 6, 46256–46265. [Google Scholar] [CrossRef]
- Kim, H.; Marwah, M.; Arlitt, M.; Lyon, G.; Han, J. Unsupervised disaggregation of low frequency power measurements. In Proceedings of the 11th SIAM International Conference on Data Mining, SDM 2011, Mesa, AZ, USA, 28–30 April 2011; pp. 747–758. [Google Scholar]
- Parson, O.; Ghosh, S.; Weal, M.; Rogers, A. An unsupervised training method for non-intrusive appliance load monitoring. Artif. Intell. 2014, 217, 1–19. [Google Scholar] [CrossRef]
- Gonçalves, H.; Ocneanu, A.; Bergés, M.; Fan, R.H. Unsupervised disaggregation of appliances using aggregated consumption data. SustKDD Workshop 2011. [Google Scholar]
- Zhao, B.; Stankovic, L.; Stankovic, V. On a Training-Less Solution for Non-Intrusive Appliance Load Monitoring Using Graph Signal Processing. IEEE Access 2016, 4, 1784–1799. [Google Scholar] [CrossRef] [Green Version]
- Liu, Q.; Kamoto, K.M.; Liu, X.; Sun, M.; Linge, N. Low-Complexity Non-Intrusive Load Monitoring Using Unsupervised Learning and Generalized Appliance Models. IEEE Trans. Consum. Electron. 2019, 65, 28–37. [Google Scholar] [CrossRef]
- Kolter, J.Z.; Johnson, M.J. REDD: A Public Data Set for Energy Disaggregation Research. SustKDD Workshop 2011, 25, 59–62. [Google Scholar]
- Witten, I.H.; Frank, E.; Mark, A. Hall Data Mining: Practical Machine Learning; Elsevier: Amsterdam, The Netherlands, 2011; ISBN 9780123748560. [Google Scholar]
- Moore, B.C. Principal Component Analysis in Linear Systems: Controllability, Observability, and Model Reduction. IEEE Trans. Autom. Control 1981, 26, 17–32. [Google Scholar] [CrossRef]
- Zhang, X.; Kano, M.; Li, Y. Principal Polynomial Analysis for Fault Detection and Diagnosis of Industrial Processes. IEEE Access 2018, 6, 52298–52307. [Google Scholar] [CrossRef]
- Honeine, P. Online kernel principal component analysis: A reduced-order model. IEEE Trans. Pattern Anal. Mach. Intell. 2012, 34, 1814–1826. [Google Scholar] [CrossRef]
- Pourhossein, K.; Gharehpetian, G.B.; Rahimpour, E.; Araabi, B.N. A probabilistic feature to determine type and extent of winding mechanical defects in power transformers. Electr. Power Syst. Res. 2012, 82, 1–10. [Google Scholar] [CrossRef]
- Theodoridis, S.; Pikrakis, A.; Koutroumbas, K.; Cavouras, D. Introduction to Pattern Recognition: A Matlab Approach; Academic Press: Cambridge, MA, USA, 2010; ISBN 9780123744869. [Google Scholar]
- BinFeng, Y.; FeiLu, L.; Dan, H. Research on edge identification of a defect using pulsed eddy current based on principal component analysis. NDT E Int. 2007, 40, 294–299. [Google Scholar] [CrossRef]
- Dinesh, C.; Nettasinghe, B.W.; Godaliyadda, R.I.; Ekanayake, M.P.B.; Ekanayake, J.; Wijayakulasooriya, J.V. Residential Appliance Identification Based on Spectral Information of Low Frequency Smart Meter Measurements. IEEE Trans. Smart Grid 2016, 7, 2781–2792. [Google Scholar] [CrossRef]
- Stankovic, V.; Liao, J.; Stankovic, L. A graph-based signal processing approach for low-rate energy disaggregation. In Proceedings of the IEEE SSCI 2014—2014 IEEE Symposium Series on Computational Intelligence—CIES 2014: 2014 IEEE Symposium on Computational Intelligence for Engineering Solutions, Orlando, FL, USA, 9–12 December 2014; pp. 81–87. [Google Scholar]
- Parson, O.; Ghosh, S.; Weal, M.; Rogers, A. Non-intrusive load monitoring using prior models of general appliance types. In Proceedings of the National Conference on Artificial Intelligence, Toronto, ON, Canada, 22–26 July 2012; Volume 1, pp. 356–362. [Google Scholar]
- Liao, J.; Elafoudi, G.; Stankovic, L.; Stankovic, V. Power Disaggregation for Low-sampling Rate Data. In Proceedings of the 2nd International Non-intrusive Appliance Load Monitoring Workshop, Austin, TX, USA, 3 June 2014; pp. 1–4. [Google Scholar]
- Zeifman, M. Disaggregation of home energy display data using probabilistic approach. IEEE Trans. Consum. Electron. 2012, 58, 23–31. [Google Scholar] [CrossRef]


| REDD Houses | Appliances |
|---|---|
| House 1 | Wall oven, refrigerator, dishwasher, kitchen outlets, lighting, washer dryer, microwave, bathroom ground fault interrupters (GFI), electric heat, stove, different |
| House 2 | Kitchen outlets, lighting, stove, washer dryer, microwave, refrigerator, dishwasher, garbage, different |
| House 3 | Electronics, lighting, refrigerator, unknown, dishwasher, furnace, washer dryer, microwave, smoke alarms, garbage, bathroom GFI, kitchen outlets, different |
| Eigenvalue | 535.24 | 208.28 | 65.38 | 21.07 | 5.90 |
| ACR | 0.713 | 0.908 | 0.954 | 0.987 | 0.991 |
| Appliance Identification Method | Remarks | F-Score |
|---|---|---|
| Proposed Method | Using all appliances from REDD houses 1, 2, and 3 | 94.68% |
| Basic NILM [42] | Using all appliances from REDD | 79.7% |
| Supervised GSP [43] | Using 5 appliances selected from the REDD | 64% |
| Unsupervised GSP [32] | Using 5 appliances selected from the REDD | 72.2% |
| Unsupervised HMM [44] | Using 7 appliances selected from the REDD | 62.2% |
| Unsupervised dynamic time warping (DTW) [45] | Using 9 appliances selected from the REDD | 68.6% |
| Supervised decision-tree (DT) [45] | Using 9 appliances selected from the REDD | 76.4% |
| Viterbi algorithm [46] | Using 9 appliances selected from the REDD | 88.1% |
© 2020 by the authors. Licensee MDPI, Basel, Switzerland. This article is an open access article distributed under the terms and conditions of the Creative Commons Attribution (CC BY) license (http://creativecommons.org/licenses/by/4.0/).
Share and Cite
Moradzadeh, A.; Sadeghian, O.; Pourhossein, K.; Mohammadi-Ivatloo, B.; Anvari-Moghaddam, A. Improving Residential Load Disaggregation for Sustainable Development of Energy via Principal Component Analysis. Sustainability 2020, 12, 3158. https://doi.org/10.3390/su12083158
Moradzadeh A, Sadeghian O, Pourhossein K, Mohammadi-Ivatloo B, Anvari-Moghaddam A. Improving Residential Load Disaggregation for Sustainable Development of Energy via Principal Component Analysis. Sustainability. 2020; 12(8):3158. https://doi.org/10.3390/su12083158
Chicago/Turabian StyleMoradzadeh, Arash, Omid Sadeghian, Kazem Pourhossein, Behnam Mohammadi-Ivatloo, and Amjad Anvari-Moghaddam. 2020. "Improving Residential Load Disaggregation for Sustainable Development of Energy via Principal Component Analysis" Sustainability 12, no. 8: 3158. https://doi.org/10.3390/su12083158