Article

Enhancing Integrated Power and Water Distribution Networks Seismic Resilience Leveraging Microgrids

1
Department of Electrical Engineering, Ferdowsi University of Mashhad, Mashhad, Iran
2
Department of Energy Technology, Aalborg University, 9220 Aalborg, Denmark
3
Faculty of Electrical and Computer Engineering, University of Tabriz, 5166616471 Tabriz, Iran
*
Author to whom correspondence should be addressed.
Sustainability 2020, 12(6), 2167; https://doi.org/10.3390/su12062167
Submission received: 30 January 2020 / Revised: 5 March 2020 / Accepted: 9 March 2020 / Published: 11 March 2020
(This article belongs to the Collection Microgrids: The Path to Sustainability)

Abstract

:
An earthquake, as one of the natural disasters, can damage vital infrastructures including the power distribution network (PDN) and water distribution network (WDN). The dependency of WDN on PDN is the other challenge that can be highlighted after the earthquake. In this paper, the resilience improvement planning of integrated PDN and WDN against earthquakes is solved through stochastic programming. Power lines and substation hardening in PDN and water pipes rehabilitation with better material are the candidate strategies to minimize the expected inaccessibility value of loads to power and water as the resilience index and to minimize the cost of strategies. The proposed model is tested on the modified IEEE 33-bus PDN with a designed WDN and its performance is evaluated under different cases where the impacts of using distributed generations (DG) in PDN, equipping the water pumps to back-up generators, and the value of loads accessibility to water on the system resilience are investigated.

1. Introduction

Long inaccessibility of cities and societies to critical infrastructures including power and water after earthquakes has highlighted the importance of resilience improvement planning of the power distribution network (PDN) and water distribution network (WDN). Traditionally, N-1 or N-k security indices guaranteed the reliability of energy networks. However, low-probability but high-impact events that can trigger the interdependencies of infrastructures may surpass the traditional reliability methods.
Simultaneous resilience improvement planning of PDN and WDN has different advantages over the individual system planning. The dependency of WDN on PDN due to water pumps operation as one important reason for the inaccessibility of loads to water is ignored in the resilience study of an individual WDN. Although, a number of water pumps might be equipped to emergency generators. But, these units are not efficient in long emergency conditions resulting from natural disasters due to fuel limitation [1]. Furthermore, with simultaneous analysis and improvement of the resilience of PDN and WDN, the allocated budget is spent in such a way that the accessibility of all loads to power and water will be improved. In other words, the problem detects the priority of PDN and WDN to enhance resilience considering the budget limits [2].

1.1. Background and Previous Works

The previous works can be reviewed in three categories: 1—Resilience study of PDN, 2—Resilience study of WDN, and 3—Resilience study of joint PDN and WDN.

1.1.1. Resilience Study of PDN

Three types of strategies can be adapted for a PDN to enhance resilience including pre-natural disasters actions, operational, and planning types [3]. The first type can be implemented only for predictable natural disasters such as hurricanes. Crews or mobile generators pre-positioning is among the first type of resilience improvement strategies, which aims to minimize the expected outage duration of disconnected loads [4,5]. An earthquake is an unpredictable natural disaster and this type of strategy is not efficient to enhance the resilience of PDN against earthquakes.
Operational strategies as the second type of resilience improvement strategies that can be efficient against any natural disasters refer to actions after natural disasters occurrence to help the PDN to deal better with emergency conditions. Microgrids formation by distributed generation (DG) is one of the well-known operational resilience improvement strategies. This strategy partitions the PDN into some smaller self-sustained networks [6]. Another operational strategy for enhancing the resilience of PDN is modeling the microgrids as emergency sources for PDN [7]. Microgrids are independent AC or DC energy networks that can be operated in an isolated or connected mode [8,9].
Planning strategies are the last type of aim to improve the resilience of PDN for a long time. Some kinds of these strategies try to physically enhance the network such as pole hardening [10,11] and strengthening the substations with anchored components [12] to decrease the damaged probability of components against natural disasters. Another strategy toward this type is to place distributed means of generation or energy storage devices in the PDN [13,14,15].
According to the above categories, this paper belongs to the third type of resilience improvement of PDN which can be named resilience improvement planning of PDN. In this kind of problem, it is important to determine which kind of resilience improvement strategies should be implemented in the PDN as candidate strategies, how they will be modeled in the problem, and which kind of optimization tool will be implemented to solve the problem. It is worth mentioning that the best candidate strategies for improving the resilience of PDN should be chosen based on the conditions and the type of natural disasters threatening the PDN. For example, undergrounding the cables can increase the resilience of PDN against hurricanes, however, it might not be an efficient solution against floods or earthquakes. The optimization tool can impact the modeling of strategies in the problem. For example, when robust optimization is implemented in [10] to solve the problem, if a power distribution line is chosen to be hardened, that line will not be vulnerable against natural disasters anymore. Another limitation of robust optimization is that when different candidate strategies (line hardening and DG placement) are implemented such as in [10], reconfiguration cannot be implemented to restore the network. Due to these limitations of robust optimization, stochastic optimization has been used to solve the problem in recent works such as [1,16]. In stochastic programming, which is implemented in [1,16], the final decision will be obtained by studying a set of scenarios that are produced by uncertain parameters of the problem.

1.1.2. Resilience Study of WDN

Earthquake and flood are two high potential natural disasters that can severely damage the WDN. The 2011 Japan Earthquake disconnected the accessibility of 2,300,000 households to water [17]. The most vulnerable components which are forming most of the WDN are the pipes [18]. Numerous works with different models such as stochastic framework or fuzzy TOPSIS technique have tried to identify the critical pipes [19,20,21]. Other components of WDN such as water tanks and water resources are less vulnerable and they can be hardened well as only a small number of them exist in WDN. As mentioned in [22], four factors including pipe diameter, pipe material, topography, and soil liquefaction determine the vulnerability of a water pipe against an earthquake. Therefore, to enhance the resilience of WDN, some of the mentioned factors should be improved. In other words, the WDN should be rehabilitated based on the conditions of the WDN and the region where it is located. In [23], two resilience improvement strategies, including replacement of water pipes with better materials and different diameters, are implemented to enhance the resilience of WDN against an earthquake. Due to the limitation of the budget, only a few numbers of critical pipes in a WDN can be rehabilitated.

1.1.3. Simultaneous Resilience Study of PDN and WDN

Each network is composed of nodes and links. Topological and flow-based are two available analysis methods to study the vulnerability of a network. In the topological method, graph theory and structural indices are used to investigate the vulnerability of a network. In contrast, the flow-based method utilizes physics-based equations to assess the vulnerability of a network. The serviceability of the network can be predicted with high accuracy using a flow-based analysis compared to the topological method [19,24]. Most of the works, such as [25,26,27], that studied the simultaneous resilience of power and water distribution networks have implemented the topological analysis method. However, in this works, the technical equations related to each network such as power flow equations in PDN and water flow equations in WDN are not considered. This issue has been resolved in [1,16] by proposing a joint model of PDN and WDN where power/water flows can be analyzed throughout the network, but the vulnerability of WDN to natural disasters has been neglected in that study. In other words, the mentioned works solve the resilience improvement planning problem of PDN and WDN against hurricanes and the only reason for loads inaccessibility to water is the dependency of WDN on PDN.

1.2. Contribution of The Paper

In light of the reviewed literature, this paper enhances the resilience of PDN and WDN by using technical equations related to each network against earthquakes which can damage both networks. Substation and power lines hardening in PDN and water pipes rehabilitation with better material in WDN as three candidate strategies are implemented through a stochastic framework to maximize the resilience of integrated PDN and WDN and to minimize the planning cost.
The proposed method can identify vulnerable parts in both PDN and WDN and do the needed contingency analysis following an event to determine the most efficient resilience improvement strategy. By using the proposed method, the impact of DGs in PDN, emergency generators of water pumps in WDN and the value of loads accessibility to water on the resilience level of the networks can also be investigated.
The rest of the paper is organized as follows. The general framework of the proposed stochastic programming including uncertain parameters, scenarios generation, and scenario reduction method is explained in Section 2. Section 3 formulates the resilience improvement planning of integrated PDN/WDN and presents the solution methodology. Numerical case studies are presented in Section 4. Finally, Section 5 concludes the paper.

2. General Framework of the Proposed Stochastic Programming

In the resilience improvement planning of integrated power/water distribution networks, a number of uncertainties might exist. These main factors include: (1) the severity of earthquakes, (2) time of event occurrence in a day, (3) operational states of substation and power lines in PDN and water pipes in WDN, (4) repair time of damaged component, (5) the accessibility of a load to water, and (6) value of loads inaccessibility to power and water. It is worth mentioning that only some of these factors with more importance are considered as uncertain parameters in the proposed model. If the uncertain parameters increase in a stochastic problem, it is vital to generate more scenarios for studying and it means the computational burden of the problem will be increased significantly. To well address such uncertainties in an operational planning problem, stochastic programming techniques for analysis of potential future events can be effectively used. To generate such events (also called scenarios), the uncertainty of each parameter is essential to be modeled.
In this paper, the historical seismic data of an area is used to generate stochastic earthquake events. According to [21], the uncertainty of the earthquake magnitude in each scenario is formulated as (1) by using a cumulative density function and inverse transform sampling:
F M = 1 e ( β M ) e ( β M max ) e ( β M min ) e ( β M max ) ,
where β = d ln 10 and d = 0.8 are obtained by analyzing the historical data of earthquakes [17]. To determine the magnitude of the earthquake in a scenario, a random number between 0 and 1 is generated by uniform distribution and then it is projected into the cumulative distribution function. In order to assess the intensity of an earthquake, in addition to the magnitude, another factor as the location of the earthquake is also important. Therefore, by using the location and magnitude, PGA (Peak Ground Acceleration) of the earthquake as (2) can be calculated, which is needed to evaluate the vulnerability of components in the networks. There are different equations for calculating the PGA. In this paper, Equation (2) is obtained from [28]. It should be noted that the PGA equation can be changed based on the region where the PDN and WDN are located. The used PGA in this paper belongs to rock and soil grounds such as Iran, Tehran:
ln PGA = 4.15 + 0.623 ( M + 0.38 1.06 ) 0.96 ln ( Δ ) .
The occurrence time of the earthquake in a day is modeled by a random number between 1 and 24. This parameter shows the time that the restoration of the networks will be triggered.
The failure probability of a structure against the severity of an earthquake is called fragility function [29]. By using different fragility functions, the operational states of substation which supply the PDN, power lines in PDN, and water pipes in WDN should be determined. According to (3), cumulative normal distribution function with various parameters is used to show the fragility function of a power pole or substation. In this paper, a power distribution line is out of service if one of its’ power pole is damaged against an earthquake:
p f pole   or   sub ( PGA ) = Φ [ ln ( PGA / m pole   or   sub ) / ξ pole   or   sub ] .
The fragility function of a water pipe is considered as below [17]. According to (4), in addition to the length of a pipe and PGA of an earthquake, four other factors affect the vulnerability of a pipe against earthquakes. These factors depend on the water pipe characteristics (pipe diameter ( C 1 ) and pipe material ( C 2 )), surrounding soil characteristics and topology (topography ( C 3 ) and liquefaction ( C 4 )):
p f pipe = 1 exp ( 0.00187 C 1 C 2 C 3 C 4 PGA × L ) .
Now, in order to determine the operational states of the substation, power lines, and water pipes in each scenario, a random number between 0 and 1 is generated for each component and compared with the failure probability of that component which is obtained from the fragility function. If the random number is less than the failure probability, then the component is considered to be damaged, otherwise it will be operated.
A set of scenarios will be generated and due to computational burden, only a few of them will be analyzed. Backward scenario reduction as a well-known method will be applied to obtain the final scenarios set [30].

3. Problem Formulation and Solution Methodology

3.1. Problem Formulation

The problem is formulated in the form of multi-objective stochastic programming. The first objective function takes the resilience index into consideration and aims at minimizing the expected inaccessibility value of loads to power and water due to the earthquakes:
O F 1 = min s = 1 N s ρ s l = 1 N l t = t s 0 t s 0 + T s ( I V P l , t α s , l , t + I V W l , t β s , l , t ) ,
where α is a binary variable that is indicated in (6).
α = { 1 if   load   is   connected 0 if   load   is   disconected ,
where unlike the binary accessibility of a load to power, the accessibility of a load to water is proportional to water pressure head in that node:
β = { 1       p h p h required ( p h p h required ) 2    p h < p h required .
The second objective function of the problem considers the minimization of the total cost of planning including power lines and substation hardening and water pipes rehabilitation. In this paper, it is assumed that the life span of all candidate strategies is equal. Ignoring this assumption, the model also should consider the life cycle cost of candidate strategies:
O F 2 = min p l = 1 N p l p w Ω p l C p l H + w p = 1 N w p w t Ψ w p C w p R + s b = 1 N s b λ s b C s b H .
For each scenario, the restoration and recovery of the networks will be solved in such a way that the accessibility of loads to power and water be maximized. A disconnected load in PDN can be restored by reconfiguration or by microgrid formation using DGs. If the disconnected loads include water pumps, by analyzing the WDN considering the water pipes damages, the level accessibility of loads to water will be assessed and then it will be decided that the disconnected water pumps be restored or not.
Throughout the entire PDN, constraints (9)–(13) must be satisfied. Equations (9)–(10) denote the power balance constraints:
P i u , s , t = | V i u , s , t | | V j u , s , t | ( G i j cos θ i j u , s , t + B i j sin θ i j u , s , t ) s { 1 , 2 , , N s } , u { 1 , 2 , , U s , t + 1 } , i { 1 , 2 , , N b u , s , t } , t [ t s 0 , t s 0 + T s ] ,
Q i u , s , t = | V i u , s , t | | V j u , s , t | ( G i j sin θ i j u , s , t B i j cos θ i j u , s , t ) s { 1 , 2 , , N s } , u { 1 , 2 , , U s , t + 1 } , i { 1 , 2 , , N b u , s , t } , t [ t s 0 , t s 0 + T s ] .
In any operating mode, bus voltages and line flows must be kept within a safe range indicated by (11)–(12), respectively:
| V min | | V i u , s , t | | V max | s { 1 , 2 , , N s } , u { 1 , 2 , , U s , t + 1 } , i { 1 , 2 , , N b u , s , t } , t [ t s 0 , t s 0 + T s ] ,
| I i j u , s , t | | I i j max | s { 1 , 2 , , N s } , u { 1 , 2 , , U s , t + 1 } , i { 1 , 2 , , N b u , s , t } , t [ t s 0 , t s 0 + T s ] .
Equation (13) guarantees the radiality of each network:
N b u , s , t = N l i n e u , s , t + 1 s { 1 , 2 , , N s } , u { 1 , 2 , , U s , t + 1 } , t [ t s 0 , t s 0 + T s ] .
Furthermore, in each intentional islanded network (microgrid) which includes one or more DGs, Equations (14)–(15) as constraints must be satisfied. Equations (14) and (15) show that the active/reactive of each DG should not exceed the maximum active/reactive capacity of that DG:
P D G g u , s , t P D G g max s { 1 , 2 , , S } , u { 1 , 2 , , U s , t } , g { 1 , 2 , , N D G u , s , t } , t [ t s 0 , t s 0 + T s ] ,
Q D G g u , s , t Q D G g max s { 1 , 2 , , S } , u { 1 , 2 , , U s , t } , g { 1 , 2 , , N D G u , s , t } , t [ t s 0 , t s 0 + T s ] .
To calculate the accessibility of loads to water, it is necessary to formulate the hydraulic model of the WDN. According to [31], there are three fundamental equations. The first equation explained in (16) is the mass conservation that must be satisfied at the nodes except fixed-head nodes such as reservoirs of WDN:
w p L K n f w p , t , s + F n , t = 0 , s { 1 , 2 , , N s } n { 1 , 2 , , N n w a t e r N R w a t e r } , t [ t s 0 , t s 0 + T s ] .
Moreover, according to (17), energy conservation must be satisfied in each simple loop of the water network:
w p = 1 w p l s h w p , l s , t , s = 0 l s { 1 , 2 , , L S } , t [ t s 0 , t s 0 + T s ] , s { 1 , 2 , , N s } .
The last equation represents the hydraulic head loss. This equation shown in (18) indicates the head loss of a pipe as a function of the flow through the pipe:
h w p = x f w p y ,
where x and y are coefficients which are determined based on the Hazen–Williams model.

3.2. Solution Methodology

Greedy search as an iterative algorithm is utilized in this paper to solve the problem. In order to implement the greedy search algorithm, the aforementioned objective functions are mapped into the following mixed-objective function:
O F = max O F 1 i t r 1 O F 1 i t r cos t _ st s t s t { 1 , 2 , , N s t } .
In each iteration of the greedy search algorithm, the problem is solved considering the objective function in (19) which is indicating the difference of resilience improvement (expected inaccessibility of loads to power and water) compared to the previous iteration (itr-1) per cost of each chosen strategy. This iterative procedure will be continued until the maximum budget (determined by the planner) is exhausted. Another advantage of this approach is that the priority of each strategy can be determined in enhancing the resilience of PWN and WDN. In other words, the problem can be solved to choose a specific number of strategies to yield the maximum resilience improvement per cost of strategies.
In order to assess the accessibility of loads to power and water of each scenario, both PDN and WDN should be analyzed based on the problem formulation. The PDN and WDN analyses are done in MATLAB and EPANET, respectively. EPANET is a WDN modeling software package that can facilitate the extended-period simulation of hydraulic behavior within pressurized pipe networks with high precision. To enable the joint operation of PDN and WDN while capturing systems interactions, an interface for data exchange between simulation platforms (i.e., MATLAB and EPANET) is established. To solve the restoration problem of PDN reconfiguration option to reroute the power from the substation and microgrids formation by DG(s) are available. To this end, the number of autonomous islanded networks (clusters) that could be formed for serving local loads should be defined. In this paper, graph theory and the modified Viterbi algorithm, which is proposed in [32] and improved in [1], is utilized to solve the restoration problem. Veterbi is like dynamic algorithms and in each stage, some candidate switching states are checked until the maximum disconnected loads be restored. In the improved version of the Veterbi algorithm, the number of candidate switching states is decreased. The effectiveness of this method in solving the problem is shown in [1]. It should be noted that if the substation in the main network is also damaged, the disconnected loads can be restored only by microgrid formation. By using the method in [33], the restoration trees will be constructed for each DG and the best path will be chosen based on the objective function of the problem. If there exist power distribution lines in a region to feed the load through one or more DGs locally, then those DGs and corresponding local loads can be merged into a single microgrid. The accessibility of loads to water also will be obtained by EPANET considering the water pipes damages. If disconnected loads include water pumps, by using EPANET, the impact of restoration of each disconnected water pump on the accessibility of loads to water will be calculated.

4. Simulations and Results

To illustrate the effectiveness of the proposed method, the modified IEEE 33 bus PDN with connected DGs and its related designed WDN as shown in Figure 1 is studied.
The capacity of each DG is assumed to equal to 150 kW. The active/reactive power peak demands of PDN and water peak demand of WDN are depicted in Figure 2.
To obtain these values at different hours of a day, they should be multiplied in the related hourly multipliers which are illustrated in Figure 3.
The multipliers of active/reactive power demands show the normalized loads values based on the maximum load, while the hourly multipliers in WDN are denoting the hourly normalized water needs based on the minimum demand in a day. The water demand of commercial loads is considered constant during a day.
The value of load inaccessibility to power and water is depicted in Figure 4. It is assumed that the loads in nodes (19–22) are commercial, while the rests are residential. Power accessibility is more important than water accessibility for a commercial load. Therefore, according to Figure 4, the inaccessibility value of commercial loads to power is much more than the inaccessibility value to water. Loads in nodes 5 and 33 of the distribution network are water pumps. Thus, the value of load inaccessibility to water of these nodes is zero. It should be noted that the dynamic value of each water pump for restoration will be determined in the restoration problem. In order to determine the importance of one pump, the accessibility function of loads will be obtained with EPANET and will be compared with the state in which the water pump is restored.
The minimum and maximum magnitudes of the earthquake are considered 3 and 7 Richter, respectively. The distance of networks from focus of an earthquake is assumed to be 10 km. The fragility function of each power pole and substation before and after hardening are depicted in Figure 5.
Cost of each power pole and substation hardening are assumed equal to 5000$ and 56,000$, respectively. As mentioned before, in order to rehabilitate the water pipes as a resilience improvement strategy, the material of a water pipe will be improved. Therefore, by implementation of this strategy, parameter C2 (pipe material correction factor) will be changed from 1 to 0.3. The cost of this strategy for water pipes with diameters of 80, 100, 150, 200, and 250 mm are 28.6$, 28.6$, 35.24$, 52.8$, and 95.26$ per meter, respectively [34]. C1 as water pipe diameter is obtained from [20] and other factors (C3 and C4) are assumed to be 1.
The repair time of the damaged power line, substation, and water pipe considering the PGA of an earthquake is tabulated in Table 1.
Fifty scenarios are produced to solve the scenarios. The PGA of each scenario is shown in Figure 6.
Furthermore, Figure 7 depicts that each component including the power line, water pipe, and substation experience how many failures in the scenarios set.
  • Case 1: In this case, the resilience improvement planning of PDN/WDN with DGs in PDN is solved for budget constraint equal to 100,000$. The results are shown in Table 2.
According to Table 2, step 0 evaluates the resilience level of PDN and WDN before solving the problem. In other words, the expected inaccessibility value of loads to power and water against an earthquake is 36,963.8$. In step 1 and with objective function in (20), the best and most efficient strategy for improving the resilience of PDN and WDN is to harden line 3–4 in PDN. This strategy can decrease the expected inaccessibility value of loads to power only by 2.44%. However, this strategy decreases the expected inaccessibility value of loads to water by 24.3%. In other words, this strategy improves the resilience of WDN by decreasing the dependency of WDN on PDN. By hardening power line 3–4, the path between DG in node 3 and water pump in node 5 is more robust against an earthquake and backup power could be provided once an emergency case is triggered. In step 2, water pipe 6–7 is chosen to be rehabilitated with better material. Maybe, based on the topological method, it seems that water pipe 5–6 has more priority than water pipe 6–7 to be rehabilitated. But, based on WDN physics equations, the pressure head of nodes (6)–(33) has better conditions with the water pump in node 33 as long as the exiting loop in WDN can be maintained. In step 3, the accessibility of these loads to water can be improved with the rehabilitation of the water pipe 4–5 which serves as the main link between nodes (2)–(5) and (19)–(25) and the water pipe in node 5. In the last step, the accessibility of loads to power is improved significantly by hardening the substation which is the main source of PDN. Finally, by spending 99,321$, the expected inaccessibility value of loads to power and water against an earthquake is decreased from 34,963.8$ to 25,667$ which denotes a great resilience improvement (nearly 27%). In order to understand the impact of DGs in PDN on the resilience level of the networks, in Case 2, the resilience improvement planning is solved again, but without DG.
  • Case 2: The goal of this case is to investigate the resilience of PDN and WDN without DGs. The results are expressed in Table 3. In this case, to compare the priority of chosen strategies with the previous case, the budget constraint is ignored and the problem is solved for obtaining four strategies.
According to Table 3, the expected inaccessibility value of loads to power and water is 55,009.5$. In other words, resilience is decreased by 57.3% compared to the previous case when DGs exist and form the microgrid to restore the disconnected loads. Since the only power source of PDN in this case is the main substation, substation hardening is chosen as the first action plan in step 1. Unlike the previous case, this strategy is chosen with high priority. By doing so, not only the accessibility of loads to power improve, but also, the dependency of WDN on PDN is significantly decreased. In other steps including 2, 3, and 4, hardening of power lines 1–2, 2–3, and 3–4 are chosen to enhance the resilience of PDN and WDN through making a reliable path between the only power source (main substation) and the loads in PDN. It should be noted that these strategies can also decrease the dependency of WDN on PDN. According to Figure 7, the number of failures of line 1–2 is less than the other power lines in the scenarios set. But, due to the importance of this line that plays an important role in delivering the energy to the loads, the hardening of this line can be efficient in improving the resilience of PDN and WDN. As the results show, the DGs in PDN can significantly enhance the accessibility of loads to power and also decrease the dependency of WDN on PDN.
  • Case 3: In this case, it is assumed that all the water pumps are equipped to backup DGs during the whole emergency period. So, the only reason for loads inaccessibility to water is the water pipes damages. The results are tabulated in Table 4.
According to Table 4 and Table 2, the expected loads inaccessibility to water is decreased from 15,091.4$ to 4876.5$. This means the dependency of WDN on PDN is an important reason in the inaccessibility of loads to water. With the DGs in the PDN and equipping the water pumps to the emergency generators, the substation is chosen again in step 1 to be hardened. This strategy improves the expected accessibility of loads to power by 15.4%. In steps 2 and 3, two water pipes, 6–7 and 4–5, are chosen to be rehabilitated with better material to enhance the resilience of WDN. With these two strategies, the expected accessibility of loads to water is improved by 22.5%. Finally, in step 4, power line 1–2 hardening is chosen to improve the resilience of PDN. Considering the results shown in this case and the previous cases, the dependency of WDN on PDN can be the main reason for the inaccessibility of loads to water.
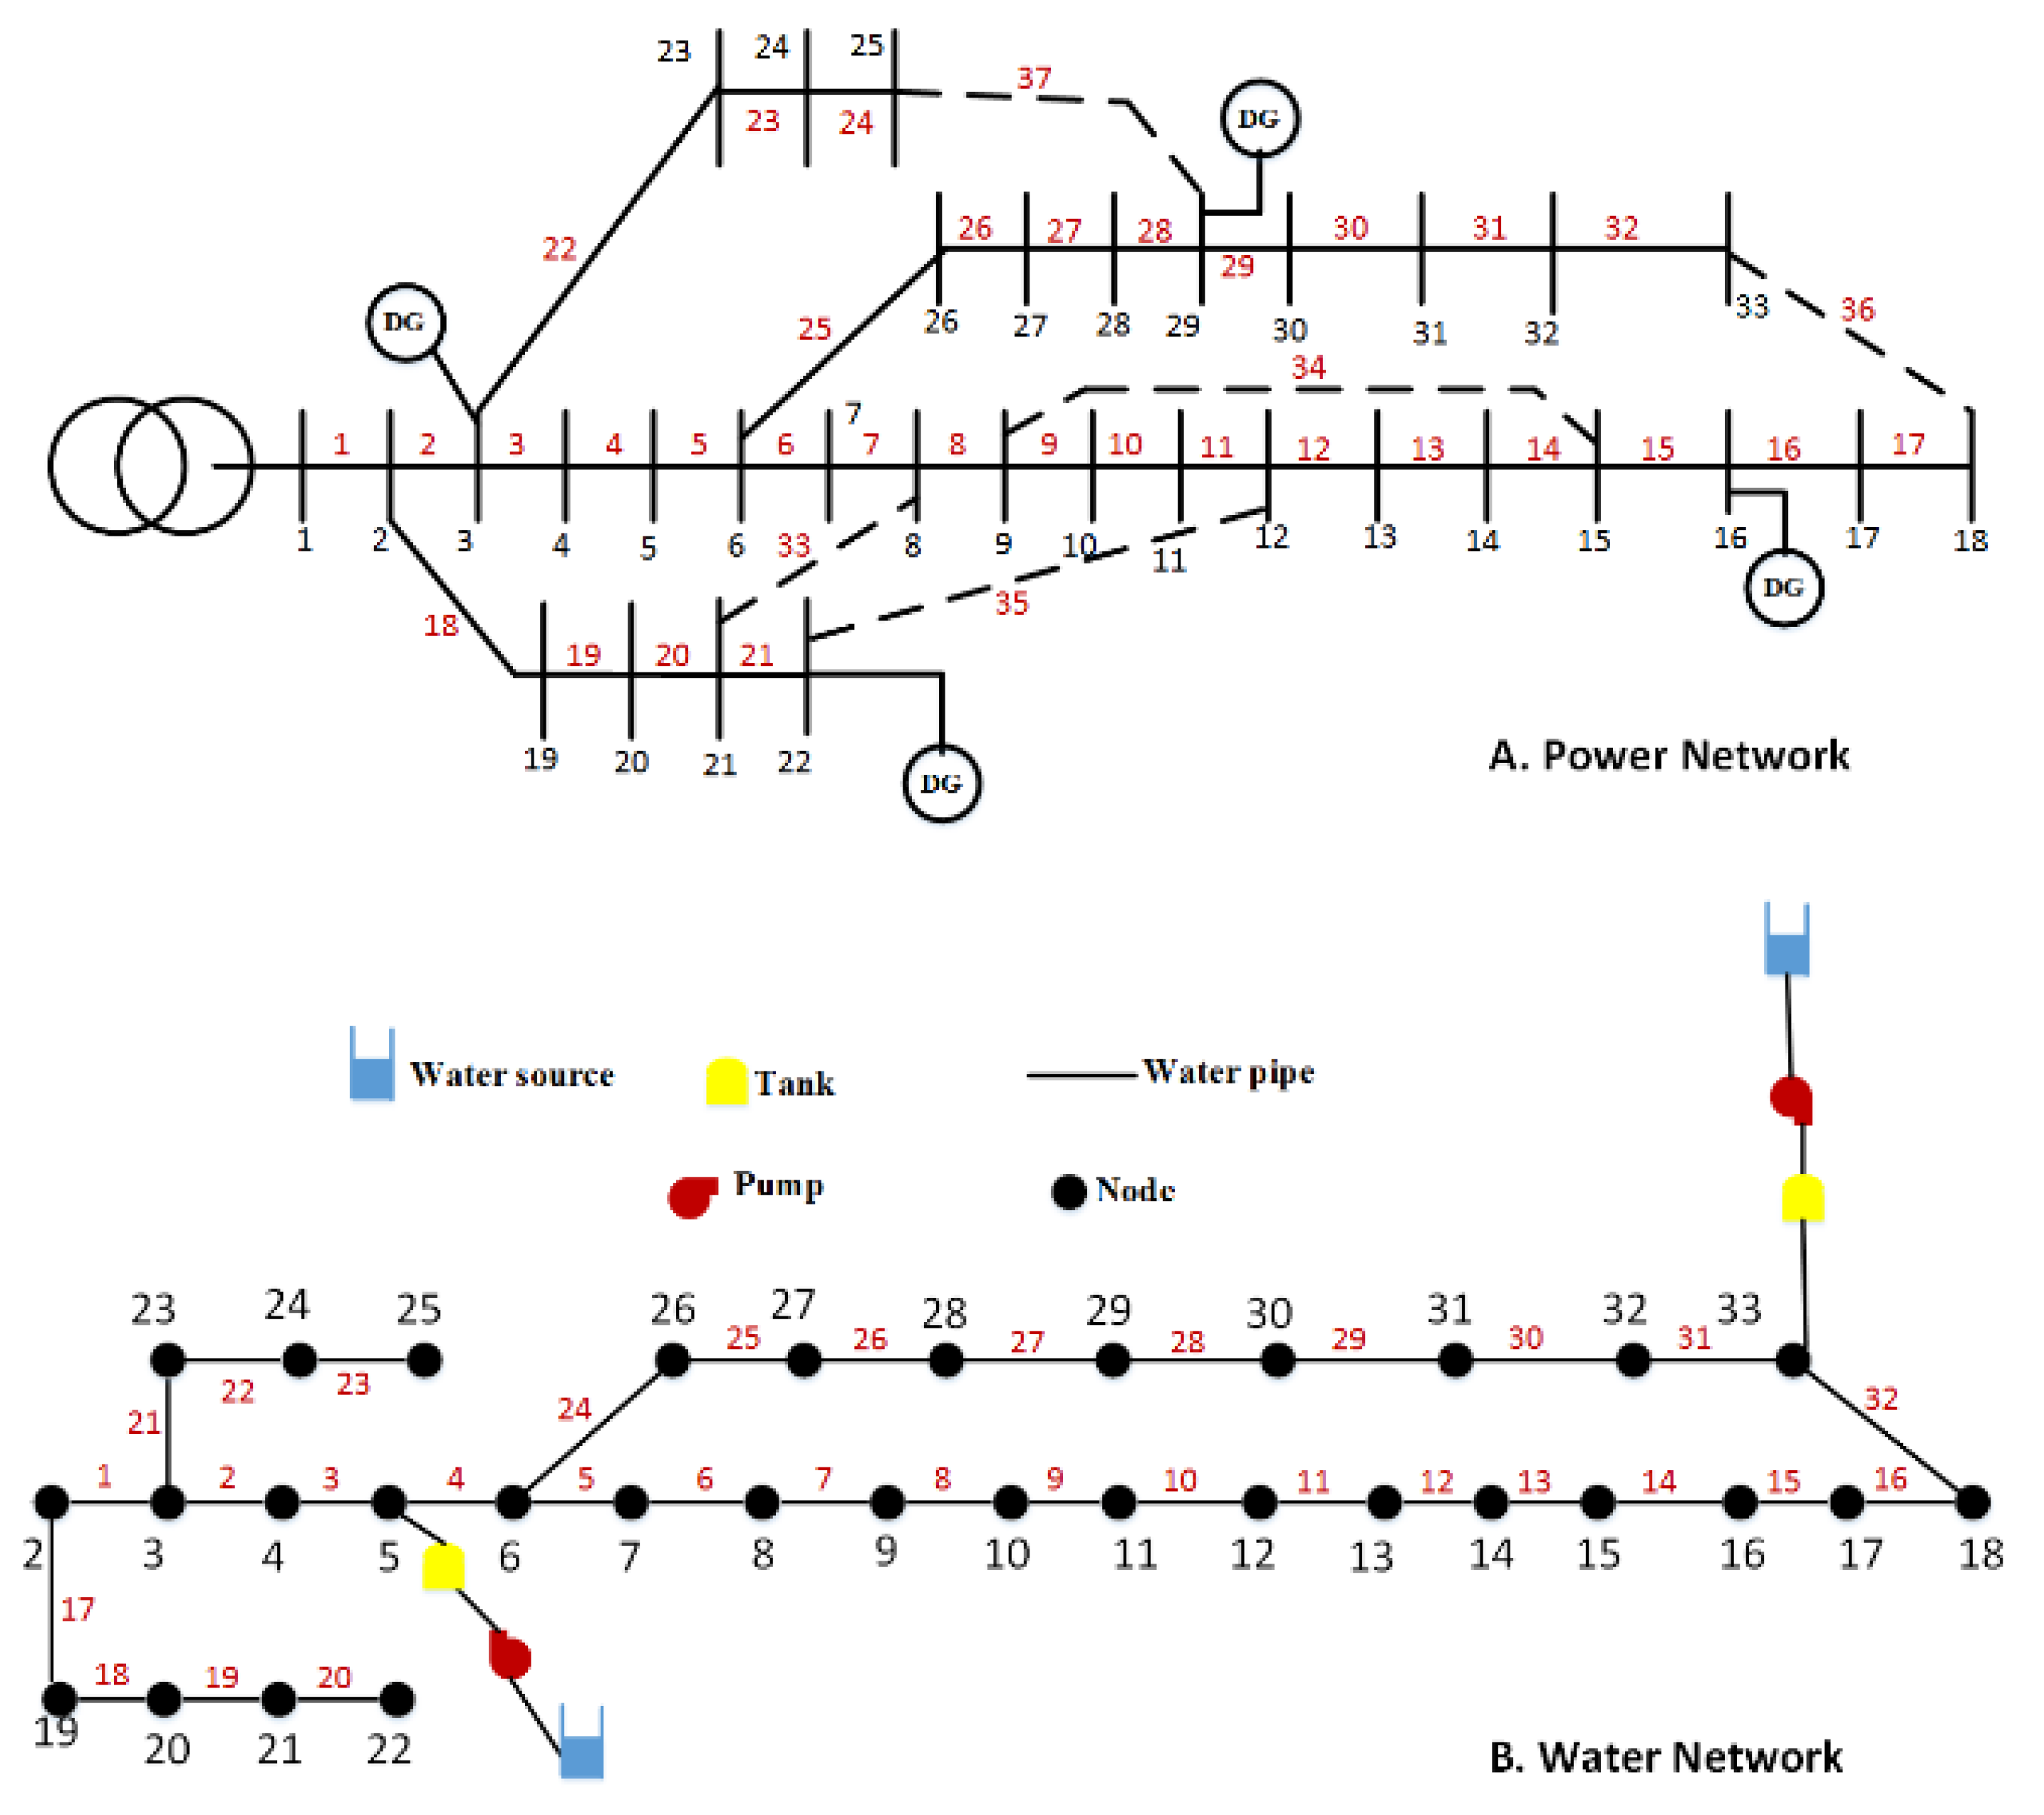
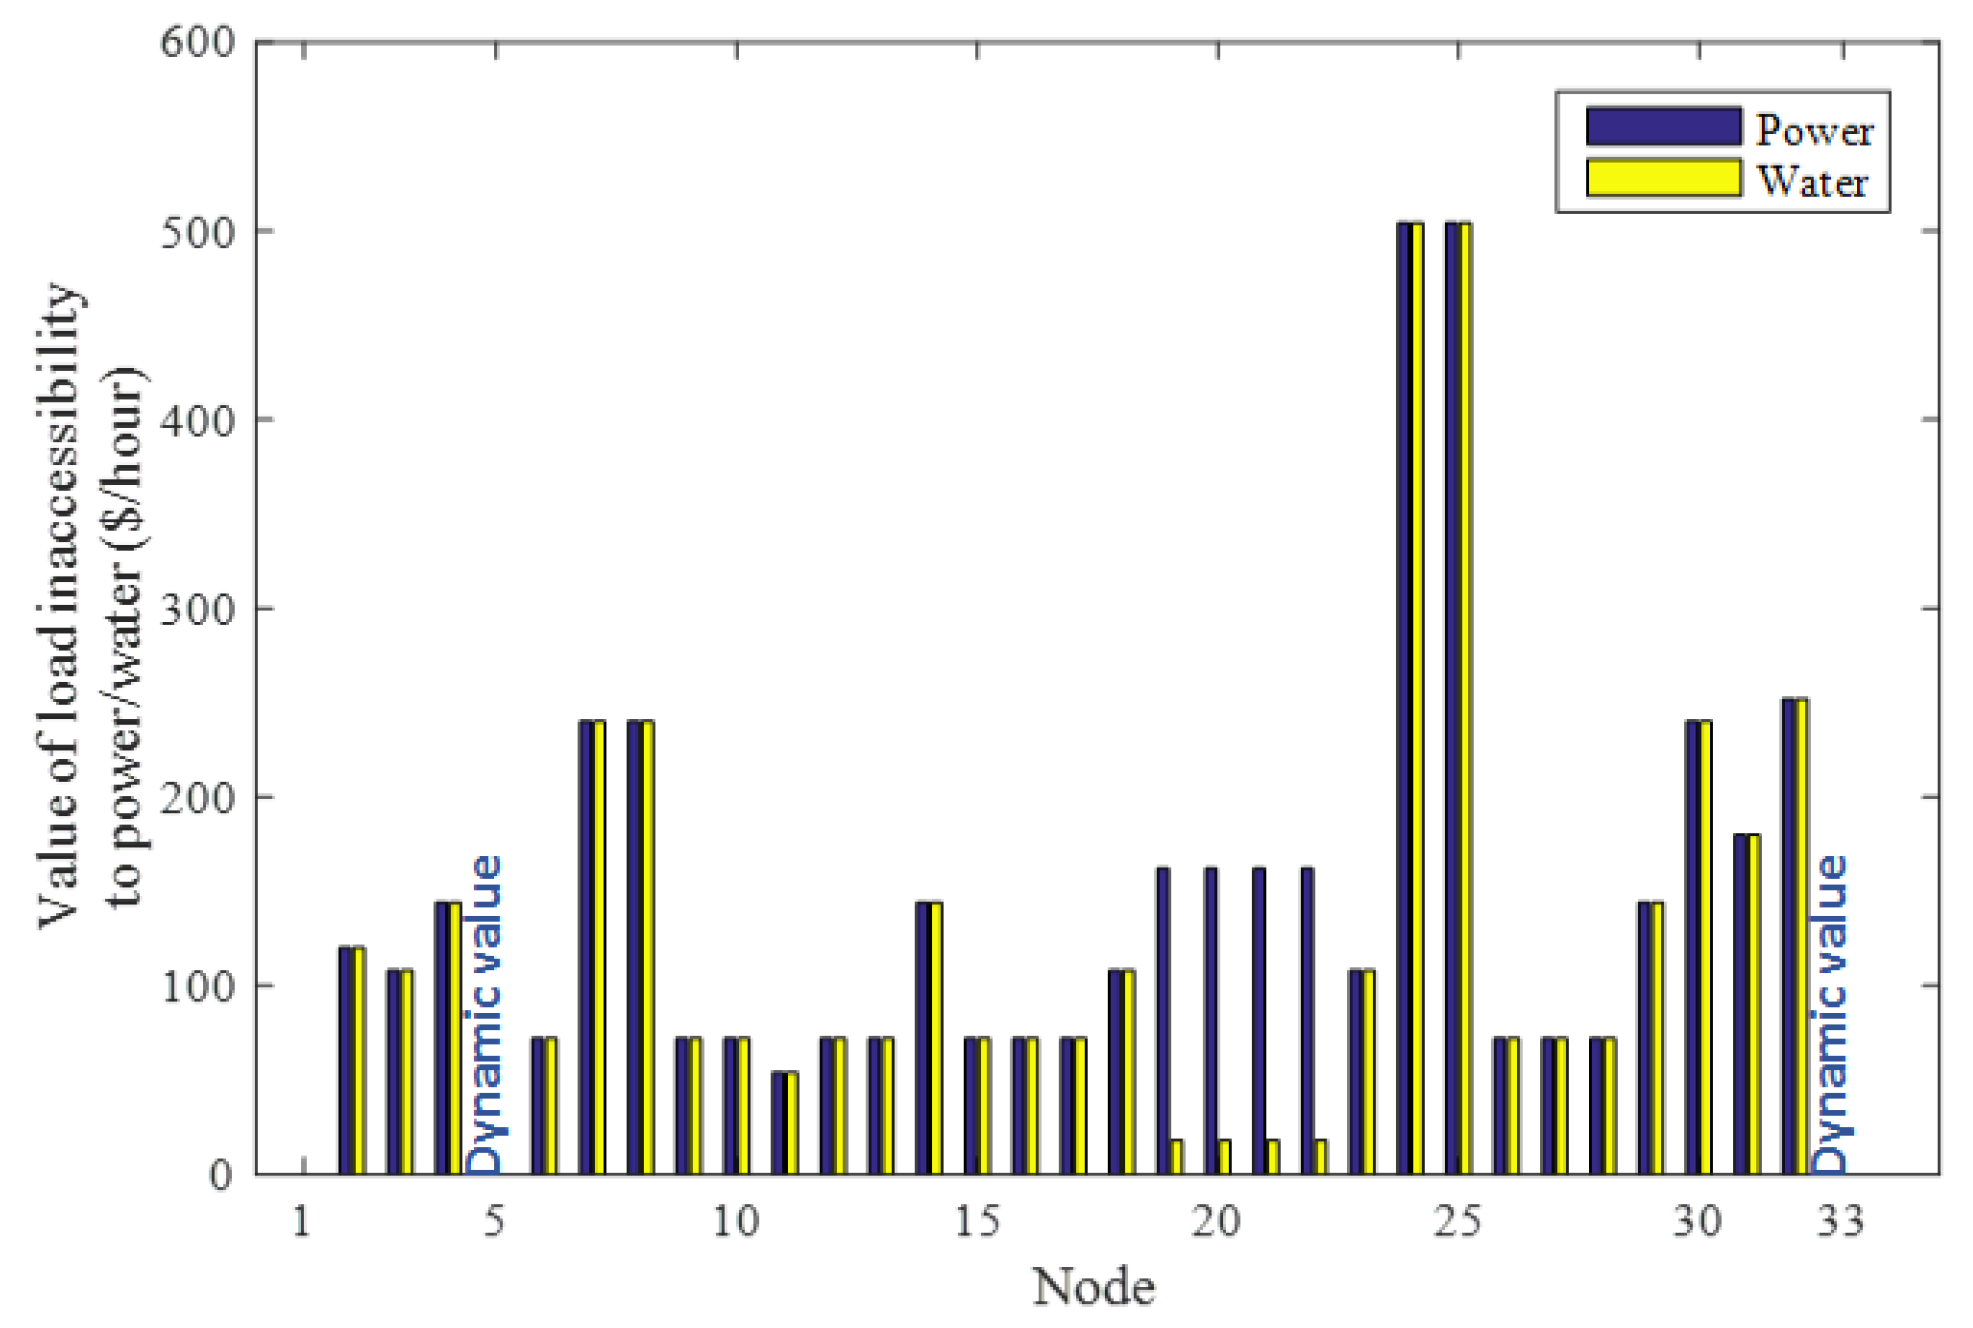
  • Case 4: This case is designed to investigate the impact of the value of loads inaccessibility to power and water on the planning results. The only difference of this case and Case 1 is that the loads inaccessibility values for residential loads are considered fifty times bigger than Case 1 (Figure 4). In other words, the residential loads accessibility to water is very important than to the power in this system. According to Table 5, which shows the results of this case, all the chosen strategies are in such a way to improve the accessibility of loads to water. Therefore, chosen strategies in steps 1 and 4 make the path between the substation and the water pump in node 5 more robust and decrease the dependency of WDN on PDN. Other chosen strategies in steps 2 and 4 with the rehabilitation of the water pipes, decrease the vulnerability of WDN against earthquakes.

5. Conclusions

In this paper, the resilience improvement planning of integrated PDN and WDN with candidate strategies including substation and power line hardening in PDN and water pipes rehabilitation with better material in WDN was solved. The results showed that the proposed method could determine the priority and kind of strategies based on the conditions of both PDN and WDN. The summary of the highlighted results is below:
  • Substation hardening as the most expensive but efficient strategy can enhance the resilience of PDN and WDN, significantly. When there is no DG in PDN and substation is the only power source, this strategy is chosen with high priority to improve resilience. This strategy can also decrease the dependency of WDN on PDN.
  • Rehabilitation of some water pipes can significantly improve the accessibility of loads to water. It should be noted that the identification of such water pipes for rehabilitation cannot be done based on a simple approach such as the topological method. Therefore, it is vital to assess the WDN based on a physics-based equation in WDN.
  • DGs are vital energy sources in PDN that can decrease the expected loads inaccessibility value to power and water by forming local microgrids. When there is no DG in PDN, strategies which enhance the path between substation and PDN will be chosen with high priority. Furthermore, in order to decrease the dependency of WDN to PDN with DGs, some strategies can be chosen to make a more robust path between DGs and important water pumps.
  • The main reason for loads inaccessibility to water is the dependency of water pumps on power outages. This challenge should be considered in the resilience improvement problem.
  • The importance of loads accessibility to power or water in a system affects the chosen strategies of the problem.

Author Contributions

J.N. designed the model, did the simulation studies and accomplished writing of the paper. A.P. and A.A.-M. supervised the whole work, revised the manuscript and checked the results. All authors have read and agreed to the published version of the manuscript.

Funding

This research received no external funding.

Acknowledgments

A.A.-M. acknowledges the support by “HeatReFlex-Green and Flexible Heating/Cooling” project (www.heatreflex.et.aau.dk) funded by Danida Fellowship Centre and the Ministry of Foreign Affairs of Denmark under the grant no. 18-M06-AAU.

Conflicts of Interest

The authors declare no conflict of interest.

Nomenclature

Indices
g, N D G u , s , t Index and the number of DGs in microgrid u in scenario s at hour t
i, jBus indices
l, N l Index and number of loads
ls, LSIndex and number of loops in WDN
n, N n w a t e r Index and number of nodes in WDN
pl, N p l p w Index and number of power lines
s, N s Index and number of scenarios
tTime index
sb, N s b Index and number of substations
uIndex for power network including the main network and intentionally islanded networks
wp, N w p w t Index and number of water pipes
Parameters and variables
C p l H , C w p R , C s b H Cost of power line pl hardening, cost of water pipe wp rehabilitation and cost of substation sb hardening, respectively.
C 1 , C 2 , C 3 , C 4 Correction factors for the pipe diameter, pipe material, topography and liquefaction, respectively.
F m Poisson cumulative distribution of earthquake magnitude
F n , t Node n demand at time t
f w p , t , s Pipe wp flow rate at hour t in scenario s
G i j , B i j Conductance and susceptance of the line which connects bus i and j,
h w p , l s , t , s Hydraulic head loss of pipe wp in loop ls at hour t in scenario s
I V P l , t , I V W l , t Inaccessibility value of load l to power and water at hour t, respectively.
Llength of the pipe
L K n Set of all links (pipes) connected to node n in WDN
M Specific magnitude magnitudes of the earthquake.
m , ξ Mean and standard deviation of cumulative normal distribution function
N l i n e u , s , t Number of power lines in network u in scenario s at hour
N b u , s , t Number of buses in network u in scenario s at hour t
N R w a t e r Number of fixed-head nodes in WDN
O F 1 , O F 2 First and the second objective function, respectively.
p f pipe , p f pole , p f sub Fragility function of a water pipe, power pole and substation, respectively.
P D G g max , Q D G g max Maximum active/reactive capacity of DG g
P D G g u , s , t , Q D G g u , s , t Active/reactive power of DG g in network u in scenario s at hour
P l o s s , l u , s , t , Q l o s s , l u , s , t Active/reactive loss of distribution line l in microgrid u in scenario s at hour t
P i u , s , t , Q i u , , s , t Active and reactive power injected into bus i in network u in scenario s at hour t
p h , p h required Water pressure head and required water pressure head for full accessibility of a load to water, respectively.
t s 0 , T The initial hour in each scenario (when the recovery of the networks starts right after the earthquake), the final hour in each scenario (when all the loads will access to power and water)
U s , t Number of microgrids at hour t in scenario s
Δ Distance from the earthquake focus
ρ s Probability of scenario s
α s , l , t , β s , l , t Accessibility state of load l to power and water at hour t in scenario s, respectively.
Ω p l , Ψ w p , λ s b Binary variables that determine the power line pl is hardened or not, the water pipe wp is rehabilitated or not and the substation sb is hardened or not, respectively.
θ i j u , s , t Difference phase voltage angle between bus i and j
| V i u , s , t | Voltage magnitude at bus i in network u in scenario s at hour t
| V min | , | V max | Minimum and maximum allowable voltage magnitude in the PDN
| I i j u , s , t | The line flow between bus i and j in network u in scenario s at hour t
| I i j max | Maximum allowable line current capacity between bus i and j

References

  1. Najafi, J.; Peiravi, A.; Guerrero, J.M. Power distribution system improvement planning under hurricanes based on a new resilience index. Sustain. Cities Soc. 2018, 39, 592–604. [Google Scholar] [CrossRef]
  2. Anvari-Moghaddam, A.; Mohammadi-Ivatloo, B.; Asadi, S.; Guldstrand Larsen, K.; Shahidehpour, M. Sustainable Energy Systems Planning, Integration, and Management. Appl. Sci. 2019, 9, 4451. [Google Scholar] [CrossRef] [Green Version]
  3. Wang, Y.; Chen, C.; Wang, J.; Baldick, R. Research on resilience of power systems under natural disasters—A review. IEEE Trans. Power Syst 2016, 31, 1604–1613. [Google Scholar] [CrossRef]
  4. Kavousi-Fard, A.; Wang, M.; Su, W. Stochastic Resilient Post-Hurricane Power System Recovery Based on Mobile Emergency Resources and Reconfigurable Networked Microgrids. IEEE Access 2018, 6, 72311–72326. [Google Scholar] [CrossRef]
  5. Lei, S.; Wang, J.; Chen, C.; Hou, Y. Mobile emergency generator pre-positioning and real-time allocation for resilient response to natural disasters. IEEE Trans. Smart Grid 2018, 9, 2030–2041. [Google Scholar] [CrossRef] [Green Version]
  6. Zhu, J.; Yuan, Y.; Wang, W. An exact microgrid formation model for load restoration in resilient distribution system. Int. J. Elec. Power Energy Syst. 2020, 116, 105568. [Google Scholar] [CrossRef]
  7. Najafi, J.; Peiravi, A.; Anvari-Moghaddam, A.; Guerrero, J.M. An efficient interactive framework for improving resilience of power-water distribution systems with multiple privately-owned microgrids. Int. J. Elec. Power Energy Syst. 2020, 116, 105550. [Google Scholar] [CrossRef]
  8. Chowdhury, D.; Hasan, A.S.M.K.; Khan, M.Z.R. Scalable DC microgrid architecture with phase shifted full bridge converter based power management unit. In Proceedings of the 2018 10th International Conference on Electrical and Computer Engineering (ICECE), Dhaka, Bangladesh, 20–22 December 2018; pp. 22–25. [Google Scholar]
  9. Hasan, A.S.M.K.; Chowdhury, D.; Khan, M.Z.R. Scalable DC microgrid architecture with a one-way communication based control Interface. In Proceedings of the 2018 10th International Conference on Electrical and Computer Engineering (ICECE), Dhaka, Bangladesh, 20–22 December 2018; pp. 265–268. [Google Scholar]
  10. Lin, Y.; Bie, Z. Tri-level optimal hardening plan for a resilient distribution system considering reconfiguration and DG islanding. Appl. Energy 2018, 210, 1266–1279. [Google Scholar] [CrossRef]
  11. Ma, S.; Li, S.; Wang, Z.; Qiu, F. Resilience-oriented design of distribution systems. IEEE Trans. Power Syst. 2019, 34, 2880–2891. [Google Scholar] [CrossRef]
  12. Salman, A.M.; Li, Y. A probabilistic framework for multi-hazard risk mitigation for electric power transmission systems subjected to seismic and hurricane hazards. Struct. Infrastruct. Eng. 2018, 14, 1499–1519. [Google Scholar] [CrossRef]
  13. Dong, J.; Zhu, L.; Su, Y.; Ma, Y.; Liu, Y.; Wang, F.; Tolbert, L.M.; Glass, J.; Bruce, L. Battery and backup generator sizing for a resilient microgrid under stochastic extreme events. IET Gener. Transm. Distrib. 2018, 12, 4443–4450. [Google Scholar] [CrossRef]
  14. Najafi, J.; Peiravi, A.; Anvari-Moghaddam, A.; Guerrero, J.M. Power-Heat Generation Sources Planning in Microgrids to Enhance Resilience against Islanding due to Natural Disasters. In Proceedings of the 2019 IEEE 28th International Symposium on Industrial Electronics (ISIE), Vancouver, BC, Canada, 12–14 June 2019; pp. 2446–2451. [Google Scholar]
  15. Xie, H.; Teng, X.; Xu, Y.; Wang, Y. Optimal energy storage sizing for networked microgrids considering reliability and resilience. IEEE Access 2019, 7, 86336–86348. [Google Scholar] [CrossRef]
  16. Najafi, J.; Peiravi, A.; Anvari-Moghaddam, A.; Guerrero, J.M. Resilience improvement planning of power-water distribution systems with multiple microgrids against hurricanes using clean strategies. J. Clean. Prod. 2019, 223, 109–126. [Google Scholar] [CrossRef]
  17. Cimellaro, G.P.; Solari, D.; Bruneau, M. Physical infrastructure interdependency and regional resilience index after the 2011 Tohoku Earthquake in Japan. Earthq. Eng. Struct. D. 2014, 43, 1763–1784. [Google Scholar] [CrossRef]
  18. Kongar, I.; Esposito, S.; Giovinazzi, S. Post-earthquake assessment and management for infrastructure systems: learning from the Canterbury (New Zealand) and L’Aquila (Italy) earthquakes. B. Earthq. Eng. 2017, 15, 589–620. [Google Scholar] [CrossRef]
  19. Pudasaini, B.; Shahandashti, S.M. Identification of Critical Pipes for Proactive Resource-Constrained Seismic Rehabilitation of Water Pipe Networks. J. Infrastruct. Syst. 2018, 24, 04018024. [Google Scholar] [CrossRef]
  20. Salehi, S.; Jalili Ghazizadeh, M.; Tabesh, M. A comprehensive criteria-based multi-attribute decision-making model for rehabilitation of water distribution systems. Struct. Infrastruct. Eng. 2018, 14, 743–765. [Google Scholar] [CrossRef]
  21. Yoo, D.G.; Jung, D.; Kang, D.; Kim, J.H.; Lansey, K. Seismic hazard assessment model for urban water supply networks. J. Water Resour. Plan. Manag. 2016, 142, 04015055. [Google Scholar] [CrossRef]
  22. Yoo, D.G.; Jung, D.; Kang, D.; Kim, J.H. Seismic-reliability-based optimal layout of a water distribution network. Water 2016, 8, 50. [Google Scholar] [CrossRef] [Green Version]
  23. Farahmandfar, Z.; Piratla, K.; Andrus, R. Flow-based modeling for enhancing seismic resilience of water supply networks. Proceedings of Pipelines 2015, Baltimore, ML, USA, 23–26 August 2015; pp. 756–765. [Google Scholar]
  24. Farahmandfar, Z.; Piratla, K.R. Comparative Evaluation of Topological and Flow-Based Seismic Resilience Metrics for Rehabilitation of Water Pipeline Systems. J. Pipeline Syst. Eng. Pract. 2018, 9, 04017027. [Google Scholar] [CrossRef]
  25. Almoghathawi, Y.; Barker, K.; Albert, L.A. Resilience-driven restoration model for interdependent infrastructure networks. Reliab. Eng. Syst. Safe. 2019, 185, 12–23. [Google Scholar] [CrossRef]
  26. González, A.D.; Dueñas-Osorio, L.; Sánchez-Silva, M.; Medaglia, A.L. The interdependent network design problem for optimal infrastructure system restoration. Comput.-Aided Civ. Inf. Eng. 2016, 31, 334–350. [Google Scholar] [CrossRef]
  27. Zhang, Y.; Yang, N.; Lall, U. Modeling and simulation of the vulnerability of interdependent power-water infrastructure networks to cascading failures. J. Syst. Sci. Syst. Eng. 2016, 25, 102–118. [Google Scholar] [CrossRef]
  28. Nazemi, M.; Moeini-Aghtaie, M.; Fotuhi-Firuzabad, M.; Dehghanian, P. Energy storage planning for enhanced resilience of power distribution networks against earthquakes. IEEE Trans. Sustain. Energy 2019. [Google Scholar] [CrossRef]
  29. Panteli, M.; Pickering, C.; Wilkinson, S.; Dawson, R.; Mancarella, P. Power system resilience to extreme weather: Fragility modelling, probabilistic impact assessment, and adaptation measures. IEEE Trans. Power Syst. 2017, 32, 3747–3757. [Google Scholar] [CrossRef] [Green Version]
  30. Growe-Kuska, N.; Heitsch, H.; Romisch, W. Scenario reduction and scenario tree construction for power management problems. In Proceedings of the 2003 IEEE Bologna Power Tech Conference Proceedings, Bologna, Italy, 23–26 June 2003. [Google Scholar] [CrossRef]
  31. Zhang, H.; Cheng, X.; Huang, T.; Cong, H.; Xu, J. Hydraulic analysis of water distribution systems based on fixed point iteration method. Water Resour. Manag. 2017, 31, 1605–1618. [Google Scholar] [CrossRef]
  32. Yuan, C.; Illindala, M.S.; Khalsa, A.S. Modified Viterbi algorithm based distribution system restoration strategy for grid resiliency. IEEE Trans. Power Deliv. 2017, 32, 310–319. [Google Scholar] [CrossRef] [Green Version]
  33. Xu, Y.; Liu, C.-C.; Schneider, K.P.; Tuffner, F.K.; Ton, D.T. Microgrids for service restoration to critical load in a resilient distribution system. IEEE Trans. Smart Grid 2018, 9, 426–437. [Google Scholar] [CrossRef]
  34. Soto, R.; Crawford, B.; Misra, S.; Monfroy, E.; Palma, W.; Castro, C.; Paredes, F. Constraint programming for optimal design of architectures for water distribution tanks and reservoirs: a case study. Tehnički Vjesnik 2014, 21, 99–105. [Google Scholar]
Figure 1. PDN and related designed WDN.
Sustainability 12 02167 g001
Figure 2. Water, active, and reactive power peak demands of networks.
Sustainability 12 02167 g002
Figure 3. Load multipliers of PDN and WDN.
Sustainability 12 02167 g003
Figure 4. Value of loads inaccessibility to power and water.
Sustainability 12 02167 g004
Figure 5. Fragility function of a power line and substation before and after hardening.
Sustainability 12 02167 g005
Figure 6. The PGA of each scenario.
Sustainability 12 02167 g006
Figure 7. The failure number of each power line, water pipe, and substation in the scenarios set.
Sustainability 12 02167 g007
Table 1. Discrete probability distribution function of damaged components.
Component Repair Time (Hours)
Power LineSubstation Water Pipe
PGA[0,0.5)466
[0.5,1)688
[1,1.5)81010
[1.5,2]101212
Table 2. The results of resilience improvement planning in Case 1.
StepStrategyEP(1) ($)EW(2) ($)EPW(3) ($)Cost($)
0No strategy19,872.415,091.434,963.80
1Power line 3–419,387.211,430.730,817.930,000
2Water pipe 6–719,387.210,922.530,309.74370
3Water pipe 4–519,387.210,416.529,803.78951
4Substation15,631.210,035.825,66756,000
Sum99,321
(1) EP: Expected loads inaccessibility value to power; (2) EW: Expected loads inaccessibility value to wat; (3) EPW: Expected loads inaccessibility value to power and water.
Table 3. The results of resilience improvement planning in Case 2 (without DGs in PDN).
StepStrategyEP($)EW($)EPW($)Cost($)
0No strategy30,853.724,155.855,009.50
1Substation25,167.120,956.446,123.556,000
2Power line 1–224,820.620,232.444,75310,000
3Power line 2–323,420.419,651.843,072.240,000
4Power line 3–422,971.117,707.440,678.530,000
Sum136,000
Table 4. The results of resilience improvement planning in Case 3 (water pumps equipped with back-up generators).
StepStrategyEP($)EW($)EPW($)Cost($)
0No strategy19,647.44876.524,523.90
1Substation16,618.84876.521,495.356,000
2Water pipe 6–716,618.84693.521,312.34370
3Water pipe 4–516,618.83777.720,386.58951
4Power line 1–216,304.23777.720,081.910,000
Sum79,321
Table 5. The results of resilience improvement planning in Case 4 (accessibility to water is more important than to power for residential loads).
StepStrategyEP($)EW($)EPW($)Cost($)
0No strategy19,872.5739,190.4759,062.90
1Power line 3–419,387.2573,021.1592,408.330,000
2Water pipe 6–719,387.2535,115.2554,502.44370
3Power line 4–519,064.4450,448.5469,512.930,000
4Water pipe 4–519,064.4427,540.3446,604.78951
Sum73,321

