Article

Hybrid Intelligent Modelling in Renewable Energy Sources-Based Microgrid. A Variable Estimation of the Hydrogen Subsystem Oriented to the Energy Management Strategy

by
José-Luis Casteleiro-Roca
1,†,
Francisco José Vivas
2,†,
Francisca Segura
2,†,
Antonio Javier Barragán
2,†,
Jose Luis Calvo-Rolle
1,*,† and
José Manuel Andújar
2,†
1
Department of Industrial Engineering, University of A Coruña, CTC, CITIC, 15405 Ferrol, Spain
2
Department of Electronic Engineering, Computer Systems and Automatic, Campus de El Carmen, University of Huelva, 21071 Huelva, Spain
*
Author to whom correspondence should be addressed.
These authors contributed equally to this work.
Sustainability 2020, 12(24), 10566; https://doi.org/10.3390/su122410566
Submission received: 8 October 2020 / Revised: 2 December 2020 / Accepted: 8 December 2020 / Published: 17 December 2020
(This article belongs to the Special Issue Sustainable Hydrogen Energy Systems: Electric Applications)

Abstract

:
This work deals with the prediction of variables for a hydrogen energy storage system integrated into a microgrid. Due to the fact that this kind of system has a nonlinear behaviour, the use of traditional techniques is not accurate enough to generate good models of the system under study. Then, a hybrid intelligent system, based on clustering and regression techniques, has been developed and implemented to predict the power, the hydrogen level and the hydrogen system degradation. In this research, a hybrid intelligent model was created and validated over a dataset from a lab-size migrogrid. The achieved results show a better performance than other well-known classical regression methods, allowing us to predict the hydrogen consumption/generation with a mean absolute error of 0.63% with the test dataset respect to the maximum power of the system.

1. Introduction

In recent years climate change and the environment have become topics of great interest for different sectors. One of the main reasons is related to recent natural disasters, which are related to the above issues [1]. It is urgent to make decisions to mitigate these unwanted events. Any action is important; however, to stop the deterioration of the environment, it is necessary for governments to become aware, and take forceful actions to approach this issue [2]. The use of renewable sources plays a fundamental role in the new global energy model [3].
Despite the benefits of renewable energy sources, the dependence on the intrinsic environmental conditions related to renewable production technologies does not guarantee a net zero power balance at any time. In this sense, the hybridization of renewable energy sources and the use of energy storage systems are feasible solutions [4,5]. There are many energy storage solutions, from traditional examples such as water pumping [6] to the most modern including hydrogen and new battery approaches [7]. However, all the different alternatives have limitations, depending the final use [8]. Battery banks are usually designed to absorb the transients in the power balance, so they can be considered a short-term storage system [9]. As a complement, the use of hydrogen as an energy vector is a promising solution as long-term storage system, and it is being used more frequently [10,11].
Research on hydrogen-based systems is still very active due to its complexity and its great potential [12]. The combination of fuel cells, electrolyzers, and hydrogen storage systems have proven to be attractive alternatives as reserve systems and surplus storage in renewable facilities, where production depends on the availability of energy [13]. Fuel cells are built from individual cells, together with gas conditioning, cooling and fuel injection, comprise the balance of plant (BoP), which is governed by a control system [14,15]. The energy production of a fuel cell is only limited by the amount of hydrogen available, which eliminates the typical restrictions of solar or wind plants, but this, in turn, can be produced in electrolyzers from excess energy. This production–storage–usage cycle, especially interesting if the energy comes from renewable sources, provides the facilities where they are installed with great autonomy and independence from the grid, which enables the optimization of its use and reduction of costs [10]. Specifically, proton exchange fuel cells (PEFCs), are some of the best alternatives for stationary and portable applications [16]. PEFCs have higher energy density with lower volume and weight than other types of fuel cells, and they are commercially available at a larger power range [13]; from a few kW useful in mobile applications [17], to thousands of kW in microgrid and stationary applications [18,19,20,21,22].
The production of clean energy, with zero CO 2 emissions, and the microgrid concept are closely related. A microgrid is responsible for managing energy flows from renewable production to and from storage systems and consumers [23,24].
The objectives of a microgrid must be to guarantee the power demand at the lowest cost possible, so they must not only prioritize the consumption of renewable energy, but also guarantee the proper operation of the components to increase their durability. For this, the operation of each of the systems that comprise it must be properly known, as well as the restrictions to be used. Therefore, obtaining an accurate model of the components of the microgrid is a fundamental task prior to the design of an optimal energy management system (EMS) [10]. It is also necessary due to the added complexity caused by multiple power sources of different nature. The same could be applied to the consumption units, which include even more factors that need to be taken into account [25].
According to the scientific literature, most previous works present the microgrid model as a compendium of individual models associated to the elements that integrate the whole microgrid. As consequence, this restricts the quality of the whole microgrid model by not considering the cross interactions between elements. Depending on the type of the model used, the contributions can be grouped in two main categories: complex mathematical models and Linear Time Invariant (LTI) models oriented towards EMS design and application.
In the first category, the works present complex models of the subsystems that require measurement of physical parameters, but these are often not measurable involve expensive techniques in their measurement. Example solutions are presented in [26,27,28,29,30] for fuel cell and electrolyzer models, respectively. All these solutions are based on the calculation of the polarization curve of both subsystems as a function of voltage losses due to parameters such as partial pressures, concentration of reagents, temperature, etc. The non-linear models are aimed at the simulation and in-depth studies of the subsystems, which are too complex for their application in the definition of EMS.
On the other hand, models included in the second category present solutions aimed at the implementation of EMS, mostly based on its representation in the state-space form. These solutions correspond to LTI or Mixed Logical Dynamical (MLD) models, which present simplified solutions with respect to the first category [31,32,33]. These contributions are based on simplifications of the model and linearization around a single working point, represented as direct cause–effect relationships between power setpoint and battery and hydrogen subsystem variables, mainly battery State-of-Charge (SOC) and hydrogen level. This leads to a reduction in the quality of the model and therefore the loss of information by the controller to implement the optimal management of the system.
With the aim of increasing performance with respect to the solutions presented in the scientific literature, there are some different methods for the systems’ modelling purpose, however, obviously the performance could be very different, depending on the implemented method for each case. Some of the most commonly used techniques involve Multiple Regression Analyses [34]. Nevertheless, these types of methods or similar ones with small changes present some limitations [35]. One of the reasons for the bad performance is the non-linearities intrinsic to the system. Many alternatives for accomplishing the modelling process are based on intelligent techniques [36]. Of course the nonlinearity problems are solved in many cases by using these kinds of techniques [37]. Despite this, the problem could persist, depending on the nature of the nonlinearities. When this occurs, one of the possible solutions, that gives very satisfactory results, is the breakdown of the problem into areas with similar and/or linear behaviour [38,39].
Taking into account the above explanation, this paper deals with the prediction of the variables in the hydrogen subsystem inside a renewable microgrid based on the EMS concept and development. Attending to the implementation of EMS, there are four important variables to predict: the power from/to the hydrogen subsystem, the degradation of the electrolyzer and the fuel cell, and the hydrogen level in the storage tank. This research uses one hybrid intelligent model to predict each mentioned variable. The model proposed by authors includes all electrical and physical variables of the microgrid, which enables the identification of the interrelationship between the different variables of the microgrid on the main parameters of the hydrogen-based system, i.e., operating power, hydrogen tank level and degradation of fuel cell and electrolyzer. The modelling methodology employed allows the entire operating range of the system to be modelled, which increases the quality of the model with respect to linearized solutions around a single working point. Table 1 summarizes the main characteristics of the scientific literature. In order to highlight the novelty of this work, the last row presents the main contributions of the authors’ proposals.
Research gap and contribution of the paper:
  • Previous scientific works present a microgrid model as a compendium for individual models of each subsystem that integrated the microgrid. This restricts the quality of the whole microgrid model by not considering the cross interactions between elements.
  • These contributions are based on simplifications of the model and linearization around a single working point based on physical parameters that are not easily measurable.
Based on above:
  • The model proposed by authors includes all electrical and physical variables of the whole microgrid, which allows identifying the interrelationship between the different variables.
  • All the variables involved in the model are easily measurable at a low cost.
  • The developed model allows the entire operating range of the system to be modelled.

2. Materials and Methods

In this section, firstly, the installation under study is presented. Then, the model approach used is explained, including the data processing, and the algorithms.
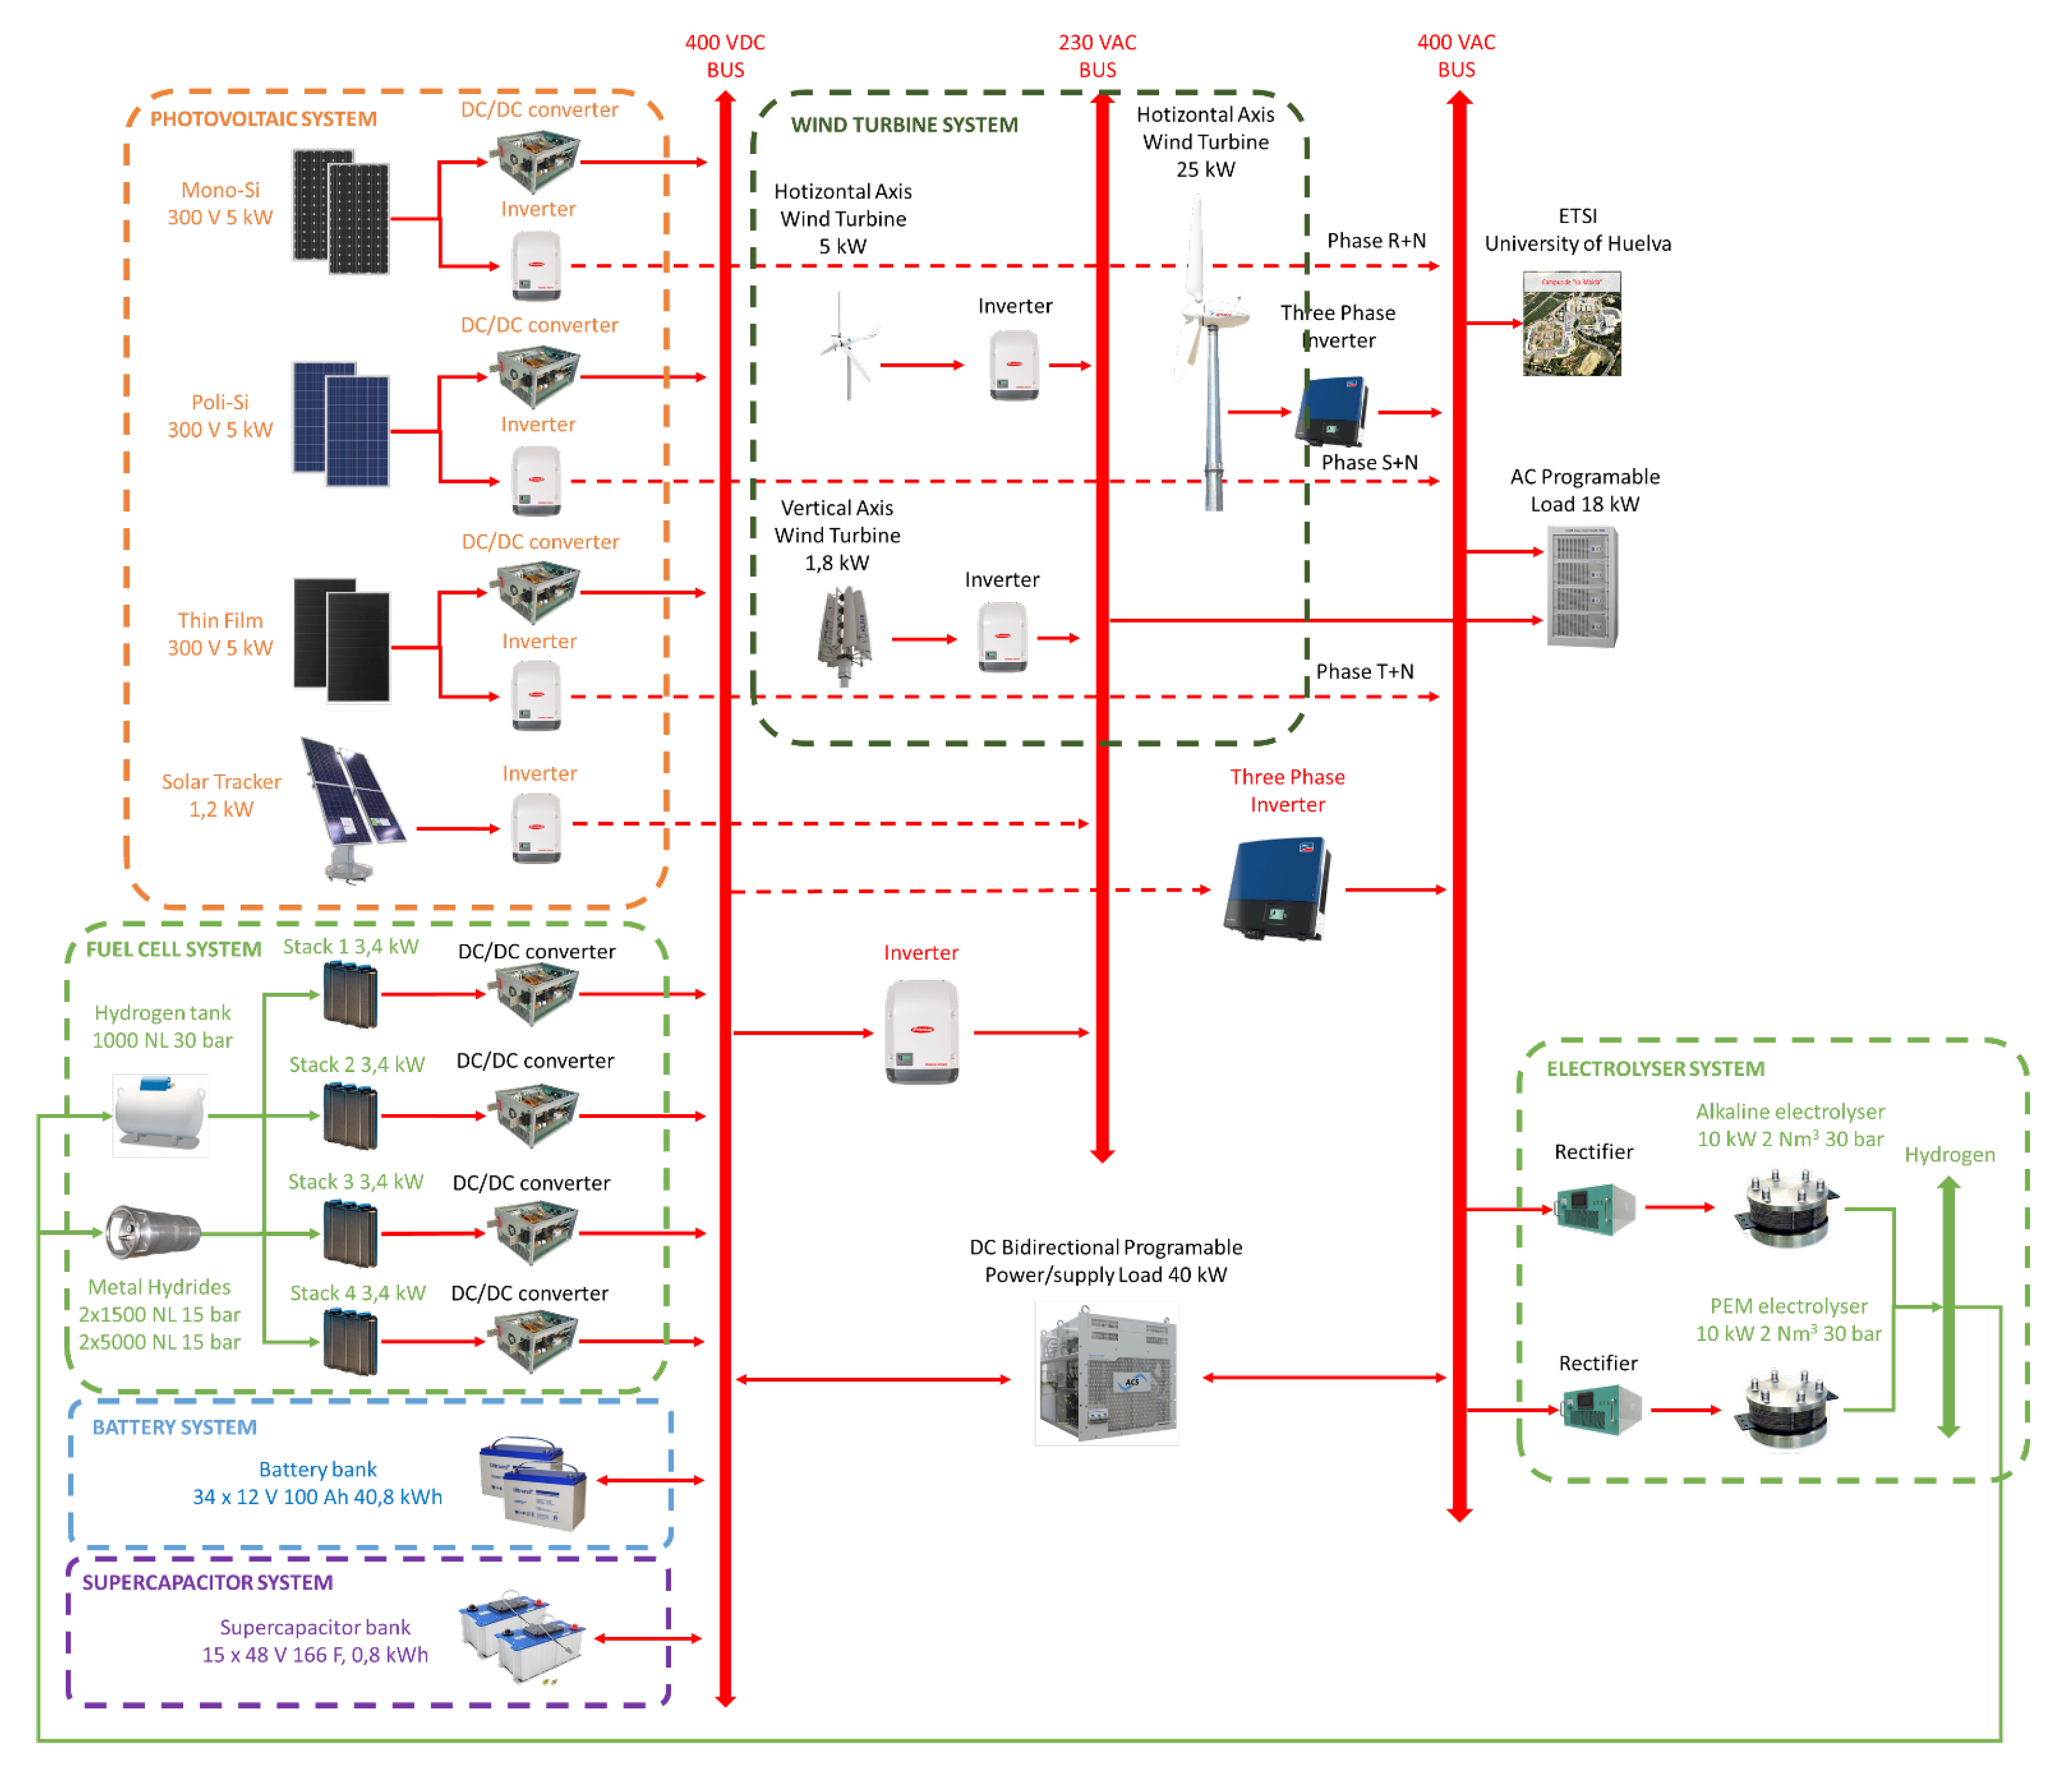
The microgrid used in this work is located in the southwest region of Spain, at the facilities of the “Control and Robotics (TEP-192)” research group in the “La Rábida” Campus of the University of Huelva. The microgrid combines several types of renewable energy sources. In the first instance, there is a 16.2 kW photovoltaic plant, consisting of three 5 kW arrays of different technologies, monocrystalline, polycrystalline and thin film and a two-axis solar tracker of 1.2 kW (photovoltaic system). The wind production is defined by the installation of three wind turbines, two with horizontal axis and one with a vertical axis, which determine an installed power of 31.8 kW (Wind turbine system). It also includes a hybrid energy storage system (supercapacitor, batteries and hydrogen) scaled according to the power of the network and based on the expected response time (energy storage system). The complete scheme of the microgrid with all the systems and their interconnection is shown in Figure 1 [40]. The dataset used by authors to obtain the hybrid model corresponds to experimental tests carried out in the real microgrid presented in [41].
The architecture of the microgrid is characterized by the use of a mixed topology, which uses DC and AC buses to ensure the interconnection between equipment and the main electrical grid [42]. All of the generation and consumption subsystems are connected to the internal DC bus, supported by the supercapacitor and battery bank, allowing a two-way energy flow between the main electrical grid of the campus and the microgrid. The facility also has programmable power sources and loads, and three energy storage systems: a supercapacitor and battery bank, and a hydrogen loop made up of an electrolyzer (hydrogen production), fuel cell stacks (hydrogen consumption), as well as hydrogen storage in the form of pressure gas or metal hydride compound. The interconnection between each of the microgrid subsystems and the different power buses is carried out using commercial and customized power electronics devices specially designed for the application [23].
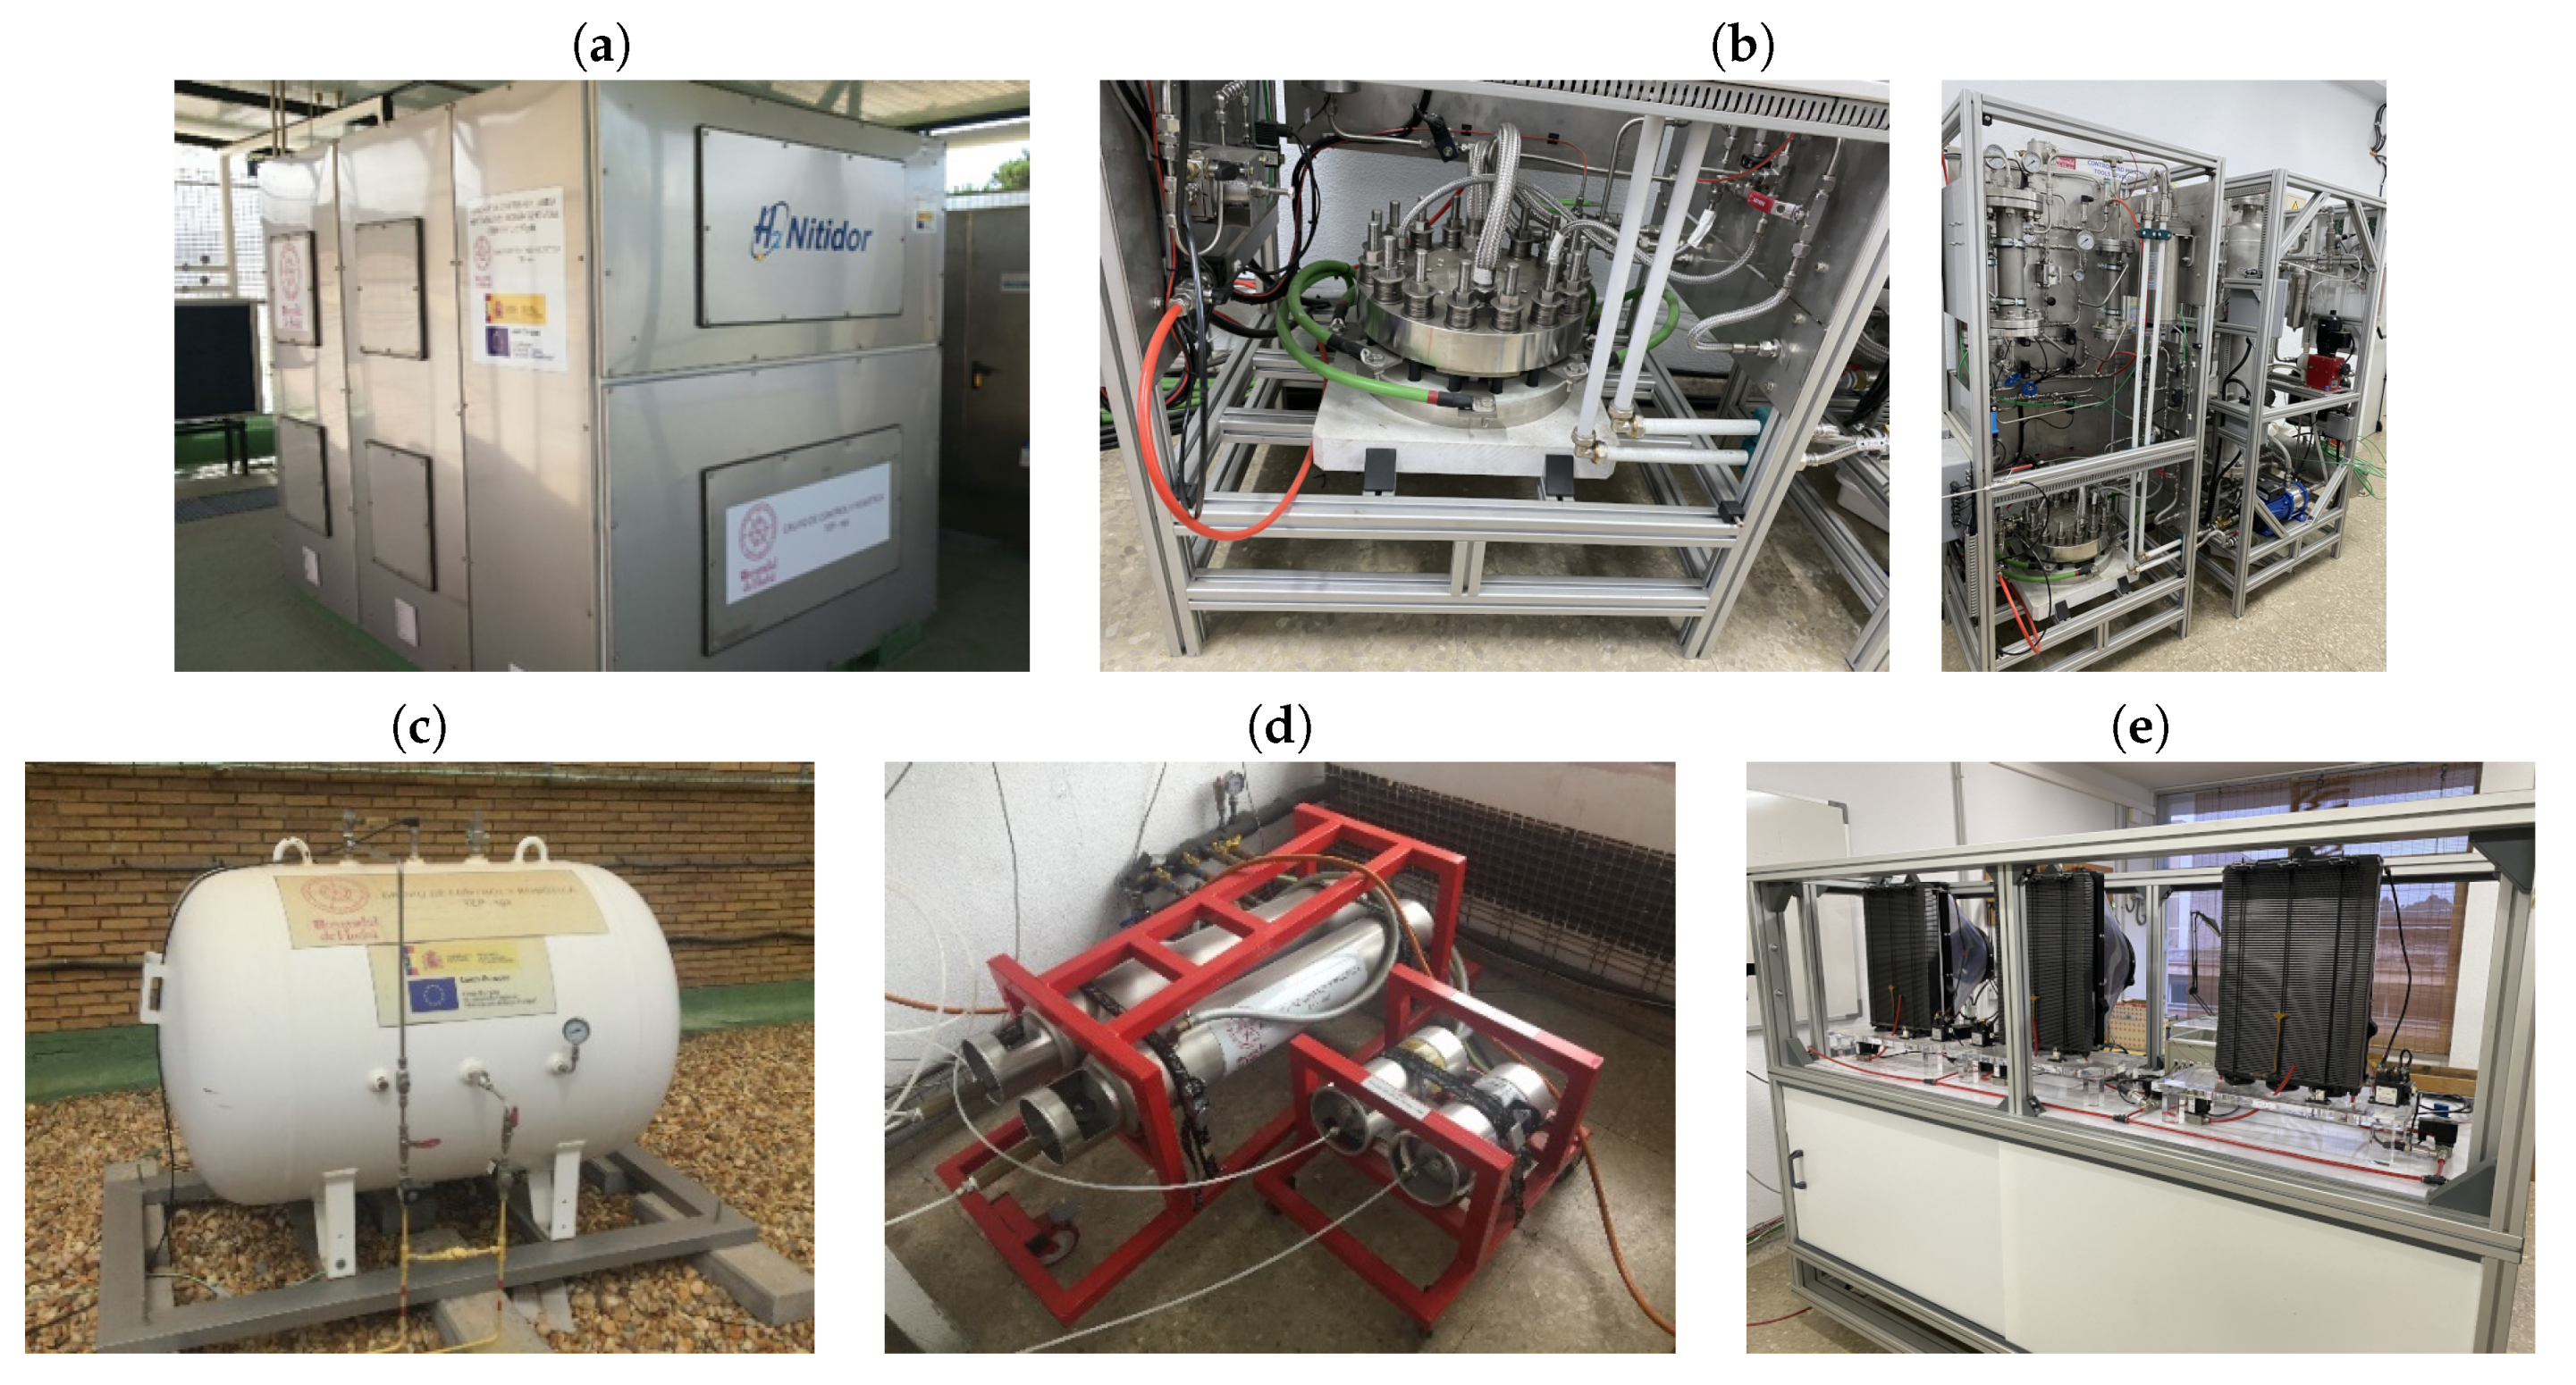
The microgrid used in this work has two electrolyzers of different technologies, alkaline and polymer electrolyte membrane (PEM), both with similar production capacities and output pressures, 2 Nm 3 /h at 30 bar (Figure 2a,b respectively). The electrolyzers incorporate all the necessary components for its operation, according to the manufacturer’s conditions and the established power setpoint. The hydrogen generated can be stored in the form of pressurized gas, in a hydrogen storage tank of 1 Nm 3 (Figure 2c); or as a solid compound in the form of metal hydrides in two bottles of 1.5 Nm 3 and two bottles of 5 Nm 3 (Figure 2d). To carry out the inverse conversion, to generate electricity from the stored hydrogen, the microgrid includes a modular fuel cell system comprised of four PEFC stacks of 3.4 kW (Figure 2e). The correct operation of the fuel cells, as well as the regulation of the working point, are carried out by means of control electronics and power electronics converters designed by the authors.
Based on the above description, the main parameters of the subsystems that make up the microgrid are presented in Table 2.

2.1. Model Approach

Figure 3a shows the schema of the microgrid power balance and Figure 3b the model approach in this proposal. The model uses all the variables available in the microgrid, described in the section Acronyms, Notation and Symbols, to predict the four signals in the hydrogen subsystem.
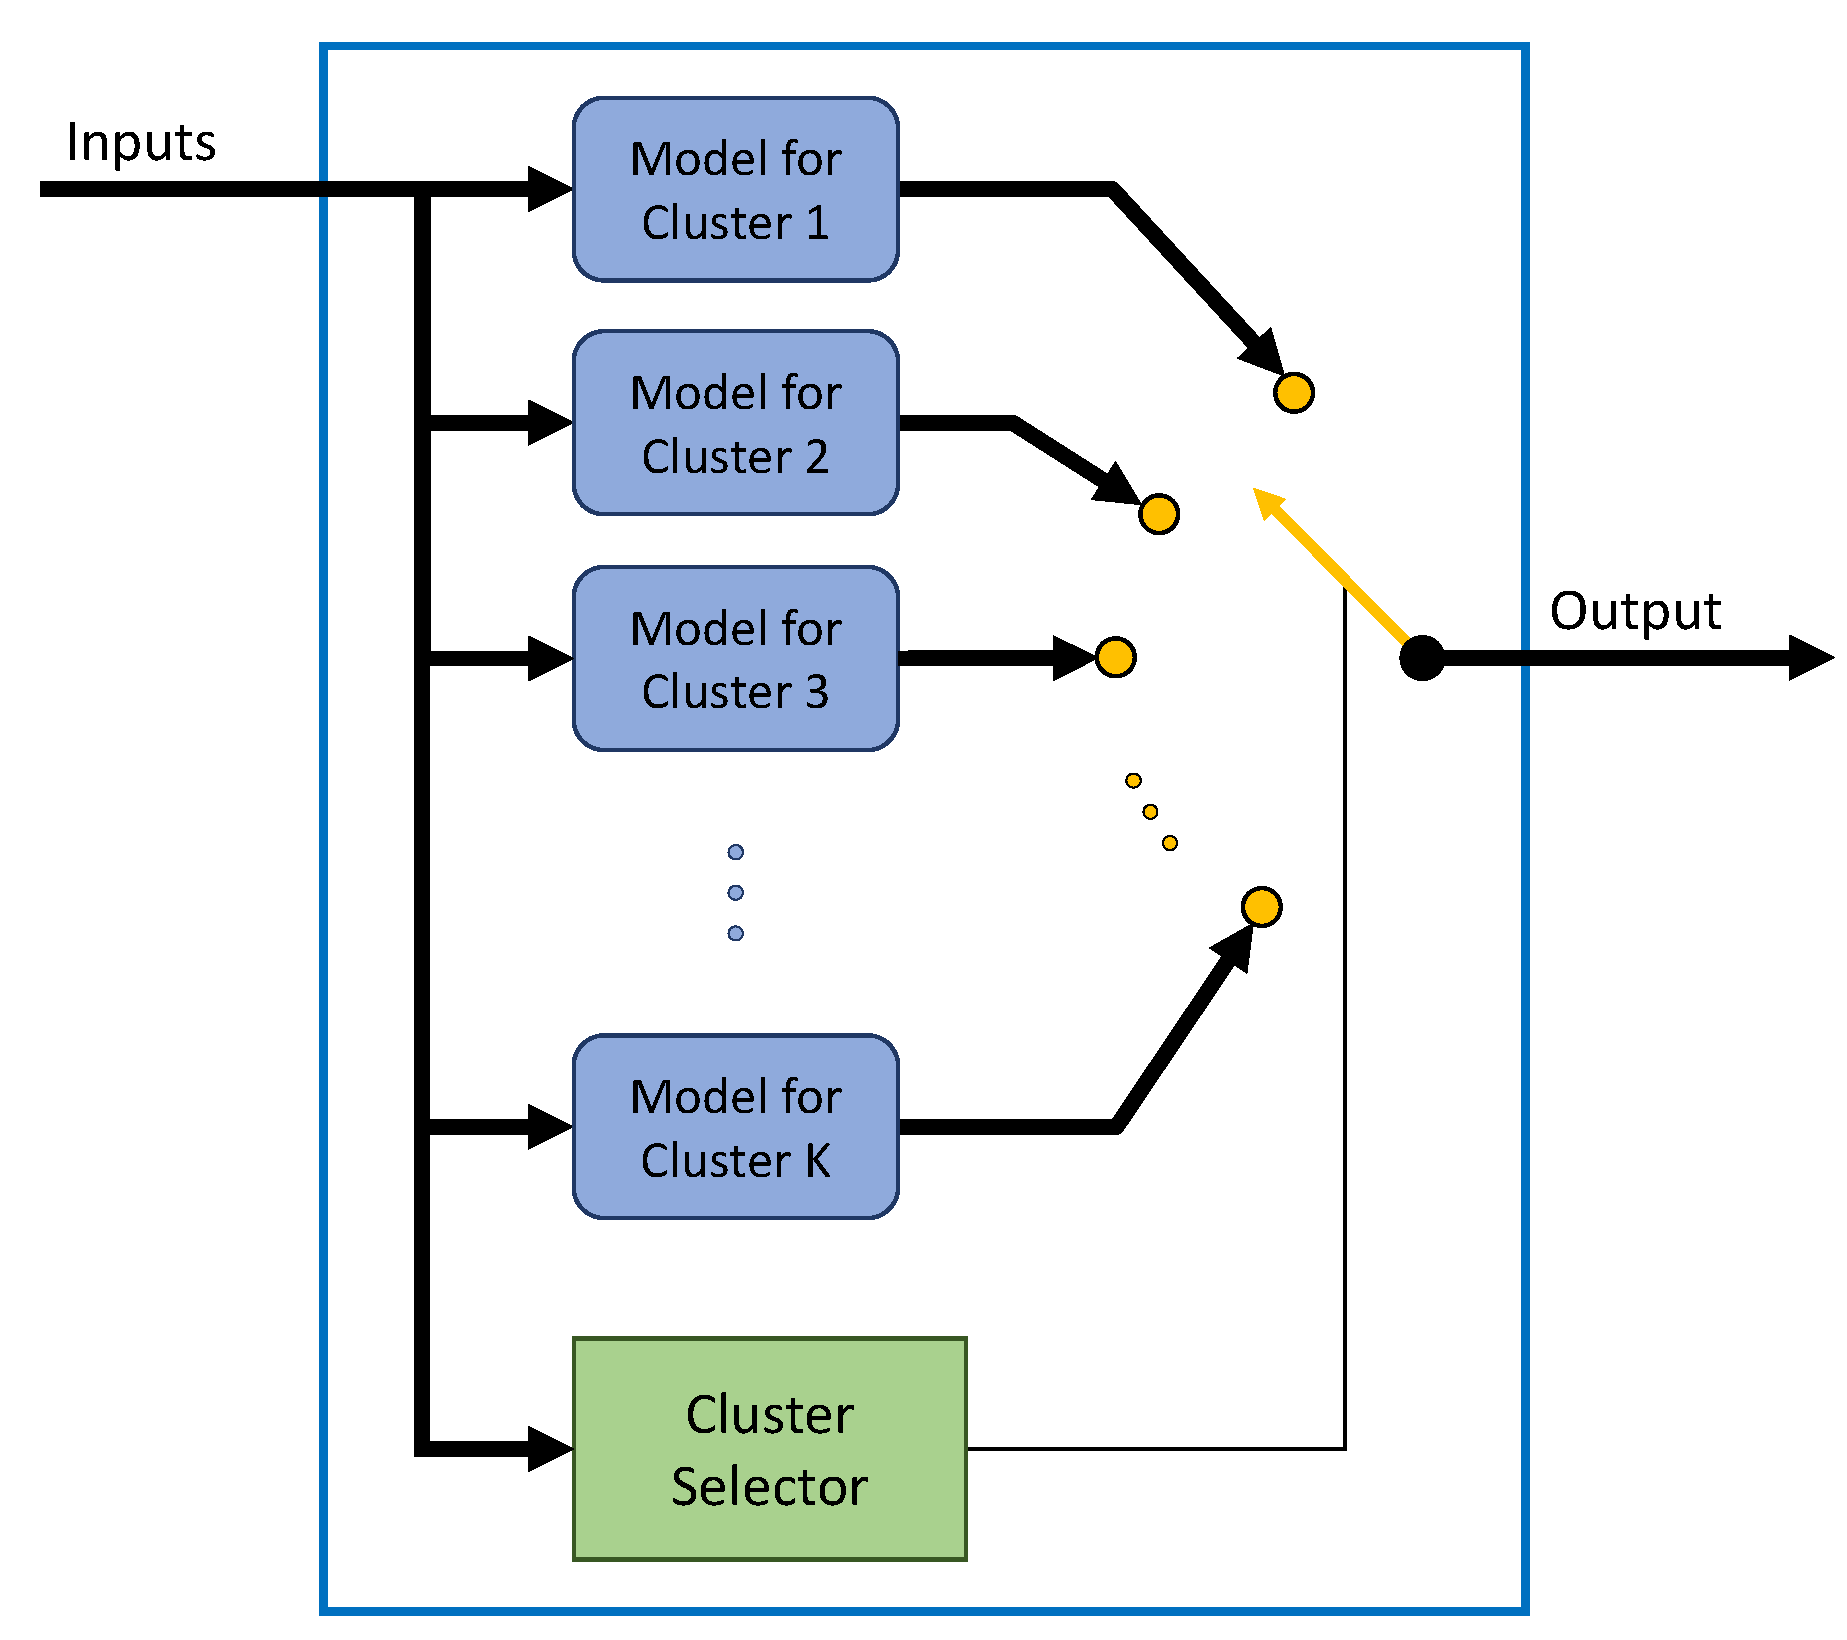
Hybrid intelligent models have been used to divide the whole dataset in different clusters. Figure 4 shows the internal schema of this type of model. In this research, the inputs of the model were the value of the different variables at a specific instant (k), and the model predicted the values of the output in the next instant (k+1). The variables were represented as follows: battery voltage (V_Bat), battery state of charge (SOC_Bat), hydrogen level (HL_H2), battery power (P_Bat), hydrogen subsystem power (P_H2), power exchanged with the electrical grid (P_Grid), power from renewable origin (P_Ren), power demanded by the load (P_Load), battery degradation (D_Bat), electrolyzer degradation (D_Eles), and fuel cell degradation (D_FC). Note that the model was geared towards EMS implementation, not local controllers.
In this research four models were created, each one predicted one output. The four were hybrid models, thus the whole dataset was divided to calculate the output in local models. Each local model was trained with only a fraction of the dataset. The procedure to create the hybrid model was carried out in four steps:
  • Clustering phase. Firstly, the dataset was divided into clusters; but as the optimal separation is usually not known, several hybrid topologies were created, dividing the dataset several times (creating two clusters, three clusters ...).
  • Regression phase. Several regression models were created for each cluster created in the previous phase. These models are known as local models, and there were as many as the number of regression techniques (and a different configuration for each algorithm).
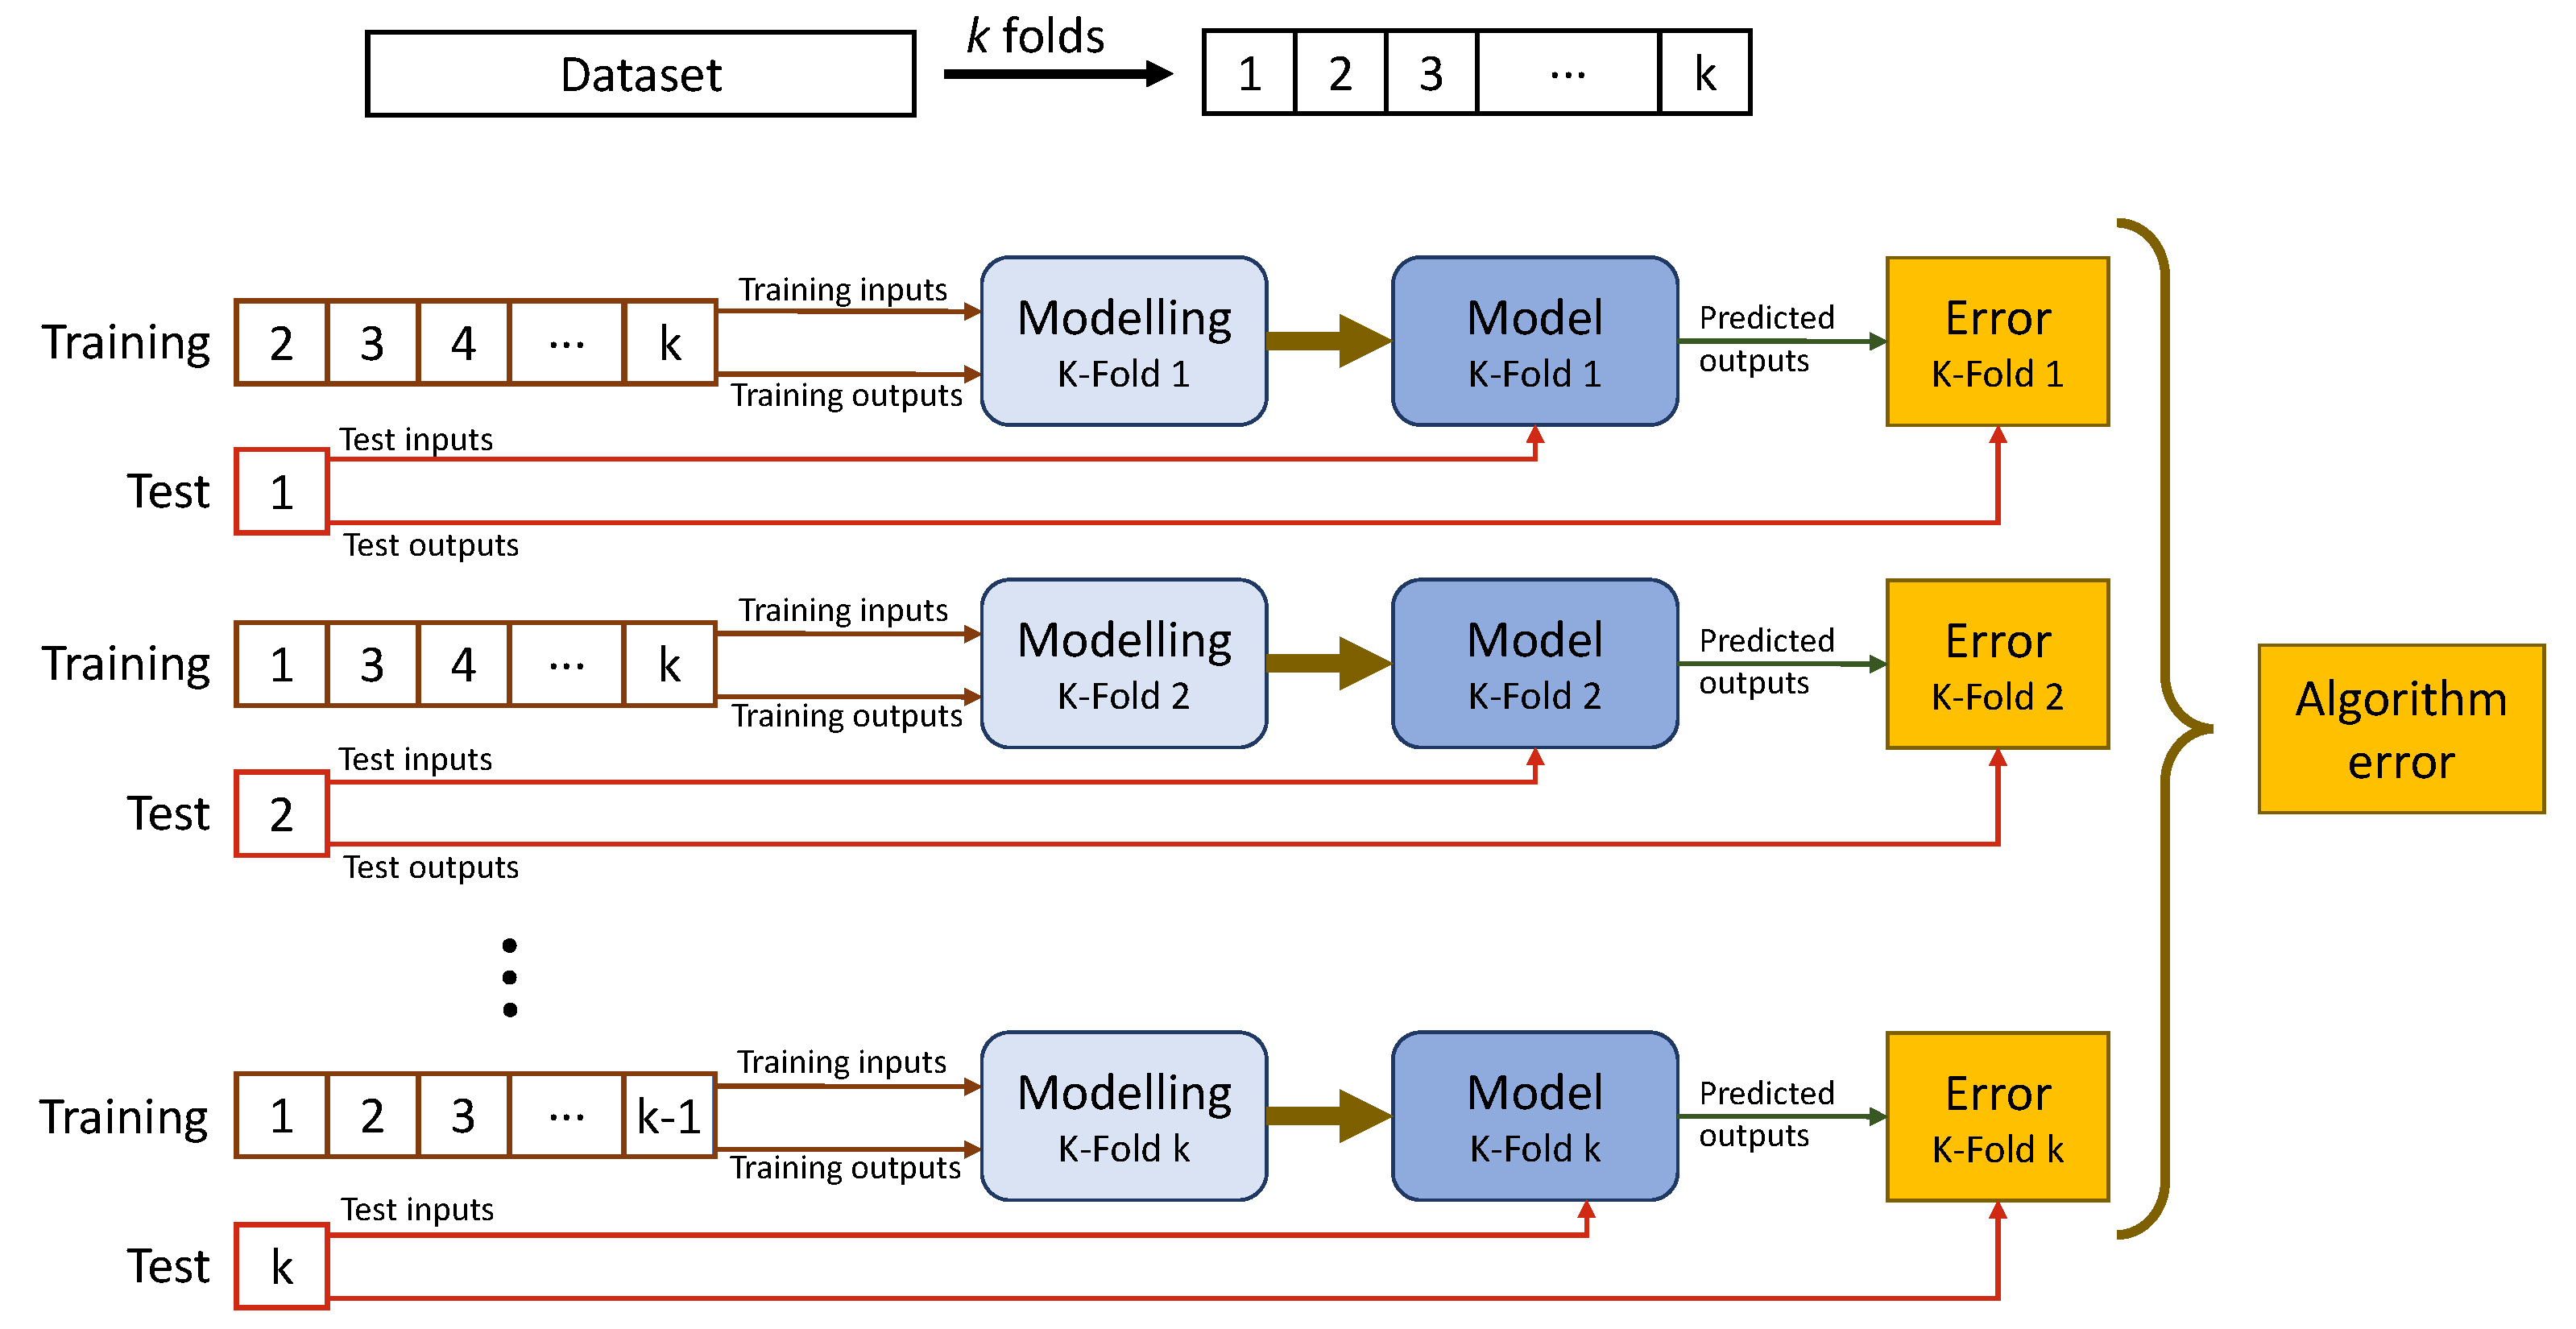
  • Best local model selection. To select the best local model, it is necessary to compare the predicted error in the different models. In this research, the mean squared error (MSE) calculated with K-fold cross validation was selected.. This validation procedure is represented in Figure 5, and the value of error calculated was more realistic than with hold out validation.
  • Best hybrid topology selection. Once the best local models were chosen, each hybrid topology (with two clusters, three clusters ...) was tested to calculate the predicted error of the whole model (not only the local models).

2.2. Data Processing

The dataset used in this research was extracted from several experimental tests made in the microgrid described above. First of all, only the samples with a working hydrogen subsystem were considered. Then, 5% of the data were randomly isolated to test the final model. The rest of the data was used to train the models and to choose the best hybrid topology.
The training data were normalized to be fitted in the 0-1 range. Each variable was normalized independently. Several clusters were created with the normalized data and, before training the local models, another 5% of the data from each cluster were separated from the training process to validate the performance of the different hybrid topologies.

2.3. K-Means Algorithm

K-Means is one of the most known clustering algorithms. In the present paper it was used to divide the dataset in clusters in order to create the local models. The algorithm assigned each sample to the cluster whose centroid was closest. The Euclidean distance is the most typical one [37,43,44]. The algorithm only needs to know how many clusters it needs to create (the parameter K defined by the user), and the dataset.
After the final centroids were defined, the algorithm took a very short time to assign new samples to its clusters. The training phase to achieve the final centroids involved the following procedure:
  • The initial centroids were chosen randomly in the dataset.
  • Each sample was assigned to its cluster (defined by the centroid) depending on how far the centroids were from the sample.
  • Once each sample was assigned to a cluster, the center of each sample was defined as the new centroid.
The procedure had to be repeated (the last two steps) until the centroids were the same twice. It was necessary to store the centroids to use the K-Means algorithm with new samples.

2.4. Artificial Neural Networks

This research used artificial neural networks (ANNs) to create the regression models. The ANN can be used to perform regression or classification models. This algorithm is inspired by the biological neuron model, and uses this basic component to create the model. The neuron can use several inputs, and each one has an internal factor to adapt the reaction of the neuron to each input.
The neuron has an activation function that uses the sum of all the pondered inputs (and the bias signal), to calculate the neuron output. The typical activation functions are step, linear, log-sigmoid and tan-sigmoid. The multilayer perceptron is a basic feed-forward ANN structure that organizes the neuron in layers. Each layer has neurons with the same inputs and outputs. The inputs of the model are connected to the input layer, there is one (or more) hidden or internal layers, and the output layer is connected to the output of the model [45,46,47].
The ANNs are commonly used because they have a good performance to generalize data despite not being in the training data.

3. Results

To take into account all the results in this research, this section has been divided in different parts. Following the procedure to create the hybrid model, first of all, the clustering results will be presented. Then, the regression results are shown and they are used to select the best regression configuration for each cluster; and finally the validation results are used to choose the optimal hybrid topology. A final test is also included to measure the error with real values.

3.1. Clustering Results

The K-Means algorithm was trained with random centroids as the initial condition; moreover, to ensure the optimal division, the training was repeated 20 times for each configuration. This technique was used to divide the dataset several times, to create from 2 to 10 clusters, but the procedure discards the division when any group has less than 15 samples.
Table 3 shows the number of samples in each created cluster. Despite the fact that the procedure tried to create 10 hybrid topologies, only five different ones are shown; the global model was also used, which only had one cluster with all samples available.

3.2. Regression Results

ANN was chosen as a regression algorithm; the internal configuration for all the models was basically the same: 11 neurons in the input layer, one hidden layer and one neuron in the output layer. The number of neurons in the internal layer varied from 1 to 15, the hidden neurons activation function was set to tan-sigmoid, while the neuron in the output layer has a linear activation function.
There were several regression models, 15 different configurations for each of the four predicted outputs, one hybrid model was created per output. These models only had one output, instead of one model with four outputs; this configuration enabled different hybrid configurations for each signal. Table 4, as an example, shows the mean squared error (MSE) achieved in the ANN model with eight neurons in the hidden layer to calculate the level of stored hydrogen. Table 5 shows the mean absolute error (MAE) for the degradation in the fuel cell module when ANNs with 13 neurons were used.
All the models created were trained by updating the weight and bias values according to Levenberg–Marquardt optimization. The values shown in Table 4 and Table 5 are calculated using 10 K-fold cross validation to ensure a more realistic error measurement than with hold-out.

Selection of Best Local Regression Models

The best regression model for each cluster was selected depending on the value of the MSE obtained in the previous step. Table 6 shows the lowest MSE for each cluster to predict the degradation of the electrolyzer, and Table 7 shows the lowest values needed to calculate the power from/to the hydrogen subsystem.
Since the lowest MSE was calculated with different models, Table 8 and Table 9 show the configuration of each local model obtained by the MSEs shown in Table 6 and Table 7. This error was the most typical one used to compare the performance of regression techniques.
It is necessary to highlight that the previous models were trained using K-fold to calculate the presented errors and, with this validation technique, several models were created for the same training data. Then, once the best algorithm was chosen for each cluster, and also for the global model, a new regression model was trained with the selected configuration, using all the training data available for each local model.

3.3. Validation Results

A different dataset was used to validate the model and to choose the best hybrid topology. This dataset was isolated from the beginning of the training process, and none of these data were used in the previous models’ creation procedure. To select this validation dataset, it was necessary to take into account that it should have data from all the clusters.
This validation dataset has been used to test all the possible hybrid model topologies, and also the global model. Table 10, Table 11, Table 12 and Table 13 show the validation results for the model that predicts the electrical power generated/consumed by the hydrogen subsystem, the degradation of the fuel cell module and electrolyzer, and the level of stored hydrogen. These tables include the MSE, MAE and normalized mean squared error (NMSE), and the best hybrid topology for each predicted variable was chosen as the one with the lowest approximation error.
The best hybrid configuration, as it is shown in Table 10, Table 11, Table 12 and Table 13, is a hybrid model that divides the dataset into two different clusters. The final configuration for the four created models used two different artificial neural networks to predict the power of the hydrogen subsystem, the level of the stored hydrogen and the degradation (of the electrolyzer and also of the fuel cell module).
Additionally, the proposed model was validated with experimental results and also compared with a reference model taken from the literature (Figure 6, Figure 7 and Figure 8). The reference model presented in [48,49,50] has been considered for the hydrogen generation/consumption ratio and [51] for electrolyzer and fuel cell degradation. Several references were needed to compare the authors’ proposal due to the fact that this one reflects the behaviour of a whole hydrogen system integrated by an electrolyzer, hydrogen storage and a fuel cell, while the references found in the literature address only one subsystem separately.
To check the performance of each model, test data were used. In this case, the data were chosen randomly, regardless of the cluster. Table 14 shows the error measurements of the four predicted variables. Taking into account that the models were created with normalized data, the table shows the error with the original values, and the ones calculated with the normalized values (inside parenthesis).

4. Conclusions and Future Research

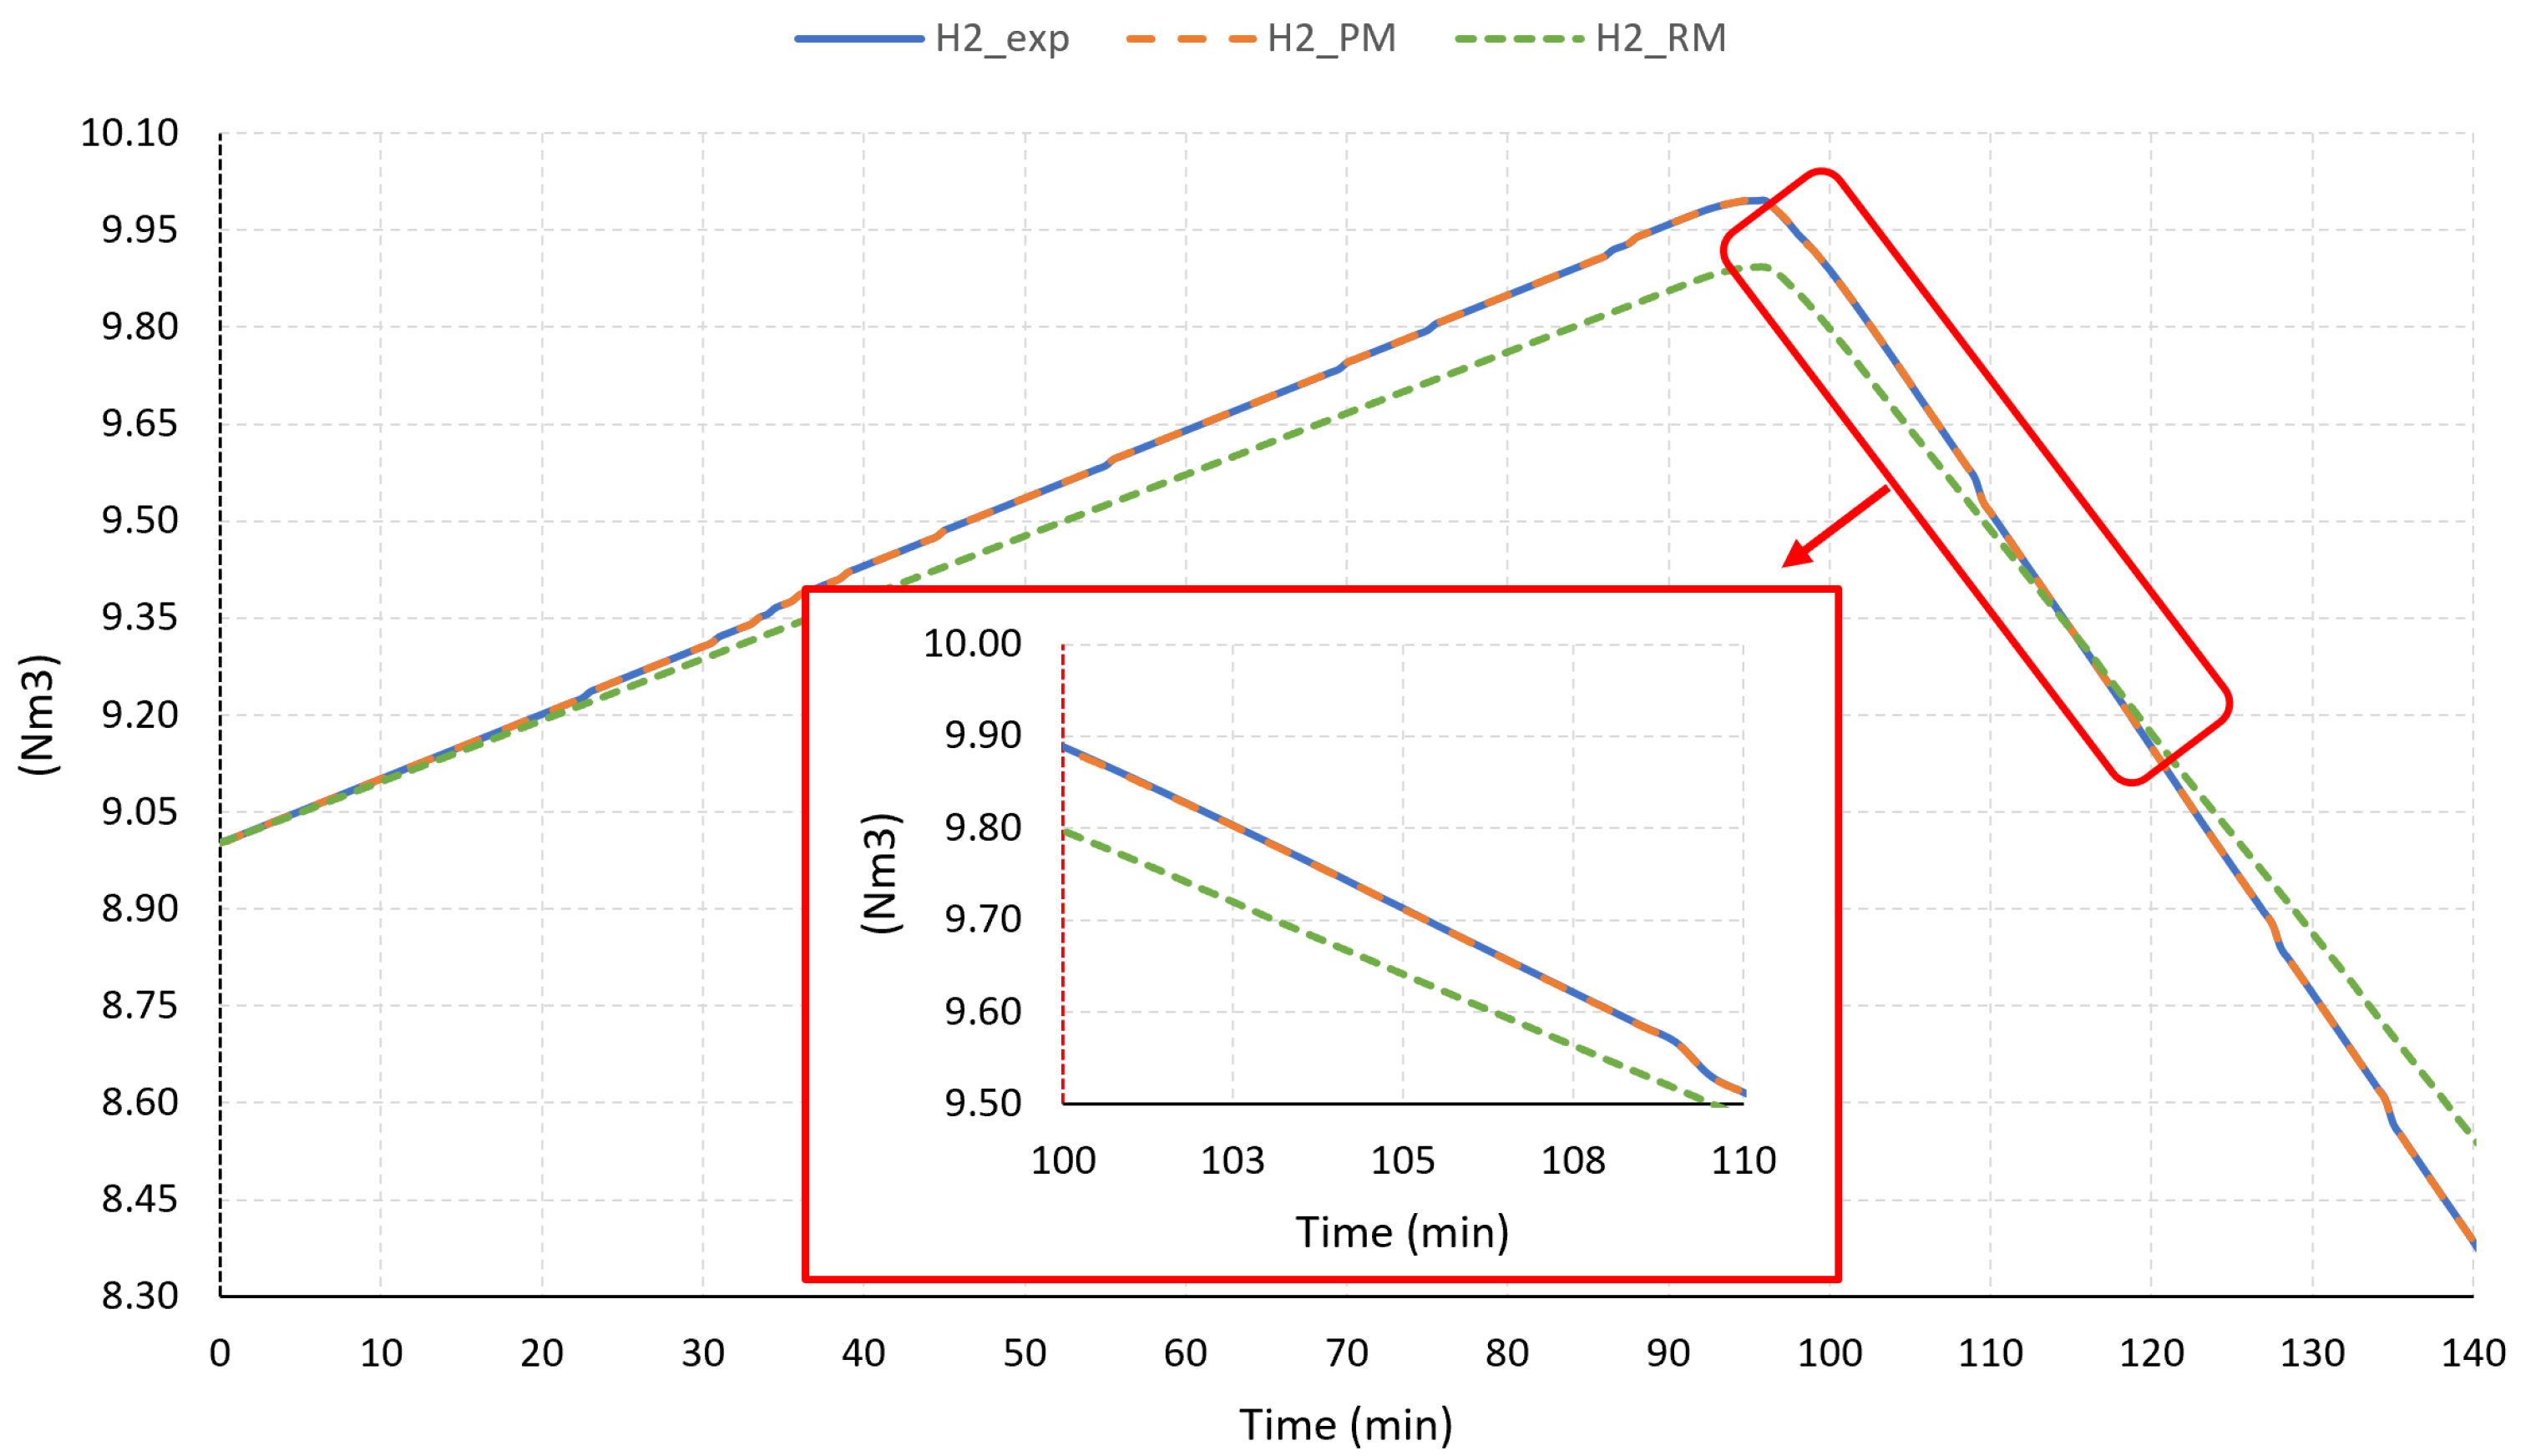
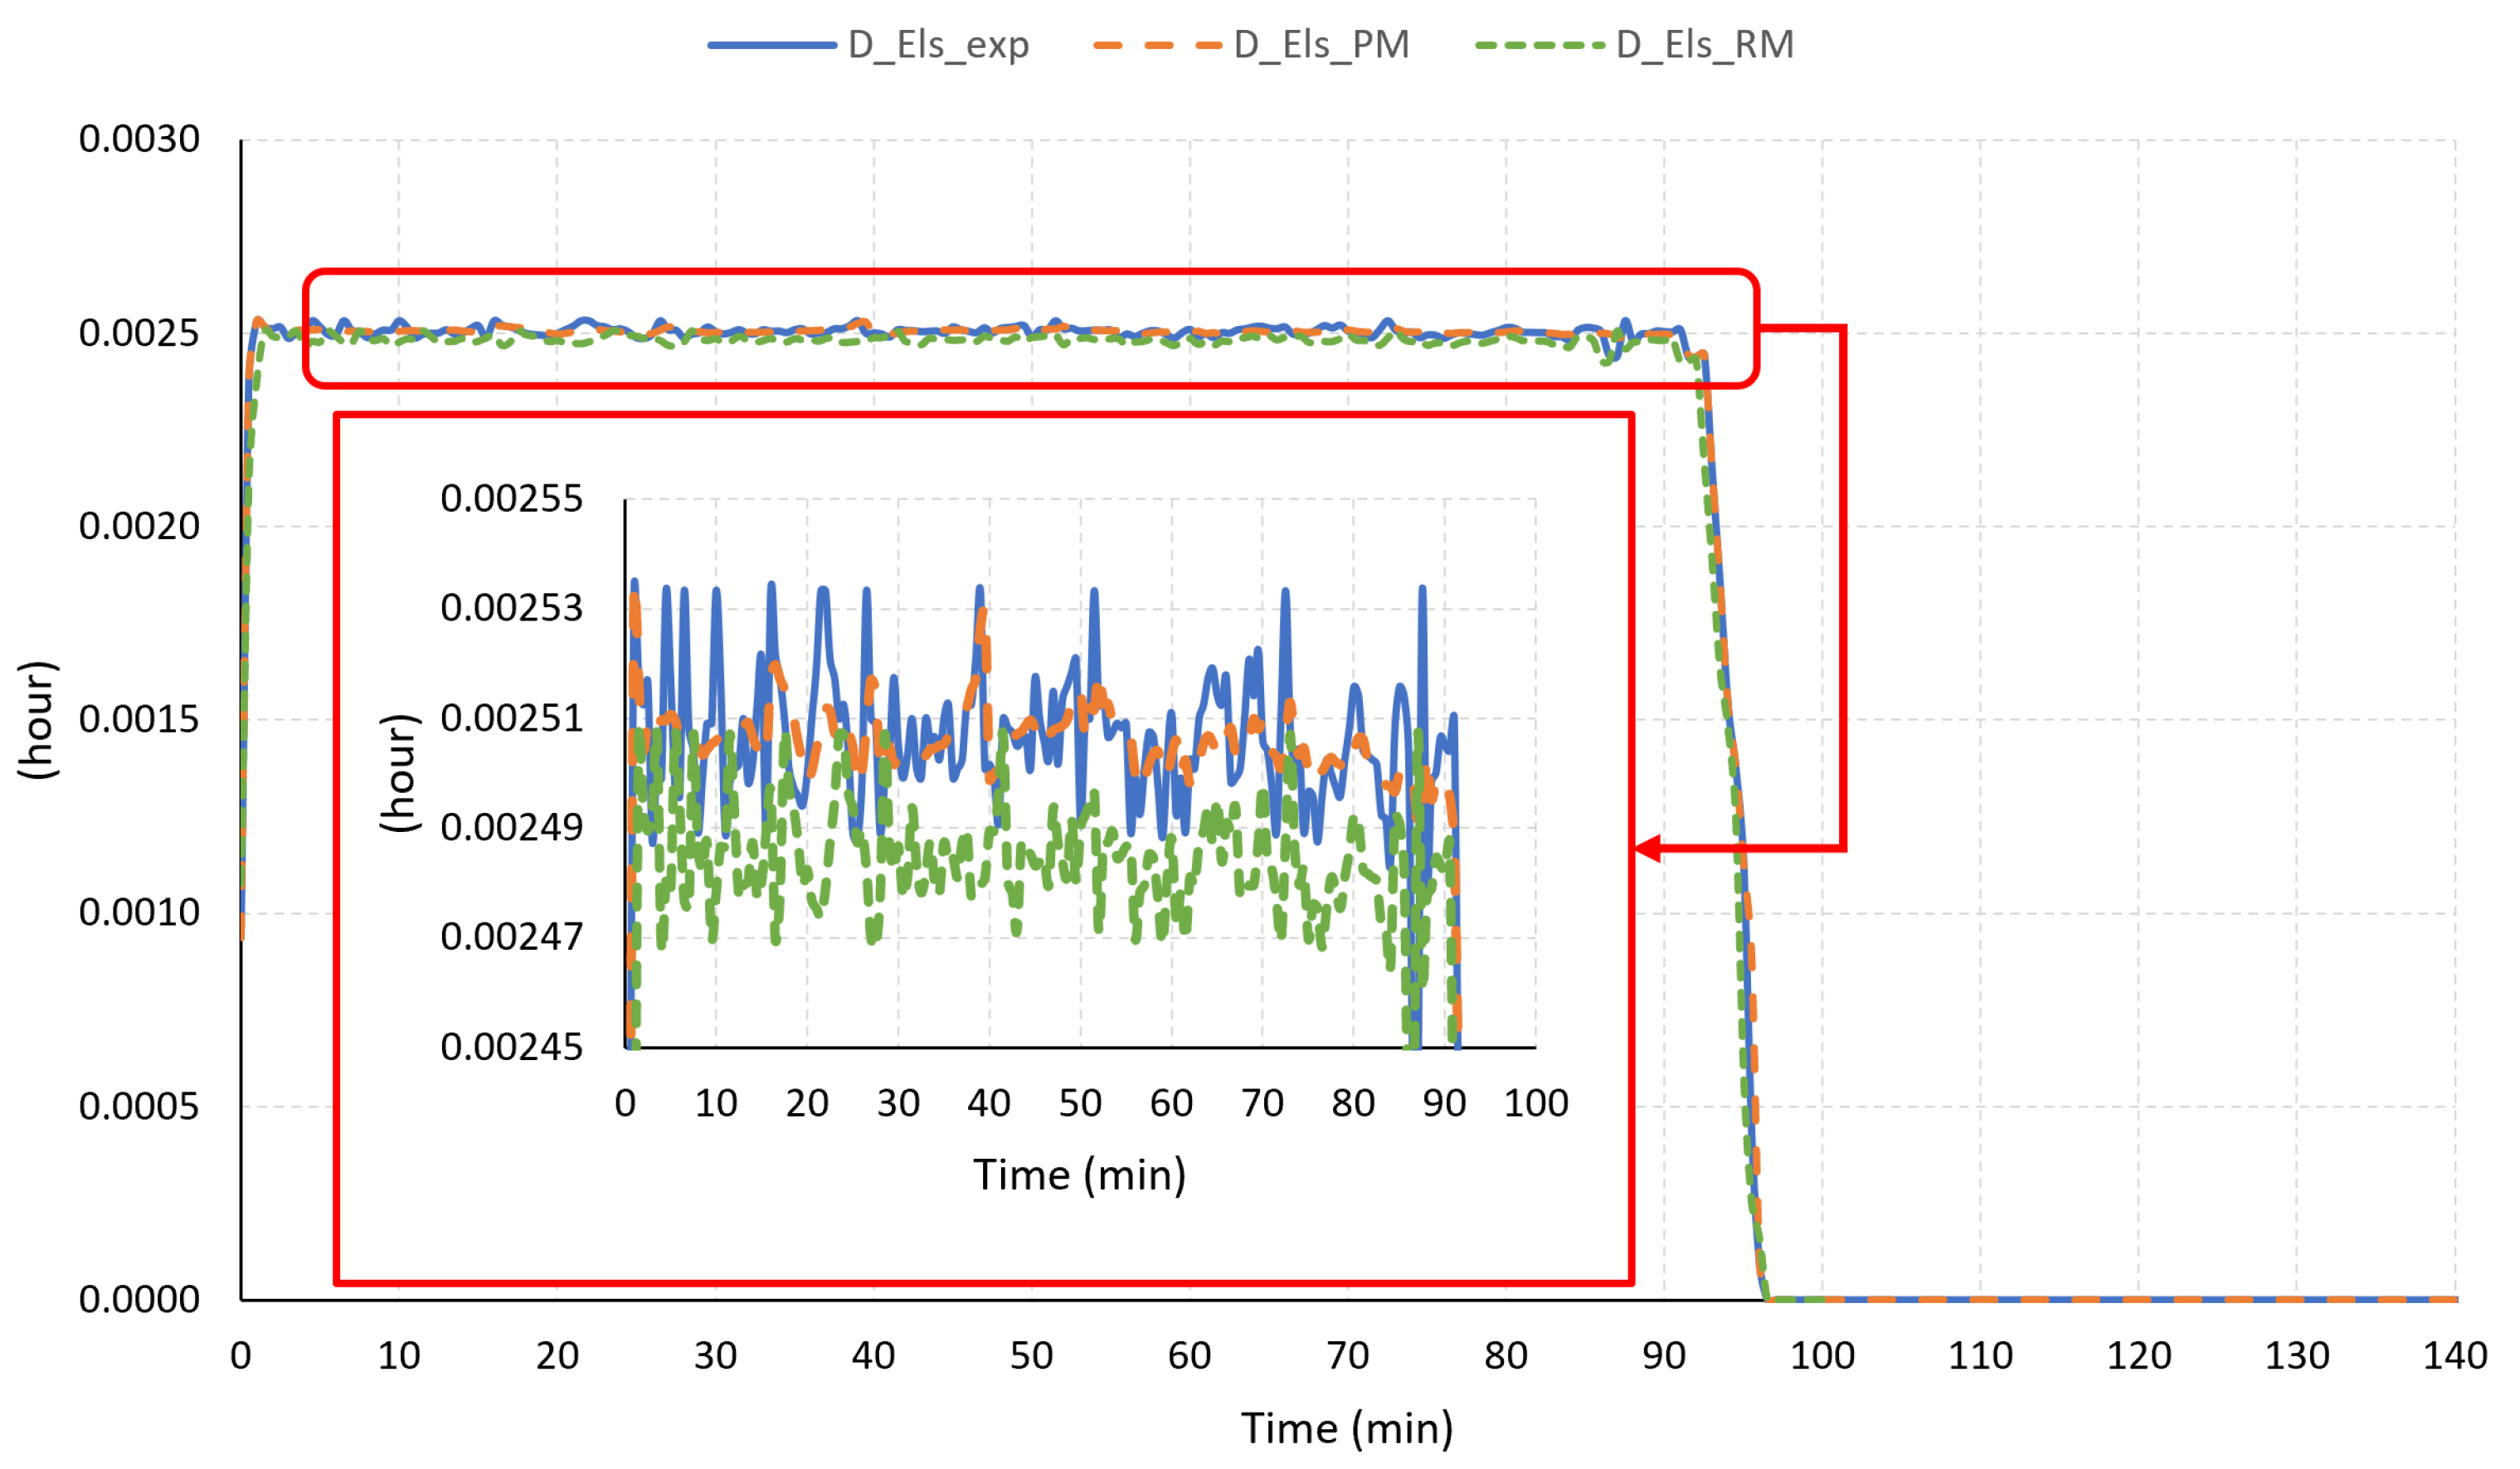
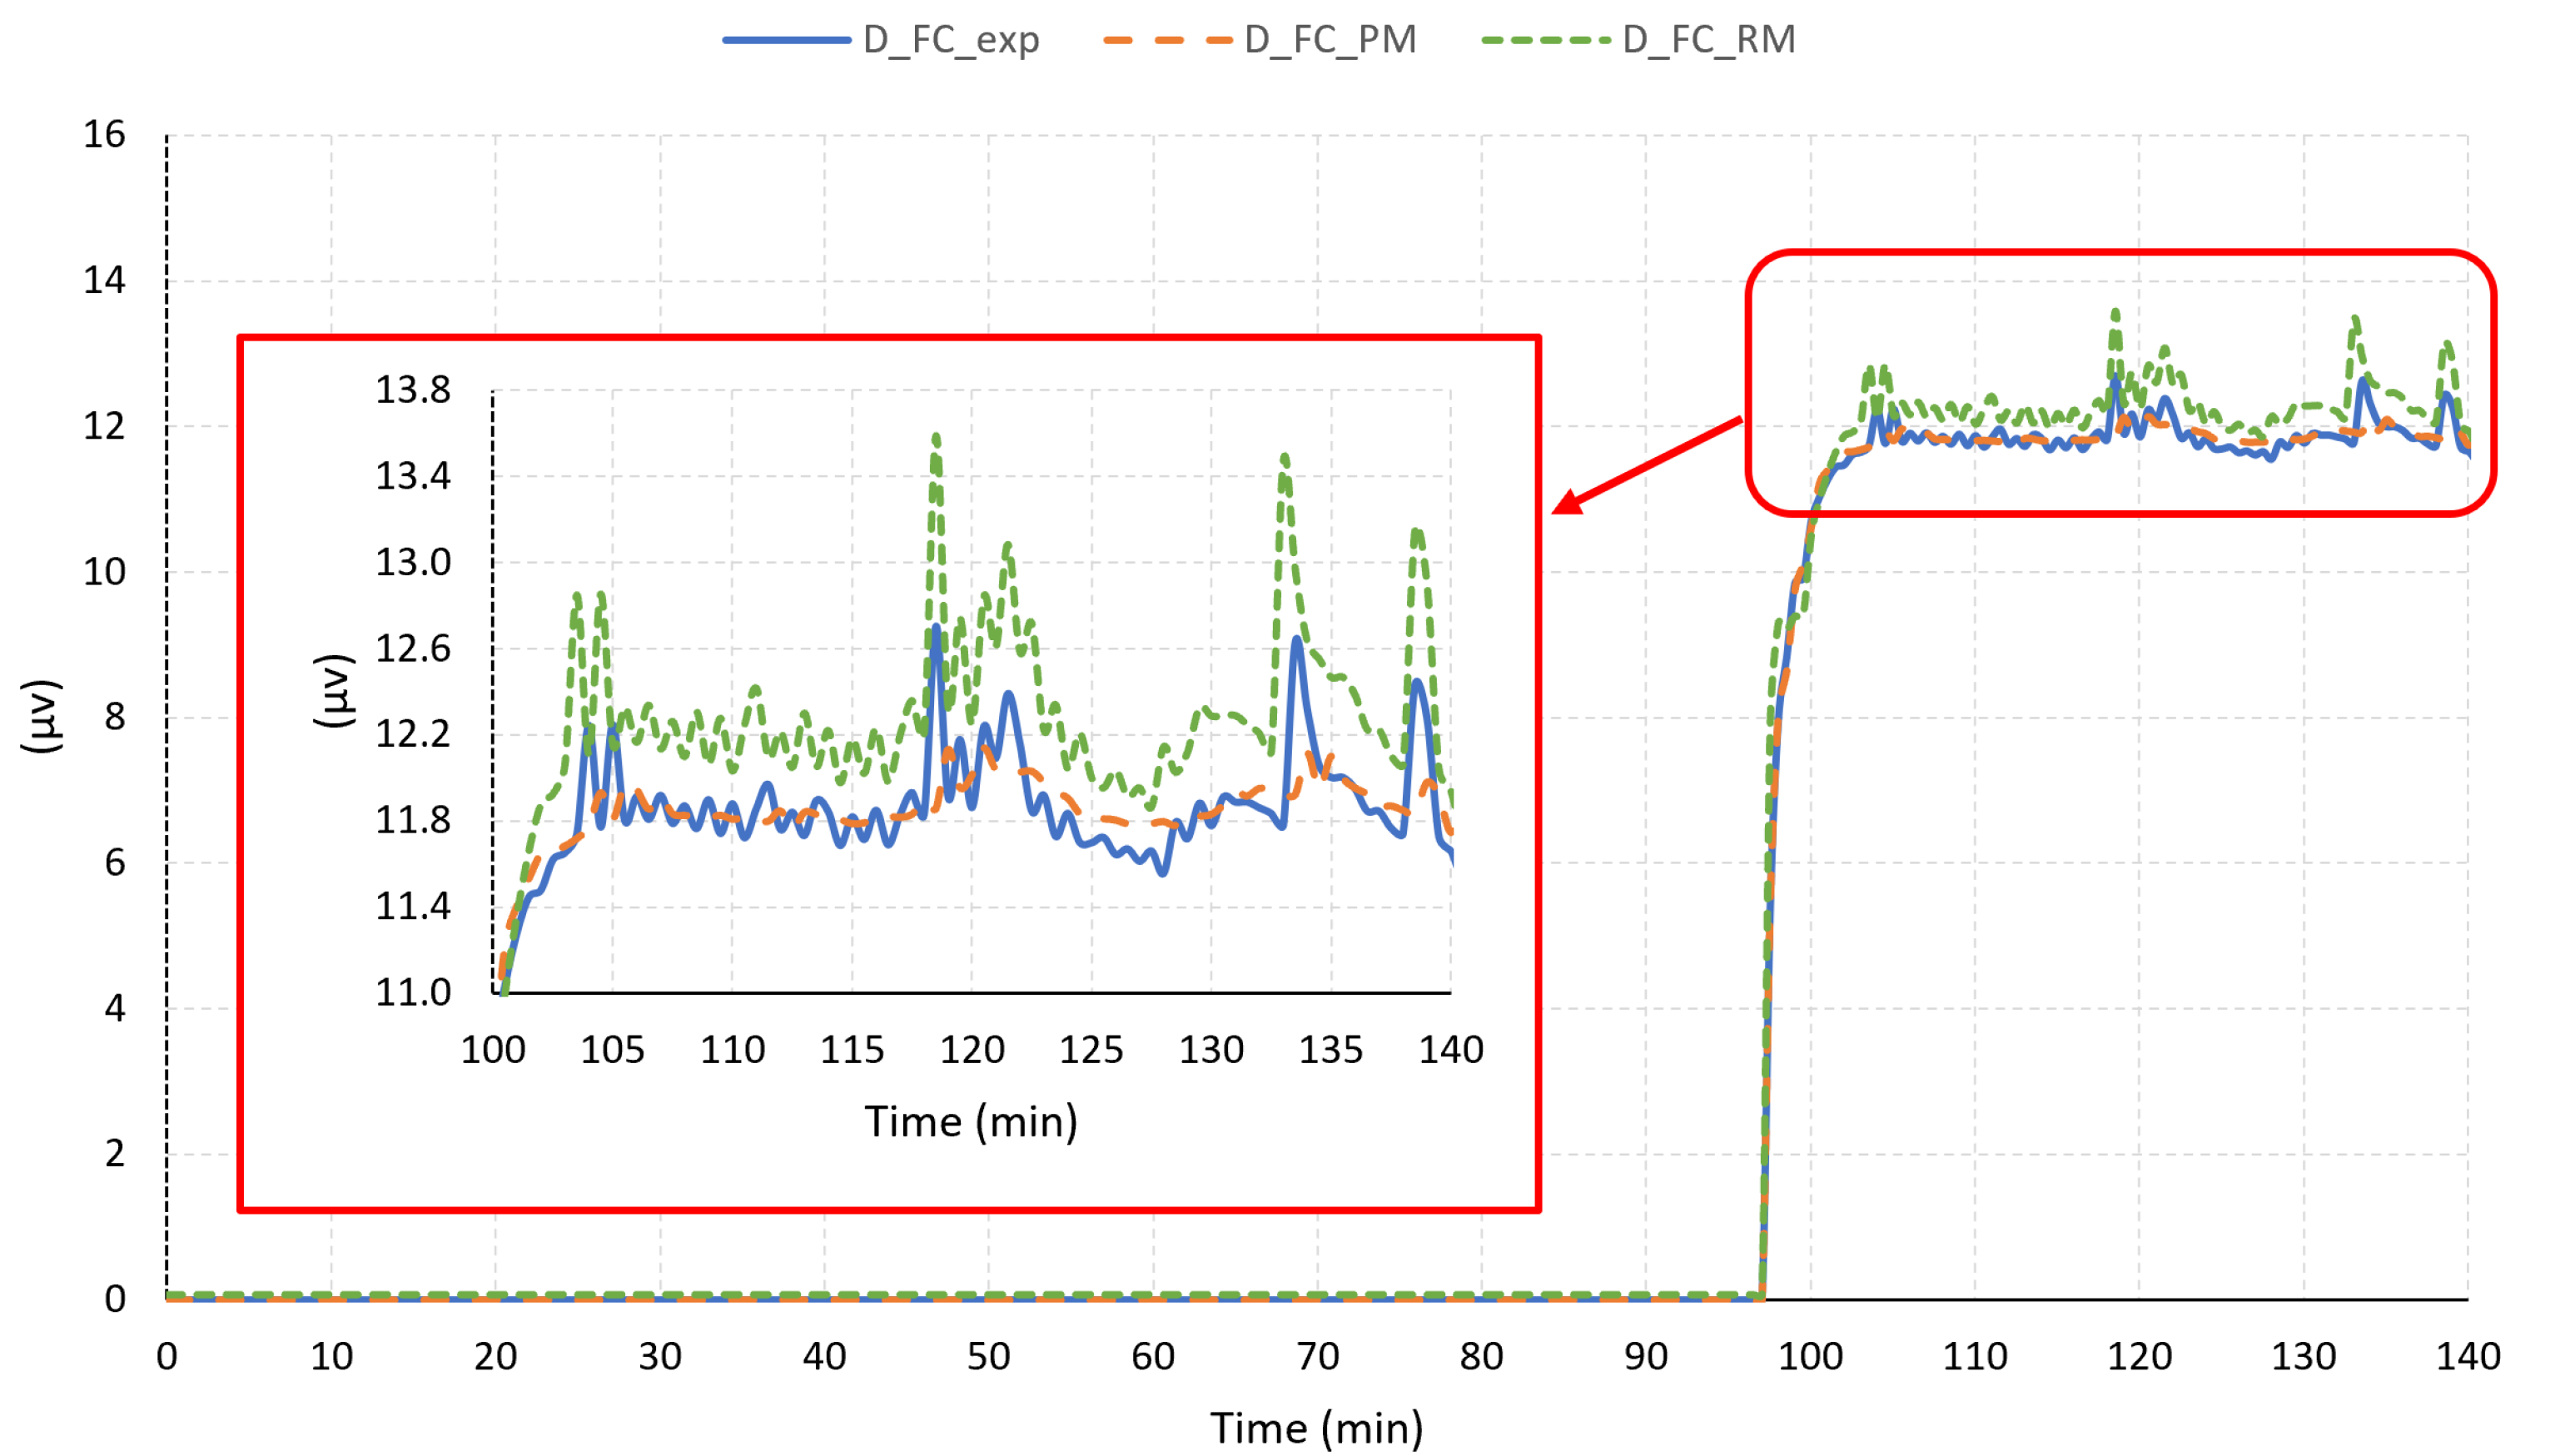
This paper develops a hybrid intelligent model to predict the hydrogen subsystem behaviour considering the remaining electrical and physical variables that intervene in the microgrid performance. This allows identifying the interrelationship between the different variables of the whole microgrid and the parameters of the hydrogen-based subsystem, i.e., operating power, hydrogen tank level and degradation of fuel cell and electrolyzer. Four different models were developed in order to predict the four output variables: the hydrogen subsystem power (consumed by the electrolyzer or supplied by the fuel cell module), the level of stored hydrogen, and the degradation of the electrolyzer and the fuel cell module.
The accuracy of the model has been validated; all the models have been created with a hybrid topology that divides the model into two different local models. The final models were validated with a dataset isolated from the one used for training, and they obtain a maximum MSE of 3.8177 · 10 4 in the prediction of the degradation of the electrolyzer, and a minimum MSE of 1.9160 · 10 8 , obtained in the model that predicts the hydrogen level in the tank.
The models were tested using a different dataset and they obtained an MSE of 619.9549 to predict the hydrogen subsystem power, 1.9153 · 10 6 to predict the level of stored hydrogen, 8.7600 · 10 8 to predict the degradation of the electrolyzer, and 1.8484 · 10 15 to predict the degradation of the fuel cell module. These errors are calculated without normalization values. The results shows that this type of model can be used in these systems. To obtain a general model that could be applied to different specific systems, it was necessary to increase the dataset to train all the types of working points.
Finally, the response of the proposed model was compared to those used as reference models [48,49,50,51]. For this purpose, all the reference models were simulated using the same input profile, making use of the power setpoint for electrolyzer and fuel cell obtained from the experimental data. As an output, the hydrogen generation/consumption ratios in electrolyzer and fuel cell (references [48,49,50]) and their respective degradation ratios (reference [51]) have been obtained and used for the validation process.
The created model involves both operation of the hydrogen subsystem, storage and consumption. Previous work [48] develops a model only for the electrolyzer and achieves an RMSE of 0.0957 . On the other hand, in studies such as [49] that work with artificial intelligence techniques or [50] that choose classical modelling techniques to model the fuel cell behaviour, they obtain an RMSE of 0.058 and an MSE of 0.37 . The proposal developed by authors models the behaviour of a whole hydrogen subsystem integrated by the electrolyzer, hydrogen storage and fuel cell. Based on obtained results, the authors’ proposal is validated with an RMSE of 0.0603 and an MSE of 2.2919 · 10 5 .
As future work, it is possible to mention the extension of this procedure in the other sub systems of the microgrid. Moreover, it would be necessary to increase the dataset to include more working points with different powers and different hydrogen levels in the tank.

Author Contributions

Data curation, F.S. and A.J.B.; Dethodology, J.-L.C.-R. and J.L.C.-R.; Project administration, J.L.C.-R. and J.M.A.; Software, J.-L.C.-R. and A.J.B.; Validation, F.J.V. and J.M.A.; Writing—original draft, F.J.V. and F.S. All authors have read and agreed to the published version of the manuscript.

Funding

This research received no external funding.

Acknowledgments

This work has been possible thanks to the project H2SMART-microGRID Ref. DPI2017-85540-R, funded by Spanish Ministry of Economy Industry and Competitiveness and thanks to the dissemination of the project Hy2Green Ref. 2017-1-ES01-KA203-0383022 funded by ERASMUS+ Programme.

Conflicts of Interest

The authors declare no conflict of interest.

Acronyms, Notation and Symbols

ANNArtificial Neural Network
BoPBalance Of Plant
EMSEnergy Management System
H2Hydrogen
HLHydrogen level
LTILinear Time Invariant
MAEMean Absolute Error
MLDMixed Logical Dynamical
MSEMean Squared Error
PVPhotovoltaic
SOCState of Charge
D_BatBattery bank degradation (Ah)
D_ElesElectrolyzer degradation (h)
D_FCFuel Cell module degradation (V)
HL_H2Level of stored hydrogen (Nm 3 )
P_BatBattery bank power (W). (−) charging process, (+) discharging process
P_GridMain electrical grid power (W). (−) power supplied to, (+) power consumed from the main electrical grid
P_H2Hydrogen subsystem power (W). (−) electrolyzer operation, (+) fuel cell module operation
P_LoadLoad power (W)
P_RenRenewable origin power (W)
SOC_BatBattery bank state of charge (%)
V_BatBattery bank voltage (V); it corresponds with the DC bus voltage

References

  1. Van Aalst, M.K. The impacts of climate change on the risk of natural disasters. Disasters 2006, 30, 5–18. [Google Scholar] [CrossRef]
  2. Hein, W.; Wilson, C.; Lee, B.; Rajapaksa, D.; de Moel, H.; Athukorala, W.; Managi, S. Climate change and natural disasters: Government mitigation activities and public property demand response. Land Use Policy 2019, 82, 436–443. [Google Scholar] [CrossRef]
  3. Nagy, K.; Körmendi, K. Use of renewable energy sources in light of the “New Energy Strategy for Europe 2011–2020”. Appl. Energy 2012, 96, 393–399. [Google Scholar] [CrossRef]
  4. Montero-Sousa, J.A.; Casteleiro-Roca, J.L.; Calvo-Rolle, J.L. Evolution of the electricity sector after the 2nd world war. DYNA 2017, 92, 280–284. [Google Scholar]
  5. Dunn, B.; Kamath, H.; Tarascon, J.M. Electrical energy storage for the grid: A battery of choices. Science 2011, 334, 928–935. [Google Scholar] [CrossRef] [Green Version]
  6. Yang, C.J.; Jackson, R.B. Opportunities and barriers to pumped-hydro energy storage in the United States. Renew. Sustain. Energy Rev. 2011, 15, 839–844. [Google Scholar] [CrossRef]
  7. Hall, P.J.; Bain, E.J. Energy-storage technologies and electricity generation. Energy Policy 2008, 36, 4352–4355. [Google Scholar] [CrossRef] [Green Version]
  8. Tao, H.; Duarte, J.L.; Hendrix, M.A. Line-interactive UPS using a fuel cell as the primary source. IEEE Trans. Ind. Electron. 2008, 55, 3012–3021. [Google Scholar]
  9. Phan, Q.A.; Scully, T.; Breen, M.; Murphy, M.D. Facilitating high levels of wind penetration in a smart grid through the optimal utilization of battery storage in microgrids: An analysis of the trade-offs between economic performance and wind generation facilitation. Energy Convers. Manag. 2020, 206, 112354. [Google Scholar] [CrossRef]
  10. Vivas, F.J.; De las Heras, A.; Segura, F.; Andújar, J.M. A review of energy management strategies for renewable hybrid energy systems with hydrogen backup. Renew. Sustain. Energy Rev. 2018, 82, 126–155. [Google Scholar] [CrossRef]
  11. Colombo, P.; Saeedmanesh, A.; Santarelli, M.; Brouwer, J. Dynamic dispatch of solid oxide electrolysis system for high renewable energy penetration in a microgrid. Energy Convers. Manag. 2020, 204, 112322. [Google Scholar] [CrossRef]
  12. Vivas, F.J.; Segura, F.; Andújar, J.M.; Palacio, A.; Saenz, J.L.; Isorna, F.; López, E. Multi-Objective Fuzzy Logic-Based Energy Management System for Microgrids with Battery and Hydrogen Energy Storage System. Electronics 2020, 9, 1074. [Google Scholar] [CrossRef]
  13. Andújar, J.M.; Segura, F. Fuel cells: History and updating. A walk along two centuries. Renew. Sustain. Energy Rev. 2009, 13, 2309–2322. [Google Scholar] [CrossRef]
  14. De las Heras, A.; Vivas, F.; Segura, F.; Andújar, J. From the cell to the stack. A chronological walk through the techniques to manufacture the PEFCs core. Renew. Sustain. Energy Rev. 2018, 96, 29–45. [Google Scholar] [CrossRef]
  15. Vivas, F.J.; de las Heras, A.; Segura, F.; Andújar, J.M. Cell voltage monitoring All-in-One. A new low cost solution to perform degradation analysis on air-cooled polymer electrolyte fuel cells. Int. J. Hydrog. Energy 2019, 44, 12842–12856. [Google Scholar] [CrossRef]
  16. Barragán, A.J.; Enrique, J.M.; Segura, F.; Andújar, J.M. Iterative Fuzzy Modeling Of Hydrogen Fuel Cells By The Extended Kalman Filter. IEEE Access 2020. [Google Scholar] [CrossRef]
  17. Ross, D. Power struggle [power supplies for portable equipment]. IEE Rev. 2003, 49, 34–38. [Google Scholar] [CrossRef]
  18. Moreira, M.V.; da Silva, G.E. A practical model for evaluating the performance of proton exchange membrane fuel cells. Renew. Energy 2009, 34, 1734–1741. [Google Scholar] [CrossRef]
  19. Kirubakaran, A.; Jain, S.; Nema, R. A review on fuel cell technologies and power electronic interface. Renew. Sustain. Energy Rev. 2009, 13, 2430–2440. [Google Scholar] [CrossRef]
  20. Paska, J.; Biczel, P.; Kłos, M. Hybrid power systems—An effective way of utilising primary energy sources. Renew. Energy 2009, 34, 2414–2421. [Google Scholar] [CrossRef]
  21. Bertoluzzo, M.; Buja, G. Development of Electric Propulsion Systems for Light Electric Vehicles. IEEE Trans. Ind. Inform. 2011, 7, 428–435. [Google Scholar] [CrossRef]
  22. De las Heras, A.; Vivas, F.; Segura, F.; Redondo, M.; Andújar, J. Air-cooled fuel cells: Keys to design and build the oxidant/cooling system. Renew. Energy 2018, 125, 1–20. [Google Scholar] [CrossRef]
  23. Ferrario, A.M.; Vivas, F.; Manzano, F.S.; Andújar, J.; Bocci, E.; Martirano, L. Hydrogen vs. Battery in the Long-term Operation. A Comparative Between Energy Management Strategies for Hybrid Renewable Microgrids. Electronics 2020, 9, 698. [Google Scholar] [CrossRef]
  24. Vivas, F.; De las Heras, A.; Segura, F.; Andújar, J. A proposal of energy management strategy on hybrid renewable system with hydrogen backup. In Proceedings of the 2016 7th International Renewable Energy Congress (IREC), Hammamet, Tunisia, 22–24 March 2016; pp. 1–6. [Google Scholar]
  25. Montero-Sousa, J.A.; Casteleiro-Roca, J.L.; Calvo-Rolle, J.L. The electricity sector since its inception until the second world war. DYNA 2017, 92, 43–47. [Google Scholar]
  26. Zhang, X.; Yang, D.; Luo, M.; Dong, Z. Load profile based empirical model for the lifetime prediction of an automotive PEM fuel cell. Int. J. Hydrog. Energy 2017, 42, 11868–11878. [Google Scholar] [CrossRef]
  27. Lan, T.; Strunz, K. Modeling of multi-physics transients in PEM fuel cells using equivalent circuits for consistent representation of electric, pneumatic, and thermal quantities. Int. J. Electr. Power Energy Syst. 2020, 119, 105803. [Google Scholar] [CrossRef]
  28. Görgün, H. Dynamic modelling of a proton exchange membrane (PEM) electrolyzer. Int. J. Hydrog. Energy 2006, 31, 29–38. [Google Scholar] [CrossRef]
  29. Abdin, Z.; Webb, C.; Gray, E. Modelling and simulation of an alkaline electrolyser cell. Energy 2017, 138, 316–331. [Google Scholar] [CrossRef] [Green Version]
  30. Aouali, F.; Becherif, M.; Ramadan, H.; Emziane, M.; Khellaf, A.; Mohammedi, K. Analytical modelling and experimental validation of proton exchange membrane electrolyser for hydrogen production. Int. J. Hydrog. Energy 2017, 42, 1366–1374. [Google Scholar] [CrossRef]
  31. Garcia-Torres, F.; Bordons, C. Optimal Economical Schedule of Hydrogen-Based Microgrids With Hybrid Storage Using Model Predictive Control. IEEE Trans. Ind. Electron. 2015, 62, 5195–5207. [Google Scholar] [CrossRef]
  32. Garcia-Torres, F.; Valverde, L.; Bordons, C. Optimal Load Sharing of Hydrogen-Based Microgrids With Hybrid Storage Using Model-Predictive Control. IEEE Trans. Ind. Electron. 2016, 63, 4919–4928. [Google Scholar] [CrossRef]
  33. Nair, U.R.; Costa-Castello, R. An analysis of energy storage system interaction in a multi objective model predictive control based energy management in DC microgrid. In Proceedings of the 2019 24th IEEE International Conference on Emerging Technologies and Factory Automation (ETFA), Zaragoza, Spain, 10–13 September 2019. [Google Scholar] [CrossRef]
  34. Potter, C.W.; Archambault, A.; Westrick, K. Building a smarter smart grid through better renewable energy information. In Proceedings of the IEEE/PES Power Systems Conference and Exposition (PSCE’09), Seattle, WA, USA, 15–18 March 2009; pp. 1–5. [Google Scholar]
  35. Cho, Y.; Awbi, H.B. A study of the effect of heat source location in a ventilated room using multiple regression analysis. Build. Environ. 2007, 42, 2072–2082. [Google Scholar] [CrossRef]
  36. Casteleiro-Roca, J.L.; Pérez, J.A.M.; Piñón-Pazos, A.J.; Calvo-Rolle, J.L.; Corchado, E. Intelligent Model for Electromyogram (EMG) Signal Prediction During Anesthesia. J. Mult.-Valued Log. Soft Comput. 2019, 32, 205–220. [Google Scholar]
  37. Luis Casteleiro-Roca, J.; Quintián, H.; Luis Calvo-Rolle, J.; Méndez-Pérez, J.A.; Javier Perez-Castelo, F.; Corchado, E. Lithium iron phosphate power cell fault detection system based on hybrid intelligent system. Log. J. IGPL 2020, 28, 71–82. [Google Scholar] [CrossRef]
  38. Casteleiro-Roca, J.L.; Gómez-González, J.F.; Calvo-Rolle, J.L.; Jove, E.; Quintián, H.; Gonzalez Diaz, B.; Mendez Perez, J.A. Short-term energy demand forecast in hotels using hybrid intelligent modeling. Sensors 2019, 19, 2485. [Google Scholar] [CrossRef] [Green Version]
  39. Jove, E.; Casteleiro-Roca, J.L.; Quintián, H.; Méndez-Pérez, J.A.; Calvo-Rolle, J.L. A fault detection system based on unsupervised techniques for industrial control loops. Expert Syst. 2019, 36, e12395. [Google Scholar] [CrossRef]
  40. Vivas, F.; Heras, A.D.l.; Segura, F.; Andújar, J. H2RES2 simulator. A new solution for hydrogen hybridization with renewable energy sources-based systems. Int. J. Hydrog. Energy 2017, 42, 13510–13531. [Google Scholar] [CrossRef]
  41. Calderón, A.J.; Vivas, F.J.; Segura, F.; Andújar, J.M. Integration of a Multi-Stack Fuel Cell System in Microgrids: A Solution Based on Model Predictive Control. Energies 2020, 13, 4924. [Google Scholar] [CrossRef]
  42. Casteleiro-Roca, J.; Barragán, A.J.; Segura, F.; Calvo-Rolle, J.; Andújar, J.M. Fuel Cell Output Current Prediction with a Hybrid Intelligent System. Complexity 2019, 2019, 10. [Google Scholar] [CrossRef]
  43. Orallo, J.; Quintana, M.; Ramírez, C. Introducción a la Minería de Datos; Editorial Alhambra S.A.: Madrid, Spain, 2004. [Google Scholar]
  44. Jove, E.; Gonzalez-Cava, J.M.; Casteleiro-Roca, J.L.; Pérez, J.A.M.; Calvo-Rolle, J.L.; de Cos Juez, F.J. An intelligent model to predict ANI in patients undergoing general anesthesia. In Proceedings of the International Joint Conference SOCO’17-CISIS’17-ICEUTE’17, León, Spain, 6–8 September 2017; Springer: Berlin/Heidelberg, Germany, 2017; pp. 492–501. [Google Scholar]
  45. Harston, A.M.C.; Pap, R. Handbook of Neural Computing Applications; Elsevier Science: Amsterdam, The Netherlands, 2014. [Google Scholar]
  46. Jove, E.; Casteleiro-Roca, J.L.; Quintián, H.; Méndez-Pérez, J.A.; Calvo-Rolle, J.L. Virtual Sensor for Fault Detection, Isolation and Data Recovery for Bicomponent Mixing Machine Monitoring. Informatica 2019, 30, 671–687. [Google Scholar] [CrossRef]
  47. del Brío, B.; Molina, A. Redes Neuronales y Sistemas Borrosos; Ra-Ma: Madrid, Spain, 2006. [Google Scholar]
  48. Guilbert, D.; Vitale, G. Variable Parameters Model of a PEM Electrolyzer Based Model Reference Adaptive System Approach. In Proceedings of the 2020 IEEE International Conference on Environment and Electrical Engineering and 2020 IEEE Industrial and Commercial Power Systems Europe (EEEIC/I&CPS Europe), Madrid, Spain, 9–12 June 2020. [Google Scholar] [CrossRef]
  49. Da Costa Lopes, F.; Watanabe, E.H.; Rolim, L.G.B. A Control-Oriented Model of a PEM Fuel Cell Stack Based on NARX and NOE Neural Networks. IEEE Trans. Ind. Electron. 2015, 62, 5155–5163. [Google Scholar] [CrossRef]
  50. Deng, Z.; Chen, Q.; Zhang, L.; Zong, Y.; Zhou, K.; Fu, Z. Control oriented data driven linear parameter varying model for proton exchange membrane fuel cell systems. Appl. Energy 2020, 277, 115540. [Google Scholar] [CrossRef]
  51. Vivas, F.; Segura, F.; Andújar, J.; Caparrós, J. A suitable state-space model for renewable source-based microgrids with hydrogen as backup for the design of energy management systems. Energy Convers. Manag. 2020, 219, 113053. [Google Scholar] [CrossRef]
Figure 1. Architecture of the renewable energy sources-based microgrid at the University of Huelva.
Sustainability 12 10566 g001
Figure 2. Hydrogen subsystem: (a) alkaline electrolyzer; (b) PEM electrolyzer; (c) high pressure tank; (d) metal hydride tanks; (e) proton exchange fuel cell (PEFC) multi-stack module.
Sustainability 12 10566 g002
Figure 3. General schema of microgrid
Sustainability 12 10566 g003
Figure 4. Internal layout of the hybrid model.
Sustainability 12 10566 g004
Figure 5. K-fold cross validation.
Sustainability 12 10566 g005
Figure 6. Stored hydrogen (exp: experimental data, PM: proposed model by authors and RM: reference model from literature).
Sustainability 12 10566 g006
Figure 7. Electrolyzer degradation (exp: experimental data, PM: proposed model by authors and RM: reference model from literature).
Sustainability 12 10566 g007
Figure 8. Fuel cell degradation (exp: experimental data, PM: proposed model by authors and RM: reference model from literature).
Sustainability 12 10566 g008
Table 1. Summary of modeling categories.
CategoriesFundamentalsParametersAdvantagesShortcomingsReferences
Complex mathematical models.Model oriented to the design of complex simulations and analysis.Depending on equipment.Detailed study of the equipment behavior.Individualized equipment model.
Complex mathematical expressions.
Parameters difficult to measure.
[26,27,28,29,30]
LTI and MLD models.EMS control-oriented model.SOC and HL.Simplicity.
Low computational cost.
Reduced accuracy.
Use of simplifications and linearizations around a single working point.
Degradation parameters are not included in model definition.
[31,32,33]
Authors’ proposal.Simulation and EMS-oriented model.Power, SOC, HL, Bus Voltage, Degradation.Increased model performance.
The model includes all the system parameters to calculate the hydrogen system variables.
Higher computational cost.-
Table 2. Technical characteristics of the microgrid devices.
ComponentManufacturer and ModelNominal Parameters
Solar PV mono-Si panelsIsofoton©, ISF-2505 kW p
Solar PV poly-Si panelsAtersa©, A-230P5 kW p
Solar PV thin-film a-Si panelsSchott Solar©, ASI 100,5 kW p
Solar tacker mono-Si panelsLuxor©, LX-195M1.2 kW p
Horizontal-axis μ -Wind turbineEnair©, Enair 705 kW p
Horizontal-axis Wind turbineEnair©, Enair 200L25 kW p
Vertical-axis μ -Wind turbineKliux©, Kliux Zebra1.8 kW p
Lead-acid battery bankU-power©, UP100-1234 × 12 V, 100 Ah (40.8 kWh)
Supercapacitor bankLS©, LSUM 048R6C 0166F15 × 48 V, 166 F (0.8 kWh)
Alkaline electrolyzerH2 Nitidor©, 0074-01-PMO-0012 Nm 3 /h, 30 bar, 10 kW e
PEM electrolyzerAriema©2 Nm 3 /h, 30 bar, 10 kW e
PEFC stackBallard©, FCgen-1020ACS4 × 3.4 kW e
Hydrogen gas tankLPS1000H, Lapesa©1 Nm 3 , 30 bar
Metal hydride hydrogen tank 1500 NLHBond©, HBond-1500L1.5 Nm 3 , 15 bar
MMetal hydride hydrogen tank 5000 NLHBond©, HBond-5000L5 Nm 3 , 15 bar
Bidirectional DC programmable power supply/loadRegatron©, GSS.40.600.80,40 kW
AC programmable loadNHR©, 4600 Series18 kW
Table 3. The number of samples in each of the created clusters.
GlobalHybrid Model (Local Models)
23456
Cl-12728978403030
Cl-2 18388554036
Cl-3 106895540
Cl-4 885943
Cl-5 8959
Cl-6 64
Table 4. Mean squared error (MSE) using an artificial neural network (ANN) model with eight neurons in the hidden layer to predict the level of stored hydrogen.
GlobalHybrid Model (Local Models)
23456
Cl-1 2.3984 · 10 5 0.0011 6.9041 · 10 7 8.0724 · 10 7 4.0524 · 10 4 7.4945 · 10 4
Cl-2 3.1544 · 10 7 6.6584 · 10 5 2.6084 · 10 7 2.8948 · 10 7 1.3023 · 10 6
Cl-3 1.7973 · 10 5 1.9729 · 10 6 3.2842 · 10 5 9.6112 · 10 5
Cl-4 7.4043 · 10 4 3.6455 · 10 7 7.6656 · 10 9
Cl-5 1.9621 · 10 5 1.5924 · 10 4
Cl-6 1.5676 · 10 8
Table 5. Mean absolute error (MAE) using an ANN model with 13 neurons in the hidden layer to predict the degradation of the fuel cell module.
GlobalHybrid Model (Local Models)
23456
Cl-1 0.0758 0.1186 00 0.0435 0.0371
Cl-2 0 0.1094 000
Cl-3 0 0.0785 0.0399 0
Cl-4 000
Cl-5 0 0.0384
Cl-6 0
Table 6. Lowest MSE to predict the degradation of the electrolyzer.
GlobalHybrid Model (Local Models)
23456
Cl-1 0.0020 0 0.0070 0.0045 00
Cl-2 0.0030 0 1.7720 · 10 5 0.0028 0.0083
Cl-3 0.0021 0.0021 1.3042 · 10 5 0.0039
Cl-4 00 1.3154 · 10 5
Cl-5 0.0034 0
Cl-6 2.8454 · 10 5
Table 7. Lowest MSE to predict the power of the hydrogen subsystem.
GlobalHybrid Model (Local Models)
23456
Cl-1 5.8520 · 10 4 1.6415 · 10 4 3.3171 · 10 4 6.7351 · 10 4 3.4352 · 10 4 1.1669 · 10 4
Cl-2 0.0011 3.2551 · 10 4 4.4568 · 10 6 0.0012 5.6825 · 10 4
Cl-3 2.7722 · 10 4 4.4578 · 10 5 5.0378 · 10 6 0.0021
Cl-4 0.0015 5.8825 · 10 5 6.4327 · 10 6
Cl-5 2.7653 · 10 4 6.1282 · 10 5
Cl-6 8.1909 · 10 6
Table 8. Model configuration to predict the degradation of the electrolyzer.
GlobalHybrid Model (Local Models)
23456
Cl-1ANN4ANN1ANN5ANN11ANN1ANN1
Cl-2 ANN4ANN1ANN1ANN1ANN13
Cl-3 ANN2ANN1ANN1ANN1
Cl-4 ANN1ANN1ANN1
Cl-5 ANN10ANN1
Cl-6 ANN1
Table 9. Model configuration to predict the power of the hydrogen subsystem.
GlobalHybrid Model (Local Models)
23456
Cl-1ANN2ANN1ANN3ANN2ANN7ANN1
Cl-2 ANN2ANN3ANN1ANN1ANN5
Cl-3 ANN4ANN1ANN1ANN12
Cl-4 ANN9ANN1ANN1
Cl-5 ANN4ANN1
Cl-6 ANN1
Table 10. Error values for the different hybrid configurations to predict the power of the hydrogen subsystem.
GlobalHybrid Model (Local Models)
23456
MSE 4.6264 · 10 5 3.3134 · 10 5 1.9303 · 10 4 4.5200 · 10 4 7.1806 · 10 5 1.5049 · 10 4
MAE 0.0040 0.0033 0.0049 0.0053 0.0038 0.0054
NMSE 2.2666 · 10 4 1.6339 · 10 4 9.4922 · 10 4 0.0022 3.5374 · 10 4 7.3349 · 10 4
Table 11. Error values for the different hybrid configurations to predict the level of stored hydrogen.
GlobalHybrid Model (Local Models)
23456
MSE 1.8189 · 10 8 1.9160 · 10 8 1.9721 · 10 8 7.6748 · 10 7 1.8407 · 10 8 5.6739 · 10 8
MAE 8.6956 · 10 5 7.2598 · 10 5 6.6617 · 10 5 1.6075 · 10 4 6.7671 · 10 5 8.0154 · 10 5
NMSE 2.7900 · 10 7 2.9388 · 10 7 3.0253 · 10 7 1.1770 · 10 5 2.8232 · 10 7 8.7018 · 10 7
Table 12. Error values for the different hybrid configurations to predict the degradation of the electrolyzer.
GlobalHybrid Model (Local Models)
23456
MSE 0.0332 3.8177 · 10 4 0.0194 9.1173 · 10 5 0.0079 1.0752 · 10 5
MAE 0.0323 0.0044 0.0233 0.0029 0.0130 0.0020
NMSE 0.1270 0.0018 0.0908 4.2797 · 10 4 0.0348 5.0616 · 10 5
Table 13. Error values for the different hybrid configurations to predict the degradation of the fuel cell module.
GlobalHybrid Model (Local Models)
23456
MSE 5.0285 · 10 5 4.6856 · 10 5 9.2061 · 10 5 1.0035 · 10 4 3.5805 · 10 4 0.0190
MAE 0.0029 0.0029 0.0040 0.0042 0.0064 0.0314
NMSE 2.7923 · 10 4 2.5974 · 10 4 5.0726 · 10 4 5.5445 · 10 4 0.0020 0.1054
Table 14. Test results.
Mean SquareAbsolute MeanNormalized Mean Square
Error − MSEError − MAEError − NMSE
Power of the hydrogen subsystem 619.9549 ( 2.2919 · 10 5 ) 18.9009  W – 0 . 6217 % ( 0 . 0036 ) 1.6706 · 10 4
Level of stored hydrogen 1.9153 · 10 6 ( 2.6449 · 10 8 ) 6.1233 · 10 4  Nm 3 0 . 0012 % ( 7 . 1957 · 10 5 ) 6.1504 · 10 7
Degradation of the electrolyzer 8.7600 · 10 8 ( 0.0136 ) 8.1473 · 10 5  h – 3 . 2160 % ( 0 . 0322 ) 0.0705
Degradation of the fuel cell module 1.8484 · 10 15 ( 1.1457 · 10 5 ) 2.0785 · 10 8  V – 0 . 1636 % ( 0 . 0016 ) 5.8563 · 10 5
Publisher’s Note: MDPI stays neutral with regard to jurisdictional claims in published maps and institutional affiliations.

