Article

Artificial Intelligence Approach for Tomato Detection and Mass Estimation in Precision Agriculture

1
Department of Agricultural Engineering, National Institute of Agricultural Sciences, Jeollabuk-do 55365, Korea
2
Department of Computer Science, University of St Andrews, Fife KY16 9AJ, UK
*
Author to whom correspondence should be addressed.
These authors contributed equally to this work.
Sustainability 2020, 12(21), 9138; https://doi.org/10.3390/su12219138
Submission received: 15 October 2020 / Revised: 31 October 2020 / Accepted: 2 November 2020 / Published: 3 November 2020
(This article belongs to the Special Issue Suitable Agronomic Techniques for Sustainable Agriculture)

Abstract

:
Application of computer vision and robotics in agriculture requires sufficient knowledge and understanding of the physical properties of the object of interest. Yield monitoring is an example where these properties affect the quantified estimation of yield mass. In this study, we propose an image-processing and artificial intelligence-based system using multi-class detection with instance-wise segmentation of fruits in an image that can further estimate dimensions and mass. We analyze a tomato image dataset with mass and dimension values collected using a calibrated vision system and accurate measuring devices. After successful detection and instance-wise segmentation, we extract the real-world dimensions of the fruit. Our characterization results exhibited a significantly high correlation between dimensions and mass, indicating that artificial intelligence algorithms can effectively capture this complex physical relation to estimate the final mass. We also compare different artificial intelligence algorithms to show that the computed mass agrees well with the actual mass. Detection and segmentation results show an average mask intersection over union of 96.05%, mean average precision of 92.28%, detection accuracy of 99.02%, and precision of 99.7%. The mean absolute percentage error for mass estimation was 7.09 for 77 test samples using a bagged ensemble tree regressor. This approach could be applied to other computer vision and robotic applications such as sizing and packaging systems and automated harvesting or to other measuring instruments.

1. Introduction

Artificial intelligence-based fruit monitoring and grading systems are being considered to potentially replace traditional manual inspection in the agricultural and packaging industry [1,2,3,4,5,6,7,8]. This is mainly because of the challenges faced by food production, that is, to meet the rising demands of an ever-growing world population. Tomato (Solanum lycopersicum) is one of the widely produced and consumed agricultural products, and approximately 182 million tons of tomatoes were produced in 2017 [9]. The main purposes of these systems include harvesting, sorting, and grading of fruits while performing calibrations for parameters such as color, size, shape, mass, and defects. Hence, the development of an accurate fruit detection and mass estimation system is crucial toward developing a fully automated agricultural and packaging pipeline. The three major steps in this process are object detection, classification, and analysis (e.g., color, dimension, volume, or mass estimation).
Fruit detection systems have significantly advanced, considering the complexity of the natural environment and the unstructured features of fruits, in addition to other machine-vision challenges, such as occlusions and variations in illumination. Existing traditional approaches involve the use of a series of image pre-processing operations, such as threshold segmentation, edge detection, and region growth, to extract features such as color, shape, texture, and size from an image [10,11,12,13,14,15,16,17,18]. These features are used as a priori knowledge inputs in artificial intelligence algorithms, such as K-nearest neighbor, K-means clustering, and artificial neural networks. In all the studies mentioned, a pixel-level segmentation approach was adopted for fruit detection for various applications [19]. Some of these approaches examine fruit detection primarily for yield estimation [4,5,13,17].
Recently, deep convolutional neural networks (DCNNs) have made considerable progress in the fields of object detection and classification. Thus, DCNNs are being applied in various approaches for crop-target detection because of their autonomous learning and strong feature extraction abilities [8,20,21,22,23,24]. In DCNN, multi-level representations from pixel-level to high-level semantic features are learned using a hierarchical multi-stage architecture, which helps disentangle the hidden factors through multi-level nonlinear mappings. Thus, the relevant features can be learned and captured from an image that is invariant to scale, position, and orientation; additionally, it performs better than traditional methods for handling challenges such as occlusion and variation in orientation and position of objects in computer vision. Furthermore, DCNNs allow the joint optimization of several related tasks, such as classification and bounding box regression, together in a multi-task learning manner using a single architecture. Sa et al. [8] used a region-based object detector [24] to detect fruits using color and near-infrared modalities. In [20], an improved fruit detection method for strawberry harvesting robots using a mask region convolutional neural network [25] was introduced. This work was based on a similar approach and demonstrated the use of DCNN in a combined detection and instance-based segmentation architecture for dimension and mass estimation of tomatoes.
One of the main challenges in machine vision is determining the dimensions of an unknown object in a single 2-D image because of the loss of information related to field depth when projecting a 3-D scene onto a 2-D imaging plane. However, if we have some prior knowledge regarding camera calibration and have a reference object of known size, we can estimate the dimensions of the unknown object from a 2-D image space [26]. In our approach, we use the generated mask output from the DCNN and determine a pixel-per-metric ratio that measures the number of pixels per given metric observed from the reference object with known dimensions [27]. After computing this ratio, we use it to project the dimensions of the known reference and to measure the size of the unknown objects in an image.
Object mass estimation is another task that critically affects optimal policies and simulations in robot-based applications in various fields of agriculture, packaging, shipping, and medicine. Hence, a method for accurate estimation of object mass would be useful for quality inspection and planning of packaging, transport, and marketing operations. Several models and numerical methods have been employed to extract a representation of fruit mass, including traditional water displacement and gas displacement methods [16,28]. However, these approaches are subject to human error and may not be an efficient or practical approach, particularly in sorting large quantities of agricultural yield. Numerous approaches use machine vision to determine fruit mass because machine vision is nondestructive and requires only image processing procedures [1,13,14]. Owing to their dependency on hand-crafted features, these systems cannot be considered to be fully automated.
In another line of work, Chaithanya et al. [29] used machine vision together with an artificial intelligence algorithm to design a system that computes the mass of a small number of food classes from two images captured from different viewpoints. Similarly, in [18], regression prediction models [30] based on both 2-D and 3-D image features were employed to estimate the mass from the volume of tomato fruit. In our approach, we exploited the correlation between 2-D size and mass of tomato fruit to extract the physical relationship between these parameters using different artificial intelligence algorithms. These algorithms were trained and compared using the collected tomato dataset and tested on the output from the geometry module (estimated dimensions) to estimate the final mass. Production forecasting is an important issue in the agricultural and packaging industry, and prior knowledge regarding harvest crops would help farmers in estimating and controlling their yield.
The remainder of this paper is organized as follows. Section 2 provides an overview of the overall system and describes the various steps involved. We demonstrate our experimental results with a discussion based on our results in Section 3. Finally, we draw conclusions on our work in Section 4.

2. Materials and Methods

In this section, we describe the overall framework of our tomato detection and mass estimation system. Figure 1 provides an overview of the training and testing scheme of our method. We started by collecting tomato images, dimensions, and mass values for training, validation, and testing of the following sub-modules of the tomato detection and mass estimation system. The training images were annotated and fed to train a DCNN for detection and mask generation. Meanwhile, the collected dimension and mass features were used to train the regression model for mass estimation. This mass estimation regression model was trained separately from the detection and mask generation DCNN.
During the test phase, we first obtained the mask of the input test image using a trained DCNN for detection and mask generation. Next, the dimensions of tomatoes were extracted from the mask using a two-dimensional reference object with known width or height in the geometry module. These dimensions were the input to a trained regression model to estimate the final mass of test tomato images. In the following subsections, we provide technical details for various steps involved in training our system for estimating the mass of tomato fruits from RGB images.

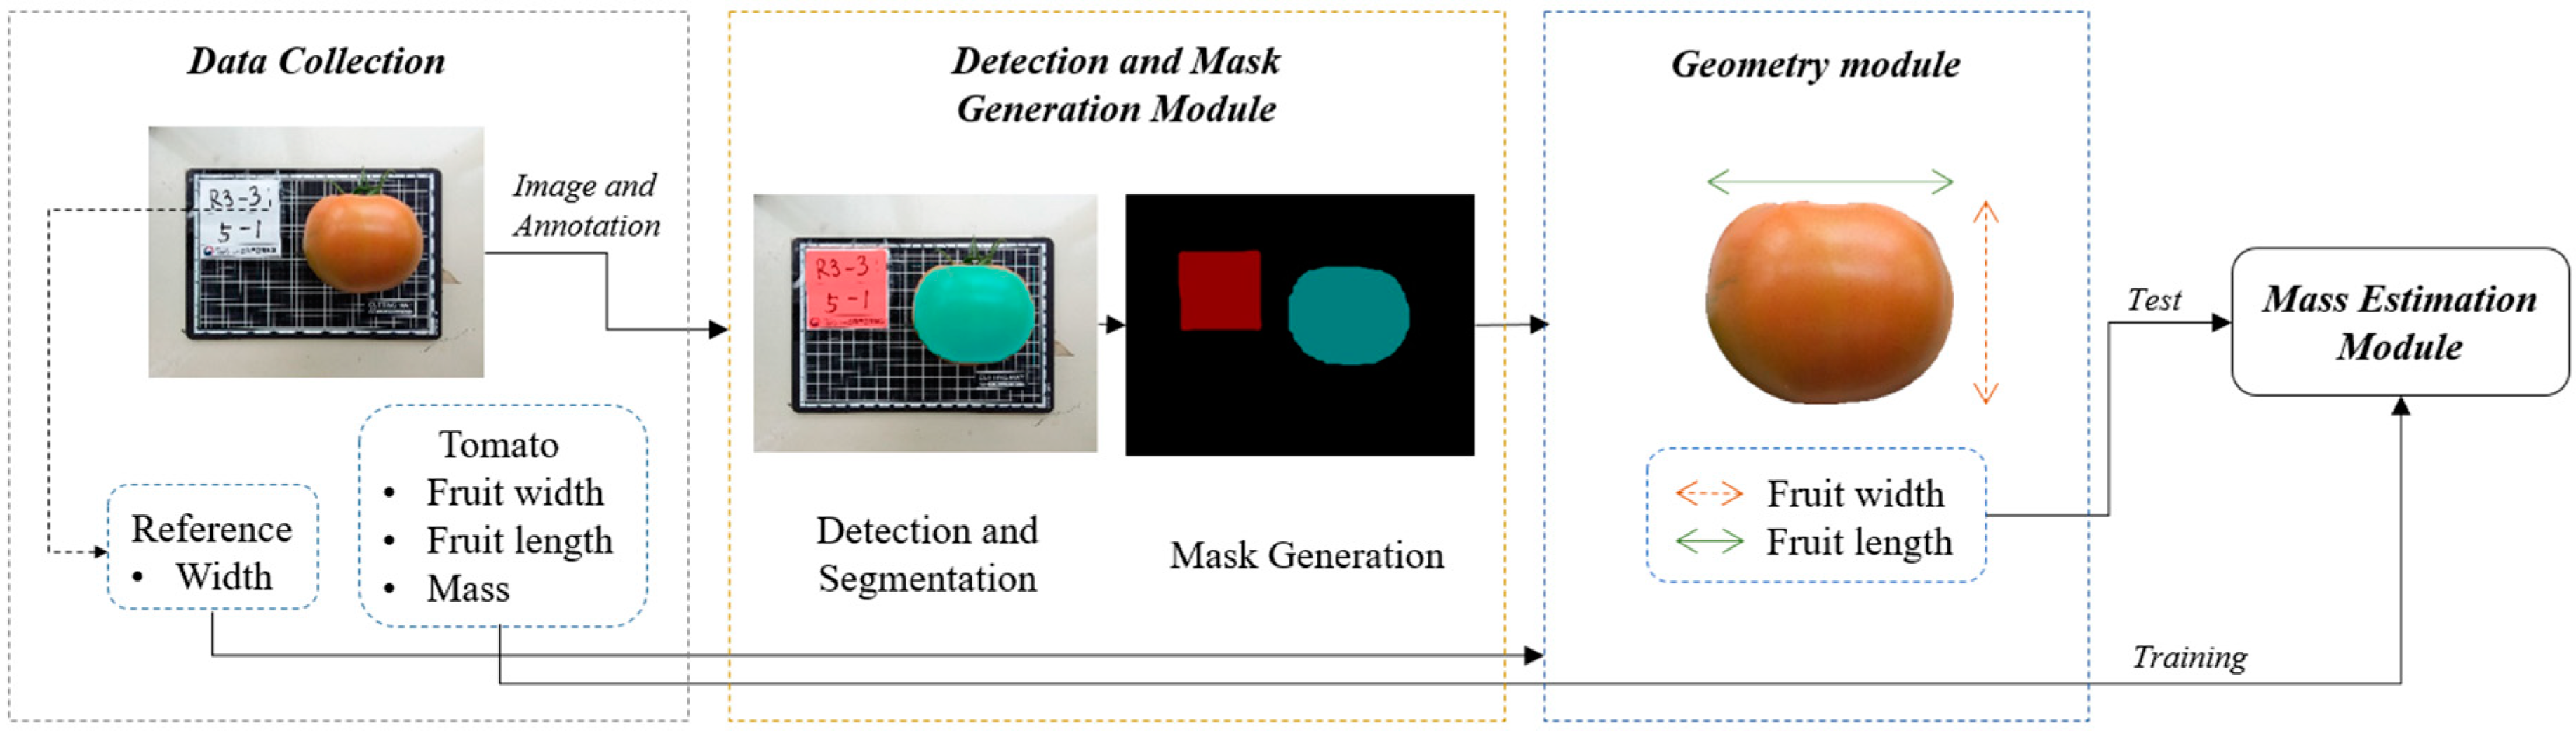
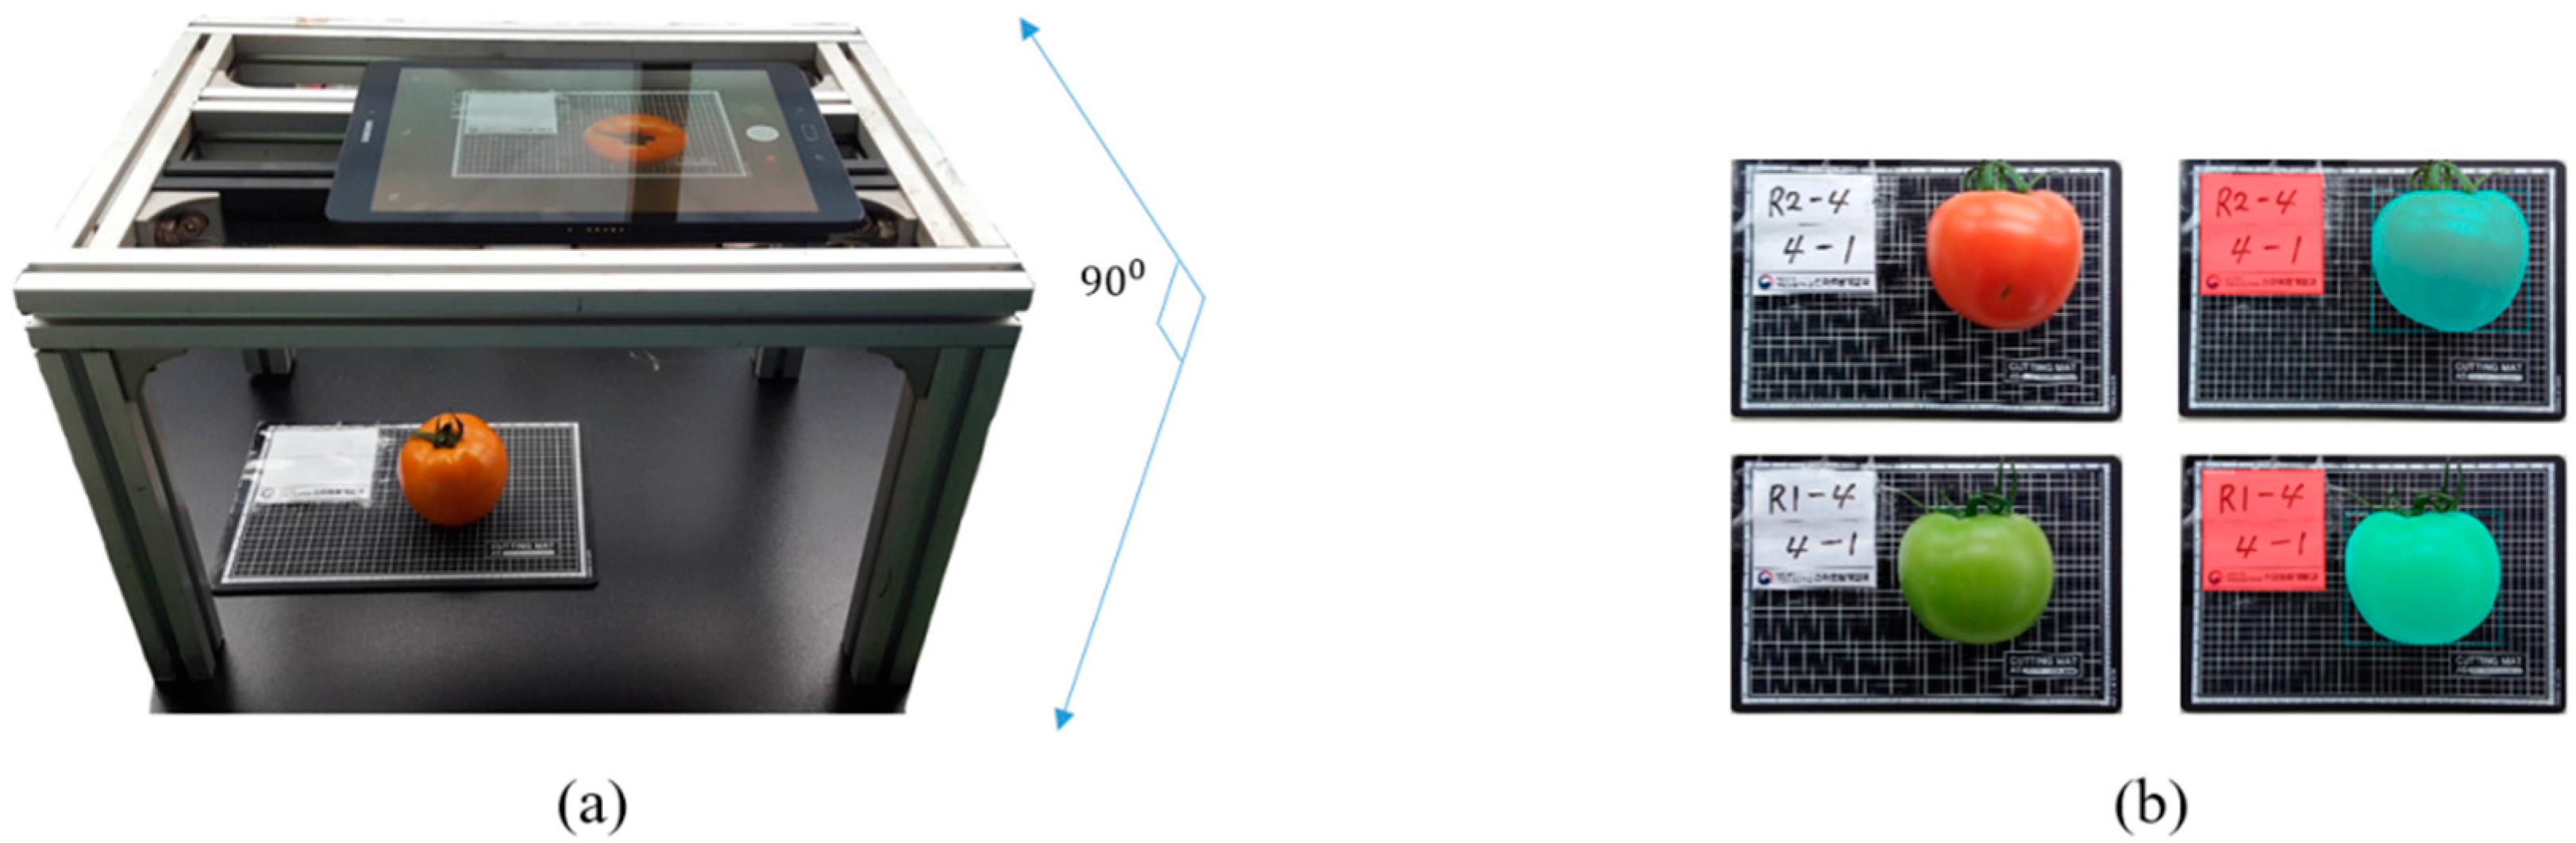
2.1. Data Collection and Annotation

We collected tomato image data with mass and dimension values in a smart greenhouse in Jeounju, Korea. A simple hand-held camera device was used to capture images. The camera was held perpendicular to the plane carrying the objects to be measured, including a known two-dimensional reference, such that all the objects appeared to be co-planar. Figure 2a shows the experimental setup for image acquisition. The images were captured under different circumstances depending on the stage (ripe and unripe), illumination, and fruit size of the time period when they were taken. The dimensions (fruit length and width) and the mass of tomato were precisely measured using an ABS digimatic caliper (Mitutoyo Corporation, Kawasaki, Japan) and T-4002 (Symaxkorea, Anyang, Korea), respectively. We collected a total of 651 images and physical data values (dimension and mass) for 2521 samples. The image data were further split into training (73%), validation (15%), and test sets (12%). Due to insufficient amount of total available samples, we chose this split to place the maximum possible samples in the training split which helps to slightly increase the variance in the training data, hence avoiding overfitting to some extent. For thorough evaluation, we used test set samples with known dimensions and mass values to further compare and evaluate against the predicted dimension and mass. For training and optimization of the detection and mask generation modules, we have provided the labeled training set annotated using the manual image annotation tool VGG image annotator [31]. Figure 2b shows a sample image from our dataset along with its annotation mask.

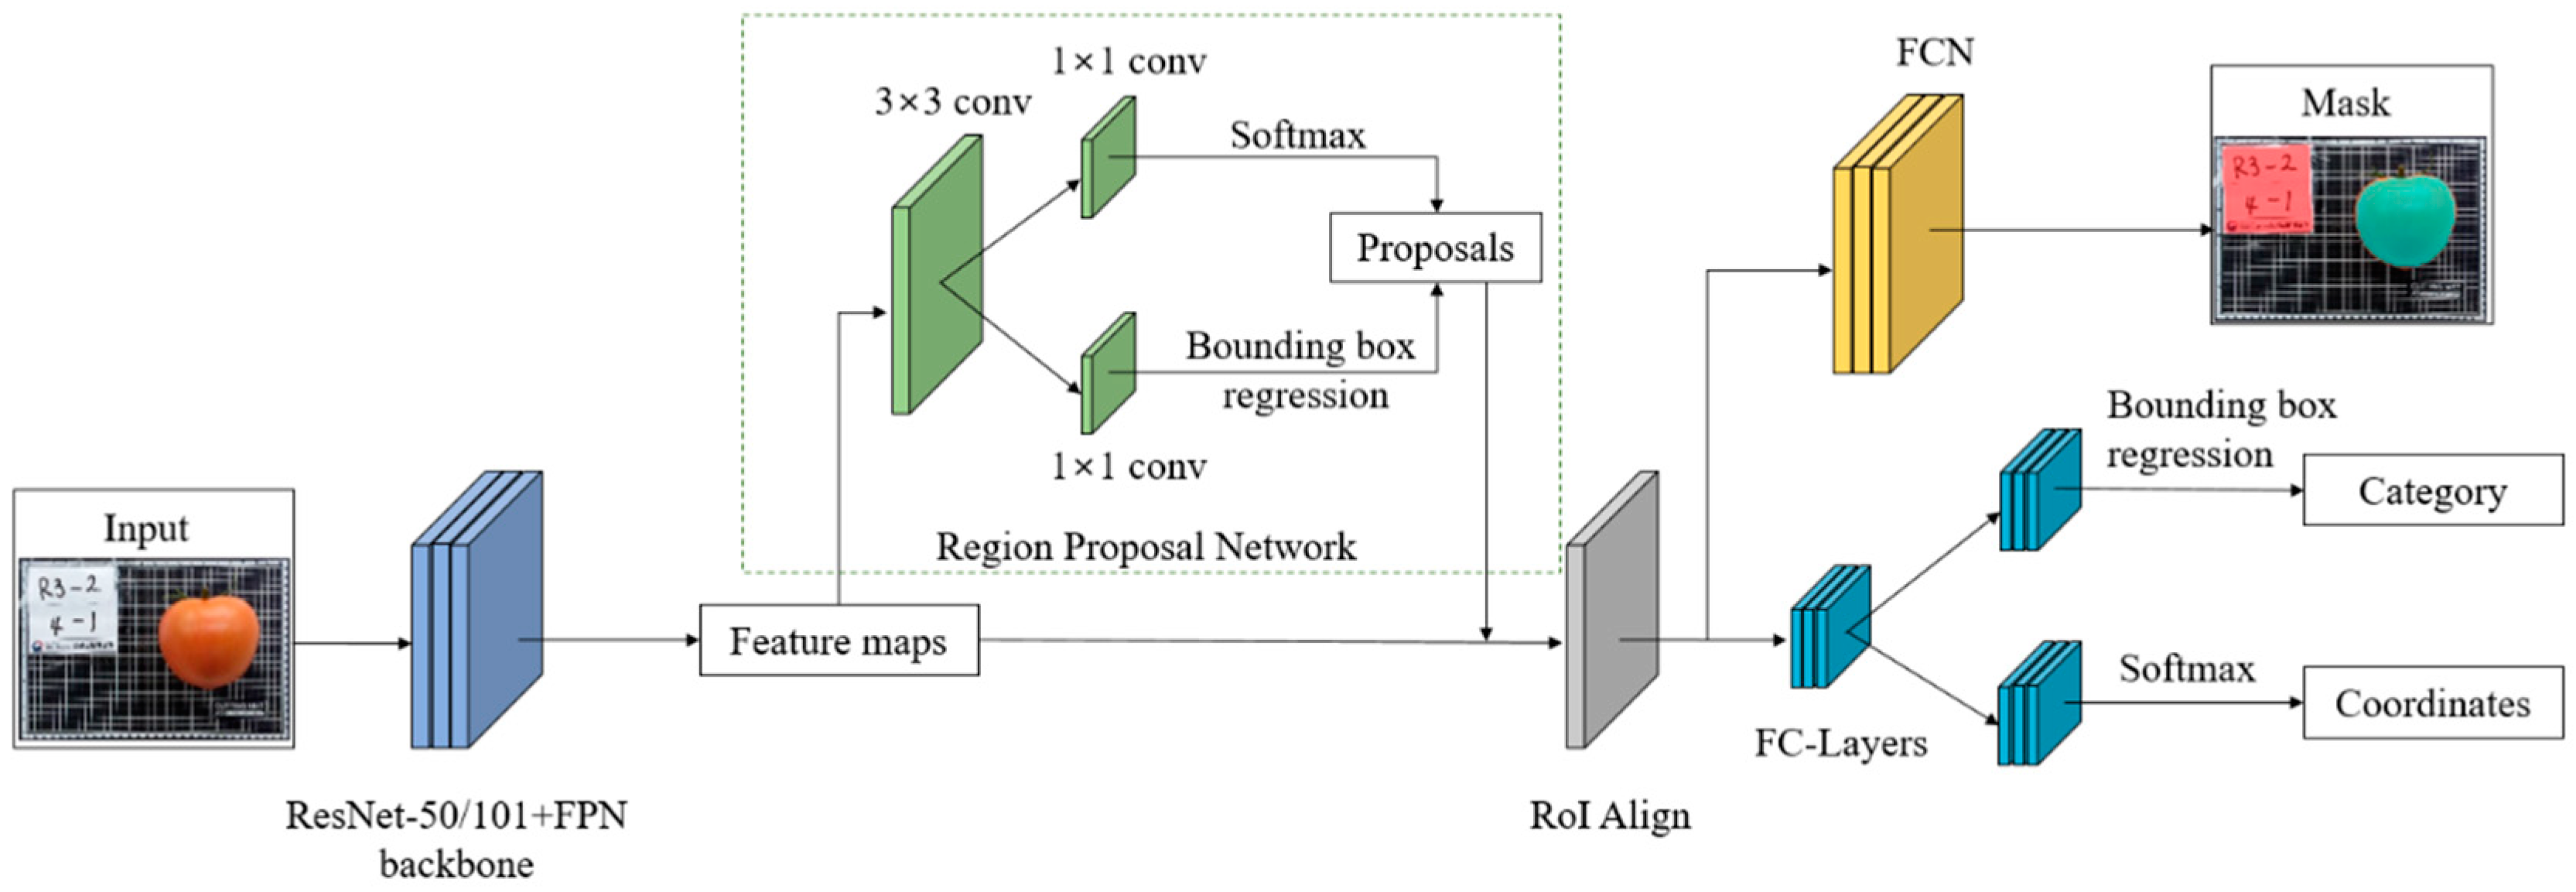
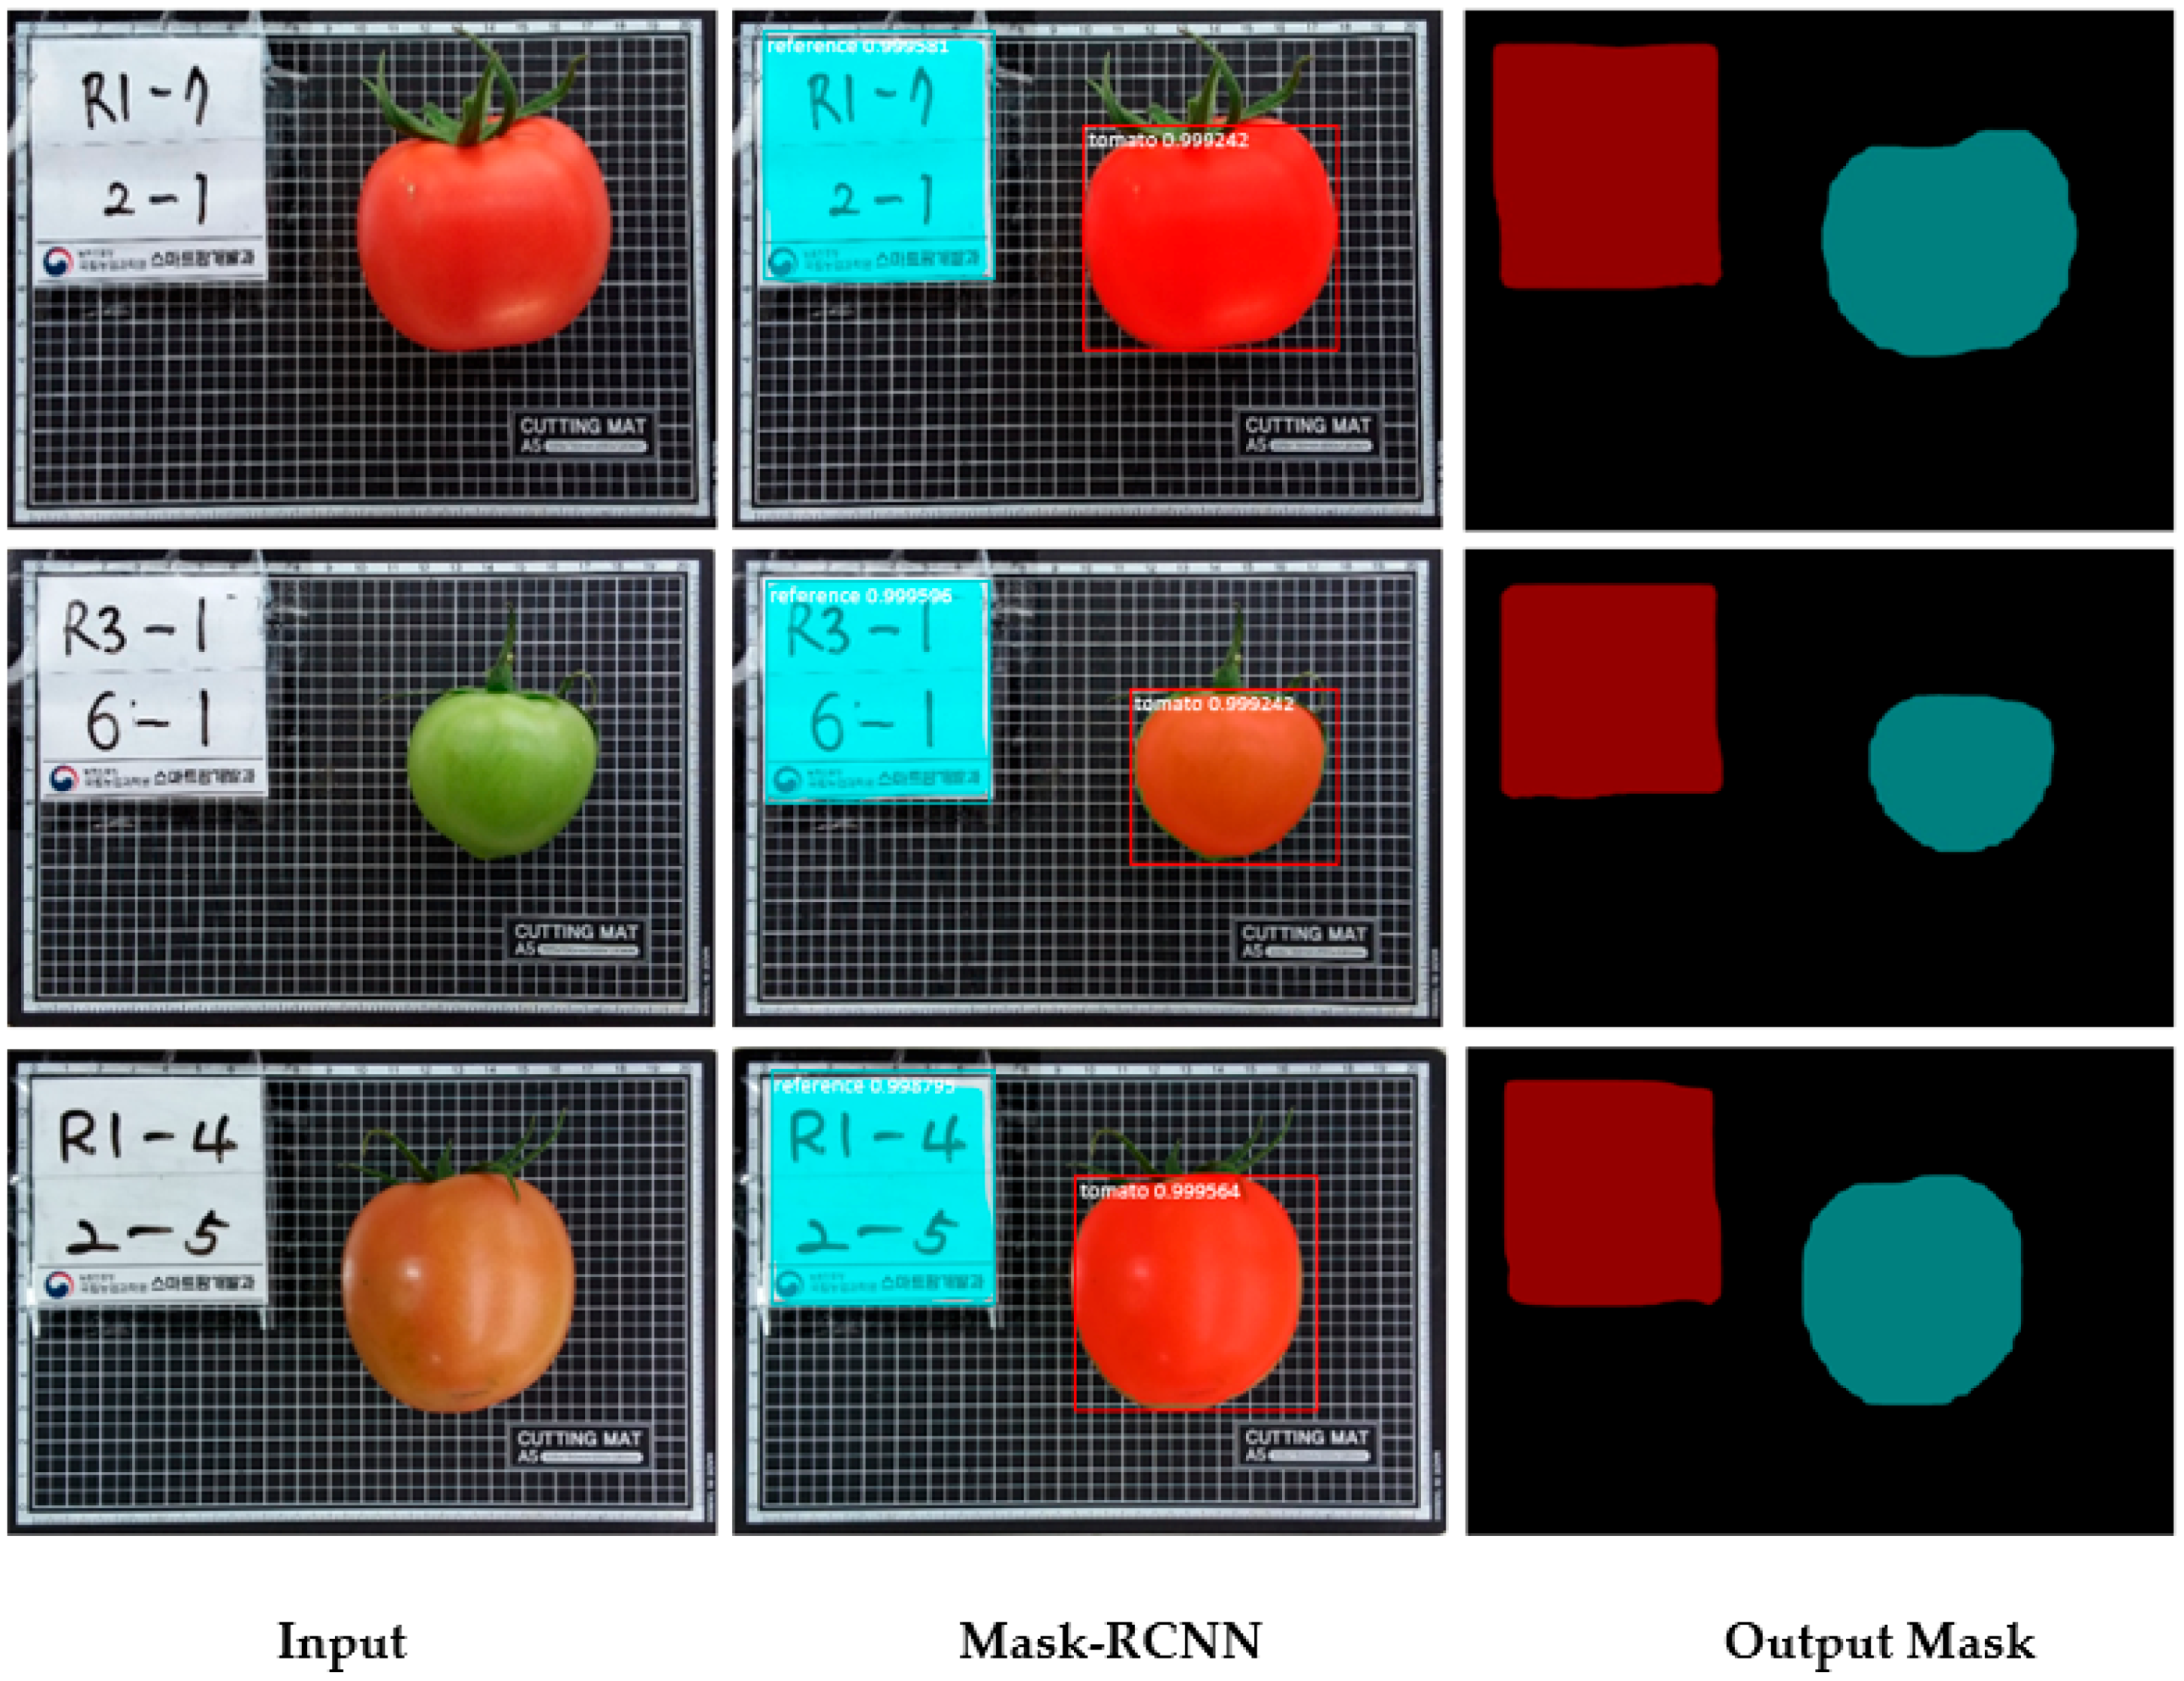
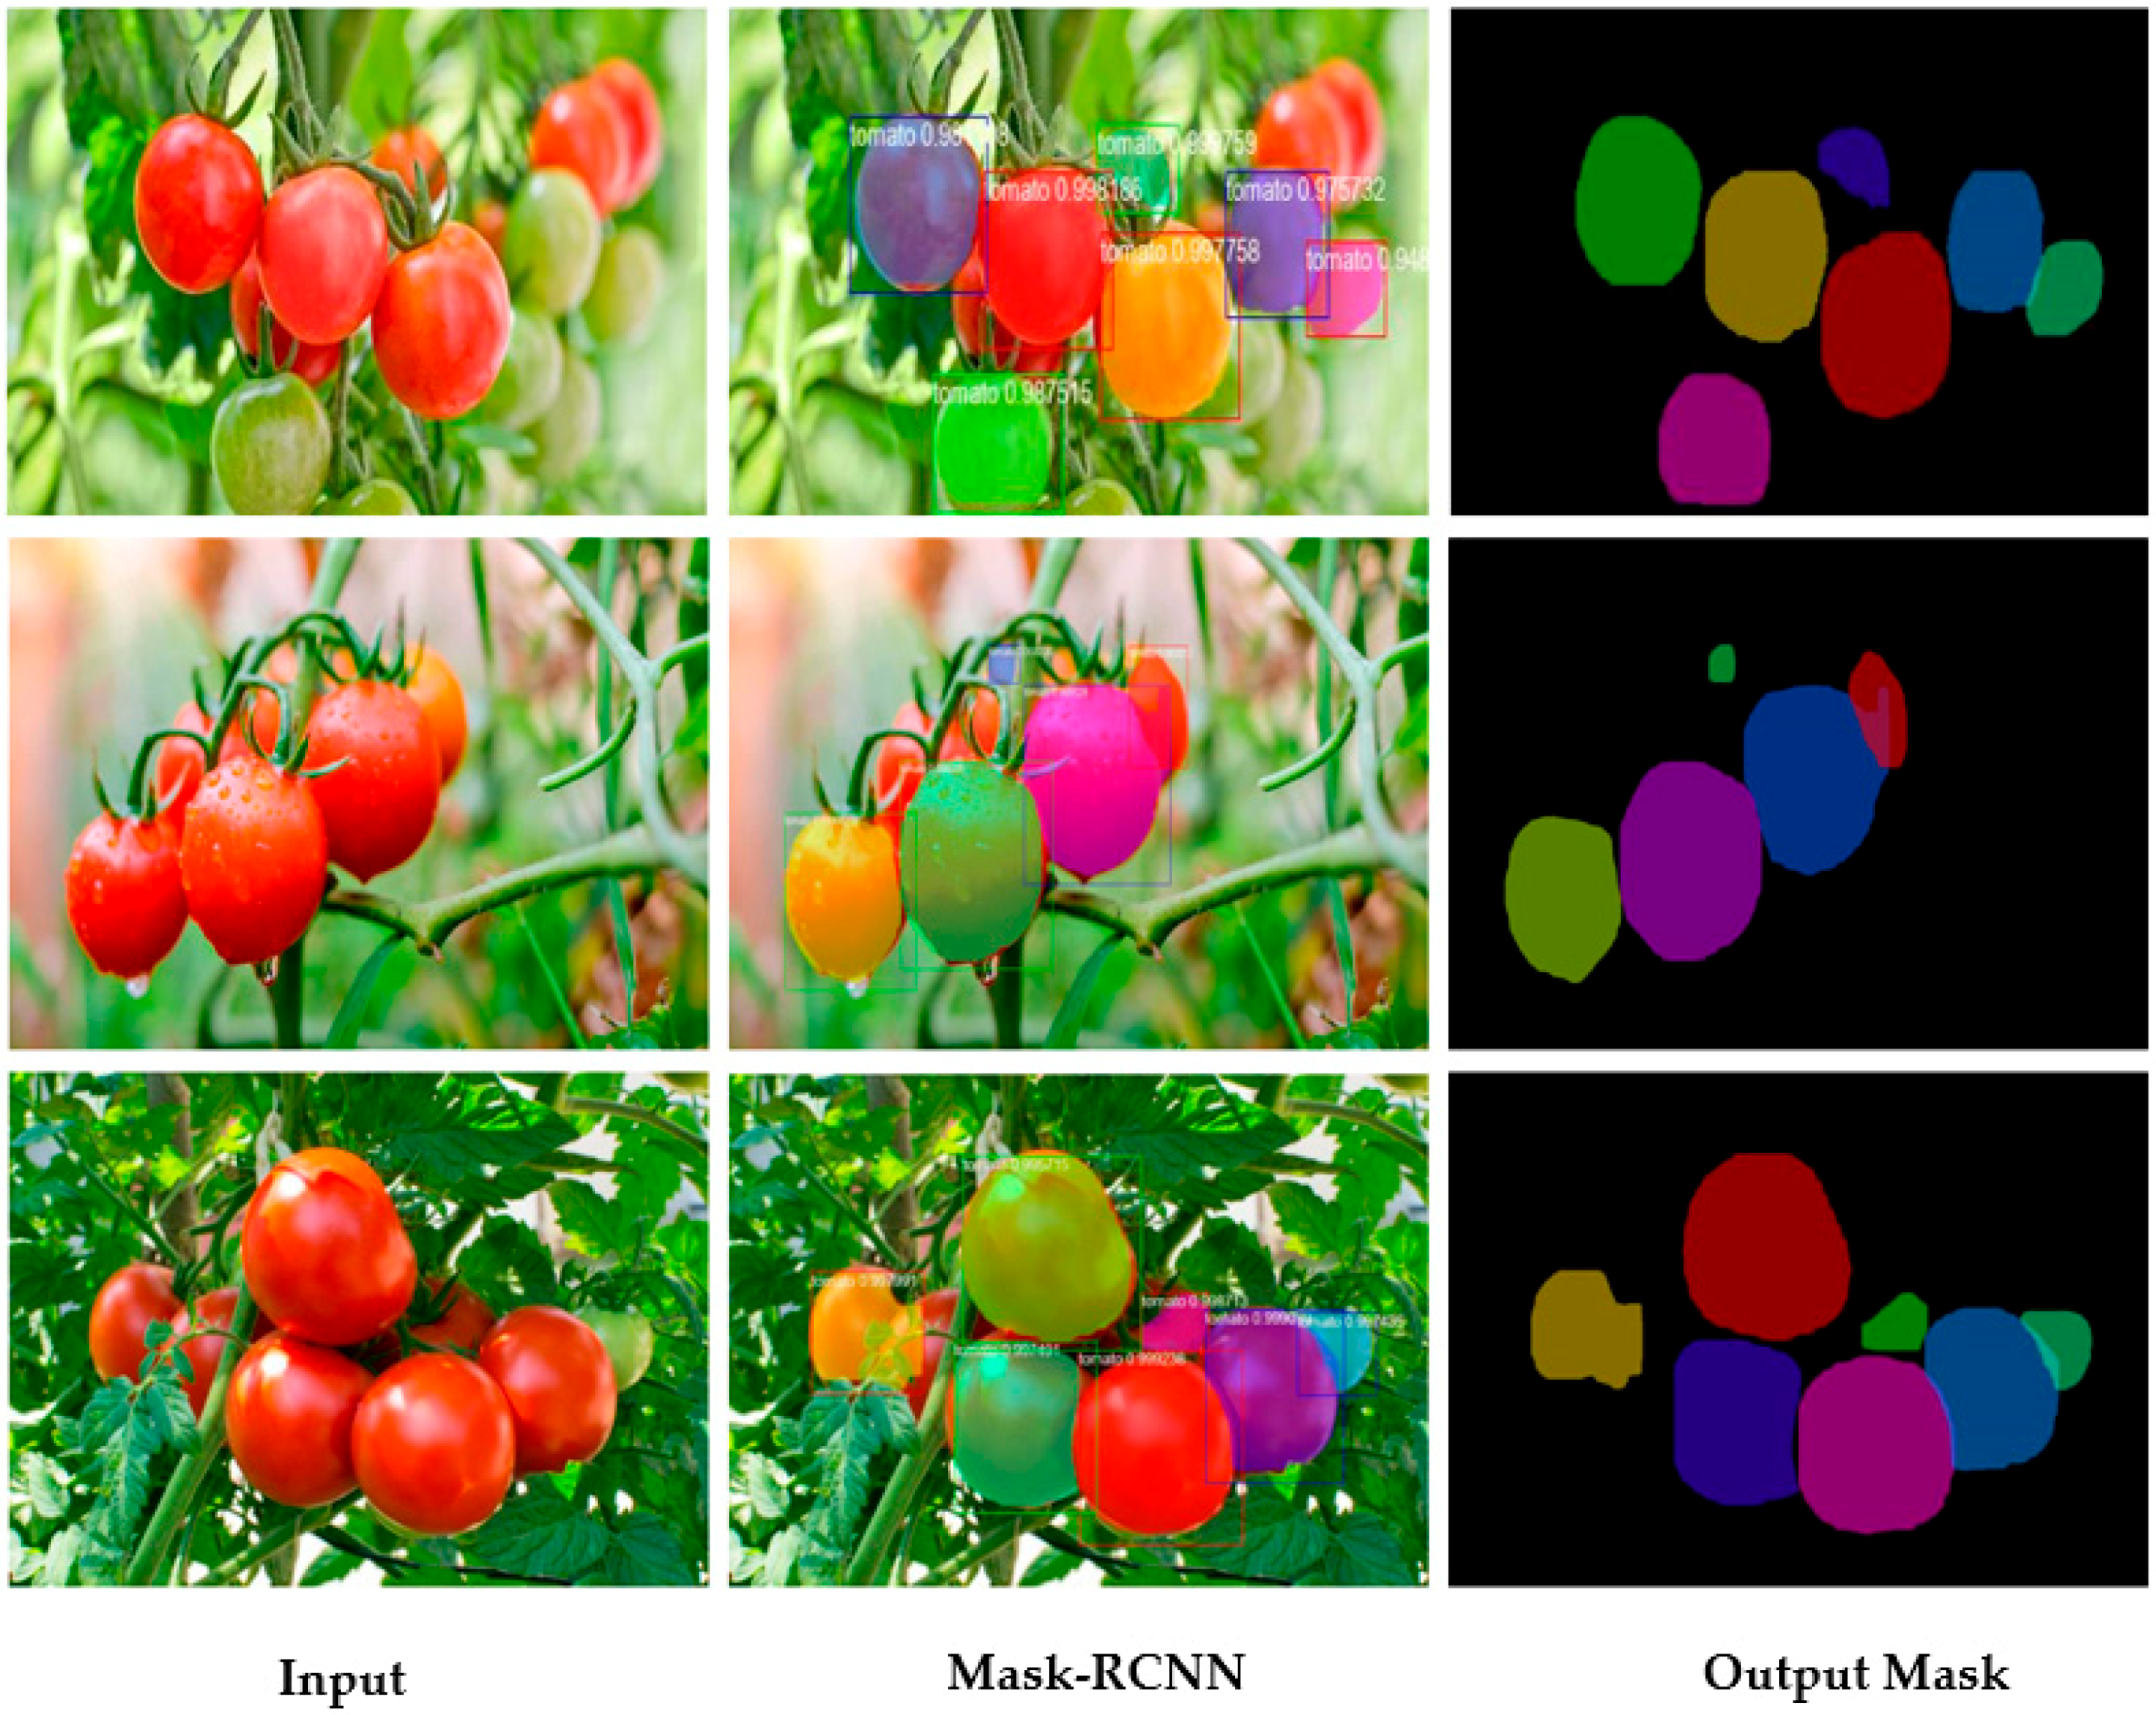
2.2. Detection and Mask Generation Module

This module aims to detect and generate instance-wise segmentation masks for tomato images. We used the state-of-the-art Mask-RCNN [25], which adds an extra branch for high-quality instance segmentation to its predecessor Faster-RCNN [32], for object detection. The instance segmentation task of each region of interest (RoI) runs parallel to the classification and bounding box regression pipeline. The mask branch includes a small fully convolutional network (FCN) [33] applied to each RoI, which can predict a binary segmentation mask for each class instance in a pixel-to-pixel manner. Figure 3 illustrates a complete framework for the Mask-RCNN with three stages: a feature extraction backbone network, a region proposal network (RPN) to generate anchors, and an FCN running parallel to fully connected networks that output instance-wise semantic masks and target detection with classification outputs.
In this study, we used ResNet101 [34] with a feature pyramid network (FPN) [35] as the convolutional feature extractor backbone, which provides excellent gains in both speed and accuracy. While ResNet101 extracts low-level features in shallow layers and high-level features in deep layers, FPN combines the semantically strong low-resolution features with semantically weak high-resolution features at all levels using lateral connections. The convolutional feature maps extracted from the backbone network are then used as input to the RPN. The anchors in the RPN span multiple pre-defined scales and aspect ratios to cover tomatoes of different shapes. The generated anchors were trained to perform classification using a Softmax loss function layer. A SmoothL1 loss [24], which is less sensitive to outliers, was used to calculate the loss between the proposed and predicted bounding box. Figure 4 shows example anchors generated using RPN. The positive anchors shown were examined by the classifier and the regressor during the training process.
The spatial structure of masks was extracted by pixel-to-pixel correspondence provided by convolutions, which requires these small extracted RoI feature maps to be well aligned so that spatial pixel-to-pixel correspondence is preserved. Mask-RCNN uses RoIAlign instead of RoIPool used in Faster-RCNN to remove any forced quantization that introduces misalignments between the extracted features and RoIs. This is followed by a multi-branch prediction network consisting of an FCN for the generation of a binary mask for each class instance, a fully connected layer for classification, and an L1 regression layer to predict accurate bounding boxes. The total training optimization loss can be summarized as follows:
L t o t a l =   L R P N + L m u l t i _ t a s k ,
where L R P N is the sum of the Softmax classification loss for the generated anchors and the SmoothL1 bounding box regression loss in the RPN, as shown in [24]. The L m u l t i _ t a s k loss function optimizes the classification, localization, and segmentation mask and can be represented as:
L m u l t i _ t a s k =   L c l s + L b b o x + L m a s k .
where, L c l s and L b b o x are the classification and localization loss functions, respectively, similar to Faster-RCNN, and L m a s k is the average binary cross-entropy loss for the nth mask with the region classified as ground truth class n. Thus, any competition between classes for mask generation can be avoided.
We used transfer learning to improve the generalization of our Mask-RCNN to our sparse tomato dataset. Transfer learning is used to extract the knowledge of a trained machine-learning model applied to a different but related problem. The main advantages of transfer learning are that we get a better performance of the neural network at reduced training time and lesser available training data. To train our detection and segmentation module, we used pre-trained Mask-RCNN weights on the Microsoft Common Objects in Context dataset [36] for transfer learning because of inadequate training samples and annotations. The framework for Mask-RCNN was implemented using the deep learning libraries—Tensorflow and Keras. We used stochastic gradient descent with an initial learning rate of 0.001 and momentum of 0.9. The mini-batch size was set to 1 image on an NVIDIA V100 graphics processing unit with 64 GB of memory, which took an hour to train for 47K iteration.

2.3. Geometry Module

In this module, we extracted the dimensions of the tomato fruit from the image using a reference object with known dimensions [27]. We also extracted the edge contours of all objects in the generated mask from the detection and mask generation modules and defined a minimum bounding rectangle for each object contour. Furthermore, we determined the pixel-per-metric ratio, which is a measure of the number of pixels per given metric observed from the reference object with actual dimensions, and obtained the real-world dimensions for these minimum bounding rectangles. These dimensions represent the actual length and width of the tomato instances, which are further fed into the final mass estimation module. We found that this method is fast and accurate, irrespective of the shape and number of tomato instances.

2.4. Mass Estimation Module

The characterization results of our data show a high correlation between the dimensions and mass of the tomato samples. This correlation is depicted in Figure 5 with the Pearson correlation coefficient r used to illustrate the strength and direction of this linear relationship. We used various regression models in our mass estimation module to identify this complex physical relationship and predict the mass of a tomato fruit given its dimensions. This module was trained separately before the detection and mass estimation module using the mass and dimensional features collected. The final mass predictions were only based on the dimensions extracted from the geometry module.
For our mass estimation regression model, we performed experiments using both parametric as well as non-parametric machine-learning algorithms like support vector regression [29,36], bagged ensemble trees [37], Gaussian process regression (GPR) [38,39,40], and regression neural networks [41]. In non-parametric support vector regression, a prediction model is constructed in a similar manner to that for Support Vector Machines (SVMs), except that SVR minimizes the regression error instead of the classification error using kernel functions. SVR is a useful and flexible model, which helps the user to tackle the limitations involving the distributional properties of underlying variables, the geometry of the data, and the most common problem of model overfitting. In particular, we found that using quadratic and Gaussian radial basis kernel (RBF) functions for our dataset provided the best results. Ensemble tree is another non-parametric machine-learning algorithm that combines several base decision tree models also sometimes known as weak learners to produce an optimal predictive model or a strong learner without overfitting the data. The goal is to reduce the variance of the model by randomly creating several subsets of data in the training set. In our experiments, we obtained optimal results using a bagged tree with 30 learners and a minimum leaf size of 8.
GPR models are a non-parametric Bayesian approach to the regression problem. They are known to capture various relations between inputs and outputs by exploiting an infinite number of parameters and allowing the data to determine the level of complexity through Bayesian inference. Based on the evaluation of various error measures, we obtained better performance using an exponential function kernel in a GPR model for our dataset. Most of the models discussed above were implemented and compared using the Statistics and Machine-learning Toolbox in MATLAB R2019a. We also implemented a regression artificial neural network (ANN) which is a parametric machine- learning method and optimized its parameters such as the number of hidden layers and neurons per layer using a genetic algorithm [42,43]. Usually, selecting an ANN architecture i.e., the number of hidden layers and the number of neurons in the hidden layers, is based on a hit and trial method which can be time-consuming and a tedious process. To address this issue, genetic algorithm is used to automatically devise an optimal architecture of the ANN with improved generalization ability. Genetic algorithm is capable of searching for the overall optimum in the complex, multimodal and non-differentiable search space to determine the optimal ANN architecture. For the neural network, the number of hidden layers ranged from 1 to 4, and the number of neurons per layer is 64n, where n ranges from 1 to 6. The network uses ReLU activations with the Adam optimizer. The number of generations was set to 10, with 20 networks in each generation.

3. Results and Discussion

In this section, we present a discussion of the qualitative and quantitative evaluation results for each module of our proposed system. First, we evaluated Mask-RCNN for detection and segmentation of our test data and some random samples collected from the tomato farm. Furthermore, using the same test data instances, we evaluated the geometry and mass estimation modules using regression and error analysis, respectively. It must be noted that during the whole evaluation process, no attempt was made to remove any outliers from the training or test dataset using any preprocessing technique.

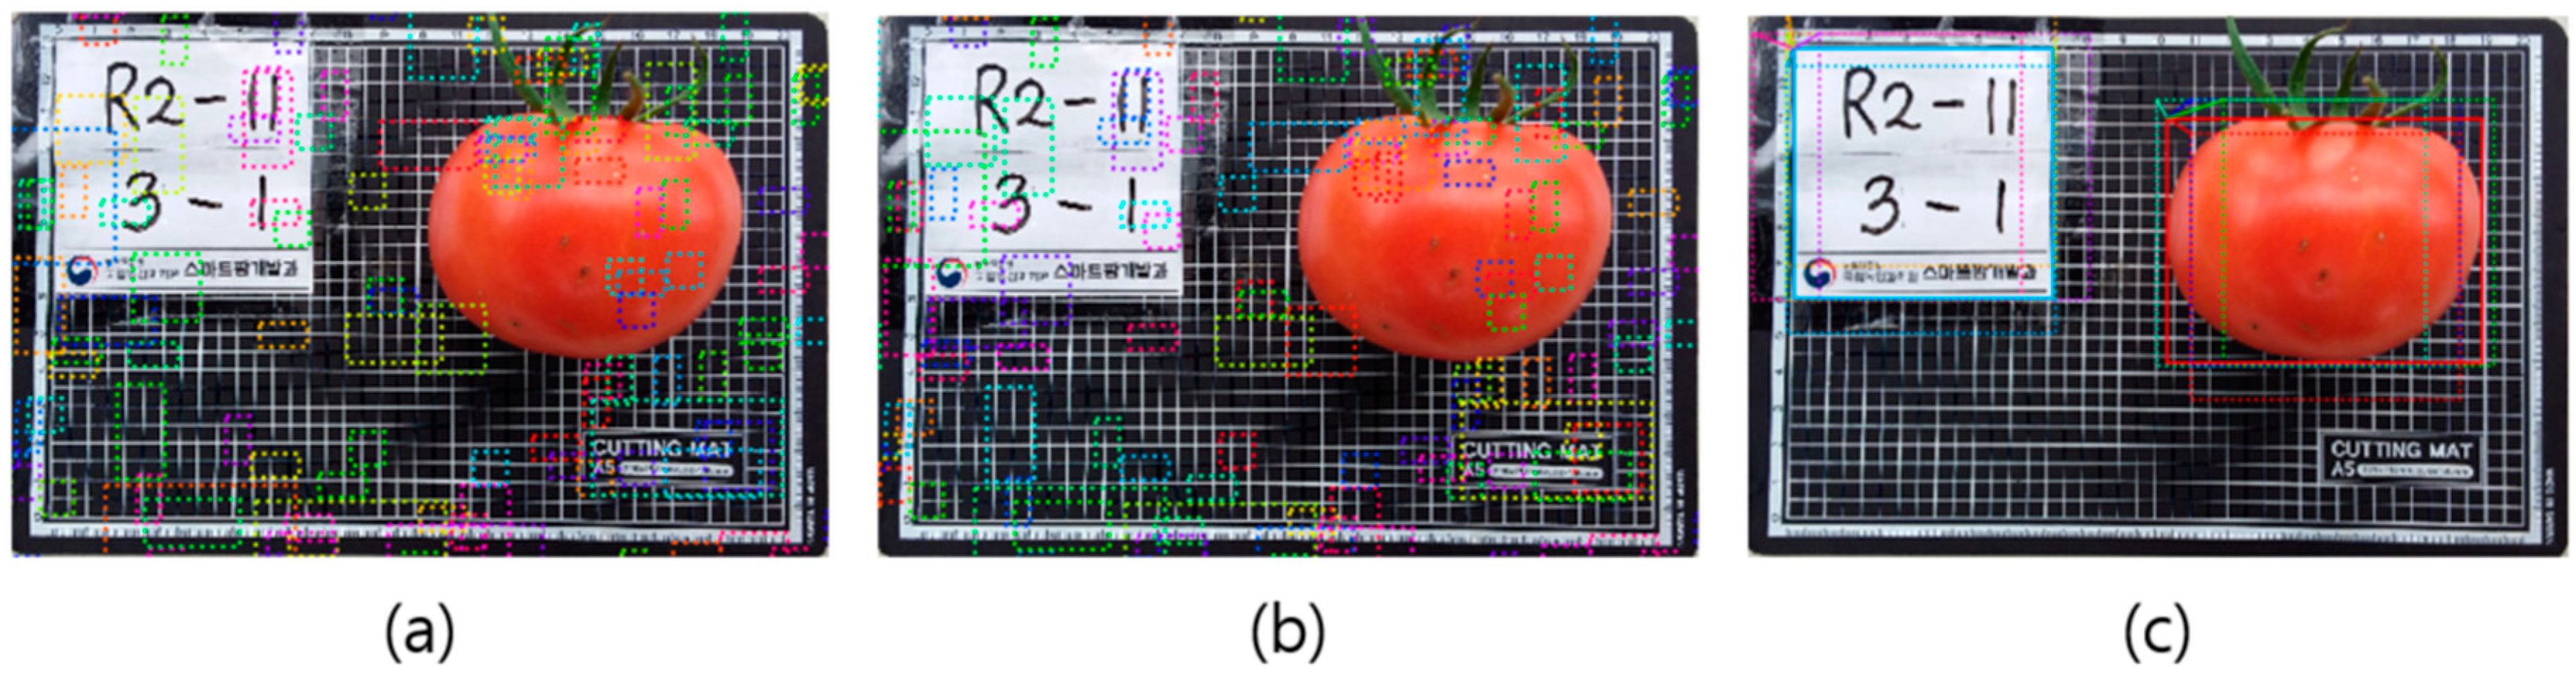
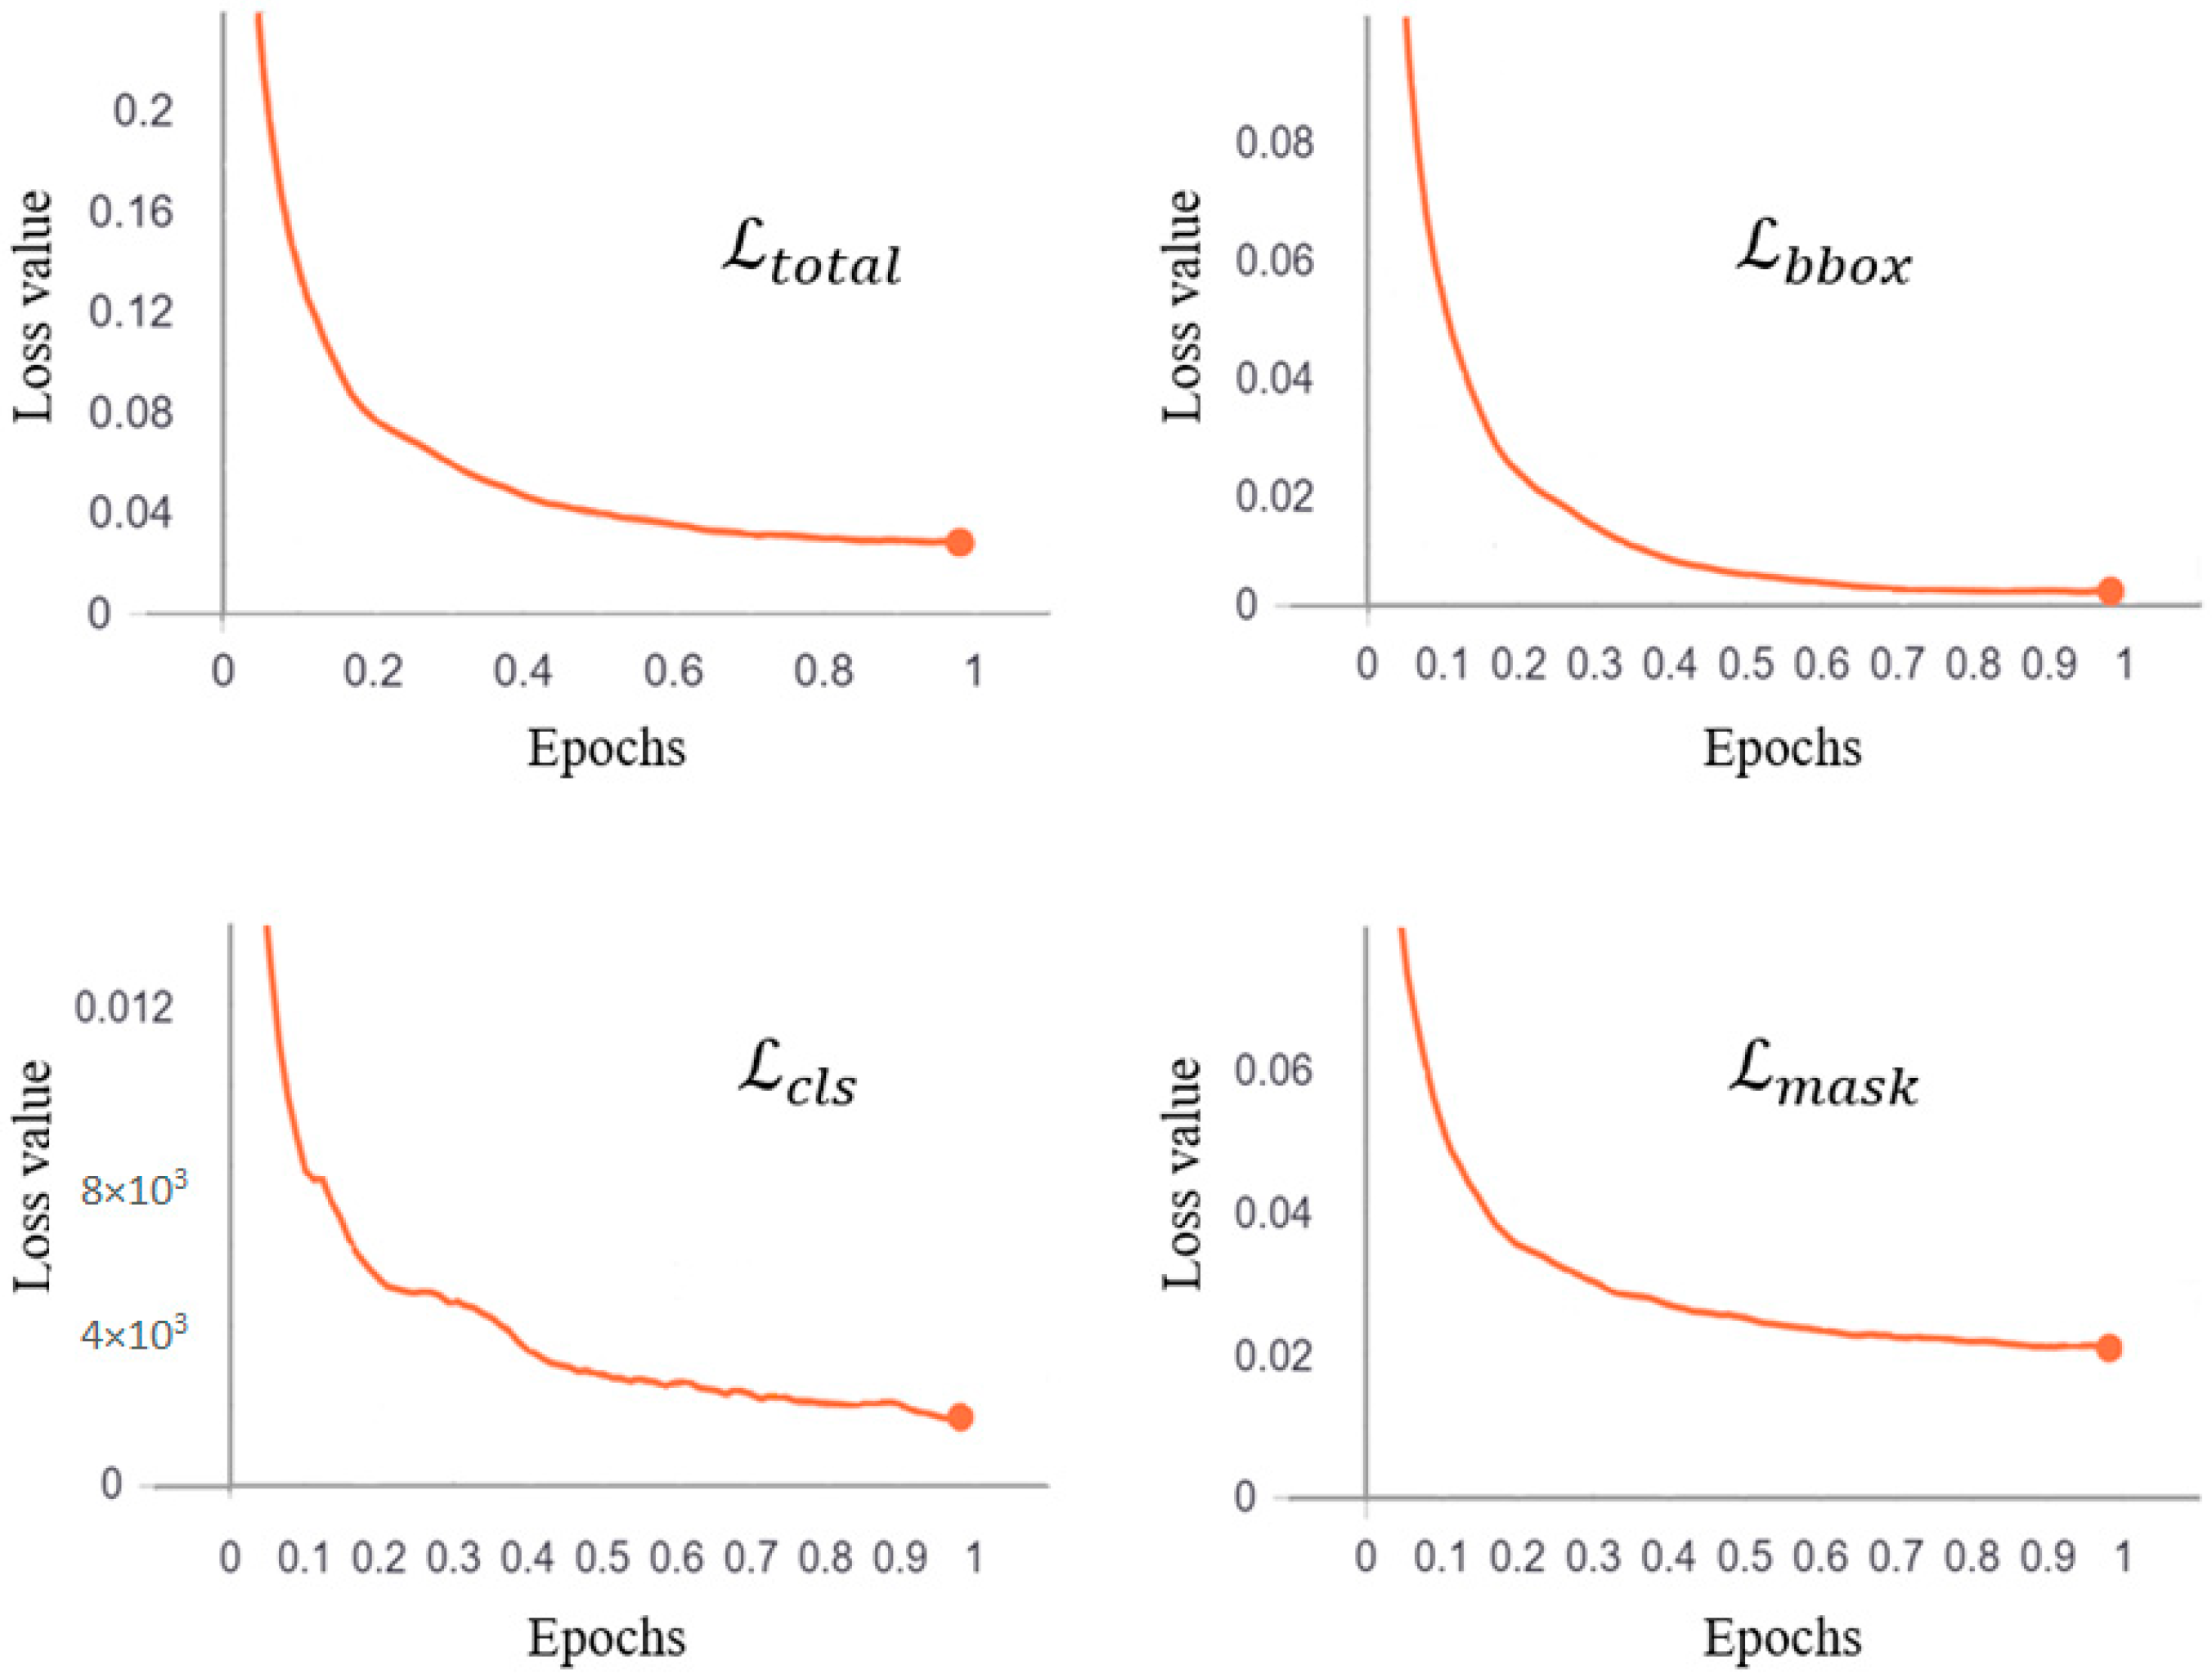
3.1. Evaluation of the Detection and Segmentation Module

Figure 6 shows the convergence of various loss functions mentioned in Section 2.2. In our experiments, we used the validation data to identify a training time sufficient for the model to reach the state of convergence on our dataset without overfitting. Figure 7 shows the detection and instance segmentation results for our test data samples. We also show the detection and segmentation results for random samples collected from a tomato field, as shown in Figure 8. As can be observed from these figures, Mask-RCNN shows good results even under challenging conditions without exhibiting any systematic artifacts under a single instance or multi-instance output setting. The output masks show that the segmentation of the tomato fruit agrees well with the ground truth even around the edges; however, a slight delineation around the edges of our reference can be noted. This problem can be avoided by using a suitable fixed reference in addition to providing more annotated data samples.
In this study, we used the standard COCO mean average precision (mAP) metric at a mask intersection over union (IoU) threshold of 0.5–0.95 with a step size of 0.05 to quantitatively report the performance of Mask-RCNN on our test samples. During our experiments, we found that the model using the ResNet-101 backbone performed the best, and an average mask IoU of 96.05% and mAP of 92.28% were obtained with a detection accuracy and precision of 99.02% and 99.7%, respectively. In Table 1, we report the ablations using our test data to compare the ResNet backbones for Mask-RCNN. In our case, higher mask IoU and mAP are crucial for effective dimension extraction in the geometry module. Therefore, the slightest error in the generated semantic mask would accumulate with the error in the geometry module and would result in significant mass estimation error.
Compared with the previous approaches mentioned in Section 2.2, the performance of Mask-RCNN for detection is comparable to its counterparts, even in the presence of multiple machine-vision challenges, such as illumination, occlusion, and the presence of multiple fruit instances in an unstructured scene. Moreover, several of these approaches detect tomato instances with common features in their ripe or unripe state. However, as can be observed from Figure 8, Mask-RCNN improvises by detecting multiple instances occurring at variable states in an unstructured environment. This improved performance is further supported by an additional characteristic of Mask-RCCN, where it can semantically segment all instances of multiple classes. Traditional methods fail to segment such multiple adherent tomato fruits by erroneously picturing them as a single collective target, making it difficult to segment each instance as its respective class. Moreover, since the Mask-RCNN was not trained on such images of clustered tomato samples, this evaluates the fact that it did not overfit to the training data. It can thus be inferred that using Mask-RCNN for detection and mask generation helps overcome problems such as robustness and generalization toward complex scenarios associated with traditional artificial intelligence algorithms for tomato fruit detection and segmentation.

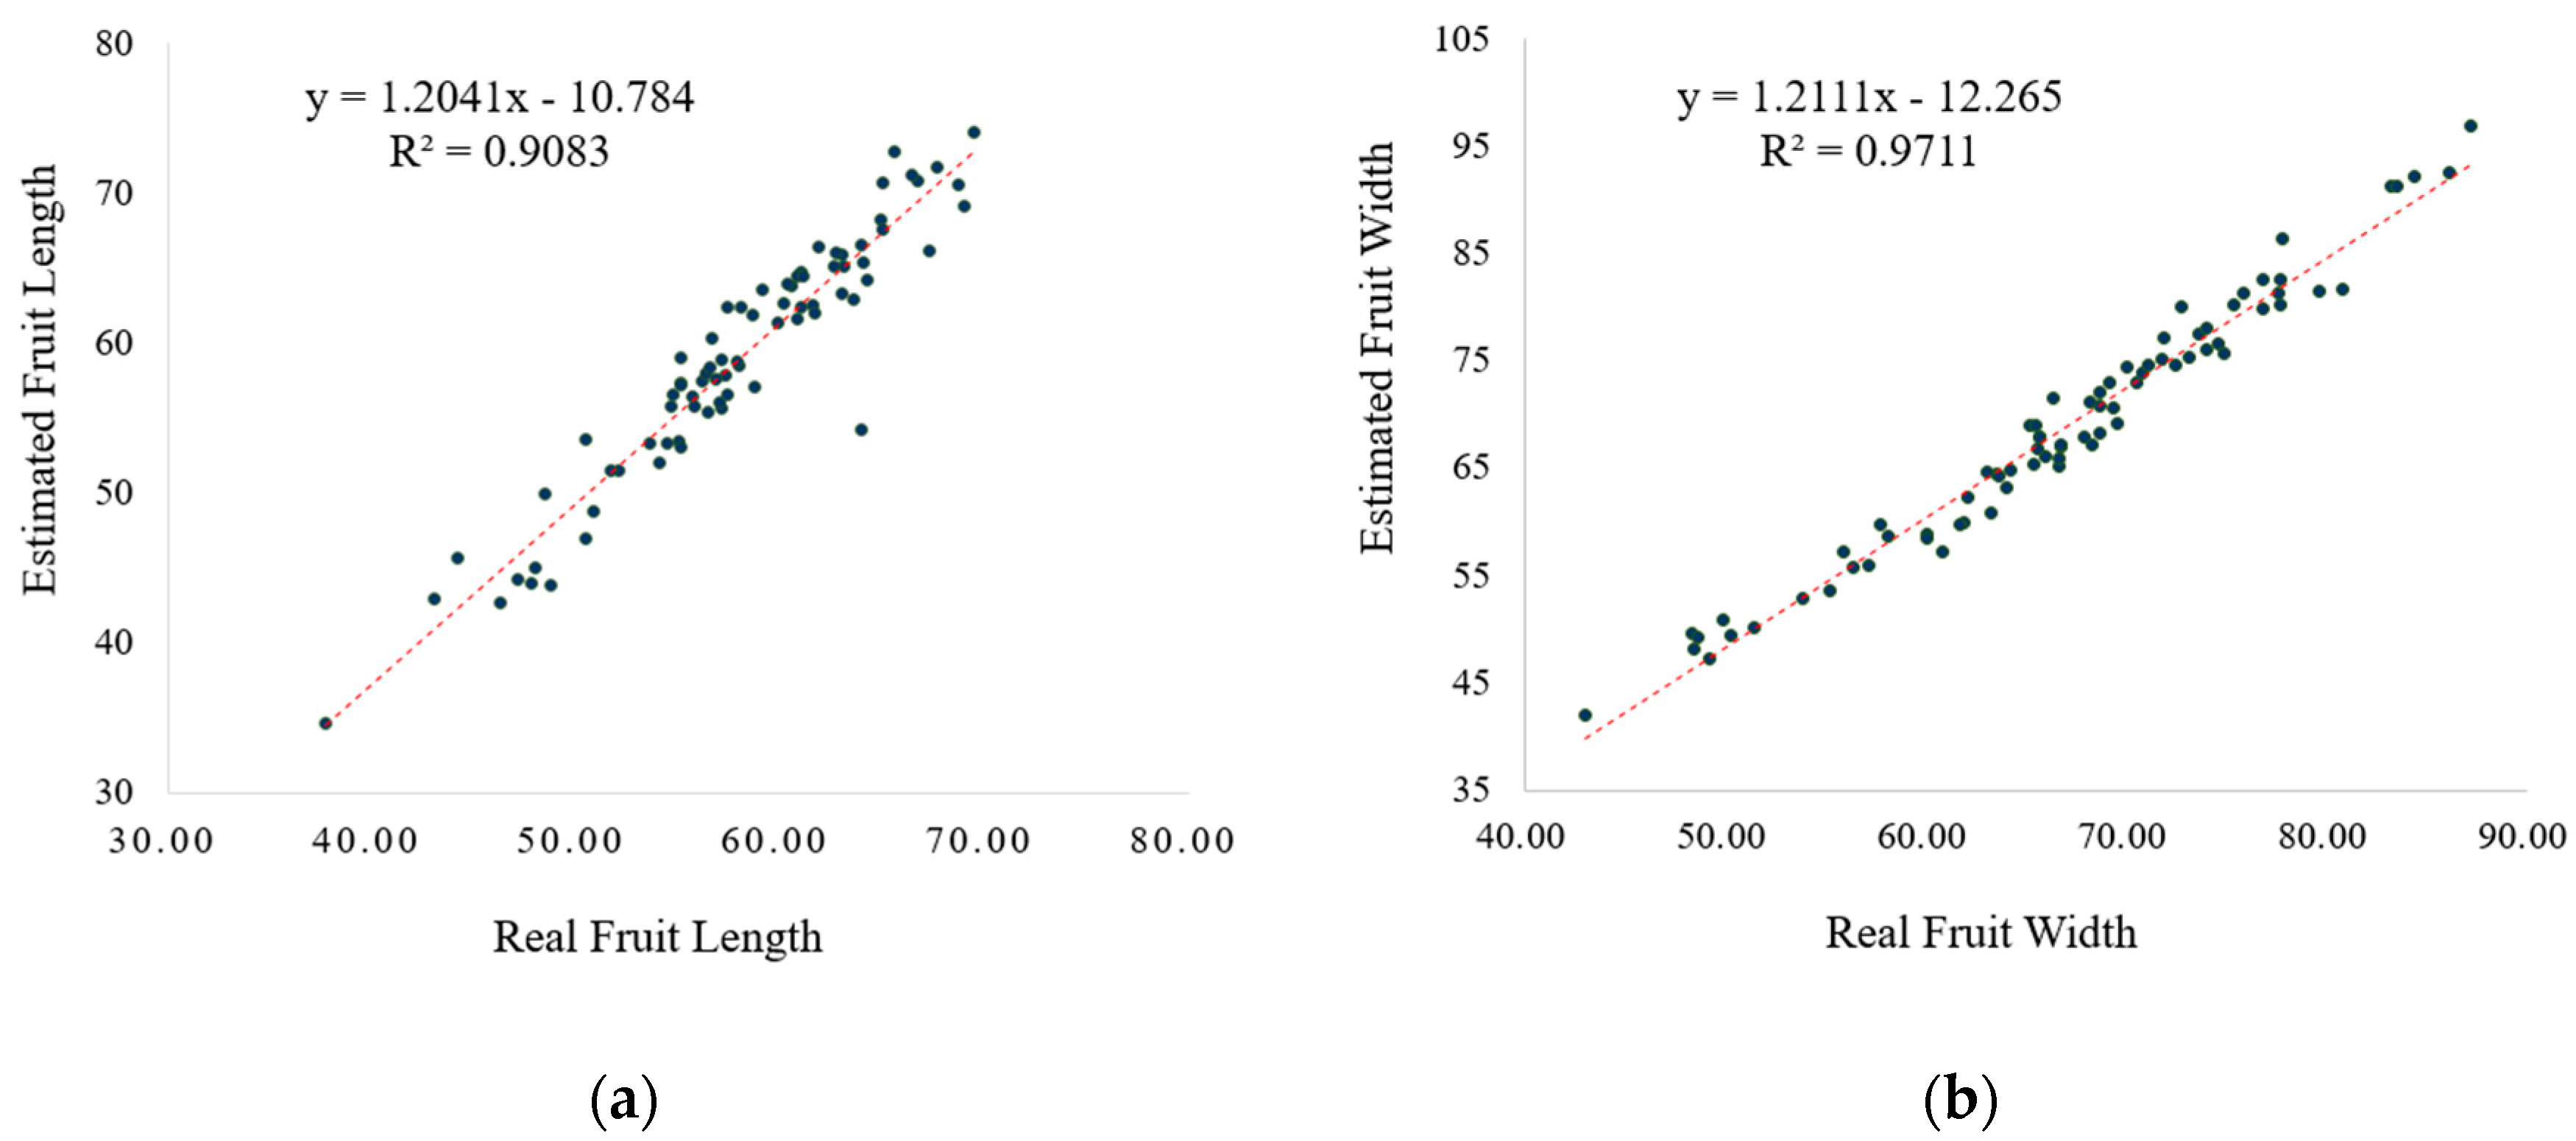
3.2. Evaluation of the Geometry Module

Even though Mask-RCNN effectively detects occluded tomato fruits, fruit dimensions can only be extracted when the entire object is visible. We used regression analysis to evaluate the results for the extracted dimensions of the tomato fruit from the output segmentation mask in the geometry module. The estimated outcome showed excellent correlation, displaying a strong relationship between the measured and calculated dimensions for our test dataset. This correlation is characterized by R2 = 0.90 for fruit width estimation and R2 = 0.97 for fruit length estimation (Figure 9).
Various statistical indicators that can estimate errors were also used to evaluate the relationship between the estimated and real fruit dimensions in millimeter (mm) units. In particular, we reported the mean absolute error (MAE), mean squared error (MSE), root mean squared error (RMSE) [44], and mean absolute percentage error (MAPE) [45] for our results. Table 2 shows the error analysis results for the tomato dimension estimation using our test data samples.
The error in the estimated fruit dimensions was caused by segmentation error; more specifically, it was caused by the segmentation error of the reference object. The absence of depth information introduces an additional error when estimating the three-dimensional fruit size and comparing it with a flat reference object in a two-dimensional space. However, we find that an RMSE of 2.9 mm and 3.4 mm for fruit width and fruit length, respectively, is sufficient to estimate fruit dimensions from a single RGB image. The MAE and the RMSE can be used together to identify the variation in the errors in a set of estimations. The RMSE is always larger or equal to the MAE; the greater difference between the RMSE and MAE, the greater is the variance in the individual errors in the sample. The MSE criterion is a tradeoff between bias and variance. The smaller the MSE, the closer we are to finding the line of best fit. As explained earlier in this paragraph, due to accumulation of various errors during the segmentation phase, the MSE error found in Table 2 is as good as it could get. Similarly, MAPE is another statistical measure that calculates the accuracy of a prediction system. The higher value of MAPE in Table 2 corresponds to the fact that MAPE gives the best insight of the outcome if there are no extremes or outliers in the data. Moreover, these figures can be further improved by introducing more annotated data for the reference object while training Mask-RCNN or by alternatively calibrating using a fixed reference in the image acquisition system (e.g., camera), which would avoid the loss of object depth information when using a single RGB image at the time of data collection. This essentially requires anchors with known physical dimensions in a camera to be used as reference instead of the objects in addition to other adjustments required for camera calibration.

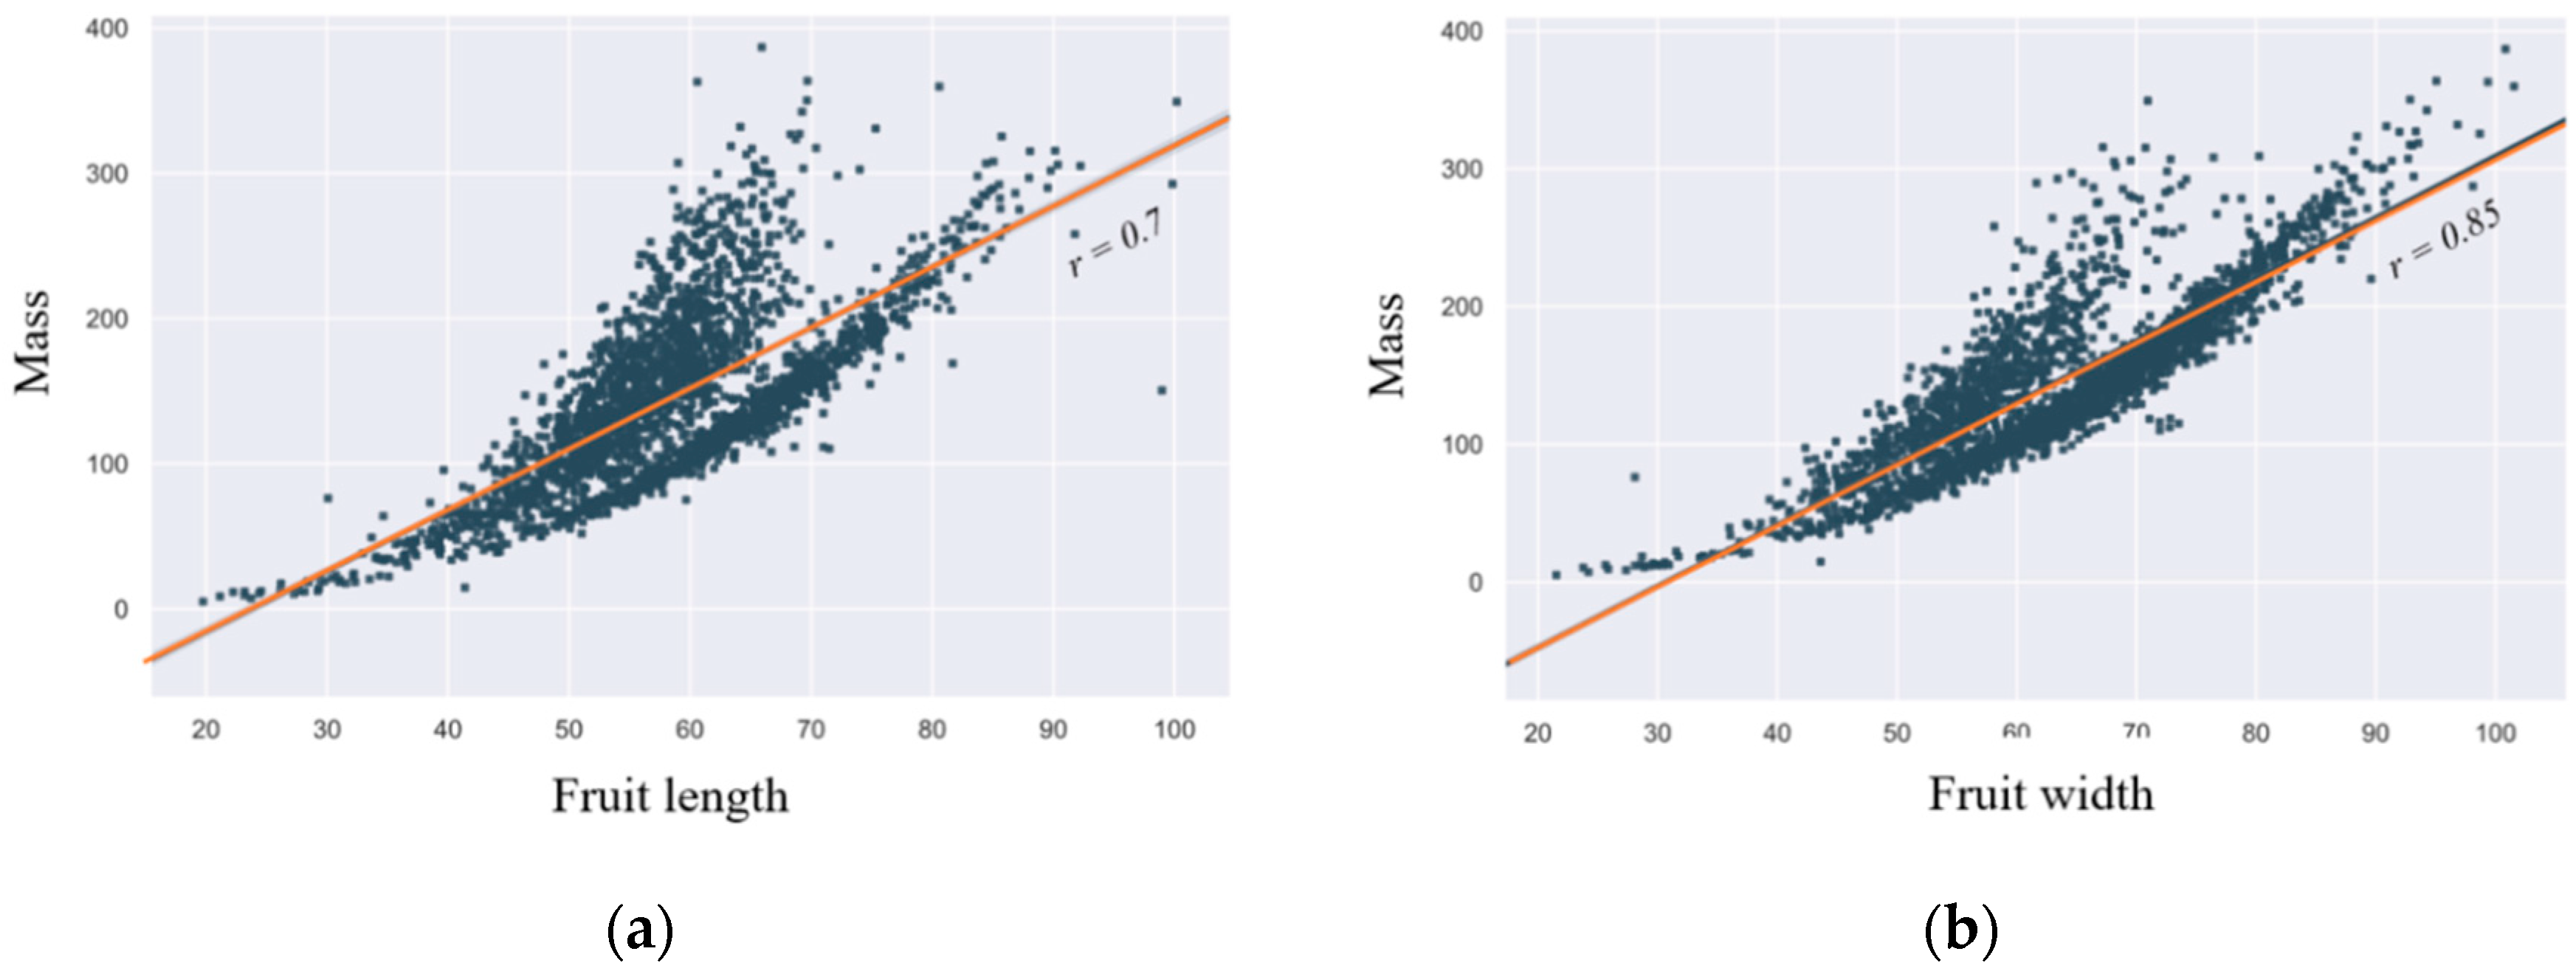
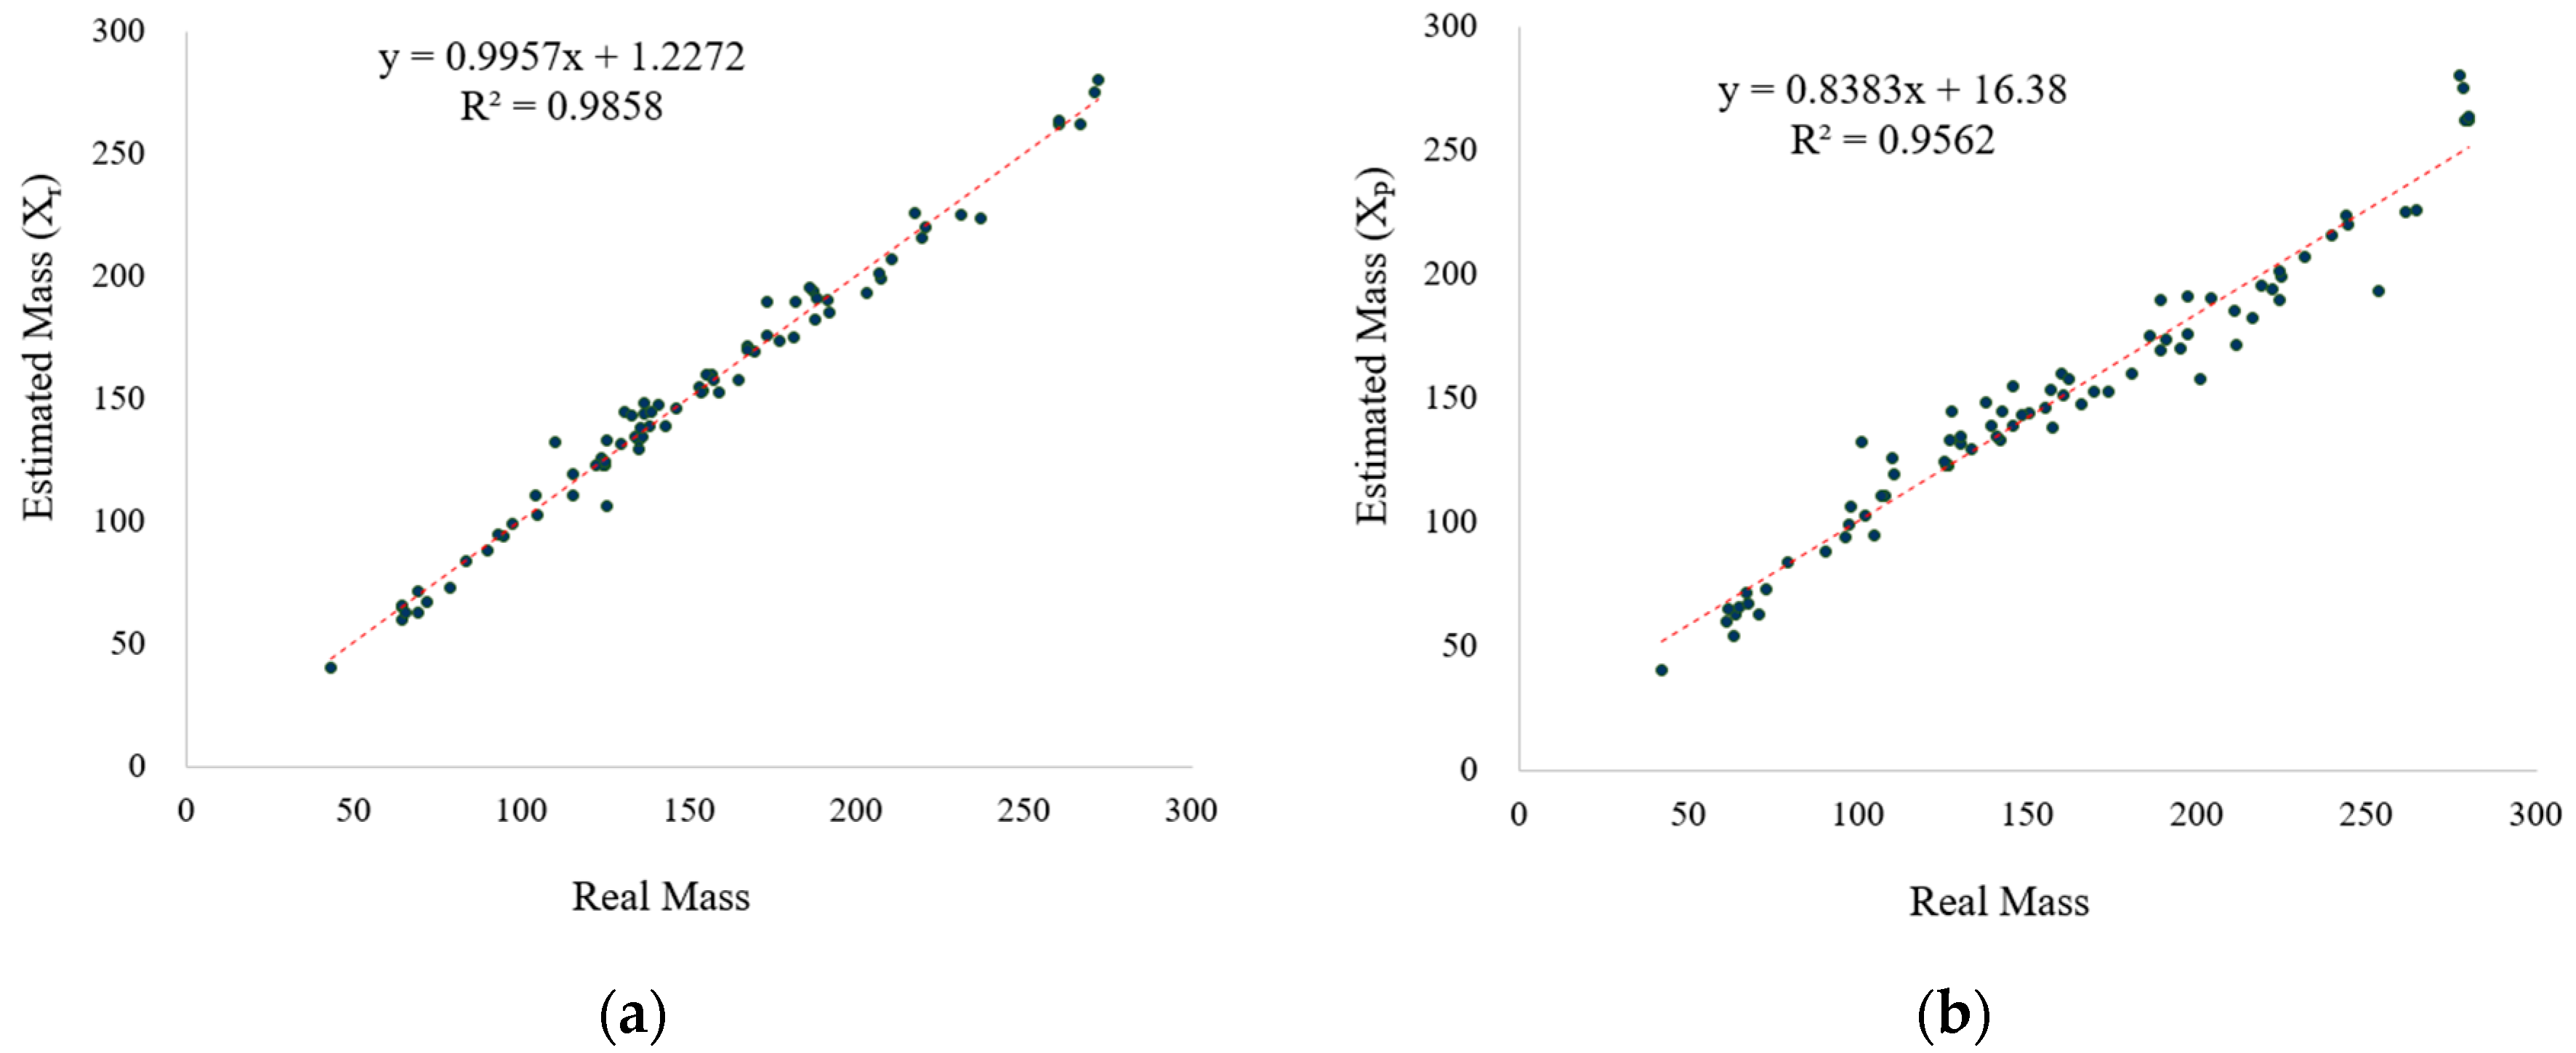
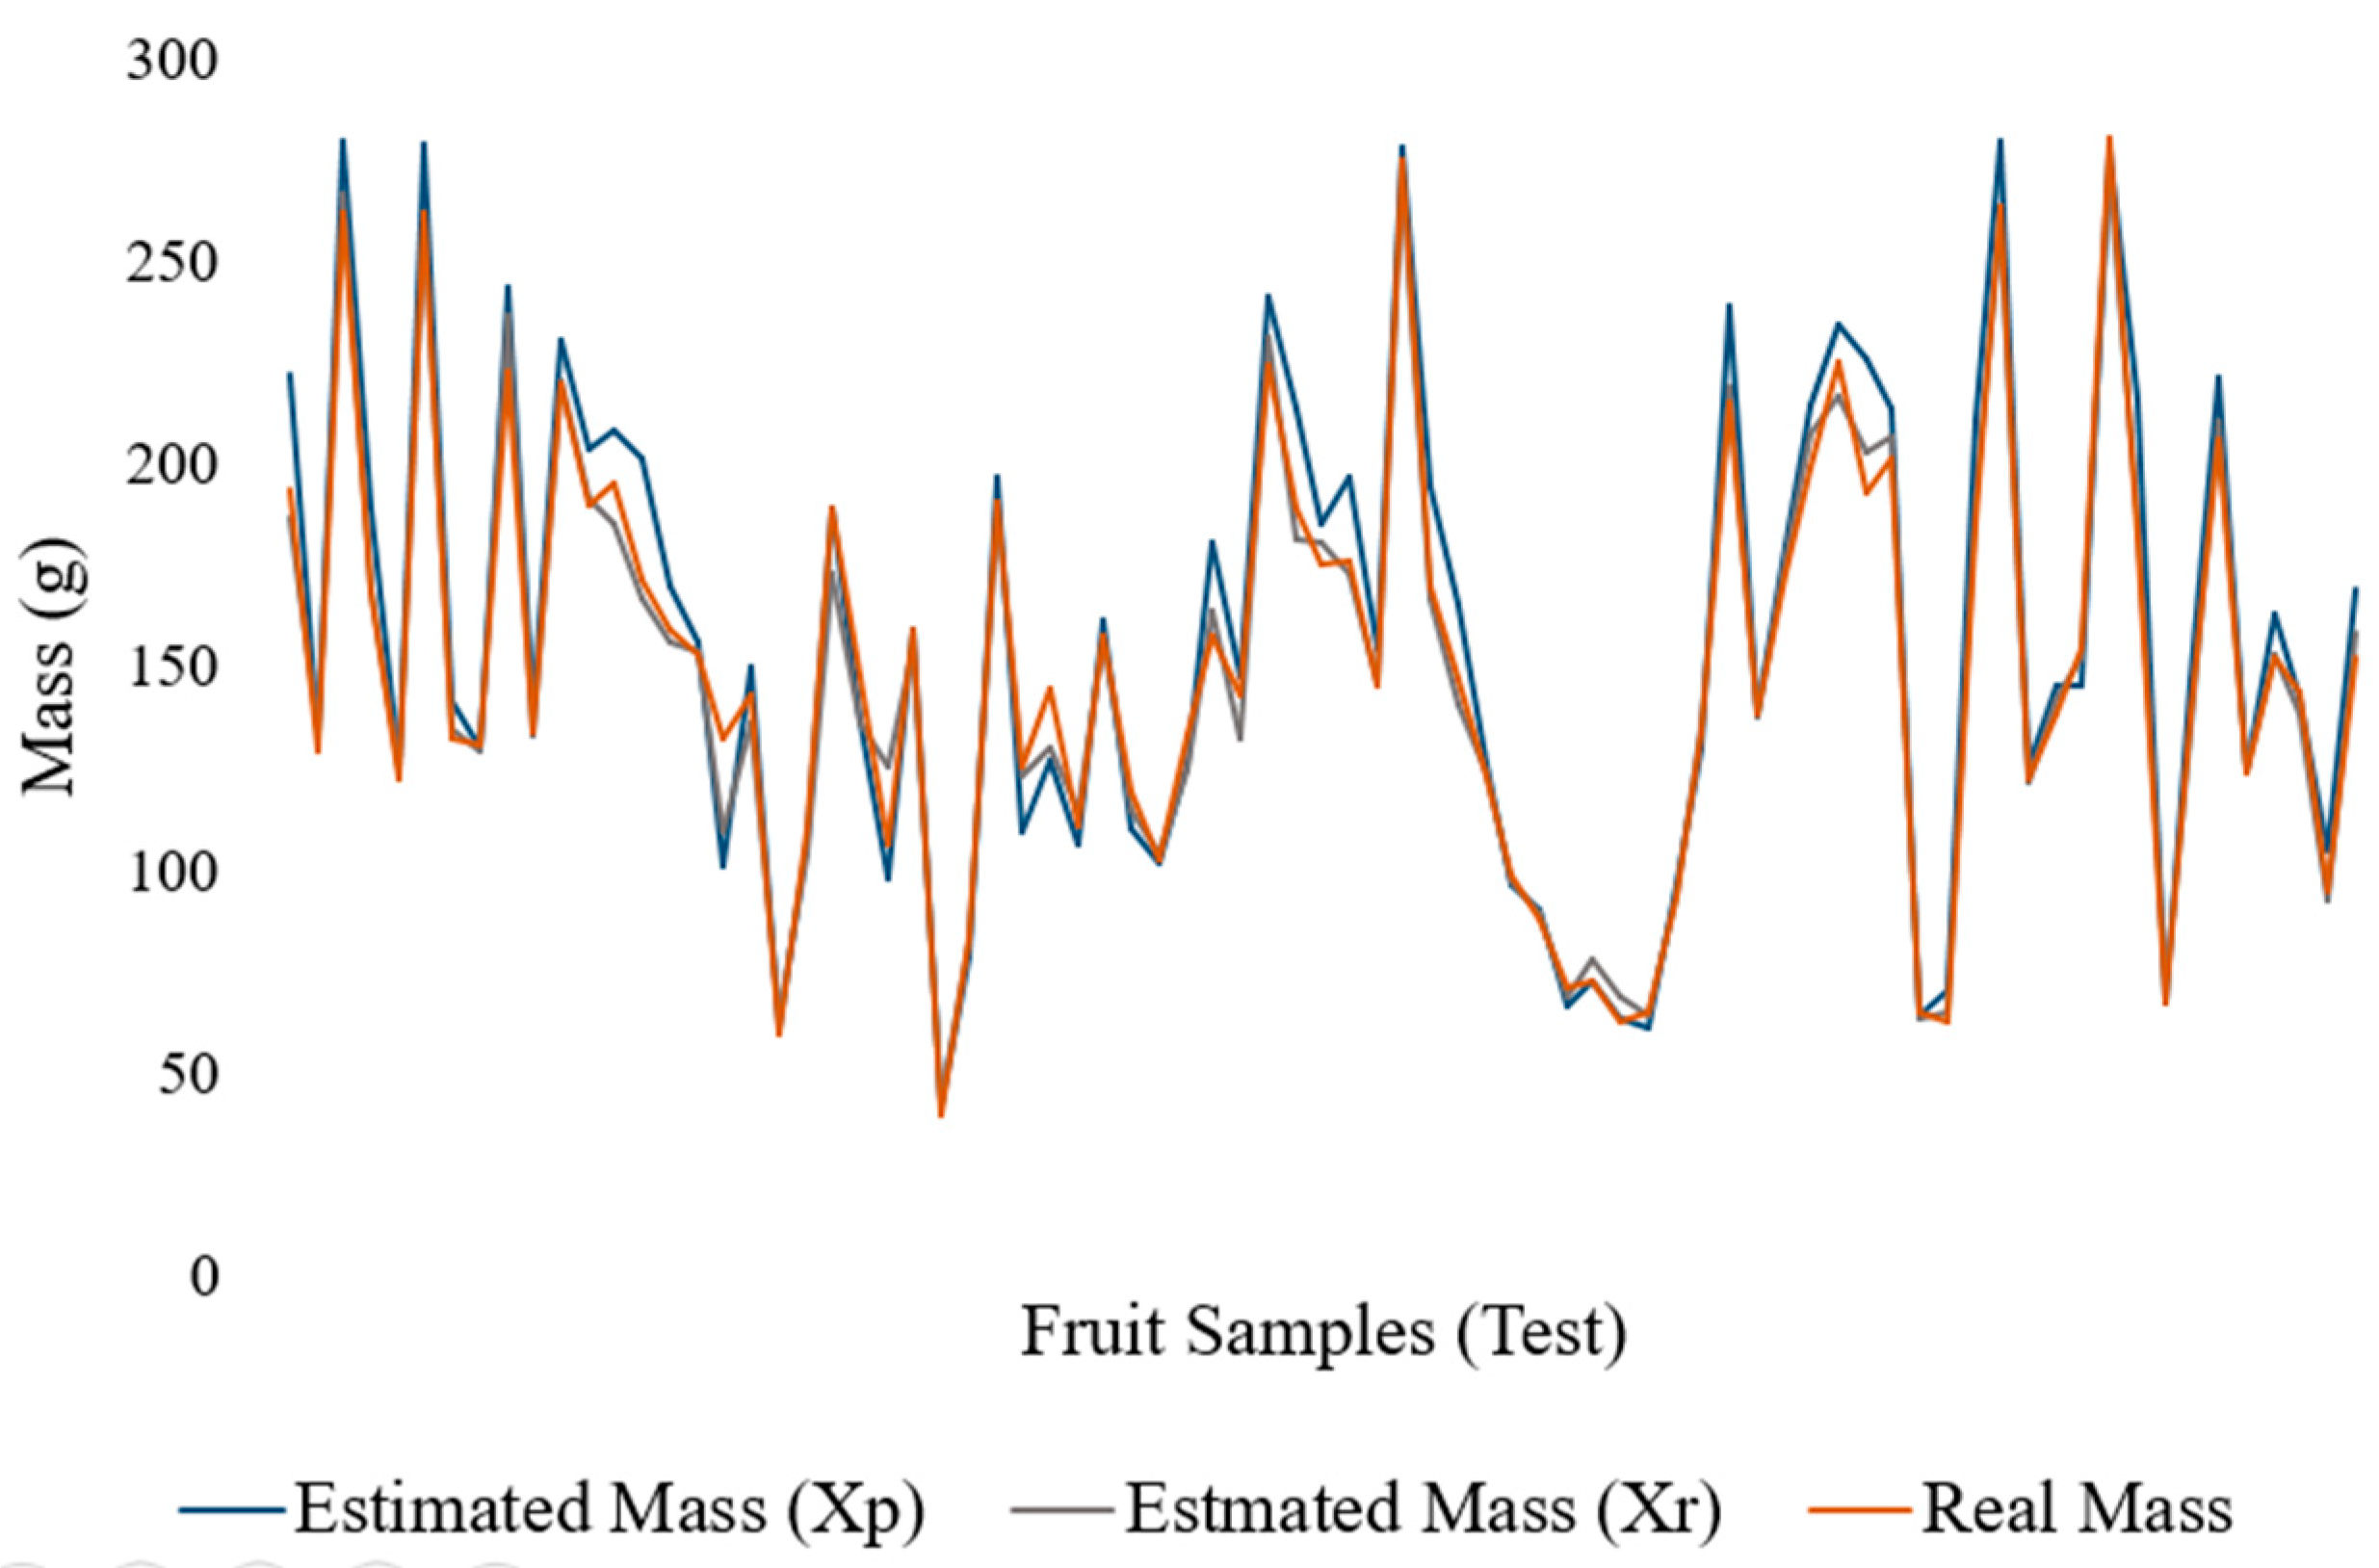
3.3. Evaluation of the Mass Estimation Module

The final mass estimation results in mass unit grams (g) were evaluated using the extracted dimensions from the geometry module. Each model was trained on 2444 collected dimension and mass instances. For fair comparison and evaluation of various artificial intelligence algorithms (Section 2.4) on our test data, we report the results of both manually measured fruit dimension features (Xr) and the estimated dimension features from the geometry module (Xp). Table 3 lists the performance indicators of these algorithms using error analysis measures of the actual test data dimensions (Xr) collected. In Table 4, we list the extracted dimensions (Xp) of the test samples from the geometry module.
As shown in Table 3 and Figure 10a, once the relationship between the dimensions and mass is established, one can readily estimate the fruit mass, given a constant fruit density. The positive correlation indicates promising estimation perspectives on real-time test data. In addition, from Table 4, the observed minimum MAE using bagged ensemble tree on estimated fruit dimensions (Xp) is 13.03, which can be considered acceptable given the outliers in the test data, the absence of a large amount of variation in the training data samples, and the error in the geometry module. Moreover, this gives us the perception that the bagged ensemble tree model gives us low bias and low variance without overfitting to the training data when compared to other models for this particular dataset. Furthermore, as can be understood from Figure 10a,b, with improved segmentation and size estimation performance, the final mass can be estimated within a more acceptable standard error range. This effect is displayed in Figure 11, where we have plotted the real and estimated values for all test samples.
Figure 11 shows the plot of estimated mass values using Xp and Xr features in the bagged tree ensemble model. As illustrated in the figure, the mass estimated using manually measured fruit dimension features (Xr) agrees more with the real mass than the mass estimated using the estimated dimension features from the geometry module (Xp). We also notice that the mass calculated when using dimension features from the geometry module (Xp) mostly follows the real mass values with slight error gaps, even in the presence of huge variation in the test data and the outliers. This again illustrates that the bagged ensemble tree model does not overfit to the training data in the mass estimation module. Nevertheless, a vision-based tomato mass estimation system would provide an effective alternate method for real-time measurement of tomato mass, which could be tedious and time consuming. With further improvements, this would also avoid the need for weighing devices while mass sorting and grading on a packaging line.

4. Conclusions and Future Work

In this study, we developed a novel vision-based system for tomato fruit detection with dimension and mass estimation. The results highlight the robustness and accuracy of the overall system and support its applicability in the development of industry- or agriculture-based sorting and grading systems. The detection and segmentation modules showed good performance in terms of accuracy and robustness with a mean IoU of 96.05%, mAP of 92.28%, detection accuracy of 99.02%, and precision of 99.7%. The trained model is also effective for detecting and segmenting multiple instances of tomato fruit in complex environmental scenarios. The estimated dimensions from the geometry module show a promising correlation with the actual dimensions. This performance, with MAEs of 2.34 and 2.58 for fruit length and width, respectively, is sufficient for related tasks, such as estimation of fruit growth, surface area, mass, and other related physical properties. Furthermore, based on our results with a MAPE of 7.09 for our test data, the final mass estimation module can be readily applied to any axisymmetric fruit for mass estimation.
However, there are some limitations to this system. Estimating the mass of occluded tomato fruit from a single RGB image is a challenging task and should be addressed. In addition, in our work, the density of fruits was set as a constant, while there are a number of tomato varieties where internal fruit structure may exhibit variable densities. As a potential solution to this problem, we can determine the relationship for each type by training and categorizing the individual variety and treating them as a sub-class. This strategy can also help effectively detect and estimate the mass of multiple fruit types. Moreover, the proposed approach is suitable for systems where the acquisition of data is calibrated in a manner in which a single camera is used at right angles to the object surface. However, this makes the overall system cheaper, but at the cost of lower accuracy in the estimation of fruit mass. Nevertheless, the proposed system is a promising starting point toward the development of automatic sorting, grading, and measuring technologies based on machine vision.
An autonomous vision-based fruit detection system for dimension and mass estimation will play a revolutionary role in various agricultural, robotic, and packaging industries by downsizing the required number of measuring instruments and manual labor. While this research highlighted the strength of our method on a small single-class dataset, future research will focus on using multiple classes for their detection and mass estimation using a common pipeline. Furthermore, because of the lack of a proper publicly available dataset on fruit dimensions and mass, the focus would be on growing the size of the training data to induce more variation for improved performance. Another avenue of work to further improve the performance of our approach is to acquire depth images with 3-D information for volume computation to further aid the regression models for improved mass estimation.

Author Contributions

Conceptualization, original draft preparation, formal analysis, J.L. and H.N.; software, validation, J.B. and H.N.; resources, data curation, Y.H.; writing—review and editing, validation, project administration, M.L. All authors have read and agreed to the published version of the manuscript.

Funding

This study was carried out with the support of “Research Program for Agricultural Science & Technology Development” (Project No: PJ013891012020), National Institute of Agricultural Sciences, Rural Development Administration, Republic of Korea.

Conflicts of Interest

The authors declare no conflict of interest.

References

  1. Sa’ad, F.S.A.; Ibrahim, M.F.; Shakaff, A.Y.; Zakaria, A.; Abdullah, M.Z. Shape and weight grading of mangoes using visible imaging. Comput. Electron. Agric. 2015, 115, 51–56. [Google Scholar] [CrossRef]
  2. Yamamoto, K.; Guo, W.; Yoshioka, Y.; Ninomiya, S. On plant detection of intact tomato fruits using image analysis and machine learning methods. Sensors 2014, 14, 12191–12206. [Google Scholar] [CrossRef] [PubMed] [Green Version]
  3. Kondo, N.; Ahmad, U.; Monta, M.; Murase, H. Machine vision based quality evaluation of Iyokan orange fruit using neural networks. Comput. Electron. Agric 2000, 29, 135–147. [Google Scholar] [CrossRef]
  4. Bargoti, S.; Underwood, J.P. Image segmentation for fruit detection and yield estimation in apple orchards. J. F. Robot. 2017, 34, 1039–1060. [Google Scholar] [CrossRef] [Green Version]
  5. Kim, S.; Lee, M.; Shin, C. IoT-based strawberry disease prediction system for smart farming. Sensors 2018, 18, 4051. [Google Scholar] [CrossRef] [Green Version]
  6. Choi, H.S.; Choi, H.S.; Du Mun, H. A Smart Fruits Quality Classification Hardware Design Using the Near-Infrared Spectroscopy and Image Processing Technologies. In Proceedings of the ICCC2018 International Conference on Convergence Content, Jeju, Korea, 17–19 December 2018. [Google Scholar]
  7. Vibhute, A.; Bodhe, K.S. Applications of image processing in agriculture: A survey. Int. J. Comput. Appl. 2012, 52, 34–40. [Google Scholar] [CrossRef]
  8. Sa, I.; Ge, Z.; Dayoub, F.; Upcroft, B.; Perez, T.; McCool, C. Deepfruits: A fruit detection system using deep neural networks. Sensors 2016, 16, 1222. [Google Scholar] [CrossRef] [Green Version]
  9. FAOSTAT. Food and Agriculture Organization (FAO), Statistics. 2017. Available online: http://www.fao.org/faostat/en (accessed on 29 August 2019).
  10. Zhao, Y.; Gong, L.; Huang, Y.; Liu, C. A review of key techniques of vision-based control for harvesting robot. Comput. Electron. Agric. 2016, 127, 311–323. [Google Scholar] [CrossRef]
  11. Wachs, J.P.; Stern, H.I.; Burks, T.; Alchanatis, V. Low and high-level visual feature-based apple detection from multi-modal images. Precis. Agric. 2010, 11, 717–735. [Google Scholar] [CrossRef]
  12. Nuske, S.; Achar, S.; Bates, T.; Narasimhan, S.; Singh, S. Yield estimation in vineyards by visual grape detection. In Proceedings of the IEEE International Conference on Intelligent Robots and Systems, San Francisco, CA, USA, 25–30 September 2011. [Google Scholar]
  13. Forbes, K.A.; Tattersfield, G.M. Estimating fruit volume from digital images. IEEE AFRICON Conf. 1999, 1, 107–112. [Google Scholar]
  14. Sabliov, C.M.; Boldor, D.; Keener, K.M.; Farkas, B.E. Image processing method to determine surface area and volume of axi-symmetric agricultural products. Int. J. Food Prop. 2002, 5, 641–653. [Google Scholar] [CrossRef]
  15. Wang, Q.; Nuske, S.; Bergerman, M.; Singh, S. Automated Crop Yield Estimation for Apple Orchards. In Experimental Robotics; Springer: Heidelberg, Germany, 2013; pp. 745–758. [Google Scholar]
  16. Hahn, F.; Sanchez, S. Carrot volume evaluation using imaging algorithms. J. Agric. Eng. Res. 2000, 75, 243–249. [Google Scholar] [CrossRef]
  17. Cheng, H.; Damerow, L.; Sun, Y.; Blanke, M. Early yield prediction using image analysis of apple fruit and tree canopy features with neural networks. J. Imaging 2017, 3, 6. [Google Scholar] [CrossRef]
  18. Mahesh, S.; Jayas, D.S.; Paliwal, J.; White, N.D.G. Hyperspectral imaging to classify and monitor quality of agricultural materials. J. Stored Prod. Res. 2015, 61, 17–26. [Google Scholar] [CrossRef]
  19. Nyalala, I.; Okinda, C.; Nyalala, L.; Makange, N.; Chao, Q.; Chao, L.; Yousaf, K.; Chen, K. Tomato volume and mass estimation using computer vision and machine learning algorithms: Cherry tomato model. J. Food Eng. 2019, 263, 288–298. [Google Scholar] [CrossRef]
  20. Yu, Y.; Zhang, K.; Yang, L.; Zhang, D. Fruit detection for strawberry harvesting robot in non-structural environment based on Mask-RCNN. Comput. Electron. Agric. 2019, 163, 104846. [Google Scholar] [CrossRef]
  21. Bargoti, S.; Underwood, J. Deep fruit detection in orchards. IEEE Int. Conf. Robot. Autom. 2017, 3626–3633. [Google Scholar]
  22. Kamilaris, A.; Prenafeta-Boldú, F.X. Deep learning in agriculture: A survey. Comput. Electron. Agric. 2018, 147, 70–90. [Google Scholar] [CrossRef] [Green Version]
  23. Haseeb, N.; Sook, Y.; Alvaro, F.; Park, D.S. Unsupervised image translation using adversarial networks for improved plant disease recognition. Comput. Electron. Agric. 2019, 168, 105117. [Google Scholar]
  24. Girshick, R. Fast R-CNN. In Proceedings of the IEEE International Conference on Computer Vision, Santiago, Chile, 7–13 December 2015; pp. 1440–1448. [Google Scholar]
  25. He, K.; Gkioxari, G.; Dollar, P.; Girshick, R. Mask R-CNN. In Proceedings of the IEEE International Conference on Computer Vision, Venice, Italy, 22–29 October 2017. [Google Scholar]
  26. Kainz, O.; Jakab, F.; Horecny, M.W.; Cymbalak, D. Estimating the object size from static 2D image. In Proceedings of the 2015 International Conference and Workshop on Computing and Communication (IEMCON), Vancouver, BC, Canada, 15–17 October 2015; pp. 1–5. [Google Scholar]
  27. Rosebrock, A. Measuring Size of Objects in an Image with OpenCV. Available online: https://www.pyimagesearch.com/2016/03/28/measuring-size-of-objects-in-animage-with-opencv (accessed on 1 November 2020).
  28. Mohsenin, N.N. Physical Properties of Plant and Animal Materials; Routledge: Abingdon-on-Thames, UK, 1986. [Google Scholar]
  29. Chaithanya, C.; Priya, S. Object weight estimation from 2D images. ARPN J. Eng. Appl. Sci. 2015, 10, 17. [Google Scholar]
  30. Wang, P.W.; Lin, C.J. Support vector machines. In Data Classification: Algorithms and Applications; CRC Press: Boca Raton, FL, USA, 2014; ISBN 9781466586758. [Google Scholar]
  31. Dutta, A.; Zisserman, A. The VGG Image Annotator (VIA). arXiv 2019, 10. [Google Scholar]
  32. Ren, S.; He, K.; Girshick, R.; Sun, J. Faster R-CNN: Towards Real-Time Object Detection with Region Proposal Networks. In Advances in Neural Information Processing Systems; MIT Press: Cambridge, MA, USA, 2017. [Google Scholar]
  33. Shelhamer, E.; Long, J.; Darrell, T. Fully convolutional networks for semantic segmentation. IEEE Trans. Pattern Anal. Mach. Intell. 2017, 3431–3440. [Google Scholar] [CrossRef] [PubMed]
  34. He, K.; Zhang, X.; Ren, S.; Sun, J. Deep residual learning for image recognition. In Proceedings of the IEEE Computer Society Conference on Computer Vision and Pattern Recognition, Las Vegas, NV, USA, 27–30 June 2016. [Google Scholar]
  35. Lin, T.Y.; Dollár, P.; Girshick, R.; He, K.; Hariharan, B.; Belongie, S. Feature pyramid networks for object detection. In Proceedings of the 30th IEEE Conference on Computer Vision and Pattern Recognition, Honolulu, HI, USA, 21–26 July 2017; pp. 2117–2125. [Google Scholar]
  36. Lin, T.Y.; Maire, M.; Belongie, S.; Hays, J.; Perona, P.; Ramanan, D.; Dollár, P.; Zitnick, C.L. Microsoft COCO: Common objects in context. In Lecture Notes in Computer Science (including subseries Lecture Notes in Artificial Intelligence and Lecture Notes in Bioinformatics); DCFS: Tallahassee, FL, USA, 2014; pp. 740–755. [Google Scholar]
  37. Drucker, H.; Surges, C.J.C.; Kaufman, L.; Smola, A.; Vapnik, V. Support vector regression machines. In Advances in Neural Information Processing Systems; MIT Press: Cambridge, MA, USA, 1997; pp. 155–161. [Google Scholar]
  38. Westreich, D.; Lessler, J.; Funk, M.J. Propensity score estimation: Neural networks, support vector machines, decision trees (CART), and meta-classifiers as alternatives to logistic regression. J. Clin. Epidemiol. 2010, 63, 826–833. [Google Scholar] [CrossRef] [Green Version]
  39. Seeger, M. Gaussian processes for machine learning. Int. J. Neural Syst. 2004, 14, 69–106. [Google Scholar] [CrossRef] [Green Version]
  40. Heckerman, D. A tutorial on learning with Bayesian networks. In Innovations in Bayesian Networks; Springer: Berlin, Germany, 2008. [Google Scholar]
  41. Williams, C.K.I. Prediction with Gaussian Processes: From Linear Regression to Linear Prediction and Beyond. In Learning in Graphical Models; Springer Science & Business Media: Berlin, Germany, 1998. [Google Scholar]
  42. Specht, D.F. A general regression neural network. IEEE Trans. Neural Netw. 1991, 2, 568–576. [Google Scholar] [CrossRef] [Green Version]
  43. Bashiri, M.; Farshbaf Geranmayeh, A. Tuning the parameters of an artificial neural network using central composite design and genetic algorithm. Sci. Iran. 2011, 18, 1600–1608. [Google Scholar] [CrossRef] [Green Version]
  44. Chai, T.; Draxler, R.R. Root mean square error (RMSE) or mean absolute error (MAE)?—Arguments against avoiding RMSE in the literature. Geosci. Model Dev. 2014, 7, 1247–1250. [Google Scholar] [CrossRef] [Green Version]
  45. de Myttenaere, A.; Golden, B.; Le Grand, B.; Rossi, F. Mean absolute percentage error for regression models. Neurocomputing 2016, 192, 38–48. [Google Scholar] [CrossRef] [Green Version]
Figure 1. (Best viewed in color). Step-by-step illustration of our detection and instance-based segmentation system with dimension and mass estimation of tomato fruits.
Sustainability 12 09138 g001
Figure 2. Dataset collection: (a) Image acquisition setup; (b) Sample images collected (left) with the corresponding annotated mask (right).
Sustainability 12 09138 g002
Figure 3. Complete Mask-RCNN framework with three stages: a feature extraction backbone network, a region proposal network (RPN) to generate RoIs (region of interests), and an FCN (fully convoluted network) running parallel to fully connected networks to extract instance-wise semantic masks and to perform target detection with classification outputs.
Sustainability 12 09138 g003
Figure 4. Generated anchors (dotted boxes) using RPN (region proposal network): (a) Negative anchors; (b) Neutral anchors and (c) Positive anchors.
Sustainability 12 09138 g004
Figure 5. Scatter plot illustrating the relationship between (a) mass and fruit length and (b) mass and fruit width of our tomato dataset samples with their coefficient of relationship r = 0.7 and r = 0.85, respectively.
Sustainability 12 09138 g005
Figure 6. Convergence of various loss functions in Mask-RCNN for our tomato dataset.
Sustainability 12 09138 g006
Figure 7. Detection and segmentation results using Mask-RCNN on our test dataset.
Sustainability 12 09138 g007
Figure 8. Detection and segmentation results on random samples collected from a tomato field.
Sustainability 12 09138 g008
Figure 9. Comparison of the estimated and real dimensions of tomato samples from our test dataset: (a) Fruit width and (b) Fruit length.
Sustainability 12 09138 g009
Figure 10. Comparison of the estimated and real mass of tomato samples from our test dataset: (a) Estimated mass from real dimensions (Xr) and (b) Estimated mass from estimated dimensions (Xp).
Sustainability 12 09138 g010
Figure 11. (Best viewed in color). Comparative evaluation of the estimated and real mass of tomato samples using manually measured fruit dimension features (Xr) and estimated dimension features from the geometry module (Xp).
Sustainability 12 09138 g011
Table 1. Segmentation mask results in terms of mask IoU (intersection over union) and mAP (mean average precision) percentage on our test data.
Mask-RCNN BackboneMask IoUmAP
ResNet-50 + FPN95.3290.13
ResNet-101 + FPN96.0593.30
Table 2. Error analysis in terms of mean absolute error (MAE), mean squared error (MSE), root mean squared error (RMSE), and mean absolute percentage error (MAPE) for estimated tomato fruit dimensions using our test data samples
MAEMSERMSEMAPE
Fruit width2.3808.7452.9574.114
Fruit length2.58011.643.4123.636
Table 3. Error analysis for tomato fruit mass estimation on manually measured dimensions (Xr) in the test dataset.
MAEMSERMSEMAPE
SVR (quadratic) 16.1380.098.944.20
SVR (RBF) 26.2385.659.254.14
Bagged ensemble tree4.7641.516.443.39
Exponential GPR4.7142.726.533.21
Neural network6.2278.348.854.11
1,2 Quadratic and Gaussian radial basis kernel (RBF) functions in SVR.
Table 4. Error analysis for tomato fruit mass estimation on estimated dimensions from the geometry module (Xp) in the test dataset.
MAEMSERMSEMAPE
SVR (quadratic) 117.0159572.836823.9340110.03
SVR(RBF) 215.98462470.813821.698249.376872
Bagged ensemble tree13.03521325.750618.048567.900019
Exponential GPR15.13498421.677220.534789.095166
Neural network15.11417.1220.429.06
1,2 Quadratic and Gaussian radial basis kernel (RBF) functions in SVR.
Publisher’s Note: MDPI stays neutral with regard to jurisdictional claims in published maps and institutional affiliations.

