Article

Carbon and Nitrogen Stocks and Soil Quality in an Area Cultivated with Guinea Grass under the Residual Effect of Nitrogen Doses

by
Antonio Leandro Chaves Gurgel
1,*,
Gelson dos Santos Difante
1,
Alexandre Romeiro de Araujo
2,
Denise Baptaglin Montagner
2,
Valeria Pacheco Batista Euclides
2 and
Manoel Gustavo Paranhos da Silva
1
1
Faculty of Veterinary Medicine and Animal Science, Federal University of Mato Grosso do Sul, Campo Grande 79070-900, Mato Grosso do Sul, Brazil
2
Embrapa Beef Cattle, Campo Grande 79106-550, Mato Grosso do Sul, Brazil
*
Author to whom correspondence should be addressed.
Sustainability 2020, 12(22), 9381; https://doi.org/10.3390/su12229381
Submission received: 16 September 2020 / Revised: 14 October 2020 / Accepted: 15 October 2020 / Published: 11 November 2020
(This article belongs to the Special Issue Suitable Agronomic Techniques for Sustainable Agriculture)

Abstract

:
This study examines the residual effect of nitrogen (N) doses on the carbon (C) and N stocks and on soil quality in an area cultivated with guinea grass. The pastures received three annual doses of N (100, 200 and 300 kg ha−1) from 2015 to 2017. In 2018, N fertilization was not applied so the residual effect of the nutrient could be characterized. Soil chemical attributes, C and N stocks, density and penetration resistance and root system characteristics were evaluated at different depths. No difference was observed between the N doses for soil density, which averaged 1.22 and 1.25 g cm−3 under and between the tussocks of guinea grass, respectively. Penetration resistance was affected by the N doses post-grazing, with the highest value (1.9 MPa) observed in pastures that received 300 kg ha−1 of N for three consecutive years. Root dry mass was not affected by the N doses. There was no effect of N doses on the average (19.7 mg ha−1) or total (134.3 mg ha−1) C stock in the soil. The total N stock did not change (11.3 mg ha−1) in response to the N doses; however, the average N stock was higher in the soil cultivated with guinea grass under the N dose of 300 kg ha−1 (1.7 mg ha−1). The N doses had little interference with the soil chemical and physical aspects. Regardless of the dose, high C and N stocks were observed in the soil cultivated with guinea grass. Therefore, when properly managed, intensive pasture-based animal production systems become important allies of the environment.

1. Introduction

In addition to holding the largest commercial cattle herd in the world, Brazil is also the largest exporter of beef [1]. The main factor making beef cattle a competitive activity worldwide is its production being carried out almost exclusively on pasture. Forage grasses of the species Panicum maximum are among the main types cultivated in Brazil, having characteristics of high persistence in intensive management and high productivity, as a consequence of photosynthetic and water efficiency, as well as high phenotypic plasticity [2]. Allied to this, the pastures of this species have high support capacity and animal performance, which can lead to different responses of the animal according to the management of the grazing adapted [3].
Nitrogen (N) fertilization, coupled with maintenance fertilization with other nutrients essential to plants, is essential to ensure agricultural productivity [4,5,6,7]. In this respect, one of the main triggers of the pasture degradation process is low adoption of these technologies associated with inadequate management of pasture and grazing. The use of N increases and allows the intensification of the use of primary productivity through a higher stocking rate [8]. Unfortunately, since the middle of the 20th century, the intensification of plant production based on mineral fertilizers has led to a loss of biodiversity [9]. Additionally, there is a risk of changes occurring in the physical properties of the soil due to increased stocking rates promoted by the increase in pasture production [7,8,10]. The pressure exerted by animal trampling can compromise the physical characteristics of the soil as a result of increased soil density (SD) and penetration resistance (PR) and reduced porosity [11,12].
Soil is considered a common benefit for all of humanity and is responsible for improving water quality, reducing gas emissions and increasing food production [13]. Carbon (C) and N contents are the main indicators of soil health [5], as they are responsible for physical, chemical and biological functions and are involved in nutrient retention [14]. The main form of storage of C and N in pastoral environments is through the root system [15]. However, most research done on forage plants neglects root growth.
It is therefore paramount that current livestock systems adopt measures that promote eco-functional intensification, taking into account the ecosystem services provided by animal production systems. On the other hand, information is lacking in the literature about the residual effect of N doses on pasture-based animal production systems and the participation of soils in environmental services. The knowledge of soil responses to agricultural management practices is essential for the sustainability and longevity of pasture-based animal production systems.
Thus, the hypothesis investigated in this study is that N has a residual effect on the chemical and physical characteristics and C and N stocks in the soil and in the root system of guinea grass after three consecutive years of using the same N levels on pastures grazed intensively by beef cattle. Accordingly, the objective was to examine the residual effect of N doses on the C and N stocks and on the quality of soil in an area cultivated by guinea grass grazed by beef cattle.

2. Materials and Methods

2.1. Experiment Site and Soil-Climatic Monitoring

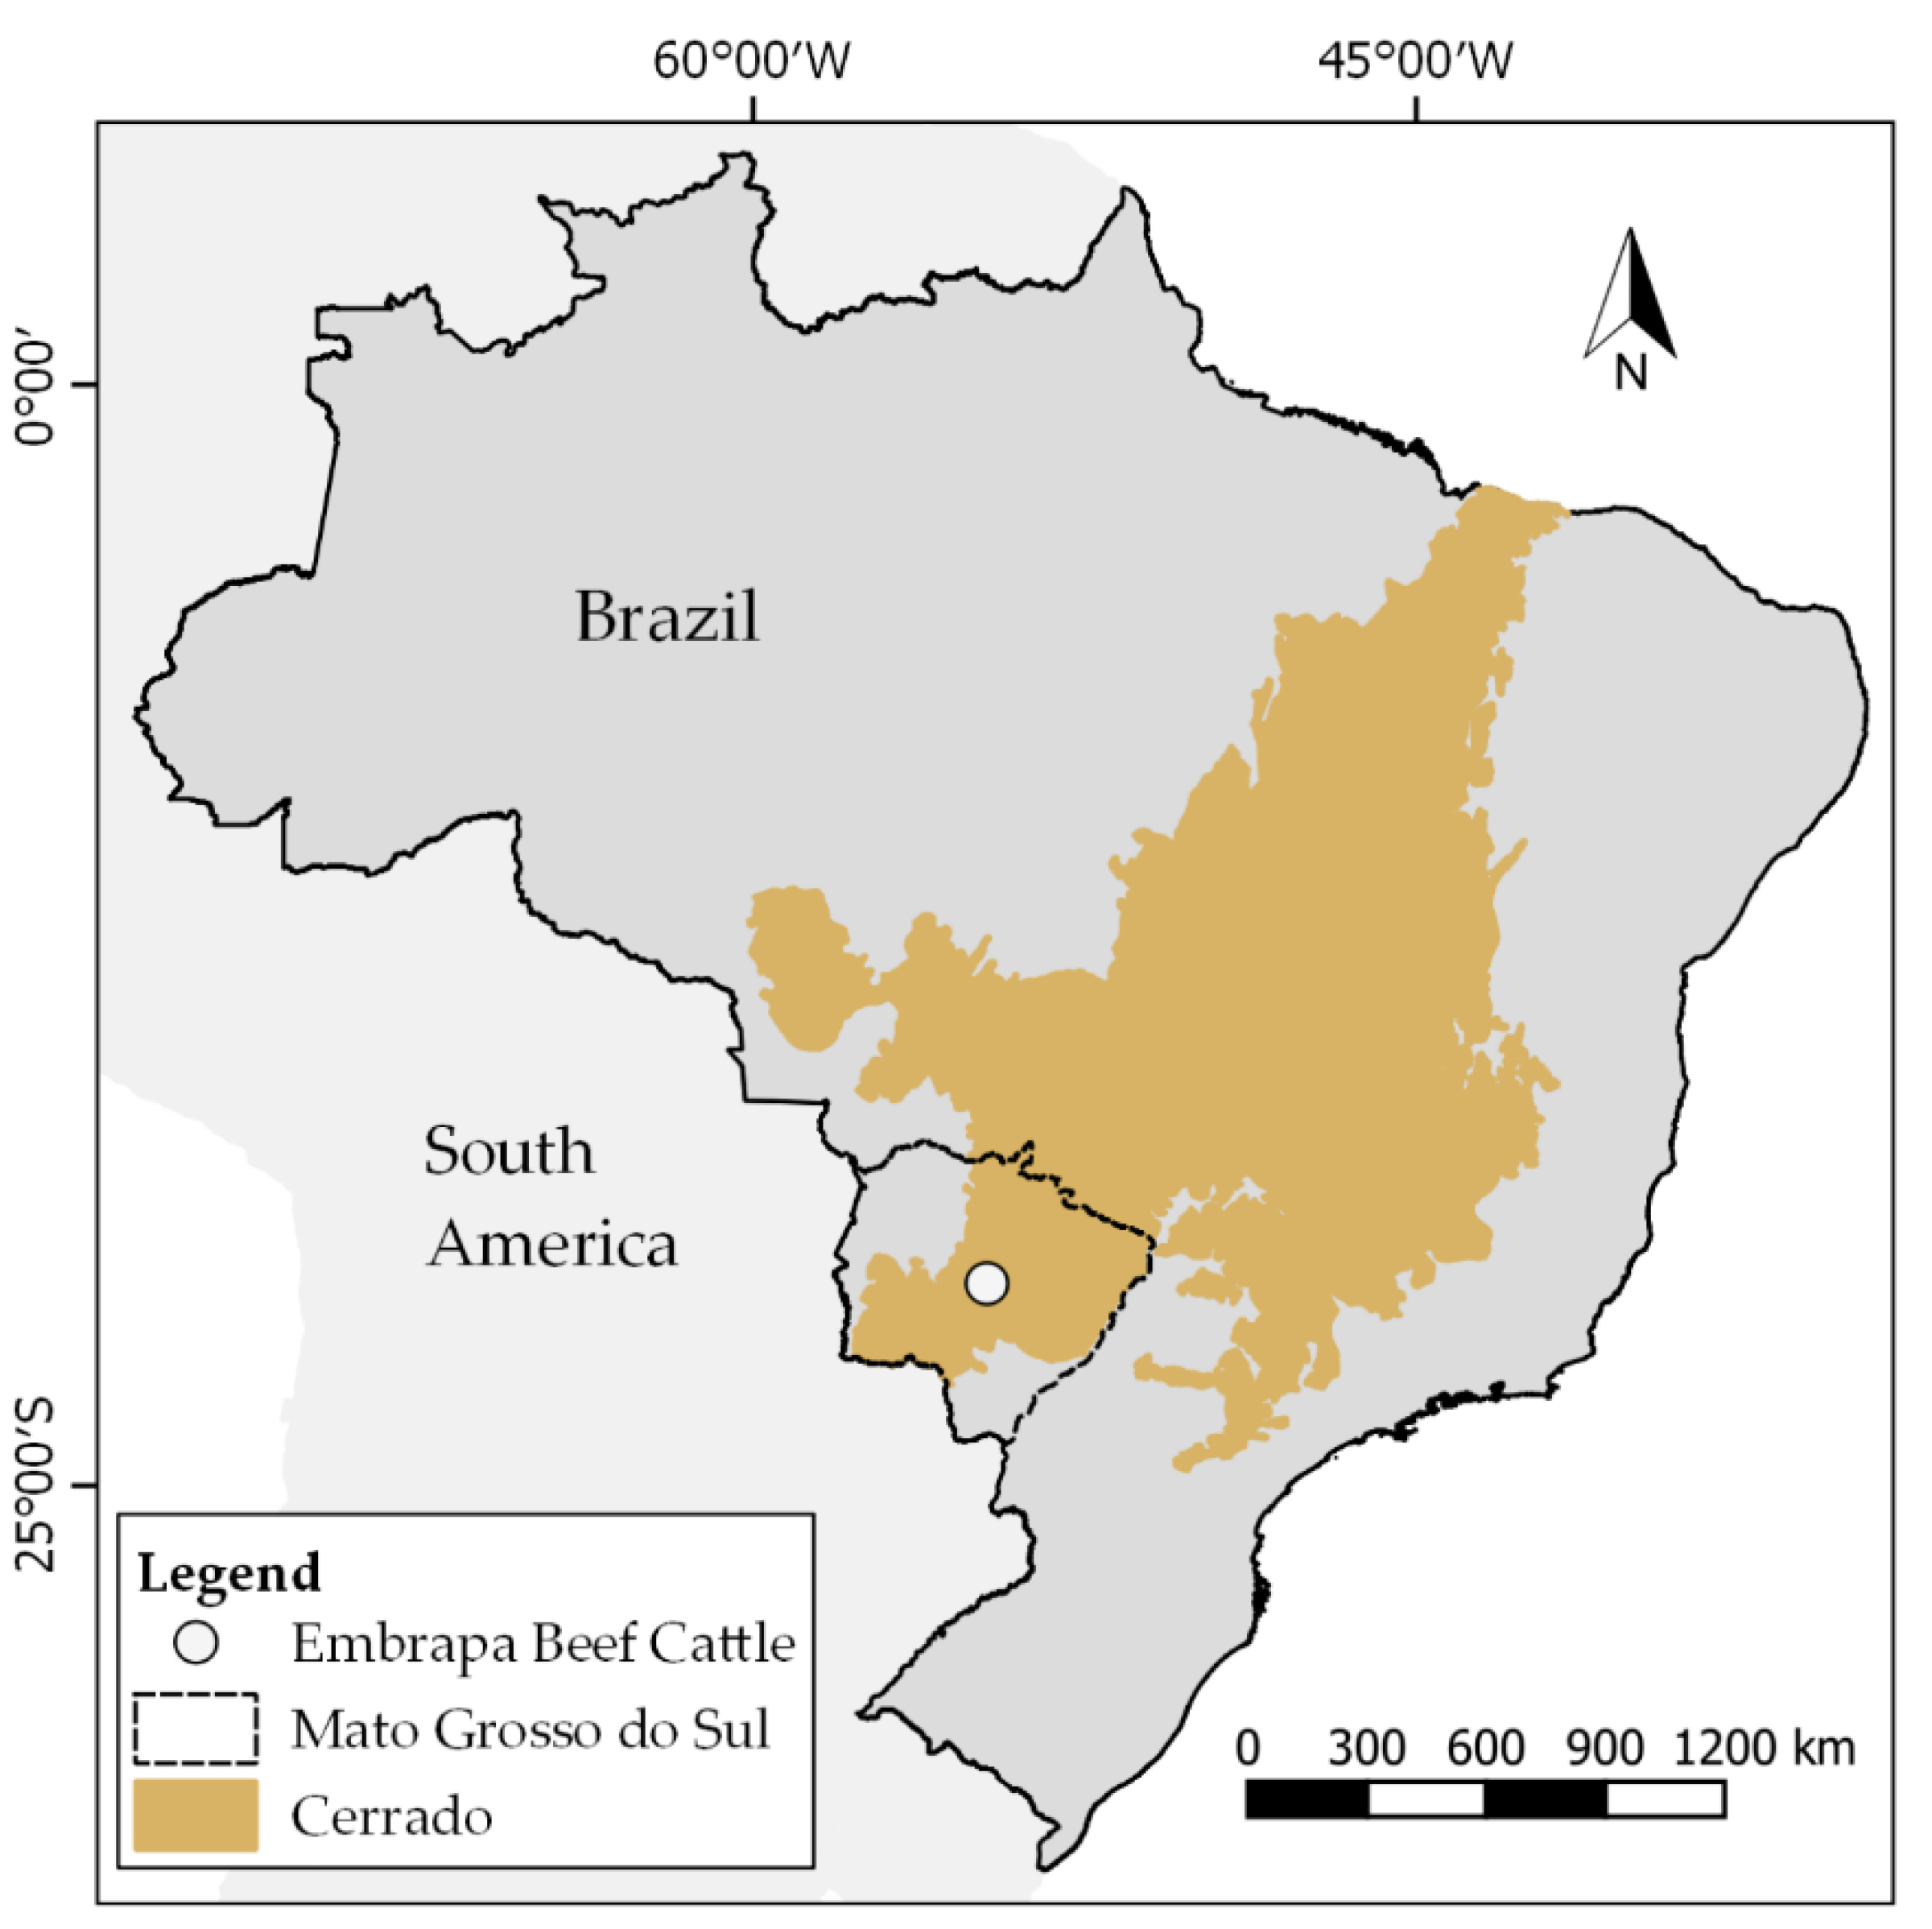
The experiment was carried out at Embrapa Beef Cattle, in Campo Grande, state of Mato Grosso Sul (MS), Brazil (20°27′ S and 54°37203′ W, 530 m above sea level) (Figure 1). Data were collected from November 2017 to May 2018
According to the Köppen classification, the climate of the region is an Aw type (rainy tropical savannah), with a defined dry season occurring from May to September. Precipitation in the area was monitored during the experimental period (Table 1). Climatic data were obtained from the database of the National Institute of Meteorology [16] at the Campo Grande-MS station.
The soil of the experimental area is classified as Red Latosol [17], with clay contents between 30 and 35%. Before the beginning of the experiment (2014 and 2017), soil was sampled at the depths of 0 to 10 and 0 to 20 cm for chemical analysis (Table 2).

2.2. Experimental Development

Guinea grass (Panicum maximum cv. Mombaça) was established in January 2008 (blocks I and II) and November 2010 (block III) and has been used since then under intermittent grazing by beef cattle. The 13.5-ha experimental area was divided into three blocks, each of which was subdivided into three 1.5-ha modules (one for each N level) and these into six 0.25-ha paddocks. Therefore, within each block there was a repetition of each N level. The pastures received three annual doses of N in the form of urea (100, 200 and 300 kg ha−1 of N) for three consecutive years (2014/2015, 2015/2016 and 2016/2017), in addition to topdressing with 80 kg ha−1 of P2O5 and 80 kgha−1 of K2O. After the rainy season of 2017, maintenance and N fertilization were no longer applied, which characterized the evaluation of the residual effect of N doses. Nitrogen fertilization was divided into three annual applications, the first dose of each treatment being applied together with phosphorus and potassium.
Intermittent grazing with a variable stocking rate was adopted as the grazing method, with five days of occupation and 25 days of rest in the first five grazing cycles (summer). In the sixth grazing cycle (fall), the pastures were managed with seven days of occupation and 35 days of rest. Fifty-four male Nellore cattle with an initial average live weight of 205 ± 25.8 kg were used. These animals remained in the paddocks throughout the experimental period, whereas a variable number of put-and-take animals was used to adjust the stocking rate during the occupation period so as to maintain pasture height at 40–50 cm in the post-grazing period [18]. The paddocks were grazed clockwise.
The different N doses resulted in different rates of herbage accumulation between the treatments, which in turn defined different stocking rates throughout the experimental period (Table 3).

2.3. Soil Chemistry

All sampling has always been carried out in the same pickets previously chosen at random in each module. Soil samples for chemical analysis were collected in May 2018, at three depths (0 to 10, 0 to 20 and 20 to 40 cm). For the collection, 0.5-m-deep trenches were dug in two paddocks of each experimental block. The samples were stored in a plastic bag, which was then labeled and sent to the Soil Laboratory at the Brazilian Agricultural Research Corporation (EMBRAPA-Beef Cattle). The following chemical attributes were evaluated: pH (1:2.5 ratio), potential acidity (H++Al3+), phosphorus content, exchangeable potassium, exchangeable calcium, exchangeable magnesium, base saturation, cation exchange capacity (CEC at pH = 7.0), sum of bases and organic matter content [19].

2.4. Soil Density (SD)

Soil density was evaluated according to the methodology described by Embrapa [19]. Trenches 120 cm in depth were dug in two paddocks per module. Eight samples were collected from each trench, four under and four between the tussocks of guinea grass, at the depths of 0 to 10, 10 to 20, 20 to 30 and 30 to 40 cm. For the collection, 100-cm3 soil sampling rings were used.

2.5. Soil Penetration Resistance (PR)

Penetration resistance was measured in the pre- and post-grazing periods by direct reading, using an automated soil compaction meter (PenetroLOG PLG 1020) at 10 points in two paddocks of each module, up to the depth of 60 cm. Additionally, soil samples were collected at the time of the PR assessments to determine moisture at the depths at which PR was assessed, for a later correction of the values [20].

2.6. Root System

To measure root dry mass, eight samples were collected in two paddocks of each module: four under and four between the tussocks. Each sample was sub-sampled at the depths of 0 to 10, 10 to 20, 20 to 30 and 30 to 40 cm. For collection, a cylindrical auger 4.8 cm in diameter and 10 cm in height was used. Subsequently, wet soil + root samples were packed in labeled plastic bags.
To separate the roots from the soil, the samples were placed on sieves with 2- and 1-mm screens under running water. Roots were oven-dried at 60–65 °C for 72 h or until reaching constant weight and were weighed to determine the DM content. As in the analysis of PR, soil samples were collected to determine moisture at the time of root collections. The soil moisture values were used to adjust the calculations of root dry mass (kg ha−1) and the percentage of root mass distribution (%) in the soil profile.

2.7. C and N Stocks

Soil samples were collected in May 2018 in six 120-cm-deep trenches in each experimental block. These were taken at the depths of 0 to 10, 10 to 20, 20 to 30, 30 to 40, 40 to 60, 60 to 80 and 80 to 100 cm to determine the levels of C and N. In addition to undisturbed samples, samples were also collected to determine SD for the calculations of the C and N stocks.
Soil samples for determining the C and N contents were packed in plastic bags, dried in the air, ground in a mill with 80-mesh sieves and subjected to a combustion process (temperature around 1000 °C). The C and N contents were determined in a C and N auto-analyzer (CN628, Leco). The gases generated in the combustion chamber (CO2, N2, H2O) were separated in a gas chromatography column, which was followed by thermal conductivity detection as proposed by Embrapa [19]. The stocks in the different soil layers were calculated according to the SD values, as follows: ttock (mg ha−1) = C or N content (%) × soil density (g cm−3) [19].

2.8. Experimental Design and Statistical Analysis

The experiment was laid out in a split-plot, randomized-block design. The residual effect of N doses was allocated to the plot and the soil depths to the subplot. Data were subjected to analysis of variance using the following model: Yijk = μ + Di + Bj + αij + Pk + (D * P)ik + βijk, where Yijk = value observed using dose i, in block j, at depth k; μ = overall-mean effect; Bj = effect of block J; Di = effect of N dose i (i = 100, 200 and 300); αij = effect of the random error attributed to the plot; Pk = effect of depth k; (D * P)ik = interaction effect between dose and depth; and βijk = random error attributed to the subplot.
When determined to be significant by the F test, the residual effects of N doses at the soil depths and their interactions were analyzed by Tukey’s test at 5% significance.

3. Results

The interaction effect between N dose and soil depth was not significant (p > 0.05) for the studied variables. Thus, the effects of N doses and soil depths were evaluated and discussed in isolation.

3.1. Soil Chemistry

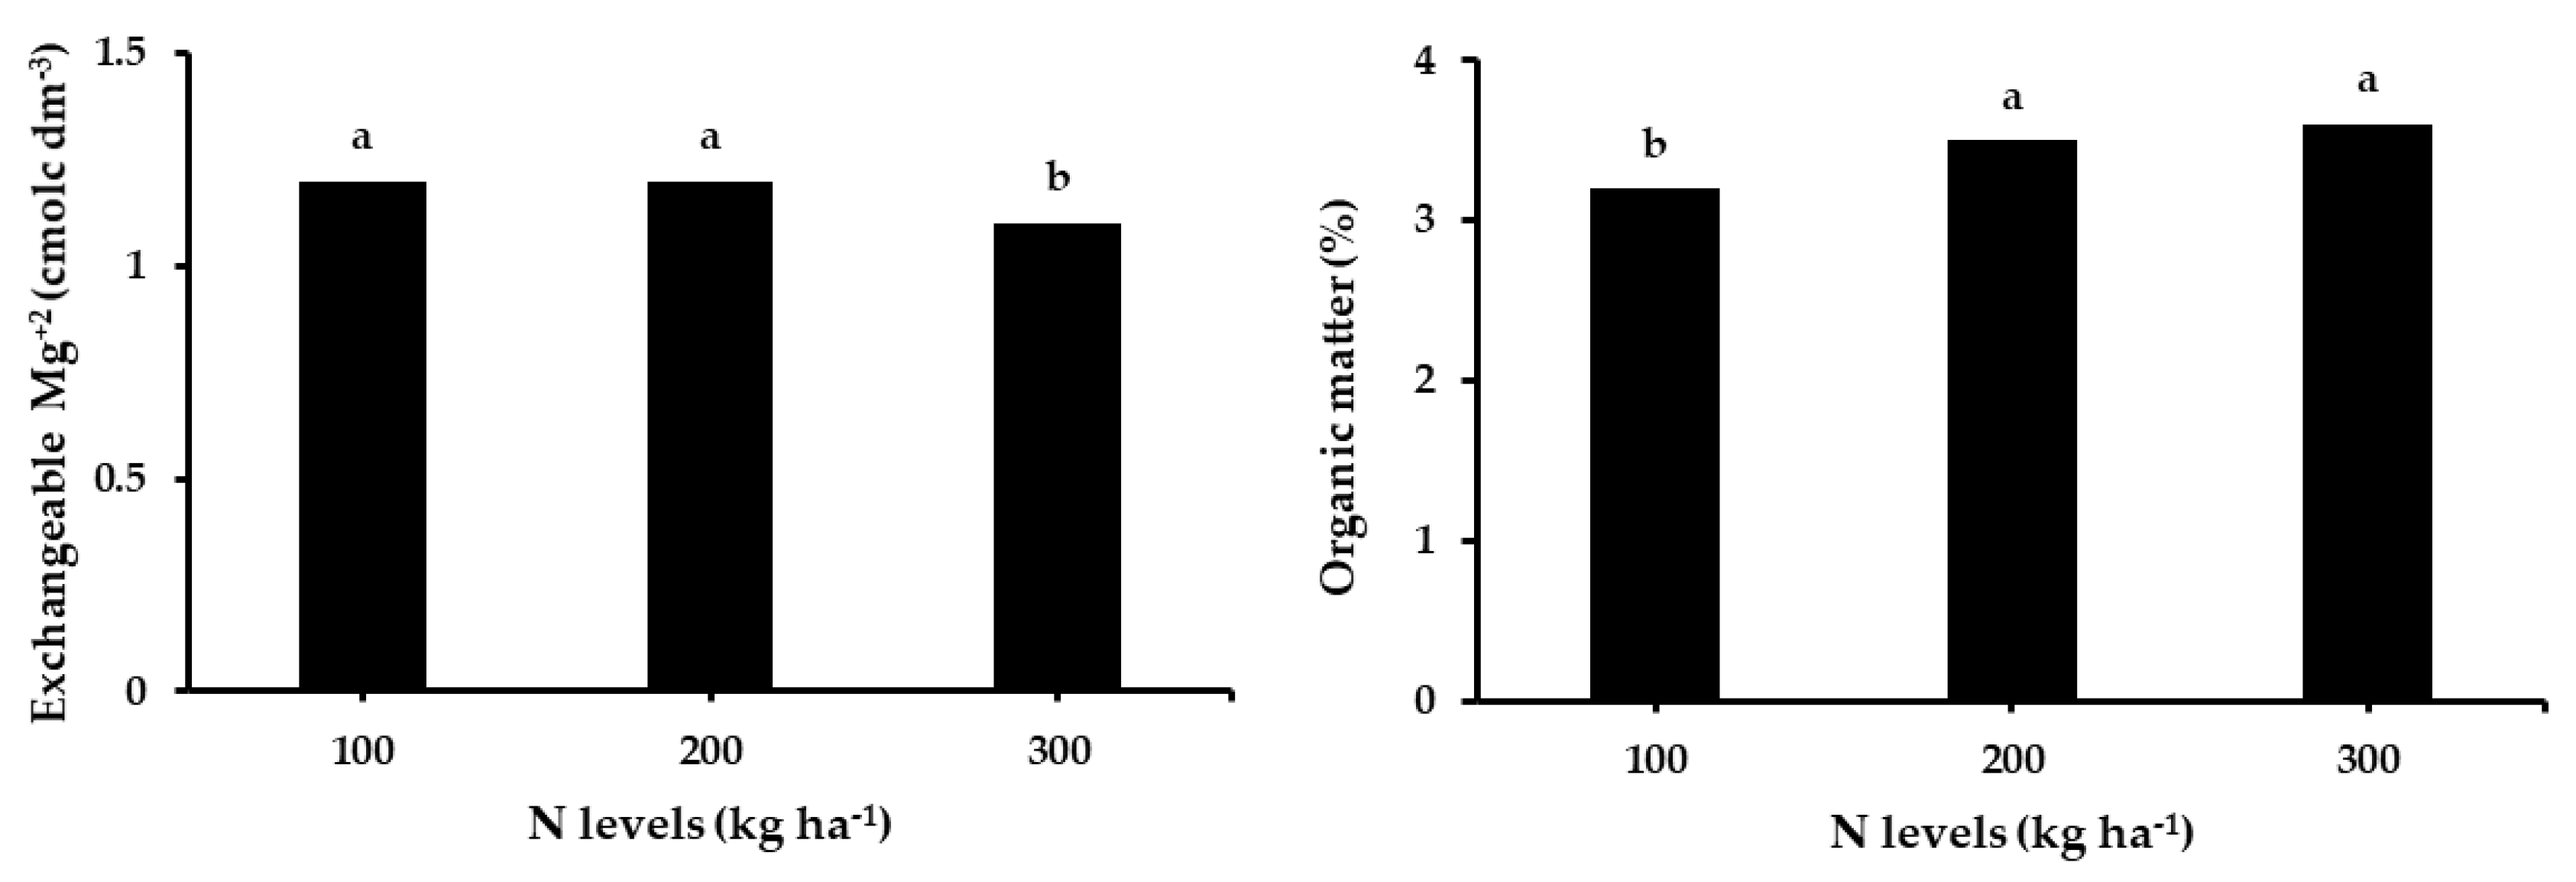
The N doses did not influence (p > 0.05) soil pH (5.2 ± 0.02), exchangeable calcium (2.1 ± 0.09 cmolc dm−3), exchangeable potassium (0.22 ± 0.01 cmolc dm−3), potential acidity (3.5 ± 0.14 cmolc dm−3), cation exchange capacity (7.0 ± 0.06 cmolc dm−3), base saturation (49.3 ± 1.4%) or phosphorus content (4.1 ± 0.74 mg dm−3). However, the doses affected the levels of exchangeable magnesium (p = 0.0229); the highest concentrations in the soil were found using the N doses of 100 and 200 kg ha−1 and for organic matter content (p = 0.0046), the highest values in the soil occurred under the N doses of 200 and 300 kg ha−1 (Figure 2).
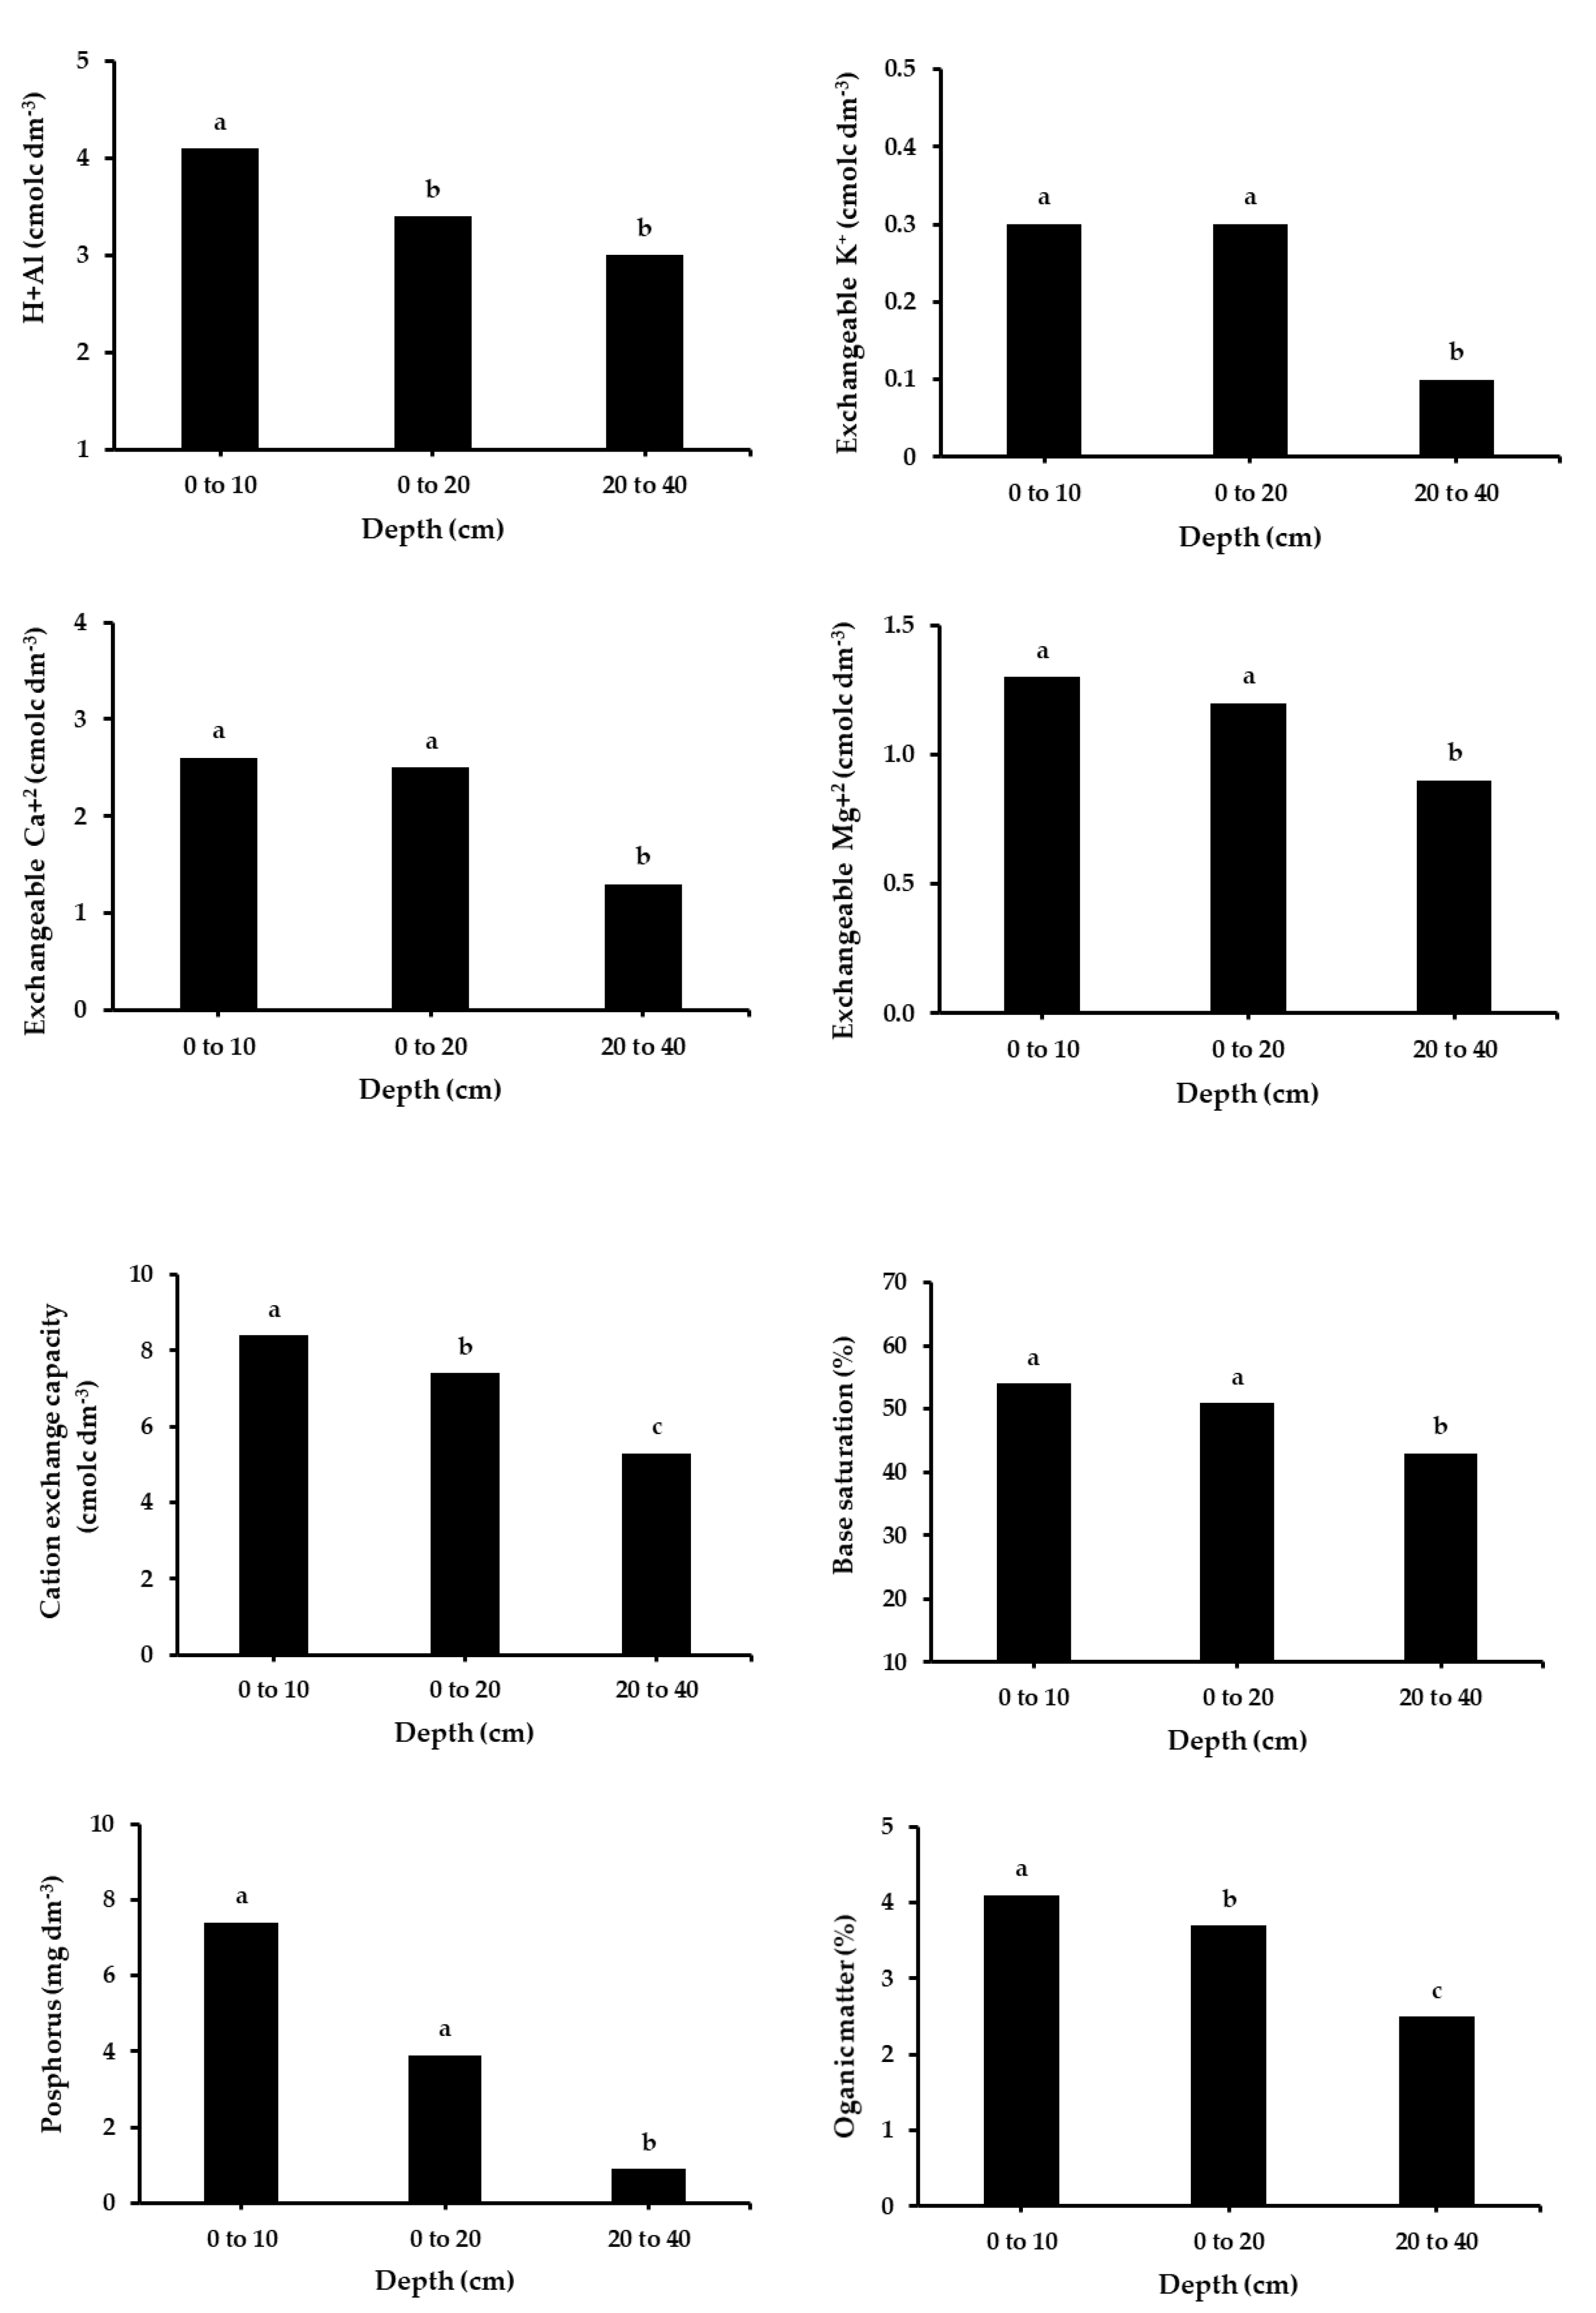
The effect of the depths was not significant (p = 0.0745) for the soil pH (5.2 ± 0.04). The highest values of potential acidity (H Al) (p = 0.0001) were found at the depths of 0 to 10 and 0 to 20 cm, and the lowest of 20 to 40 cm. The levels of exchangeable potassium (p = 0.0001), exchangeable calcium (p = 0.0001), exchangeable magnesium (p = 0.0001) and base saturation (p = 0.0016) were higher at depths of 0 to 10 and 0 to 20. The cation exchange capacity (p = 0.0001), phosphorus levels (p = 0.0001) and organic matter content (p = 0.0001) decreased with increasing depth (Figure 3).

3.2. Soil Density

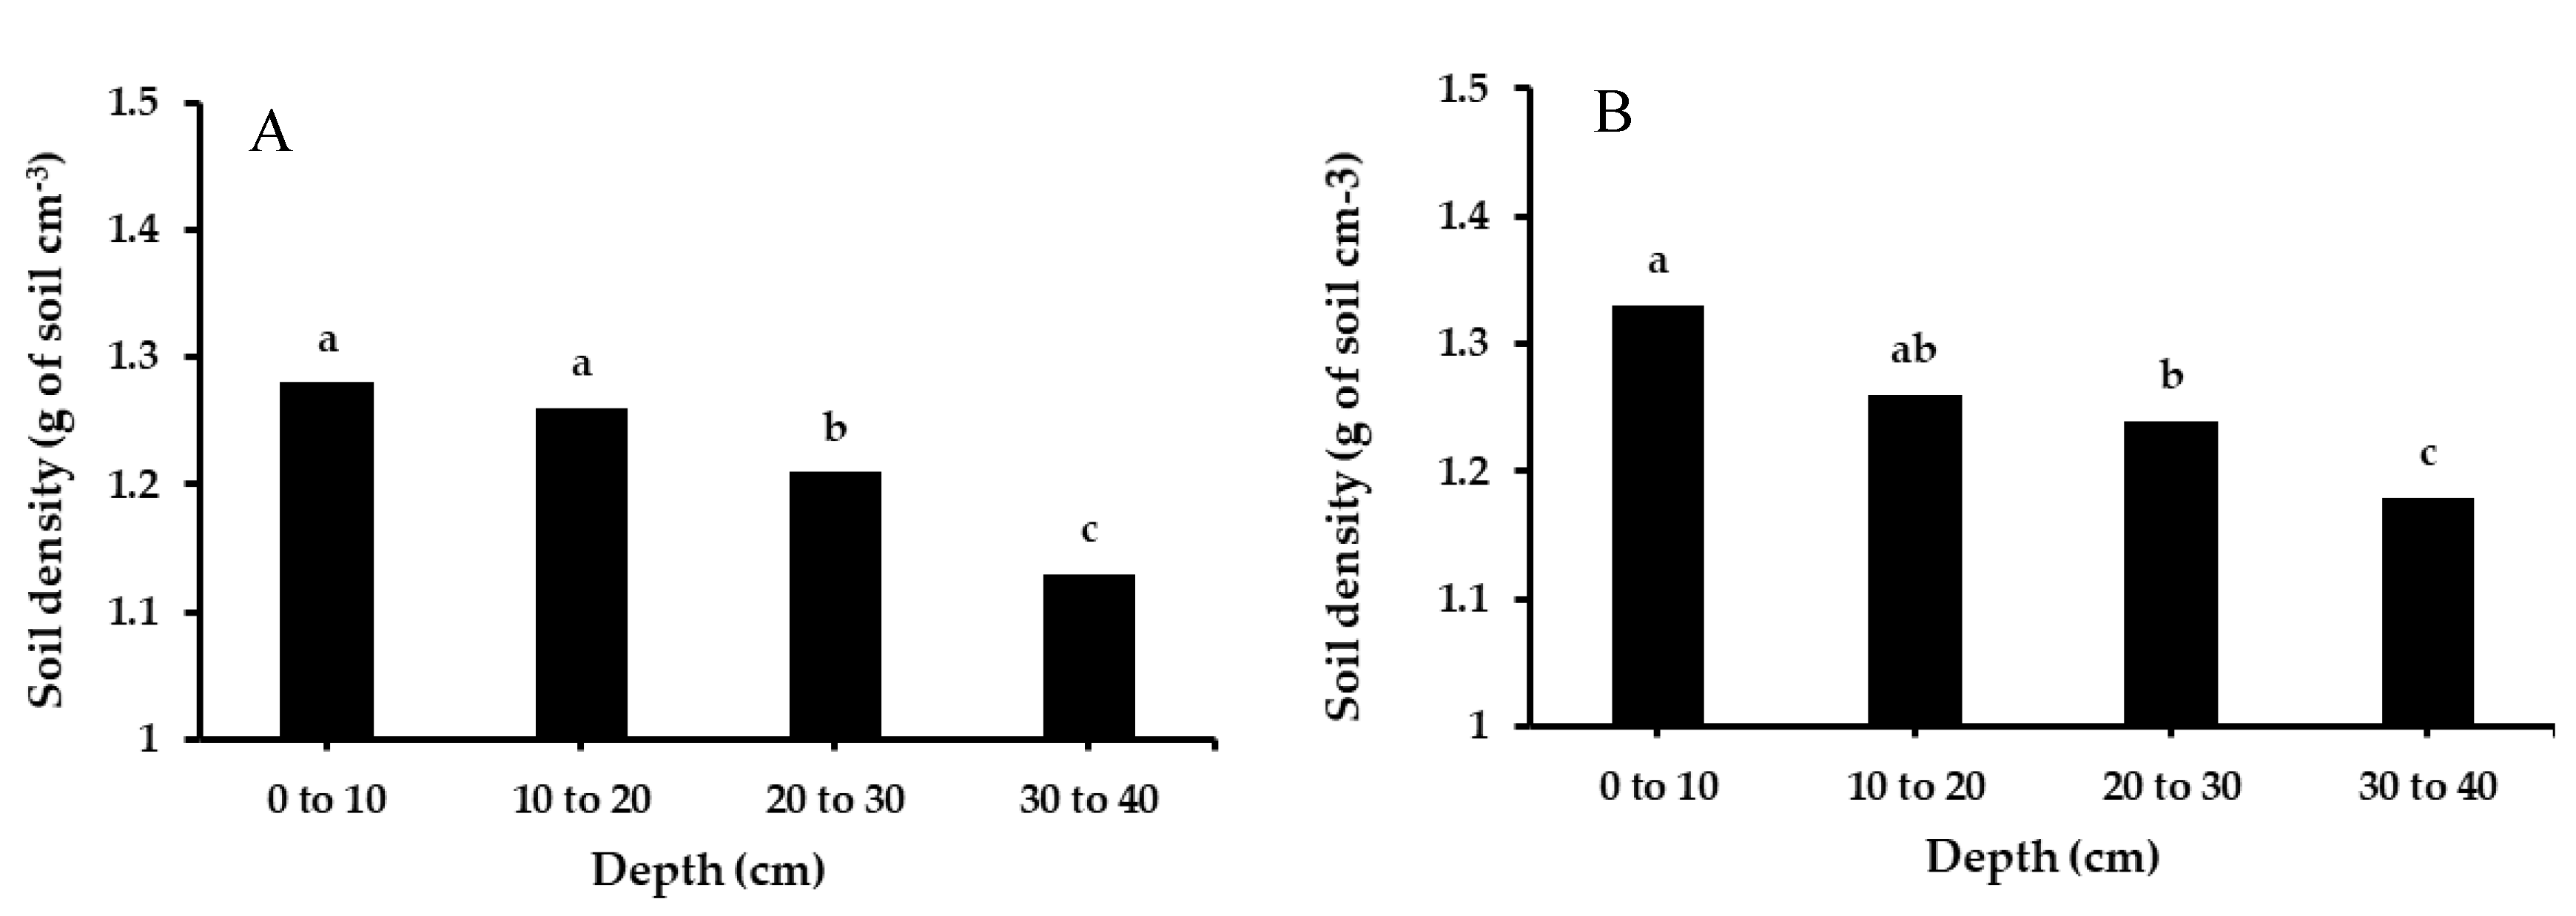
No difference was observed between the N doses for SD under the tussocks (p = 0.1025), which averaged (± standard error) 1.22 ± 0.02 g cm−3; or between the tussocks (p = 0.4666), where SD averaged 1.25 ± 0.04 g cm−3. However, soil density varied according to the depths, under (p = 0.0056) and between (p = 0.0040) the tussocks. Under the tussocks, SD was equal at the depths of 0 to 10 cm and 10 to 20 cm. The SD values found in these layers were greater than at the depth of 20 to 30 cm, and the latter was greater than at 30 to 40 cm. Between the tussocks, the lowest SD was observed at the depth of 30 to 40 cm and the highest at 0 to 10 cm, which in turn was greater than that observed at 20 to 30 cm, whereas intermediate values were found from 10 to 20 cm (Figure 4).

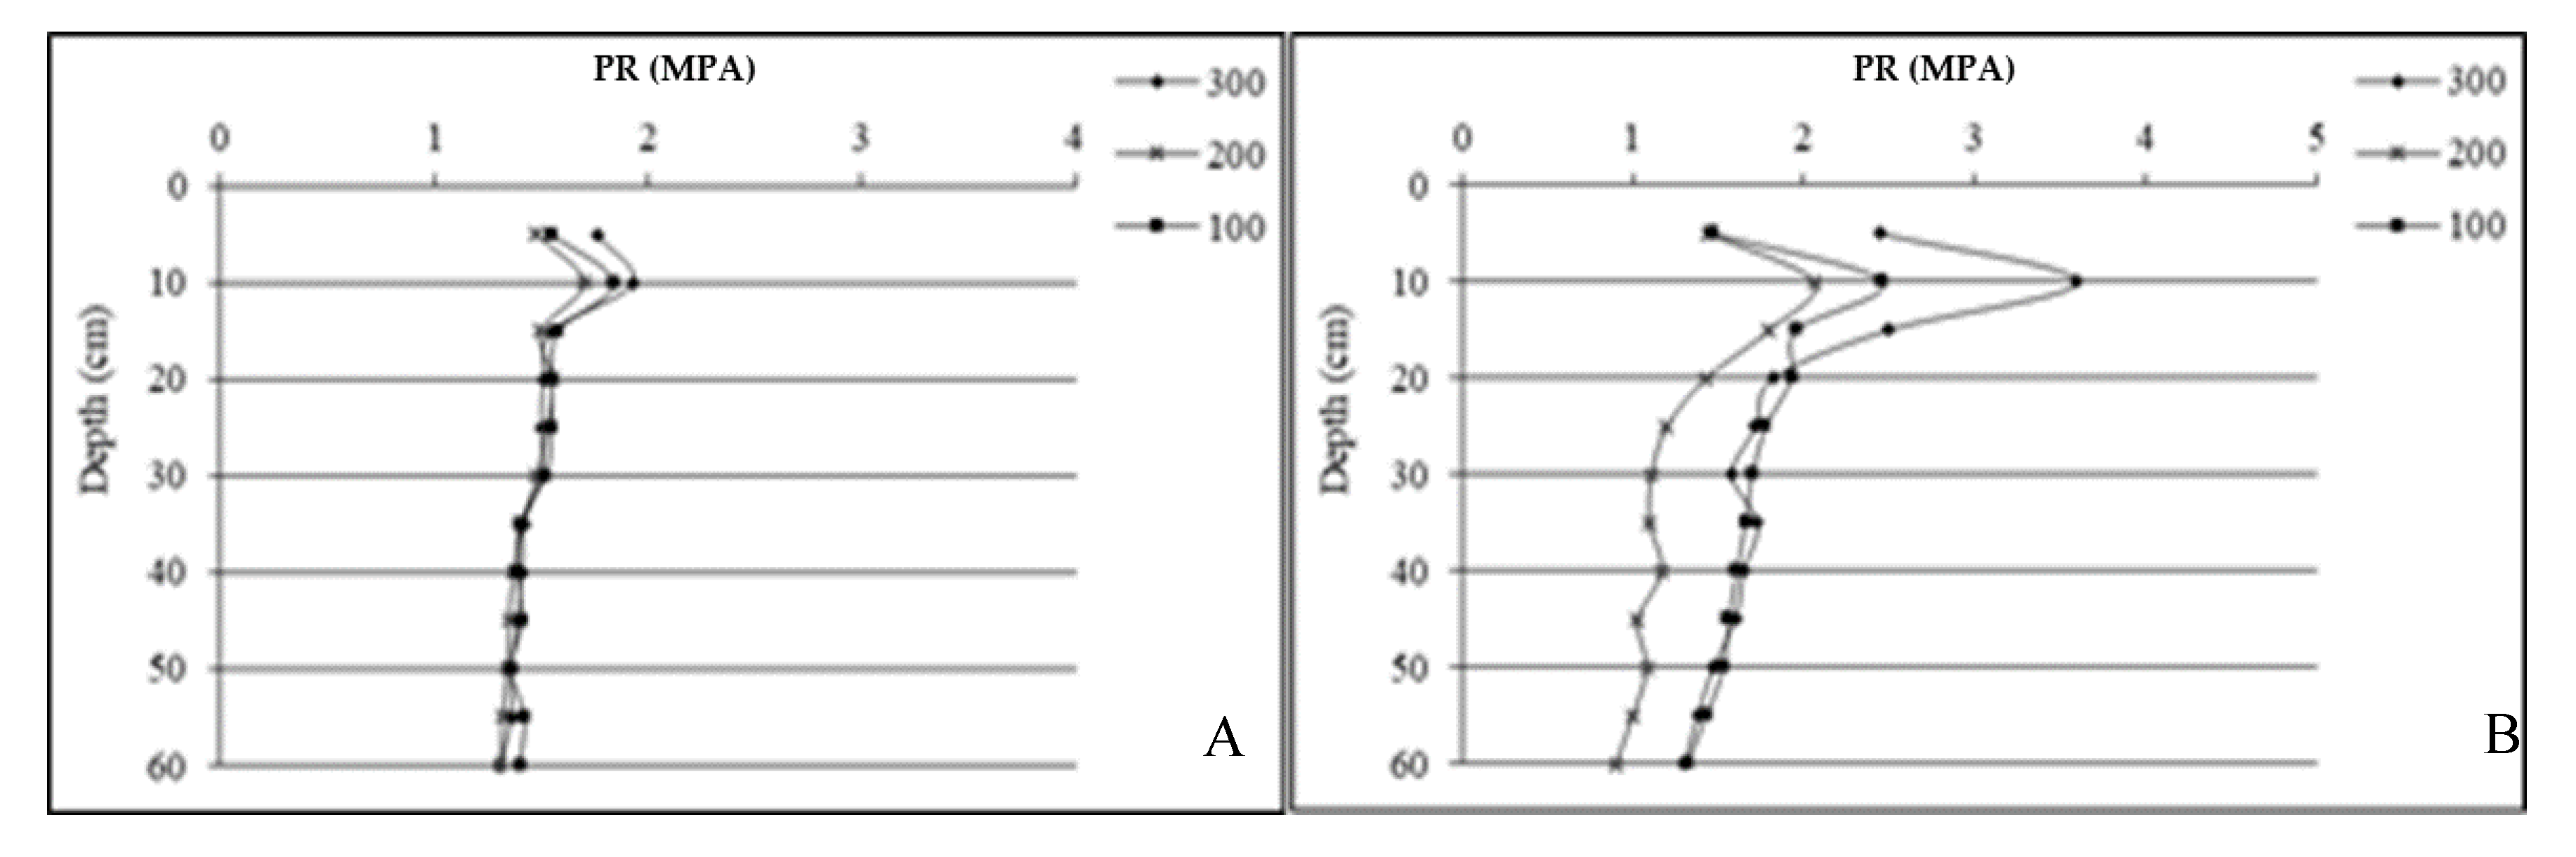
3.3. Soil Penetration Resistance

Penetration resistance did not differ (1.4 ± 0.02 Mpa) between the N doses in the pre-grazing period (p = 0.7026). However, the soil depths affected this variable; the highest value (1.6 ± 0.04 Mpa) was found at the depth of 10 cm.
In the post-grazing period, a difference was observed between the N doses (p = 0.0396) and between depths (p = 0.0009) for PR (Figure 5B). The highest mean PR (1.9 ± 0.07 MPa) was found in the pastures that received 300 kg ha−1 N for three consecutive years. Between the depths, the highest PR was observed at 10 cm (2.7 ± 0.09 MPa).

3.4. Root System

The N doses did not change the root dry mass of guinea grass. Mean values (±standard error) for this variable were 2589.5 ± 466.6 kg ha−1 (p = 0.5613) under and 941.2 ± 276.8 kg ha−1 (p = 0.2773) between the tussocks, respectively.
There was an effect of the depths for the root system variables. The dry mass of roots under the tussocks was greatest at the depth of 0 to 10 cm, which decreased with increasing depth. When the material was sampled outside the tussock, the largest root dry mass was obtained at the depth of 0 to 10 cm and smallest between 30 and 40 cm, with intermediate values found at the other depths (Table 4).

3.5. C and N Stocks

There was no residual effect of N doses for the average (p = 0.1019) and total (p = 0.3677) C stock in the soil (Table 5) under guinea grass. However, the C stocks fluctuated as a function of the depths (p = 0.0001), with the highest values detected at 0 to 10 cm and lowest at the depths of 20 to 30 and 30 to 40 cm.
The total N stock did not change (p = 0.64510) in response to the N doses. However, the average stock was largest (p = 0.0484) in the soil cultivated with guinea grass under the residual effect of the N dose of 300 kg ha−1 (Table 6). As regards the distribution of N in the soil profile, the highest (p = 0.0001) values were observed at the depth of 0 to 10 cm and the lowest from 20 to 30 cm.

4. Discussion

4.1. Soil Chemistry

Few changes were observed in the chemical attributes of soil in response to the N doses, which was likely due to the similar maintenance fertilization management adopted in the years preceding data collection. On the other hand, the pastures under the residual effect of the N dose of 300 kg ha−1 accumulated more herbage (Table 3), which led to a greater extraction of magnesium from the soil, since forage grasses are more efficient in absorbing and accumulating the element in the tissues [21,22,23].
The higher herbage accumulation rates observed in pastures under the residual effect of the N doses of 200 and 300 kg ha−1 (Table 3) allowed for greater nutrient cycling, which translated into higher levels of organic matter, even with the use of a stocking rate, approximately 30% higher. Part of the nutrients extracted by the plant returned to the soil due to the deposition of organic matter from plant senescence [6]. It is estimated that 60% to 70% of the N found in plant biomass is recycled and absorbed again by plants [21].
The reduction in the soil chemical attributes with increasing depth (Figure 3) can be explained by the peculiarity of production systems in tropical pastures, where nutrients are not incorporated at deeper layers by topdressing, but rather usually on the implementation of the pasture.

4.2. Soil Density

The results seen for SD suggest that the higher stocking rates (Table 3) had no impact on the density of a soil with clay contents of 30 to 35%. In an intercrop of bermudagrass and Pinto peanut with different annual doses of N (0, 100 and 200 kg ha−1) in a Red Latosol, there were also no differences for SD, even with a 21.7% increase in stocking rate promoted by the highest N dose in relation to pastures without N fertilization [24]. Likewise, the density of soil in Tanzania grass pastures fertilized with increasing N doses (75, 170 and 250 kg ha−1) did not show significant increases [12]. In both studies, the authors attributed this lack of effect to equal grazing management.
In pasture-based production systems, SD is mostly affected in the uppermost layers due to trampling [25]. This phenomenon was also observed in soils cultivated with Panicum maximum cv. IPR-86 Millennium that received doses of N fertilizer for five years [26].

4.3. Soil Penetration Resistance

The higher stocking rate used in the pastures under the residual effect of the highest N dose (Table 3) resulted in greater trampling, which culminated in increased PR post-grazing. Stocking rate is a critical factor in increasing PR in pasture-based livestock systems [25,27]. Despite the positive correlation of soil density with PR [28], the trampling effect was only observed on PR. In livestock systems, this variable is more sensitive to animal trampling than SD [29].
The higher PR found in the 0–10-cm layer in the pre- and especially in the post-grazing period is associated with the effect of animal trampling on the most superficial layers [30]. The pressure exerted by cattle during grazing can reach 0.21 MPa for animals weighing 500 kg, whereas a bulldozer exerts a pressure of only 0.01 to 0.02 MPa [31].
The highest PR values (Figure 5A) observed post-grazing (residual effect of 300 kg ha−1 of N) are above those considered adequate for full root development [27]. It can thus be inferred that the adopted rest period (25 days), combined with grazing management—which kept the pasture height constant and adequate when the animals left [18,32]—was sufficient for the soil to return to a condition similar to that observed before grazing, when evaluated based on PR. In addition, it is worth stressing that the high PR value observed post-grazing in the 0-to-10-cm layer in the pastures with the highest stocking rate did not negatively influence herbage production (Table 3).

4.4. Root System

Regardless of the residual effect of N, the weekly adjustment in stocking rate aimed at maintaining post-grazing pasture height at 40 to 50 cm [16] promoted uniform structural characteristics to the pasture post-grazing [32], which may have been the cause of the similar results obtained for the root system. The more abrupt changes in the root system of forage grasses can be attributed to changes in pasture management in terms of leaf area index. When this index is greatly altered by defoliation performed by animals, the roots undergo alterations due to the greater mobilization of nutrients to support the growth of the aerial part of the plant [33].
In general, grass roots are concentrated in the uppermost layers of the soil, which is a consequence of a fasciculate root system [33]. The concentration of roots at the depth of 0 to 10 cm (Table 4) may also have been influenced by the higher SD and PR in this soil layer (Figure 4 and Figure 5). The increased SD and mechanical resistance to penetration reduce the amount of macropores [12,26], which the plant roots use as preferential growth paths [24].
The distribution of roots in the soil profile is consistent with results published by several authors [33,34,35], who reported root concentrations of forage grasses always being higher than 50% in the layer of 0 to 10 cm.

4.5. C and N Stocks

The lack of residual effects of N doses on the C stocks could be a consequence of pasture management, which resulted in similar heights (Table 3) and structural characteristics of the pasture post-grazing [30]. Consequently, similarity characteristics were observed in the root system, which is one of the main forms of storage of C in tropical soils [12,36,37].
However, irrespective of the N dose, high C stocks were observed in the soil [38], which can be attributed to the adequate management of the pasture. In another experiment, the C stock in the soil in a properly managed area of Brachiaria pasture was 43.92 mg ha−1, whereas in a native vegetation in the cerrado biome it was 38.05 mg ha−1 and, in degraded pasture, 34.63 mg ha−1, in the top soil layer [39]. These results demonstrate the C-sequestering power of properly managed pastures [40].
The larger average N stock in pastures under the residual effect of 300 kg ha−1 of N is probably associated with the N uptake by the soil in the three years during which N fertilizer was applied. Coupled with this, the highest soil organic matter contents were obtained with this management strategy (Figure 3). In addition, the higher stocking rate observed in pastures under the effect of 300 kg of N may have contributed to these results. Because, the estimated daily fecal excretion of a bovine of approximately 450 kg is 1.97 kg dry matter per animal and the concentration of N in the feces can reach 0.47% [41]. It is noteworthy that organic matter mineralization is an important source of N for plants [42], which may have contributed to the greater herbage accumulation of the pastures under the residual effect of 300 kg ha−1 of N (Table 3).
Stocks up to the soil depth of 40 cm corresponded to 76.7% and 59.6% of the total C and N stocks, respectively. This finding can be explained by the distribution of the roots in the soil profile, as 50% of them were concentrated in the uppermost layer (Table 4), which contributed to the high deposition of C and N in the form of roots.
The responses observed in this research show the importance of properly managing pasture, and it is essential to control the leaf area index after grazing. This management reduced the impact of trampling on soil characteristics, kept the root system uniform, and increased carbon and nitrogen stocks in the soil, regardless of the level of intensification. It is noteworthy that edofoclimatic conditions can alter the response patterns observed in this research. Therefore, research in other regions is essential.

5. Conclusions

(1)
The residual N doses had little interference with the chemical and physical attributes of the medium-texture Red Latosol cultivated with guinea grass grazed by beef cattle in the Cerrado biome.
(2)
The root system of guinea grass up to the depth of 40 cm and the C stock in the soil up to the depth of 100 cm were not influenced by the residual effect of N doses. However, increasing N fertilization rates increase the N stocks in the soil.
(3)
Regardless of the N dose, high C and N stocks were observed in the soil cultivated with guinea grass grazed by beef cattle. Therefore, when adequately managed, intensive animal production systems become important allies of the environment.

Author Contributions

Conceptualization: A.L.C.G., G.d.S.D., D.B.M., and A.R.d.A.; formal analysis: G.d.S.D., and A.L.C.G.; funding acquisition: G.d.S.D., D.B.M., and A.R.d.A.; investigation: A.L.C.G., M.G.P.d.S., G.d.S.D., D.B.M., and A.R.d.A.; methodology: A.L.C.G., M.G.P.d.S., G.d.S.D., D.B.M., and A.R.d.A.; resources: G.d.S.D., D.B.M., and A.R.d.A.; software: A.L.C.G.; supervision: A.L.C.G., V.P.B.E., G.d.S.D., D.B.M., and A.R.d.A.; validation: V.P.B.E., A.L.C.G., G.d.S.D., D.B.M., and A.R.d.A.; writing—original draft: A.L.C.G., writing—review and editing: V.P.B.E., A.L.C.G., G.d.S.D., D.B.M., and A.R.d.A. All authors have read and agreed to the published version of the manuscript.

Funding

This research was funded by the grant number: 001 [Coordination for the Improvement of Higher Education Personnel-Brazil (CAPES)]; National Council for Scientific and Technological Development (CNPq) and Embrapa Beef Cattle.

Acknowledgments

Authors express great thanks to the financial support from Education Personnel-Brazil (CAPES); National Council for Scientific and Technological Development (CNPq); Embrapa Beef Cattle, and support from the Federal University of Mato Grosso do Sul and Federal University of Rio Grande do Norte.

Conflicts of Interest

The authors declare no conflict of interest.

References

  1. Instituto Brasileiro de Geografia e Estatística (IBGE). Censo Agropecuário—Resultados Preliminares; Instituto Brasileiro de Geografia e Estatística (IBGE): Rio de Janeiro, Brazil, 2017; p. 108.
  2. Veras, E.L.L.; Difante, G.S.; Gurgel, A.L.C.; Costa, A.B.G.; Rodrigues, J.G.R.; Costa, C.M.; Emerenciano Neto, J.V.; Pereira, M.G.; Costa, P.R. Tillering and structural characteristics of Panicum cultivars in the Brazilian Semiarid Region. Sustainability 2020, 12, 3849. [Google Scholar] [CrossRef]
  3. Euclides, V.P.B.; Carpejani, G.C.; Montagner, D.B.; Nascimento Junior, D.; Barbosa, R.A.; Difante, G.S. Maintaining post-grazing sward height of Panicum maximum (cv. Mombaça) at 50 cm led to higher animal performance compared with post-grazing height of 30 cm. Grass Forage Sci. 2018, 73, 174–182. [Google Scholar] [CrossRef]
  4. Liu, E.; Yan, C.; Mei, X.; He, W.; Bing, S.H.; Ding, L.; Liu, Q.; Liu, S.; Fan, T. Long-term effect of chemical fertilizer, straw, and manure on soil chemical and biological properties in northwest China. Geoderma 2010, 158, 173–180. [Google Scholar] [CrossRef]
  5. Świtek, S.; Takacs, V.; Sawinska, Z.; Kosiada, T.; Tryjanowskia, P. Mineral nitrogen fertilisers remain a crucial factoreven in theecologica intensification of agriculture. Acta Agric. Scand. Sect. B Soil Plant Sci. 2019, 69, 311–316. [Google Scholar] [CrossRef]
  6. Aušra, A.; Cesevičienė, J.; Velykis, A. Improving mineral nitrogen control by combining catch crops, fertilisation, and straw management in a clay loam soil. Acta Agric. Scand. Sect. B Soil Plant Sci. 2019, 69, 422–431. [Google Scholar] [CrossRef]
  7. Gurgel, A.L.C.; Difante, G.S.; Montagner, D.B.; Araújo, A.R.; Dias, A.M.; Santana, J.C.S.; Rodrigues, J.G.; Pereira, M.G. Nitrogen fertilisation in tropical pastures: What are the impacts of this practice? Aust. J. Crop Sci. 2020, 14, 978–984. [Google Scholar] [CrossRef]
  8. Moreira, L.M.; Santos, M.E.R.; Fonseca, D.M.; Martuscello, J.A.; Morais, R.V.; Mistura, C. Animal production on nitrogen fertilized signalgrass pasture. Arq. Bras. Med. Vet. Zootec. 2011, 63, 914–921. [Google Scholar] [CrossRef]
  9. Meyer, S.; Bergimeier, E.; Becker, T.; Wesche, K.; Krause, B.; Leuschner, C. Detecting long-term losses at the plant community level—Arable fields in Germany revisited. Appl. Veg. Sci. 2015, 18, 432–442. [Google Scholar] [CrossRef]
  10. Bernardi, A.; Silva, A.W.L.; Baretta, D. Meta-analytic study of response of nitrogen fertilization on perennial summer grasses. Arq. Bras. Med. Vet. Zootec. 2018, 70, 545–553. [Google Scholar] [CrossRef] [Green Version]
  11. Sarmento, P.; Rodrigues, L.R.A.; Cruz, C.P.; Lugão, S.M.B.; Campos, F.P.; Centurion, J.F.; Ferreira, M.E. Chemical and physical attributes in an anfisol cultivated with Panicum maximum Jacq. cv. IPR-86 Milênio, under rotational stocking and fertilized with nitrogen. Rev. Bras. Ciênc. Solo 2008, 32, 183–193. [Google Scholar] [CrossRef] [Green Version]
  12. Ferreira, C.J.C.; Tormena, C.A.; Cecato, U.; Franco, H.H.S.; Moreira, W.H.; Galbeiro, S.; Ribeiro, O.L. Soil physical properties under a ‘Tanzânia’ grass pasture fertilized with mineral nitrogen or intercropped with stylosanthes. Pesq. Agropecu. Bras. 2018, 53, 478–486. [Google Scholar] [CrossRef]
  13. Amundson, R.; Berhe, A.A.; Hopmans, J.W.; Olson, C.; Sztein, E.; Sparks, D.L. Soil and human security in the 21st century. Science 2015, 348, 126–1071. [Google Scholar] [CrossRef] [PubMed] [Green Version]
  14. Harden, J.W.; Hugelius, A.G.; Blankinship, J.C.; Bond-Lamberty, B.; Lawrence, C.R.; Loisel, J.; Malhotra, A.; Jackson, R.B.; Ogle, S.; Philips, C.; et al. Networking our science to characterize the state, vulnerabilities, and management opportunities of soil organic matter. Glob. Chang. Biol. 2018, 24, 705–718. [Google Scholar] [CrossRef] [Green Version]
  15. Cardoso, E.L.; Silva, M.L.N.; Silva, C.A.; Curi, N.; Freitas, D.A.F. Carbon and nitrogen stocks in soil in native forests and pasture in the Pantanal biome, Brazil. Pesq. Agropecu. Bras. 2010, 45, 1028–1035. [Google Scholar] [CrossRef]
  16. Instituto Nacional de Meteorologia (INMET). Climatologia: Mapas. 2018. Available online: http://www.inmet.gov.br (accessed on 22 June 2018).
  17. Empresa Brasileira de Pesquisa Agropecuária (EMBAPA). Centro Nacional de Pesquisa de Solos (Rio de Janeiro, RJ), 3rd ed.; Sistema Brasileiro de Classificação de Solos; CNPS: Rio de Janeiro, Brazil, 2013; p. 353. [Google Scholar]
  18. Euclides, V.P.B.; Lopes, F.C.; Nascimento Junior, D.; Da Silva, S.C.; Difante, G.S.; Barbosa, R.A. Steer performance on Panicum maximum (cv. Mombaça) pastures under two grazing intensitie. Anim. Prod. Sci. 2015, 56, 1849–1856. [Google Scholar] [CrossRef]
  19. Empresa Brasileira de Pesquisa Agropecuária (EMBRAPA). Centro Nacional de Pesquisa de Solos (Rio de Janeiro, RJ), 3rd ed.; Manual de métodos de análises de Solos; CNPS: Rio de Janeiro, Brazil, 2017; p. 573. [Google Scholar]
  20. Busscher, W.J.; Bauer, P.J.; Camp, C.R.; Sojka, R.E. Correction of cone index for soil water content differences in a Coastal Plain soil. Soil. Till. Res. 1997, 43, 205–217. [Google Scholar] [CrossRef]
  21. Braz, A.J.B.P.; Silveira, P.M.; Kliemann, H.J.; Zimmermann, F.J.P. Nutrient accumulation in leaves of millet, Brachiaria and Guineagrass. Pesqui. Agropecu. Trop. 2004, 34, 83–87. [Google Scholar] [CrossRef]
  22. Andriole, I.; Prado, R.M. Cover plants in pre-harvest and nitrogen in soil fertility in different layers with corn in no tillage and conventional system. Semin. Cienc. Agrar. 2012, 33, 963–978. [Google Scholar] [CrossRef]
  23. Ensinas, S.C.; Serra, A.P.; Marchetti, M.E.; Silva, E.F.; Lourente, E.R.P.; Prado, E.A.F.; Matos, F.A.; Altomar, P.H.; Martinez, M.A.; Potrich, D.C.; et al. Cover crops affect the soil chemical properties under no-till system. Aust. J. Crop Sci. 2016, 10, 1104–1111. [Google Scholar] [CrossRef]
  24. Fidalski, J.; Tormena, C.T.; Cecato, U.; Barbero, L.M.; Lugão, S.M.B.; Costa, M.A.T. Soil physical quality in a fertilized pasture under continuous grazing. Pesq. Agropecu. Bras. 2008, 43, 1583–1590. [Google Scholar] [CrossRef]
  25. Stavi, I.; Lavee, H.; Ungar, E.; Sarah, P. Grazing-induced modification of a Semi-Arid Rangeland from a two-phase to a three-phase mosaic geo-ecosystem. Arid. Land. Res. Manag. 2012, 26, 79–83. [Google Scholar] [CrossRef]
  26. Sarmento, P.; Rodrigues, L.R.A.; Lugão, S.M.B.; Cruz, M.C.P.; Campos, F.P.; Ferreira, M.E.; Oliveira, R.F. Root system of Panicum maximum Jacq. cv. IPR-86 Milênio fertilized with nitrogen and submitted to rotational stocking. Rev. Bras. Zootec. 2008, 37, 27–34. [Google Scholar] [CrossRef] [Green Version]
  27. Leão, T.P.; Silva, A.P.; Macedo, M.C.; Imhoff, S.; Euclides, V.P.B. Least limiting water range in the evaluation of continuous and short-duration grazing systems. Rev. Bras. Ciênc. Solo 2004, 28, 415–423. [Google Scholar] [CrossRef] [Green Version]
  28. Conte, O.; Flores, J.P.C.; Cassol, L.C.; Anghinoni, I.; Carvalho, P.C.F.; Levien, R.; Wesp, C.L. Evolution of soil physical attributes in an integrated crop-livestock system. Pesq. Agropecu. Bras. 2011, 46, 1301–1309. [Google Scholar] [CrossRef] [Green Version]
  29. Torres, J.L.R.; Rodrigues Junior, D.J.; Vieira, D.M.S. Changes in physical characteristics of soil as a function of irrigation and rotational grazing. IRRIGA 2013, 18, 558–571. [Google Scholar] [CrossRef] [Green Version]
  30. Costa, M.A.T.; Tormena, C.A.; Lugão, S.M.B.; Fidalski, J.; Nascimento, W.G.; Medeiros, F.M. Soil resistance to penetration and forage and root production at different grazing intensities. Rev. Bras. Ciênc. Solo 2012, 36, 993–1004. [Google Scholar] [CrossRef] [Green Version]
  31. Torres, J.L.R.; Rodrigues Junior, D.J.; Sene, G.A.; Jaime, D.G.; Vieira, D.M.S. Penetration resistance in area of pasture tifton influenced by trampling and irrigation. Biosci. J. 2012, 28, 232–239. [Google Scholar]
  32. Gurgel, A.L.C.; Difante, G.S.; Montagner, D.B.; Araujo, A.R.; Euclides, V.P.B. The Effect of Residual Nitrogen Fertilization on the Yield Components, Forage Quality, and Performance of Beef Cattle Fed on Mombaça Grass. Rev. Fac. Cienc. Agrar. Uncuyo 2020, XX, 1–17. Available online: http://revistas.uncuyo.edu.ar/ojs/index.php/RFCA/article/view/3793 (accessed on 15 October 2020).
  33. Beloni, T.; Piotto, V.C.; Mari, G.C.; Pinheiro, A.A.; Tormena, C.A.; Cecato, U. Root system and resistance to penetration of Mombaça grass fertilized with nitrogen and irrigated. Semin. Cienc. Agrar. 2016, 37, 3243–3252. [Google Scholar] [CrossRef] [Green Version]
  34. Soares Filho, C.V.; Cecato, U.; Ribeiro, O.L.; Roma, C.F.C.; Jobim, C.C.; Beloni, T.; Perri, S.H.V. Root system and root and stem base organic reserves of pasture Tanzania grass fertilizer with nitrogen under grazing. Semin. Cienc. Agrar. 2013, 34, 2415–2426. [Google Scholar] [CrossRef] [Green Version]
  35. Barros, A.C.C.; Almeida, J.C.C.; Carmargo Filho, S.T.; Carvalho, C.A.B.; Campana, L.L.; Morais, L.F. Root dry matter mass and distribution of Florico grass under different grazing strategies. Pesq. Agropecu. Bras. 2017, 52, 1276–1285. [Google Scholar] [CrossRef]
  36. Silva Júnior, M.L.; Sarrazin, T.D.T.M.; Melo, V.S.; Martins, P.F.S.; Santos, E.R.; Carvalho, C.J.R. Carbon content in Amazonian Oxisols after Forest conversion to pasture. Rev. Bras. Ciênc. Solo 2009, 33, 1603–1611. [Google Scholar] [CrossRef]
  37. Maia, S.M.F.; Gonzaga, G.B.M.; Silva, L.K.S.; Lyra, G.B.; Gomes, T.C.A. Soil organic carbon temperature sensitivity of different soil types and land use systems in the Brazilian semiarid region. Soil. Use. Manag. 2019, 35, 433–442. [Google Scholar] [CrossRef]
  38. Assad, E.D.; Pinto, H.S.; Martins, S.C.; Groppo, J.D.; Salgado, P.R.; Evangelista, B.; Vasconcellos, E.; Sano, E.E.; Pavão, E.; Luna, R.; et al. Changes in soil carbon stocks in Brazil due to land use: Paired site comparisons and regional pasture soil survey. Biogeosciences 2013, 10, 6141–6160. [Google Scholar] [CrossRef] [Green Version]
  39. Rosendo, J.S.; Rosa, R. Comparison of the estimated C stock in pastures and native Cerrado vegetation. Soc. Nat. 2012, 24, 359–376. [Google Scholar] [CrossRef] [Green Version]
  40. Savian, J.V.; Schons, R.M.T.; Marchi, D.E.; Freita, T.S.; Silva Neto, G.F.; Mezzalira, J.C.; Berndt, A.; Bayer, C.; Carvalho, P.C.F. Rotatinuous stocking: A grazing management innovation that high potential to mitigate methane emissions by sheep. J. Clean. Prod. 2018, 186, 602–608. [Google Scholar] [CrossRef]
  41. Braz, S.P.; Nascimento Junior, D.; Cantarutti, R.B.; Regazzi, A.J.; Martins, C.E.; Fonseca, D.M.; Barbosa, R.A. Quantitative aspects of nutrients recycling in the feces of bovines grazing a pasture of Brachiaria decumbens in the zona da Mata region of Minas Gerais. Rev. Bras. Zootec. 2002, 31, 858–865. [Google Scholar] [CrossRef]
  42. Buysse, P.; Roisin, C.; Aubinet, M. Fifty years of contrasted residue management of an agricultural crop: Impacts on the soil carbon budget and on soil heterotrophic respiration. Agric. Ecosyst. Environ. 2013, 167, 52–59. [Google Scholar] [CrossRef]
Figure 1. Geographic location of the experimental area.
Sustainability 12 09381 g001
Figure 2. Exchangeable magnesium and organic matter contents of an Oxisol cultivated with guinea-grass pastures under the residual effect of nitrogen. Different letters indicate a significant difference (p < 0.05) between the nitrogen levels by Tukey’s test of means.
Sustainability 12 09381 g002
Figure 3. Chemical properties of a Red Latosol cultivated with guinea-grass pastures under the residual effect of nitrogen doses. Different letters indicate a significant difference (p <0.05) between the depths of the soil by the Tukey means test.
Sustainability 12 09381 g003
Figure 4. Density of an Oxisol cultivated with guinea-grass pastures under the residual effect of nitrogen and grazed by beef cattle, at different depths. Under (A) and between (B) tussocks. Different letters indicate significant differences (p < 0.05) by Tukey’s test.
Sustainability 12 09381 g004
Figure 5. Mechanical resistance of soil to penetration (PR) in a Red Latosol cultivated with guinea-grass pastures under residual effect of nitrogen and grazed by beef cattle, at different depths, in the pre-grazing (A) and post-grazing (B) periods.
Sustainability 12 09381 g005
Table 1. Precipitation and average, minimum, and maximum temperatures during the experimental period.
MonthsMonthly Rainfall (mm)Average Temperature (°C)Maximum Temperature (°C)Minimum Temperature (°C)
November 2017315.825.330.720.0
December 2017225.426.630.422.8
January 2018138.425.830.721.2
February 2018199.825.630.220.9
March 201897.426.231.421.7
April 201889.625.531.421.7
May 201837.423.429.417.4
Table 2. Chemical characteristics of the soil in the experimental area at the depths of 0–10 and 0–20 cm.
Chemical Characteristic20142017
100 kg ha−1 N200 kg ha−1 N300 kg ha−1 N100 kg ha−1 N200 kg ha−1 N300 kg ha−1 N
0–100–200–100–200–100–200–100–200–100–200–100–20
pH-CaCl25.96.05.85.95.95.95.45.65.45.65.35.5
Ca++ (cmolc dm−3)4.44.34.13.94.24.12.62.32.52.62.32.2
Mg++ (cmolc dm−3)1.21.11.121.11.11.11.41.31.31.31.21.1
H+Al (cmolc dm−3)3.93.53.53.33.73.83.32.82.93.14.33.4
SB (cmolc dm−3)5.95.85.55.25.95.64.34.04.14.13.83.7
CEC (cmolc dm−3)9.99.39.08.59.69.47.66.97.17.28.17.0
BS (%)60.262.361.261.261.359.856.958.658.557.047.352.4
AS (%)0.00.00.00.00.00.00.30.50.40.30.50.4
OM (%)4.14.03.93.44.34.24.54.03.83.74.33.9
P-Mehlich 1 (mg dm−3)4.02.36.62.95.32.86.53.810.16.48.73.7
K+-Mehlich 1 (mg dm−3)140.8148.6101.7117.3234.6160.3156.4129.0132.9101.7152.5113.4
SB: sum of bases; CEC: cation-exchange capacity; BS: base saturation; AS: aluminum saturation; OM: organic matter.
Table 3. Mean indicators of animal and herbage production in guinea-grass pastures under the residual effect of nitrogen.
VariableN Dose (kg ha−1)
100200300
Herbage accumulation rate (kg ha−1 per day)26.736.343.4
Pre-grazing herbage mass (kg ha−1 DM)3371.83637.63853.9
Post-grazing canopy height (cm)49.048.050.1
Stocking rate (AU ha−1) *2.73.14.0
* AU = animal unit of 450 kg.
Table 4. Root dry mass and root mass distribution of guinea grass under the residual effect of nitrogen, at different depths.
VariableDepth (cm)SEMP-Value
0–1010–2020–3030–40
Under tussock
Root dry mass (kg/ha)5633.0 a2418.4 b1472.6 c833.0 d277.7<0.001
Root mass distribution (%)54.9 a23.2 b13.5 c8.5 d1.588<0.001
Out of tussock
Root dry mass (kg/ha)1372.3 a976.3 a,b805.0 a,b610.8 b77,7<0.001
Root mass distribution (%)37.2 a26.6 a,b20.7 a,b15.4 b1.221<0.001
a, b, c, d Means followed by different letters in the row differ (p < 0.05) by Tukey’s test. SEM: standard error of the mean.
Table 5. Carbon stock (mg ha−1) in an Oxisol cultivated with guinea-grass pastures at different depths, under the residual effect of nitrogen.
Depth (cm)N Dose (kg ha−1)Mean
100200300
0–1027.828.827.728.1 a
10–2019.021.819.920.2 c
20–3014.414.616.215.0 d
30–4013.413.513.313.4 d
40–6022.720.626.323.2 b
60–8019.218.820.919.6 c
80–10016.517.420.418.2 c
Mean19.4 A19.0 A20.7 A
Total *130.8 A135.5 A136.7 A134.3
Means followed by different lowercase letters (a, b, c, d) in the columns differ from each other by the Tukey test (p < 0.05). Means followed by equal capital letters (A) on the line do not differ by Tukey’s test (p < 0.05). * Carbon stock at a depth of one meter.
Table 6. Nitrogen stock (mg ha−1) in a Red Latosol cultivated with guinea-grass pastures under the residual effect of nitrogen, at different depths.
Depth (cm)N Dose (kg ha−1)Mean
100200300
0–102.52.62.62.6 a
10–202.12.12.02.1 b
20–301.01.11.21.1 e
30–401.00.91.01.0 e
40–601.41.61.71.5 c,d
60–801.31.31.61.4 d
80–1001.61.71.91.7 c
Mean1.5 C1.6 B1.7 A
Total10.8 A11.0 A11.6 A11.3
Means followed by different lowercase letters (a, b, c, d) in the columns differ from each other by the Tukey test (p < 0.05). Means followed by equal capital letters (A) on the line do not differ by Tukey’s test (p < 0.05). * Carbon stock at a depth of one meter.
Publisher’s Note: MDPI stays neutral with regard to jurisdictional claims in published maps and institutional affiliations.

