Article

A Multi-Decadal Spatial Analysis of Demographic Vulnerability to Urban Flood: A Case Study of Birmingham City, USA

by
Mohammad Khalid Hossain
and
Qingmin Meng
*
Department of Geosciences, Mississippi State University, Mississippi State, MS 39762, USA
*
Author to whom correspondence should be addressed.
Sustainability 2020, 12(21), 9139; https://doi.org/10.3390/su12219139
Submission received: 8 October 2020 / Revised: 31 October 2020 / Accepted: 1 November 2020 / Published: 3 November 2020
(This article belongs to the Special Issue Climate Change and Sustainable Urban Environmental Planning)

Abstract

:
Flooding, including hurricanes and tornadoes, accounts for approximately 40 percent of natural disasters worldwide and kills 100 people on average in the United States each year, which is more than any other single weather hazard. Since flooding is a common hazard in the U.S. and flood-related casualties have been increasing in recent years, it is important to understand the spatial patterns of different vulnerable population groups in the flooding regions. To achieve this objective, spatial scan statistics were used to identify the spatial clusters of different demographic groups (children and elderly, poor, White, African American, and Hispanic) in the 100-year floodplain areas of Birmingham. Using the decennial census data from 1990 to 2015, this research examined whether these vulnerable population groups had aggregated more in the flooding areas or moved away from the flooding areas in the past thirty years. The findings of this research indicate that most of the minorities are increasingly aggregating in the floodplain areas of Village Creek in Birmingham. The findings also suggest that the non-minorities are moving away from the flooding regions in Birmingham, AL. As part of the minorities and non-minorities group, approximately 50 percent of African Americans and 4 percent of White populations aggregated in the Village Creek flooding areas in 2015. Although the percentage of White populations is very low, the findings suggest that they are still exposed to floods. The multi-decadal analysis of flood risk will help the local governments to understand which population groups could be more affected by floods historically and need more attention in future flood hazards. This understanding will help them prepare for future flood hazards by allocating resources efficiently among the different racial and ethnic groups.

1. Introduction

Floods are considered the most devastating natural hazard worldwide because they can destroy human lives and properties [1,2,3]. In the water year 2019 (1 October 2018 to 30 September 2019), floods alone in the United States caused USD 3.93 billion property damages and 101 deaths [4]. Flash floods are very common in urban areas, causing the highest number of deaths in the United States [5,6]. The Southeast region of the United States mostly faces flash floods because of the extreme rainfall caused by tropical storms and hurricanes [7]. Recent studies also found that the urban areas are expanding in the Southeast region, and communities in this region are less resilient to natural disasters [8,9]. Although flash flood is more common in the Southeastern United States, this region has recently faced hurricane-induced floods such as Hurricane Irma, Maria, and Harvey. According to the National Centers for Environmental Information [10], Hurricane Irma caused USD 50 billion in property damages and 84 deaths in the United States [11]. It has also been estimated that, out of the USD 50 billion, approximately USD 30 to USD 35 billion property damage was caused by floods that include residential and commercial properties [11]. Hurricane Harvey was more devasting than Hurricane Irma. Houston, in Texas, faced the record of urban flooding as much of the rain fell in the greater Houston Metropolitan area due to Hurricane Harvey [12,13]. Federal Emergency Management Agency (FEMA) estimated that more than 80,000 homes were affected, and professionals and volunteers rescued more than 120,000 people in the Houston area [14]. After Hurricane Katrina, which caused USD 161 billion in property damage, Hurricane Harvey is the worst hurricane that caused more than USD 125 billion property damages and 64 deaths [12]. However, the cumulative cost of the worst five hurricanes (Hurricane Katrina, Harvey, Maria, Sandy, and Irma) in the United States between 2005 and 2017 caused a total of USD 497 billion property damages [15].
Although the United States experiences flood hazards every year, not every population group is equally exposed to flood hazards [16]. There is a general concept that poor people and minority neighborhoods are more exposed to environmental hazards and natural disasters [17,18,19]. Some studies suggest that the most inferior groups in developing countries tend to live in more hazardous areas because they have the least choice about where to live [20]. Recent studies also found a positive correlation between elevation and poor neighborhoods [21]. These studies revealed that minority neighborhoods, such as racial–ethnic minorities, tend to live in low elevated areas that make them more vulnerable to flooding [21,22]. In social vulnerability research, most of the studies considered the children and elderly population, poor people, and the minority population, such as African American and Hispanic populations, as the most socially vulnerable population [17,23,24,25,26]. The mortality rates are higher for socially vulnerable groups as they experience more adverse consequences of flood disaster [27,28,29]. However, recent social vulnerability research shows that not only minority populations, but also White populations are exposed to flood hazards [30]. However, during the Hurricane Frederick, White communities received more food, assistance, and shelter than black communities [31]; emergency response workers gave priority to White communities while restoring the power after the disaster event [31]. The racial, ethnic, and socio-economic factors also play a vital role during the recovery stage of a disaster. Usually, low-income households face more difficulty recovering from the disaster as they have little or no savings and may not have disaster insurance. The recovery process is also slow for racial–ethnic minorities, and low-income households as they lack access to resources whereas the recovery process is much faster in White communities as they know how the system works and can easily access the information [32,33]. There are some other studies that also have similar findings that the socially advantaged people experience more pre-event exposure to flood hazards than the socially disadvantaged people [34,35,36,37,38].
The literature review supports that both minority and non-minority populations experience flood hazards. Therefore, the research was designed to identify whether these minority and non-minority population groups are aggregating more or moving away from the flood hazard areas over the past thirty years. In this research, the spatial scan statistics method was used to identify the spatial cluster of children and elderly, poor people, White, and minority populations in the 100-year floodplain areas of Birmingham, AL, USA. Kulldorff (1997) developed a spatial scan statistic for identifying spatial cluster and many studies have already used it to detect spatial cluster in a geographic region [39,40,41,42,43,44,45,46,47]. By using Spatial Scan Statistics, first, the spatial high and low clusters were identified for each population group at each decennial census year and mapped them using GIS. Then, the number of population and number of residential buildings were calculated at each cluster for all census years in the past thirty years. The findings of this research improve local governments’ and communities’ understanding of the shifting patterns spatially between the minorities and the non-minorities population due to urban flood hazards. The understanding of temporal changes in the spatial patterns will help the local governments and communities to understand which population groups have been affected most over the decades and in the future due to floods in Birmingham city.

2. Study Area

Birmingham is the largest Metropolitan Statistical Area in Alabama, which covers approximately 163 square miles. It is located in North-Central Alabama and is also known as the most populous city in Alabama, with approximately 209,403 people [48]. In the United States, the African American and Hispanic population groups are considered as minorities, and the White population group is considered non-minority. The city of Birmingham is predominantly African American, with 70.5 percent of the total population; White and Asian makeup approximately 25.3 percent and 0.9 percent of the total population, respectively [48]. Hispanic or Latino can be of any race, and they make up approximately 3.7 percent of the total population [48]. This city faces a lot of environmental hazards primarily from rain, high winds, and tornado. Flash flooding is very common in Birmingham city due to extreme rainfall in spring and summer months. Birmingham is the most vulnerable to flash floods because of urban development and the high density of the population. Urbanization of areas contributes to flooding by reducing the water infiltration rate and removing vegetation that increases surface runoff from rainfall [49]. Past studies reveal that the urban areas with high population density possess a higher risk to flooding [50,51].
Birmingham has a total of ten watersheds such as Village Creek, Valley Creek, Five Mile Creek, Cahaba River, Little Cahaba River, Shades Creek, Little Shades Creek, Turkey Creek, Cane Creek, and Big Black Creek. Each of these watersheds at least contains some portion of 100-year floodplain areas that covers more than 8000 acres areas of the Birmingham city limits. Among these creeks, Village Creek, Valley Creek, and Five Mile Creek possess a higher risk of flash flooding because these watersheds are located in a highly urbanized area. These areas also have a history of repetitive flooding in the past, especially the Village Creek area, where several residential areas repeatedly flooded in the past.
FEMA usually defines the 100-year floodplain area, and the Village Creek area in Birmingham makes up approximately 53 percent of Birmingham’s Special Flood Hazard Area [52]. Village Creek area has a history of repetitive flooding, and this area has flooded more than thirty times between 1977 and 2015 [52,53]. Apart from Village Creek, Valley Creek also has a history of repetitive flooding. The notable historical flood events occurred in Valley Creek in April 1979, December 1983, September 2011, April 2014, December 2015, December 2016, April 2017, and April 2018 [54]. The frequency of flooding in this area possesses a significant threat to human lives and their properties. Since Birmingham, AL, has a repetitive history of flooding, Birmingham’s 100-year floodplain areas are considered as the study area (Figure 1).

3. Methods

This research consists of two steps of analysis: (1) detect the spatial cluster for each demographic factor using Spatial Scan Statistic for each census year, map them using GIS, and (2) calculate the population of each demographic factor and number of residential buildings that fall within each spatial cluster.

3.1. Data Sources

In this research, we collected and analyzed three types of data: flood data, census data, and building data. Birmingham area’s 100-year floodplain data was collected from FEMA’s website [55]. Here, the term “100-year floodplain” means there is a 1 percent chance of annual flood in that floodplain areas. FEMA usually defined the floodplain areas based on the various level of risk. The 100-year floodplain areas are considered high flood risk areas, whereas 500-year floodplain areas are considered moderate to low-risk areas [56]. FEMA identified these high flood risk areas in their Flood Insurance Rate Map (FIRM) and labeled it as Special Flood Hazard Area (SFHA). These SFHA areas are further divided into different flood zones, such as Zone A, AE, AH, AO, AR, and A99 [56].
In this research, we considered five demographic factors, such as children and the elderly, people that are living below the poverty level, White, and minority populations (e.g., African American and Hispanic) who are vulnerable to flood hazards. Each demographic factor was analyzed for each decennial census year, such as 1990, 2000, 2010, and 2015. Since the data of the decennial census year, 2020, are not available yet, the American Community Survey data of 2015 were used. Census block group data were collected from the Census Bureau and Integrated Public Use Microdata Series National Historical Geographic Information System (IPUMS NHGIS) website [57,58].
The buildings’ data were collected from the City of Birmingham’s office. In this research, we considered only the residential buildings to calculate and estimate the number of populations that lived in each residential unit. Four types of residential units were considered, such as single-family detached, single-family attached, duplex, and multi-family rooming. The populations at each residential unit were estimated for each decennial census year. To estimate the population, first, we did the spatial join between the residential buildings and the block group. The number of persons per household in each block group was calculated and multiplied with the number of households to obtain the total number of populations; more details of the population estimation method have been explained in [22]. Based on the total number of populations, the numbers of children and elderly, poor, White, African American, and the Hispanic population at each residential unit were estimated (Table 1). This process has been repeated for each decennial census year. However, in this research, we excluded the Little Cahaba River and Black Warrior areas since these areas do not have any residential buildings. The Shades Creek area was also excluded from the analysis as this area did not have any residential buildings in 1990, and very few residential buildings were there in other decennial census years.

3.2. Spatial Cluster Detection Using Spatial Scan Statistics

The spatial scan statistic has been widely used to identify the spatial clusters and their approximate locations in a geographic region [39]. Kulldorff’s spatial scan statistic typically uses a circular shape window to identify high-risk clusters by using either purely spatial, purely temporal, or combined both spatial–temporal methods. It is also used to test whether the distribution of events is random or clustered. Meng and Cieszewski (2006) used spatial scan statistic to temporally examine significant spatial clusters of tree mortality and their changes in patterns across the State of Georgia [46]. The log-likelihood ratio (LLR) is calculated by moving the circular window over the study area in the spatial scan statistic. The circular window, which has the highest log-likelihood ratio, is considered as the most likely cluster. However, it could identify more than one cluster, and in that case, the cluster with the highest maximum LLR is considered the most likely cluster. The p-value for the most likely cluster is calculated by using the Monte Carlo 999 iterations. The Monte Carlo 999 iterations were used to obtain the p-values. The number of simulations were restricted to 999, so it is always clear whether to reject or not reject the null hypothesis. Here, the p-value less than 0.05 is considered as statistically significant.
There are some limitations to using spatial scan statistics. For instance, the circular scanning window is unable to detect irregularly shaped clusters [59]. The irregularly shaped clusters could be identified as a series of circular clusters. The small circles could miss much of the cells, and the large circles could include many unwanted cells. Although the spatial scan statistics have some limitations, it has been used over other spatial cluster detection methods such as spatial filtering and local Moran’s I. One of the main advantages of using spatial scan statistics over the spatial filtering method is identifying the cluster, which is not statistically significant [60]. In addition, compared to local Moran’s I, spatial scan statistics can identify the largest and most circular clusters that inform general policing initiatives and highlight possible variables to be included in confirmatory research [61]; furthermore, the objective of both Moran’s I and local Moran’s I is to detect whether similar values are clustered (positive spatial autocorrelation) or dissimilar values are clustered (negative spatial autocorrelation), while in this study values of an attribute do not need to be considered because a pure point pattern analysis is required to identify the significant aggregations of nominal data (e.g., Hispanic or African American).
In this research, the spatial scan statistic was used to identify each population group’s spatial cluster and their approximate locations in the 100-year floodplain areas. The point data were used, which have attributes of the number of populations for each population group living in residential units. Since we are interested in the number of populations, whether these population groups are aggregated in the floodplain areas or not, the SaTScan software (version 9.6, Martin Kulldorff and Information Management Services Inc., Boston, MA, USA) [62] was used, using a purely spatial Poisson model to identify the high or low cluster by a circular window. The high cluster identifies that the population is aggregating more in the floodplain areas, whereas the low cluster identifies that they are aggregating less in the floodplain areas. Based on the p-value, the cluster was categorized into four categories, such as high cluster (significant), high cluster (not significant), low cluster (significant), and low cluster (not significant). After identifying the cluster for the population groups for each decennial census year, we compared whether these population groups are more aggregated in the floodplain areas or have moved away from the floodplain areas over the past 30 years. The number of populations and residential buildings was also calculated at each cluster, which helps understand the percentage of population and buildings at higher risk of flooding. Finally, the result from SaTScan was mapped using the ArcGIS to identify clusters in the floodplain areas.

4. Results

4.1. Spatial Cluster of Demographic Factors in Floodplain Areas

4.1.1. Children and Elderly

Spatial cluster analysis shows that from 1990 to 2015, all most likely clusters in the Village Creek areas are statistically significant low cluster (Appendix A, Table A3, Table A6, Table A9 and Table A12). The low spatial clusters found in 2000 have the highest percentage (approximately 5.67 percent) of children, and the elderly population lived in the floodplain areas compared to other census years (Table A1). The locations of these low spatial clusters are quite similar for the years 2000, 2010, and 2015, and they are located in the north-east of Village Creek (Figure 2, Figure A1 and Figure A2). However, the location of the most likely cluster is different for the census year 1990, and it is located in the Central Village Creek (Figure 3). Although the most likely cluster is a statistically significant low cluster, the spatial cluster analysis shows that statistically significant both high and low clusters exist in the Village Creek area. The percentage of children and elderly population that are highly clustered in the floodplain areas of Village Creek in 1990, 2000, 2010, and 2015 is approximately 0, 20.08, 14.82, and 10.97, respectively (Table 2 and Table 3, Table A1 and Table A2). This percentage is also higher compared to the percentage of children and the elderly population lived in a statistically significant low cluster area. Since the percentage of highly clustered children and the elderly population decreased after the census year 2000, it suggests that this population group was initially more aggregated in the floodplain areas but gradually moving away from these areas. The number of residential buildings that are located within the statistically significant high cluster area in 1990, 2000, 2010, and 2015 is 0, 1129, 974, and 916, respectively (Table 2 and Table 3, Table A1 and Table A2).
In Valley Creek areas, all most likely clusters were identified as statistically significant low clusters from 1990 to 2015 (Table A4, Table A7, Table A10 and Table A13). The locations of all these clusters are very similar, and they are in the north-east of Valley Creek (Figure 2 and Figure 3, Figure A1 and Figure A2). However, some significant high clusters exist in the Valley Creek area for children and the elderly population, but they are not most likely clusters. The percentages of the children and elderly population located within the spatial significant high clusters in Valley Creek in 1990, 2000, 2010, and 2015 are approximately 9.79, 10.80, 8.77, and 10.77, respectively (Table 2 and Table 3, Table A1 and Table A2). This finding suggests that the aggregation of children and the elderly population in floodplain areas of Valley Creek remains the same over time. In addition, the percentages of the children and elderly population that are highly clustered are much higher compared to significant low cluster areas. The number of residential buildings that are significantly highly clustered in the Valley Creek area in 1990, 2000, 2010, and 2015 is 105, 469, 341, and 540, respectively (Table 2 and Table 3, Table A1 and Table A2).
The spatial cluster analysis findings are different for Five Mile Creek areas compared to Village Creek and Valley Creek areas. In the Five Mile Creek area, the most likely cluster of children and elderly populations is the statistically significant low and high clusters in 1990 and 2010, respectively (Table A5 and Table A11). For 2000 and 2015, the result indicates that the most likely spatial cluster of children and elderly populations is low and statistically insignificant (Table A8 and Table A14). The high spatial cluster was located on the eastern side of the Five Mile Creek in 2010 (Figure A2). The percentage of the population and number of residential buildings in the high cluster area in the Five Mile Creek area in 2010 is 7.62 and 16, respectively (Table A2). However, the result indicates that there was no significant spatial cluster in 2015, which suggests that the children and elderly are moving away from the floodplain areas of Five Mile Creek.

4.1.2. Below Poverty Level

The spatial cluster of the people who lived below the poverty level in the Village Creek area suggests that the most likely cluster for 1990 is a statistically significant high cluster; this cluster is in central south-west of the Village Creek (Figure 4, Table A3). The most likely cluster for the rest of the census years, such as 2000, 2010, and 2015, is a statistically significant low cluster (Table A6, Table A9 and Table A12). The location of all these clusters are very similar, and they are located in the south-west of Village Creek (Figure 5, Figure A3 and Figure A4). However, for 2000 and 2015, we found the second most likely cluster as a significant high cluster, and they are located at the central south-west of Village Creek (Figure 5, Figure A3). The percentage of poor people highly clustered in the floodplain areas of Village Creek in 1990, 2000, 2010, and 2015 is approximately 6.10, 7.43, 16.99, and 10.95, respectively (Table 2 and Table 3, Table A1 and Table A2). The spatial and temporal trend of these clusters suggests that until 2010 they were more aggregated in the floodplain areas, but in 2015 some were moved away from the floodplain areas of Village Creek. The number of residential buildings located in the significant high cluster areas in 1990 and 2015 is 86 and 237, respectively (Table 2 and Table 3).
In Valley Creek, the most likely cluster for poor people found as a statistically significant low cluster for all census years (Table A4, Table A7, Table A10 and Table A13). However, the location of all these clusters varies over time. In 1990, 2000, 2010, and 2015, the significant low cluster is located in central, north-east, central south-west, and south-west of Valley Creek, respectively (Figure 4 and Figure 5, Figure A3 and Figure A4). However, the second most likely cluster was found as a statistically significant high cluster in 2015, and it is in north-east of Valley Creek (Figure 5). The percentage of poor people located in a significant low cluster area in 1990, 2000, 2010, and 2015 is approximately 2.12, 0.50, 2.12, and 1.79, respectively (Table 2 and Table 3, Table A1 and Table A2). The percentage of poor people who were highly clustered in 1990, 2000, 2010, and 2015 is approximately 13.29, 8.26, 20.91, and 14.52, respectively (Table 2 and Table 3, Table A1 and Table A2). The finding suggests that the poor people in the Valley Creek area were more aggregated in the floodplain areas from 1990 to 2010, but they started to move away after 2010 and were less aggregated in 2015. The number of residential buildings located in a statistically significant high cluster area in 1990, 2000, 2010, and 2015 is 283, 239, 632, and 489, respectively (Table 2 and Table 3, Table A1 and Table A2).
In Five Mile Creek, there was no spatial cluster found for 1990 since there were no poor people living in that area (Table 1). However, spatial cluster analysis shows that in 2000, 2010, and 2015 the most likely cluster of poor people is the statistically not significant high cluster, low cluster, and significant low cluster, respectively (Figure 5, Figure A3 and Figure A4, Table A8, Table A11 and Table A14). Although there was no significant cluster found from 1990 to 2010, the significant low cluster in 2015 indicates that the poor people were less aggregated in the floodplain area of Five Mile Creek. The number of residential buildings that are located within the significant low cluster in 2015 is 27 (Table 3). These buildings are located in the north-east of the Five Mile Creek area (Figure 5).

4.1.3. The White Population

The spatial cluster analysis shows that the most likely cluster for the White population in the floodplain areas of Village Creek found as a statistically significant high cluster for all census years (Figure 6 and Figure 7, Figure A5 and Figure A6, Table A3, Table A6, Table A9 and Table A12). The location of a significant high cluster for 1990 and 2000 is very similar, and they are in the north-east part of the Village Creek (Figure 6 and Figure 7, Figure A5 and Figure A6). Gradually these populations moved from the north-east to the central part of the Village Creek area and formed a significant high cluster in 2010 and 2015 (Figure 7 and Figure A6). The second most likely cluster for the White population from 1990 to 2010 found as a significant low cluster, but in 2015, the second most likely cluster also showed a significant high cluster (Figure 6 and Figure 7, Figure A5 and Figure A6, Table A3, Table A6, Table A9 and Table A12). The percentage of the White population who are located within the statistically significant high cluster in 1990, 2000, 2010, and 2015 is approximately 11.29, 5.18, 6.08, and 3.97, respectively (Table 2 and Table 3, Table A1 and Table A2). The finding suggests that gradually White populations are moving away from the floodplains area of Village Creek and less aggregated in the floodplain areas. The number of residential buildings that are located within the statistically significant high cluster area of Village Creek in 1990, 2000, 2010, and 2015 is 426, 435, 388, and 250, respectively (Table 2 and Table 3, Table A1 and Table A2).
In the Valley Creek area, the most likely spatial cluster of the White population found as a statistically significant high cluster for all of the census years from 1990 to 2015 (Figure 6 and Figure 7, Figure A5 and Figure A6, Table A4, Table A7, Table A10 and Table A13). The locations of all these high clusters are very similar for all census years except 1990. In 1990, the most likely significant high cluster found in the central north-west part of the Valley Creek, whereas for the rest of the census years, it was located in the west part of the Valley Creek area (Figure 6 and Figure 7, Figure A5 and Figure A6). The results indicate that the second most likely cluster for the White population in the floodplain areas of Valley Creek for all census years is the statistically significant low cluster (Figure 6 and Figure 7, Figure A5 and Figure A6, Table A4, Table A7, Table A10 and Table A13). The second most likely cluster location is very similar from 1990 to 2010, and it is in the north-west part of the Valley Creek area (Figure 6, Figure A5 and Figure A6). However, in 2015, this cluster moved slightly upward and located in the central north-west part of the Valley Creek area (Figure 7). The percentage of the White population who are highly clustered in 1990, 2000, 2010, and 2015 is approximately 6.50, 0.83, 1.62, and 1.20, respectively (Table 2 and Table 3, Table A1 and Table A2). The lower percentage of the White population living in the high clustered area suggests that this population group is less aggregated in the floodplains area of Valley Creek. The number of residential buildings highly clustered in the floodplain area of Valley Creek in 1990 and 2015 is 229 and 121, respectively (Table 2 and Table 3, Table A1 and Table A2).
Although more than a hundred White people lived in the floodplain areas of Five Mile Creek in 1990, the spatial cluster analysis did not find any spatial cluster in this area for that year (Table 1). However, for the rest of the census years, the results indicate that the most likely cluster for the White population in the Five Mile Creek area is the statistically significant low cluster, not significant low cluster, and significant high cluster for the year of 2000, 2010, and 2015, respectively (Figure 6 and Figure 7, Figure A5 and Figure A6, Table A5, Table A8, Table A11 and Table A14). The spatial cluster location is very similar for 2000 and 2010, and they are in the south-west part of the Five Mile Creek area (Figure A5 and Figure A6). The most likely cluster location has changed for 2015, and it moved to the east part of the Five Mile Creek area and formed a statistically significant high cluster (Figure 7). The percentage of the White population highly clustered in the floodplain areas of Five Mile Creek in 2015 is approximately 8.08 (Table 3). This cluster’s spatial and temporal trends suggest that initially, the White populations were not aggregated in the floodplain areas, but currently, they are more aggregated in the floodplain areas of Five Mile Creek. The number of residential buildings located within the high cluster area of Five Mile Creek in 2015 is 27 (Table 3).

4.1.4. African American

The spatial cluster analysis shows that the most likely cluster of African American populations in the floodplain areas of Village Creek area was found to be a statistically significant low cluster for all the census years from 1990 to 2015 (Figure 8 and Figure 9, Figure A7 and Figure A8, Table A3, Table A6, Table A9 and Table A12). The locations of all these clusters are very similar, and they are in the central part of the Village Creek area (Figure 8 and Figure 9, Figure A7 and Figure A8). However, the second most likely cluster for this population group was found to be a statistically significant high cluster for the census year of 1990, 2000, and 2015 (Figure 8 and Figure 9, Figure A7, Table A3, Table A6 and Table A12). In 2010, the second most likely cluster was found as a significant low cluster (Table A9 and Figure A8). The percentage of African American populations that are highly clustered in the floodplain areas of Village Creek in 1990, 2000, 2010, and 2015 is approximately 48.87, 49.92, 49.60, and 48.72, respectively (Table 2 and Table 3, Table A1 and Table A2). The percentage of the African American population living in the high cluster area did not change much over the past thirty years, which indicates this population did not move away from the floodplain areas of Village Creek. The number of residential buildings that are located within the significant high cluster area in Village Creek in 1990, 2000, 2010, and 2015 is 882, 1022, 388, and 250, respectively (Table 2 and Table 3, Table A1 and Table A2).
In the Valley Creek area, the most likely cluster for the African American population was a statistically significant low cluster in 1990 and 2015 and a statistically insignificant low cluster in 2000 and 2010 (Figure 8 and Figure 9, Figure A7 and Figure A8, Table A4, Table A7, Table A10 and Table A13). The spatial cluster analysis did not find any significant spatial high cluster in this area for any census year. The locations of all these low clusters are very similar for all census years except 2010, and they are in the central south-west of the Valley Creek area (Figure 8 and Figure 9, and Figure A7). In 2010, the most likely cluster was located in the eastern part of the Valley Creek area (Figure A8). The percentage of African American populations located in the significant low cluster area in 1990 and 2015 is approximately 8.64 and 14.54, respectively (Table 2 and Table 3). The number of residential buildings is located in a significant low cluster area in the floodplain area of Valley Creek in 1990 and 2015 is 111 and 126, respectively (Table 2 and Table 3). Overall, the findings suggest that the African American people in the floodplain area of Valley Creek were less aggregated from the census year of 1990 to 2015.
In the Five Mile Creek area, there is no spatial cluster found in 1990 for the African American population. In addition, there is no statistically significant cluster found for other census years, such as 2000, 2010, and 2015. Since the results indicate that there is no significant spatial cluster for the African American population in the floodplain area of Five Mile Creek, it can be concluded that this population group was not aggregated in the floodplain areas over the past thirty years.

4.1.5. Hispanic

There was no Hispanic population living in the floodplain areas of Birmingham in 1990, and therefore, the census year 1990 was excluded from the analysis of the Hispanic population. The analysis has been performed for the rest of the census years for the Hispanic population in Birmingham’s floodplain areas.
The spatial cluster analysis shows that the most likely cluster for the Hispanic populations in Village Creek is a statistically significant high cluster for the census years 2000, 2010, and 2015 (Figure 10 and Figure 11, Figure A9, Table A6, Table A9 and Table A12). This finding suggests that, after 1990, the Hispanic population was increasingly aggregated in the floodplain areas of Village Creek. The percentage of the Hispanic population highly clustered in the floodplain areas of Village Creek in 2000, 2010, and 2015 is approximately 1.69, 4.11, and 5.49, respectively (Table 3, Table A1 and Table A2). The locations of these statistically significant high clusters are very similar for all census years, and they are in the central part of the Village Creek area (Figure 10 and Figure 11, and Figure A9). The number of residential buildings located in the statistically significant high cluster area in 2000, 2010, and 2015 is 49, 71, and 295, respectively (Table 3, Table A1 and Table A2). The percentage of the Hispanic population and the number of buildings they were living in were getting higher gradually; it indicates that they became more aggregated in the floodplain areas of Village Creek over time.
Like the Village Creek area, the result indicates the most likely cluster as a statistically significant high cluster in the Valley Creek area for the Hispanic population for the years 2000 and 2010 (Figure 10, Figure A9, Table A7 and Table A10). Although the result of these census years shows that the Hispanic populations were highly clustered in the Valley Creek area, there was no spatial cluster found in 2015. This finding indicates that the Hispanic populations were aggregated in the floodplain areas of Valley Creek in 2000 and 2010 but moved away in 2015. The percentage of the Hispanic population within the statistically significant high cluster areas in 2000 and 2010 is approximately 0.21 and 0.64, respectively (Table A1 and Table A2). There was no Hispanic population living in the Five Mile Creek area from 1990 to 2015. Therefore, the Five Mile Creek floodplain areas were excluded from the spatial cluster analysis for the Hispanic population.

4.2. Spatiotemporal Cluster Pattern Comparison between Minority and Non-Minority Populations

In this research, the White populations were considered as a non-minority group and African American and Hispanic populations as a minority group. The spatial cluster maps show that the cluster’s spatial pattern is almost opposite between the White and African American populations. For instance, the spatial cluster map of 1990 shows that the White people were highly clustered in the north-east part of the Village Creek area, whereas there is no spatial cluster found for the African American population in that area (Figure 6). Similarly, for Valley Creek area in 1990, the White populations were highly clustered in the central south-west part of this area, where the spatial cluster is low for African Americans in the same area (Figure 6). However, the result indicates some similarities between the spatial cluster pattern of the White and Hispanic populations. For instance, in 2000, Hispanic and White populations were low clustered in the south-west part of the Village Creek area (Figure 10 and Figure A5). The similar pattern was found for the Village Creek area in 2015, where it shows that both Hispanic and White populations were highly and low clustered in the north-east and south-west parts, respectively (Figure 7 and Figure 11).
Although the spatial cluster analysis finds several clusters for White, African American, and Hispanic population in the floodplains area of Birmingham, for the White and Hispanic populations, all most likely clusters are the statistically significant high clusters. In contrast, for the African American population, most of them are the statistically significant low cluster. Overall, the spatial cluster pattern indicates that there is a similarity between the White and Hispanic population and dissimilarity between the White and African American populations.

5. Discussion

Very few studies have been conducted in this case study area to understand the spatial cluster of different demographic factors that are vulnerable to flood hazards. It is important to understand the spatial pattern of the cluster of these population groups because not every population group is affected by flood hazards equally. In this research, we examined which population groups are most affected by flood hazards in Birmingham over the past thirty years. The objective of this research was to identify whether the vulnerable population groups are more aggregating in the flood hazard zones or moving away from the flood hazard areas. The spatial scan statistics method was used to achieve this objective by identifying the spatial cluster for each population group at each decennial census year. The findings of this research revealed that the children and elderly populations were moving away from most of the part of the floodplains of Birmingham; poor people were more aggregated in the floodplain areas till 2010, and after that they started to move away; the aggregation of African American populations has remained the same in the Village Creek area over the past thirty years, which is much higher (approximately 50 percent), and they were less aggregated in the rest of the floodplain areas of Birmingham; Hispanic populations were more aggregated in the Village Creek area and moved away from the Valley Creek area. The findings indicate that both minority and non-minority groups were being affected by the flood, although the percentage for a non-minority population group is low. The finding is consistent with the recent studies, which showed that White populations are also vulnerable to flood hazards in Birmingham, Alabama [30]. Although the White populations were less aggregated in the flood hazard areas, spatial cluster maps showed that they were also highly clustered in the highly elevated area of the flood hazard zones (Figure 6 and Figure 7, Figure A5 and Figure A6). For instance, in the Village Creek area of Birmingham, the direction of water flows from north-east to south-east, and the spatial cluster maps revealed that White populations are mostly clustered in the north-east part of the area. The spatial cluster map shows that the low cluster of White populations is found in the low elevated areas. Typically, the highly elevated areas are considered as low risk of flooding. Therefore, the findings suggest that the White populations are less aggregating in flood hazard areas, and highly clustered in the low flood risk areas.
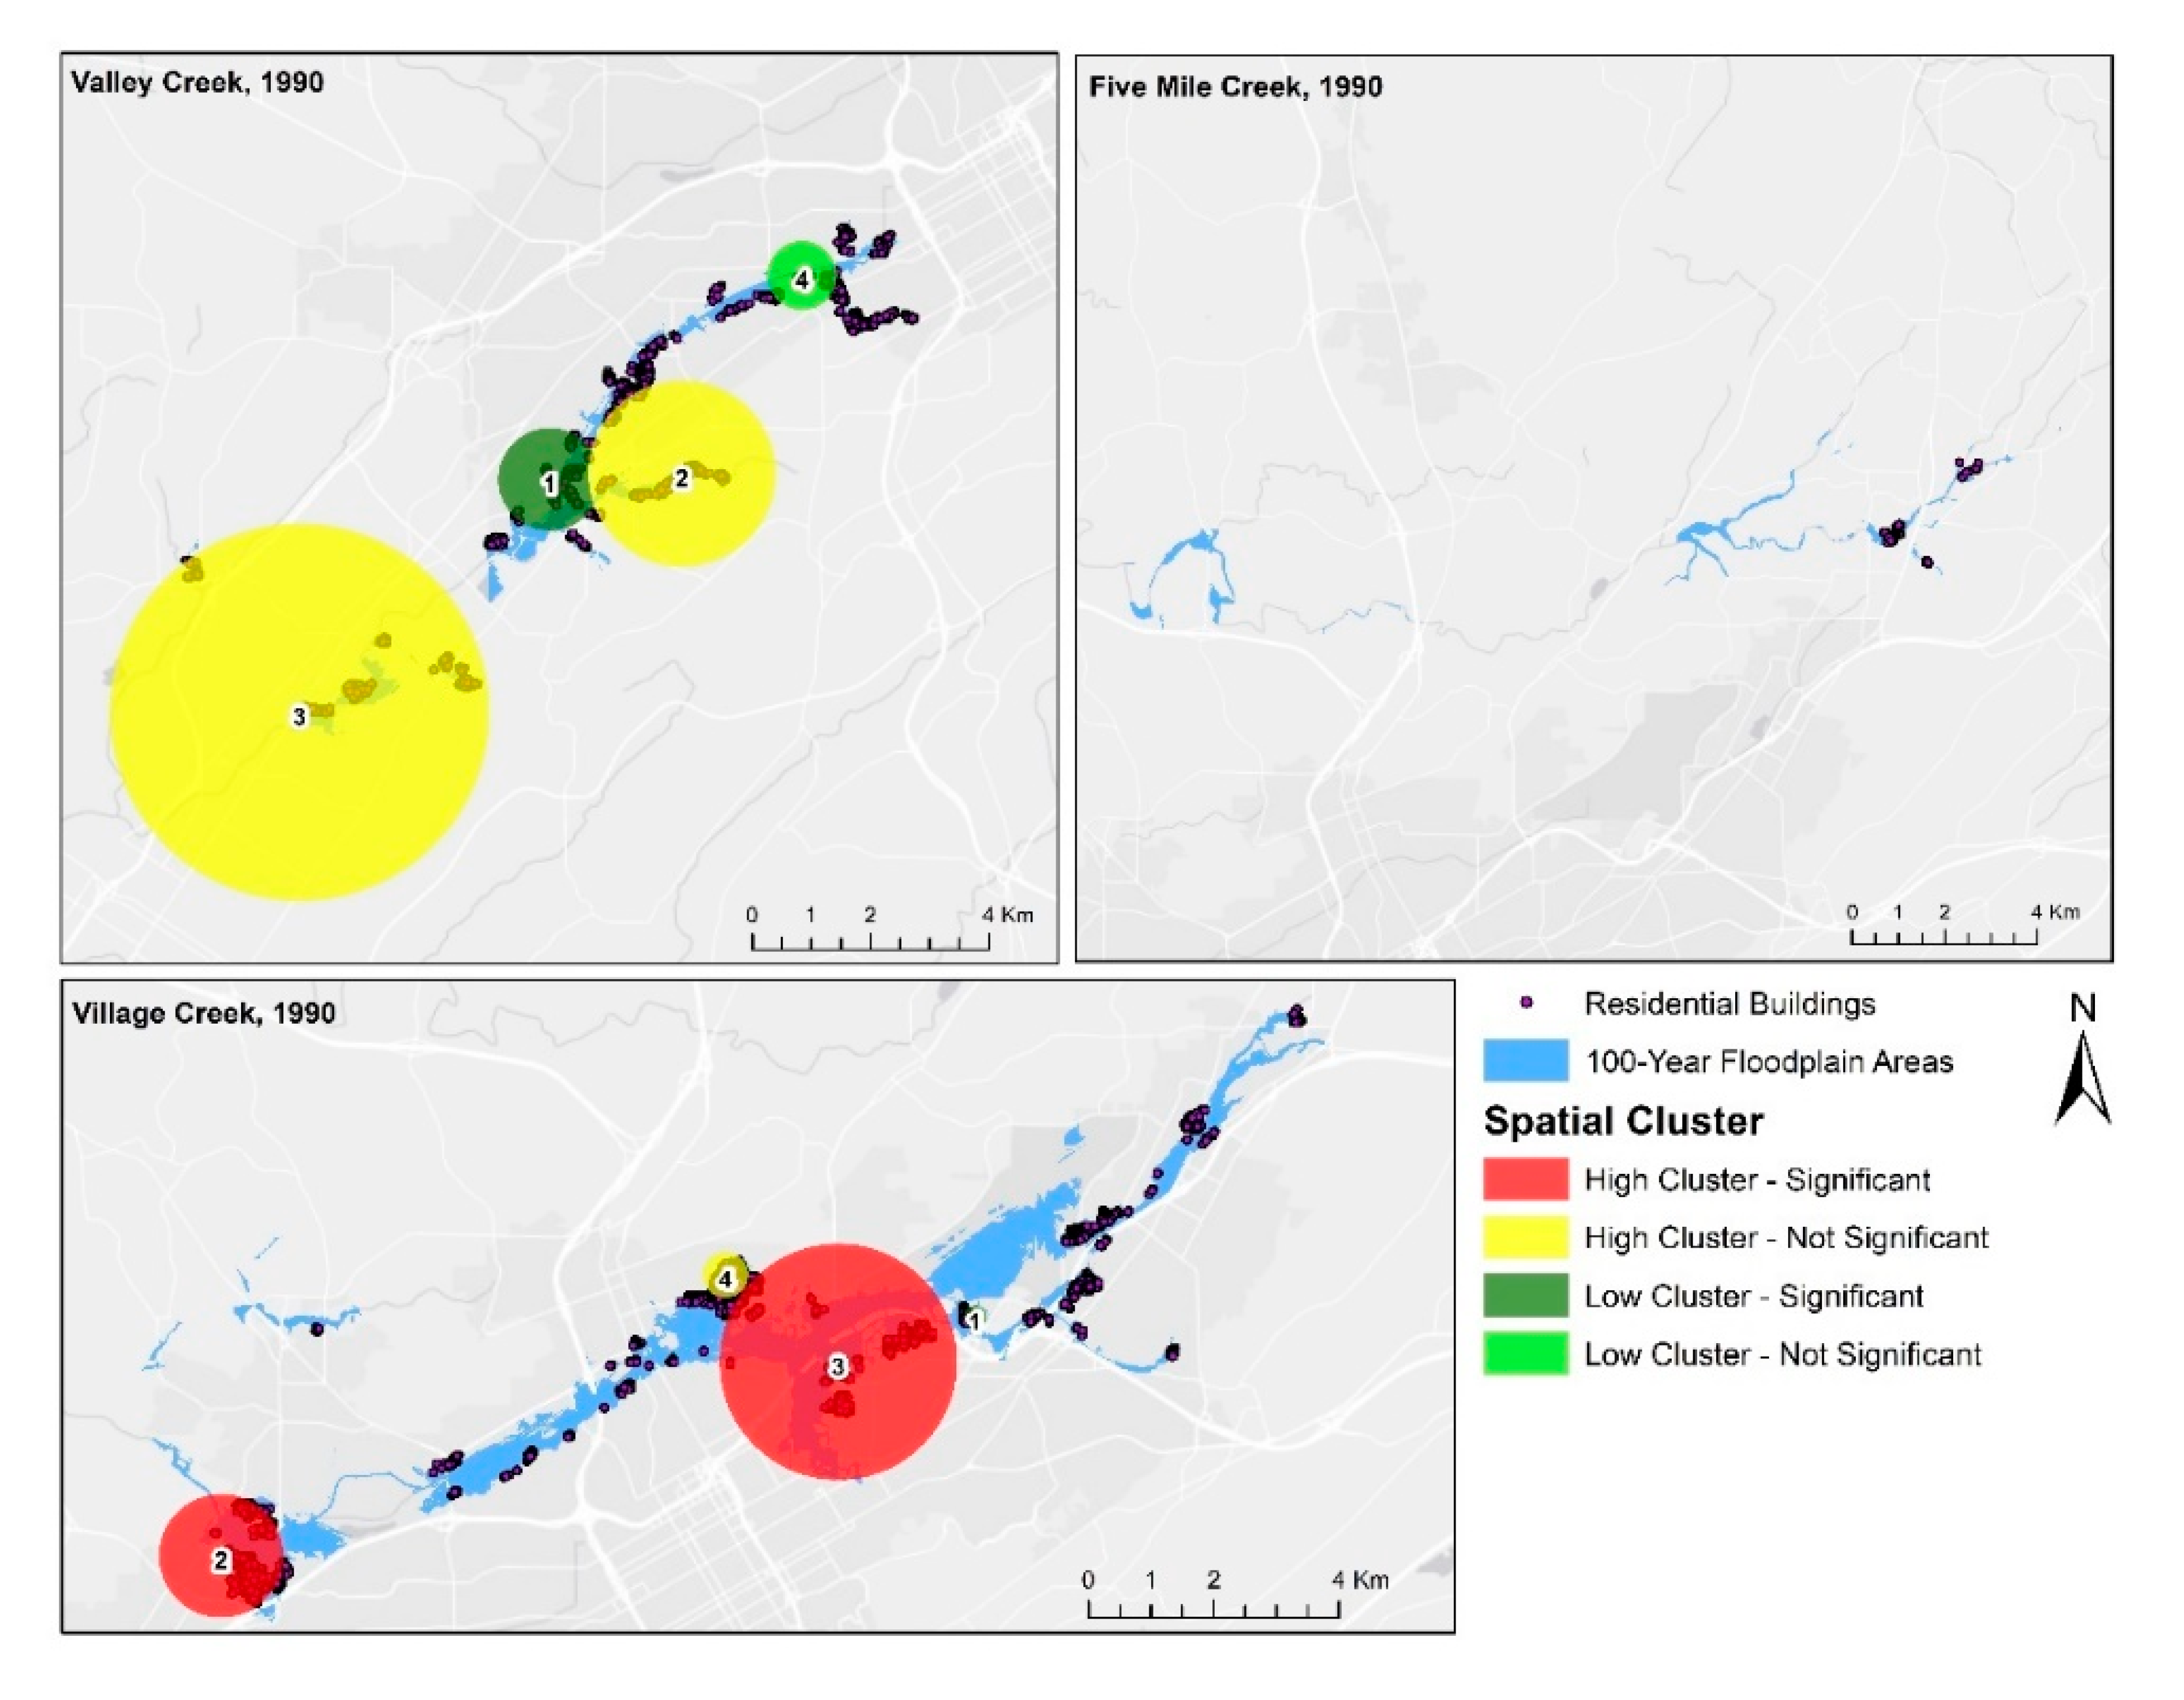
The findings suggest that children and elderly and poor populations are less aggregated in Birmingham’s flood hazard areas over the past thirty years. Although they are less aggregated in the flood hazard areas, most of them are clustered in the high flood risk areas. For instance, the spatial cluster map of the poor population in 1990 showed that this population group is highly clustered in the south-west part of the Village Creek area, which is a high flood risk area as the elevation is low (Figure 4). The possible reason could be that due to their financial situation, they cannot afford the better place to live, and in this case, the highly elevated place was considered as a better place since it possesses a lower risk of flooding. The comparison between the spatial cluster map of the poor and White population also supports this argument, which shows that the White populations are highly clustered in the highly elevated areas, whereas poor people are clustered in low elevated areas.
As part of the minority population, the spatial cluster maps showed that either high or low, most of the clusters are located in low elevated areas of Birmingham flood hazard areas. These population groups are clustered in the high flood risk areas, and the findings suggest that these minorities are more aggregated in the flood hazard areas of Birmingham. There is also a similarity between the spatial cluster pattern of the poor and the Hispanic population. This finding gives us an insight that most of the Hispanic population could be poor people in Birmingham since their spatial cluster pattern is similar.
In this research, the dynamic vulnerability of both minorities and non-minorities populations was included, which is different than typical social vulnerability research. In typical social vulnerability research, the researchers mostly used the minority populations as factors of social vulnerability to develop social vulnerability index, which typically is static study. Rufat et al. [63] recently had reviewed 67 flood disaster studies where they identified the demographic characteristics, socioeconomic status, and health as the leading drivers of social vulnerability to floods. Although they mentioned that demographic characteristics influence social vulnerability, none of these case studies considered the White population a socially vulnerable group and did not include them in their demographic variables. The findings of this research indicate that not only minorities, but also non-minorities groups are vulnerable to floods and historically exposed to flood hazards. In future social vulnerability research, we suggest that non-minorities should be added as a factor of social vulnerability and that spatiotemporal vulnerability modeling is also needed, which will provide further insights into the social vulnerability assessment and hazard mitigation.
The findings of this research provide a better understanding of which population groups were historically affected due to flood hazards in Birmingham. Typically, the emergency management agency thinks that the minority populations are most affected by floods. However, this research will provide the City of Birmingham officials with a better understanding that not only the minorities but also the non-minorities are affected by floods. The findings of this paper will also help the Birmingham officials allocate resources efficiently after flooding disasters since they will know which population groups will be more affected by floods.

6. Conclusions

In this paper, the spatial scan statistics method was used to identify the spatial cluster of different population groups at each decennial census year vulnerable to flood hazards. The spatial cluster of each population group for each census area provides us with a better understanding of which population groups are historically being affected by flood hazards in Birmingham. The findings revealed that mostly the minorities are more aggregated in the flood hazard areas than the non-minority population. Although the non-minority population groups are less affected by floods, it is significant since very few research studies include the non-minority populations in the flood hazard research. The spatial cluster maps deeply revealed the location of the high and low cluster of each population group, which also gives us an understanding of the spatial pattern of each vulnerable population group in the flood hazard areas of Birmingham.
The spatial scan statistics, showing both spatial high and low clusters of each population group, can help the Emergency Management Agency (EMA) to achieve a better understanding of the location of each vulnerable group. The findings will give Birmingham officials some ideas of where the population groups are that have been affected by a flood historically and their spatiotemporal trends in the Birmingham floodplain areas, which is critical information for flood mitigation planning and assistance. This understanding will help them gain the insight into where and what populations need more resources in the post-disaster periods to recover from a hazardous situation. Typically, the White population gets privileged during the post-disaster situation, but the findings will help them understand that the minority population groups are aggregating more in the flood hazard areas. They would need more attention during the flood hazard situation.
To the best of our knowledge, only very few research studies have been carried out on the multi-decadal analysis of flood risk. However, most of these research studies were based on historical flood frequency assessment. Those research studies considered only the historical flood events for a particular area but did not consider the changes of spatial patterns of the demography in the flood risk areas over the past decades. Hence, this proposed study will help understand the shifting patterns spatially between the minority and the non-minority population due to flood vulnerability. The understanding of changes in the spatial clustering patterns will help the local government and communities to understand which population groups are more vulnerable to floods and most potentially affected spatially and over the decades in Birmingham city, and then help them to design urban planning strategies and aid communities in developing policy to address demographical vulnerability issues at the community levels.

Author Contributions

M.K.H.: data collection and processing, GIS analysis, statistical analysis, writing—original draft, reviewing and editing. Q.M.: conceptualization, methodology, data curation, investigation, supervision, writing—organization, reviewing and editing. All authors have read and agreed to the published version of the manuscript.

Funding

This research received no external funding.

Conflicts of Interest

The authors declare no conflict of interest.

Appendix A

Table A1. Total number of populations and residential buildings located in each spatial cluster in decennial census year 2000.
Demographic FactorsSpatial ClusterNumber of Population and %Number of Residential Buildings
Village CreekValley CreekFive Mile CreekVillage CreekValley CreekFive Mile Creek
Children (under 5 years) and elderly (over 65 years)High Cluster-Significant1187 (20.08)471 (10.80)0 (0)11294690
High Cluster-Not Significant0 (0)0 (0)0 (0)000
Low Cluster-Significant335 (5.67)66 (1.51)0 (0)3982303
Low Cluster-Not Significant0 (0)2 (0.05)0 (0)01340
Below poverty levelHigh Cluster-Significant439 (7.43)360 (8.26)0 (0)862390
High Cluster-Not Significant0 (0)0 (0)2 (1.55)001
Low Cluster-Significant484 (8.19)22 (0.50)0 (0)4492040
Low Cluster-Not Significant0 (0)0 (0)0 (0)090
WhiteHigh Cluster-Significant306 (5.18)36 (0.83)0 (0)435340
High Cluster-Not Significant0 (0)14 (0.32)40 (31.01)01620
Low Cluster-Significant2 (0.03)1 (0.02)19 (14.73)13095695
Low Cluster-Not Significant0 (0)0 (0)0 (0)02143
African AmericanHigh Cluster-Significant2951 (49.92)0 (0)0 (0)102200
High Cluster-Not Significant0 (0)0 (0)6 (4.65)001
Low Cluster-Significant700 (11.84)199 (4.56)0 (0)327770
Low Cluster-Not Significant160 (2.71)0 (0)0 (0)7300
HispanicHigh Cluster-Significant100 (1.69)9 (0.21)0 (0)49230
High Cluster-Not Significant0 (0)0 (0)0 (0)000
Low Cluster-Significant0 (0)0 (0)0 (0)40500
Low Cluster-Not Significant0 (0)0 (0)0 (0)05890
Table A2. Total number of populations and residential buildings located in each spatial cluster in decennial census year 2010.
Demographic FactorsSpatial ClusterNumber of Population and %Number of Residential Buildings
Village CreekValley CreekFive Mile CreekVillage CreekValley CreekFive Mile Creek
Children (under 5 years) and elderly (over 65 years)High Cluster-Significant995 (14.82)373 (8.77)16 (7.62)97434116
High Cluster-Not Significant0 (0)57 (1.34)0 (0)0900
Low Cluster-Significant49 (0.73)90 (2.12)0 (0)6095410
Low Cluster-Not Significant23 (0.34)33 (0.78)0 (0)614435
Below poverty levelHigh Cluster-Significant1141 (16.99)889 (20.91)0 (0)4016320
High Cluster-Not Significant0 (0)0 (0)0 (0)000
Low Cluster-Significant14 (0.21)90 (2.12)0 (0)4293550
Low Cluster-Not Significant0 (0)0 (0)0 (0)1105
WhiteHigh Cluster-Significant408 (6.08)69 (1.62)0 (0)3881210
High Cluster-Not Significant0 (0)9 (0.21)0 (0)0110
Low Cluster-Significant0 (0)0 (0)0 (0)11233110
Low Cluster-Not Significant0 (0)0 (0)0 (0)02495
African AmericanHigh Cluster-Significant0 (0)0 (0)0 (0)000
High Cluster-Not Significant3331 (49.60)0 (0)42 (20.0)1229021
Low Cluster-Significant348 (5.18)0 (0)0 (0)15300
Low Cluster-Not Significant0 (0)259 (6.09)0 (0)01190
HispanicHigh Cluster-Significant276 (4.11)27 (0.64)0 (0)71450
High Cluster-Not Significant0 (0)0 (0)0 (0)000
Low Cluster-Significant0 (0)0 (0)0 (0)52700
Low Cluster-Not Significant0 (0)0 (0)0 (0)06370
Table A3. Spatial cluster of each demographic factor in the Village Creek area in decennial census year 1990.
Demographic FactorsClusterObservedExpectedLLRp-Value
Children (under 5 years) and elderly (over 65 years)1191277.41117.0780.00
212077.32710.5010.07
3167221.3488.0520.45
4426364.7265.9390.98
Below poverty level1409201.18693.8130.00
26108.80187.9510.00
331164.49086.1280.00
White1757218.6381023.8220.00
201464.875233.5980.00
301410.653233.4360.00
43732.875149.7060.00
African American10218.638222.8190.00
216731464.87519.1340.00
316031410.65316.7710.00
4838732.8758.2880.39
Note: LLR, Log-likelihood ratio.
Table A4. Spatial cluster of each demographic factor in the Valley Creek area in decennial census year 1990.
Demographic FactorsClusterObservedExpectedLLRp-Value
Children (under 5 years) and elderly (over 65 years)1110245.64558.9710.00
2020.90021.1250.00
312373.79714.9820.00
4011.35311.4190.01
5252195.3299.6000.06
611177.4097.0440.54
Below poverty level175223.11880.6220.00
2691.46673.2690.00
314048.07562.6040.00
416684.56334.5150.00
513474.94820.8610.00
6015.53215.6610.00
76937.96710.7240.03
8166123.7637.6100.34
White118558.157126.9190.00
2045.44849.1720.00
31274.48648.2790.00
4035.23237.4150.00
54817.61619.3790.00
6162.57416.1070.00
7011.10111.3060.01
808.9299.0610.06
905.4705.5190.88
African American1331441.72217.2990.00
2652571.5376.5980.75
3565492.2546.0670.85
4152195.1595.4640.97
Table A5. Spatial cluster of each demographic factor in the Five Mile Creek area in decennial census year 1990.
Demographic FactorsClusterObservedExpectedLLRp-Value
Children and Elderly106.7457.3370.02
Table A6. Spatial cluster of each demographic factor in the Village Creek area in decennial census year 2000.
Demographic FactorsClusterObservedExpectedLLRp-Value
Children (under 5 years) and elderly (over 65 years)13137.284127.8150.00
2601416.02348.1770.00
3216347.70234.3200.00
4586445.85327.0260.00
5116177.05813.0750.01
Below poverty level1887.97562.1440.00
2439258.17059.9730.00
3026.72126.8690.00
4476607.19219.9320.00
White130684.650325.8370.00
2084.70797.4670.00
3082.75794.8770.00
4264.74962.4800.00
African American17001048.53579.7660.00
214771311.33413.5860.00
314741311.33413.1040.01
4160204.2025.3651.00
Hispanic11005.177288.3390.00
2025.48729.3260.00
Table A7. Spatial cluster of each demographic factor in the Valley Creek area in decennial census year 2000.
Demographic FactorsClusterObservedExpectedLLRp-Value
Children (under 5 years) and elderly (over 65 years)166194.89369.5590.00
2213118.78136.6360.00
3024.79425.1680.00
415388.22122.3450.00
55824.60217.0390.00
64721.14212.1030.01
708.4578.5000.23
808.4578.5000.23
9212.6857.0600.56
Below poverty level1047.74548.6550.00
2754.81934.3300.00
3360257.29523.5240.00
41555.40821.4650.00
5021.22021.3970.00
608.8428.8720.17
White1240.95859.7150.00
2011.89313.3090.00
3112.25210.0290.03
4122.7549.2380.04
508.0228.6330.06
692.0226.9140.25
750.8654.7920.91
African American1199248.2465.5601.00
Hispanic190.40327.9650.00
202.2502.5890.93
302.2482.5860.95
Table A8. Spatial cluster of each demographic factor in the Five Mile Creek area in decennial census year 2000.
Demographic FactorsClusterObservedExpectedLLRp-Value
Children (under 5 years) and elderly (over 65 years)103.9774.1220.36
Below poverty level120.0936.1360.06
White1010.53611.0360.00
24028.0953.0520.74
31928.7982.4160.98
African American163.1791.0371.00
Hispanic100.2440.2801.00
Table A9. Spatial cluster of each demographic factor in the Village Creek area in decennial census year 2010.
Demographic FactorsClusterObservedExpectedLLRp-Value
Children (under 5 years) and elderly (over 65 years)12177.792175.7130.00
20127.468132.0540.00
3664393.189103.8760.00
421118.06763.4660.00
5331211.80233.0090.00
61558.06623.2740.00
71149.77122.5790.00
82348.6658.6080.35
Below poverty level18129.753102.1960.00
21102.63498.8930.00
33101.38389.5920.00
4597403.02748.6590.00
5254.65546.5400.00
6256166.05122.4220.00
7288199.84518.5960.00
809.1799.1940.26
White1408138.500288.1040.00
20138.500159.3760.00
30129.179147.0850.00
African American169311.284143.3340.00
2279418.37328.0300.00
316691516.4909.9930.14
416621522.8428.3120.52
Hispanic127614.581798.1830.00
2069.70880.2080.00
Table A10. Spatial cluster of each demographic factor in the Valley Creek area in decennial census year 2010.
Demographic FactorsClusterObservedExpectedLLRp-Value
Children (under 5 years) and elderly (over 65 years)128135.45870.6290.00
2220104.26357.5160.00
3055.69057.5090.00
429121.01255.8800.00
515378.72030.9040.00
6011.30611.3780.02
73363.4379.4240.10
89065.1124.6241.00
Below poverty level176231.94581.4610.00
214106.21567.1560.00
3061.42662.8560.00
4470336.56132.6230.00
5249159.32324.9420.00
6023.03523.2320.00
7170110.05415.4360.00
White1241.35549.9650.00
2019.98622.9960.00
3297.28321.9790.00
4164.14010.7490.02
507.0767.4090.20
607.0767.1200.25
792.8614.4280.98
African American1131175.2366.3780.82
2128170.5266.0430.90
Hispanic1141.08026.7130.00
2131.00124.5130.00
306.9958.0490.12
406.9958.0490.12
Table A11. Spatial cluster of each demographic factor in the Five Mile Creek area in decennial census year 2010.
Demographic FactorsClusterObservedExpectedLLRp-Value
Children (under 5 years) and elderly (over 65 years)1163.65723.6150.00
203.9624.5520.20
303.9624.5520.20
Below poverty level103.1433.2200.68
White103.1903.2690.82
African American13222.1712.5890.96
2104.6192.5030.96
Table A12. Spatial cluster of each demographic factor in the Village Creek area in decennial census year 2015.
Demographic FactorsClusterObservedExpectedLLRp-Value
Children (under 5 years) and elderly (over 65 years)144348.116241.4060.00
2848420.043237.5160.00
365258.806115.1180.00
410353.89118.2760.00
Below poverty level196501.180273.3550.00
2364172.38786.1960.00
3333173.02062.0430.00
42885.63126.8250.00
56628.16918.5750.00
6186117.32817.7490.00
White118531.558213.1640.00
211119.477114.1690.00
3096.500111.0450.00
4076.27184.9740.00
5484.11376.6790.00
61566.66133.2570.00
African American1185633.140235.0120.00
221491854.07230.2620.00
320751821.56022.6930.00
Hispanic128643.871371.1810.00
214625.493150.5580.00
30128.470147.8290.00
40122.127139.4410.00
5446.46248.2880.00
6038.17939.6720.00
Table A13. Spatial cluster of each demographic factor in the Valley Creek area in decennial census year 2015.
Demographic FactorsClusterObservedExpectedLLRp-Value
Children (under 5 years) and elderly (over 65 years)1130372.059129.8160.00
2234137.53231.4150.00
3321215.41826.9440.00
4844.01022.8140.00
Below poverty level192364.896177.5940.00
2617365.179103.2310.00
3055.00456.0660.00
4026.65126.8970.00
513171.44821.1580.00
6010.20710.2430.06
White1421.712109.4470.00
2017.49720.1330.00
3016.12518.3270.00
4205.12114.2220.00
506.4666.7850.33
African American1749890.06014.3710.00
2328410.5149.6930.13
Table A14. Spatial cluster of each demographic factor in the Five Mile Creek area in decennial census year 2015.
Demographic FactorsClusterObservedExpectedLLRp-Value
Children (under 5 years) and elderly (over 65 years)106.5876.8140.09
Below poverty level1121.12319.9530.00
23120.8682.9830.98
White1277.45528.6970.00
207.3658.4510.01
307.2758.3330.02
African American12215.7431.1941.00
Figure A1. Spatial cluster of children and the elderly population in the floodplain areas in 2000.
Sustainability 12 09139 g0a1
Figure A2. Spatial cluster of children and the elderly population in the floodplain areas in 2010.
Sustainability 12 09139 g0a2
Figure A3. Spatial cluster of poor population in the floodplain areas in 2000.
Sustainability 12 09139 g0a3
Figure A4. Spatial cluster of poor population in the floodplain areas in 2010.
Sustainability 12 09139 g0a4
Figure A5. Spatial cluster of the White population in the floodplain areas in 2000.
Sustainability 12 09139 g0a5
Figure A6. Spatial cluster of the White population in the floodplain areas in 2010.
Sustainability 12 09139 g0a6
Figure A7. Spatial cluster of the African American population in the floodplain areas in 2000.
Sustainability 12 09139 g0a7
Figure A8. Spatial cluster of the African American population in the floodplain areas in 2010.
Sustainability 12 09139 g0a8
Figure A9. Spatial cluster of the Hispanic population in the floodplain areas in 2010.
Sustainability 12 09139 g0a9

References

  1. Ahmadalipour, A.; Moradkhani, H. Multi-dimensional assessment of drought vulnerability in Africa: 1960–2100. Sci. Total Environ. 2018, 644, 520–535. [Google Scholar] [CrossRef] [PubMed]
  2. Bezak, N.; Šraj, M.; Mikoš, M. Copula-based IDF curves and empirical rainfall thresholds for flash floods and rainfall-induced landslides. J. Hydrol. 2016, 541, 272–284. [Google Scholar] [CrossRef]
  3. Miao, Q.; Yang, D.; Yang, H.; Li, Z. Establishing a rainfall threshold for flash flood warnings in China’s mountainous areas based on a distributed hydrological model. J. Hydrol. 2016, 547, 371–386. [Google Scholar] [CrossRef]
  4. NWS. Flood Deaths and Direct Damages by State Water Year 2019 (1 October 2018–30 September 2019). 2019. Available online: https://www.weather.gov/media/water/WY2019_Flood_Loss.pdf (accessed on 1 August 2020).
  5. Ashley, S.T.; Ashley, W.S. Flood fatalities in the United States. J. Appl. Meteorol. Climatol. 2008, 47, 805–818. [Google Scholar] [CrossRef]
  6. Terti, G.; Ruin, I.; Anquetin, S.; Gourley, J.J. A situation-based analysis of flash flood fatalities in the United States. Bull. Am. Meteorol. Soc. 2017, 98, 333–345. [Google Scholar] [CrossRef]
  7. Alipour, A.; Ahmadalipour, A.; Moradkhani, H. Assessing flash flood hazard and damages in the southeast United States. J. Flood Risk Manag. 2020, 13, 1–17. [Google Scholar] [CrossRef]
  8. Rifat, S.A.A.; Liu, W. Quantifying Spatiotemporal Patterns and Major Explanatory Factors of Urban Expansion in Miami Metropolitan Area during 1992–2016. Remote Sens. 2019, 11, 2493. [Google Scholar] [CrossRef] [Green Version]
  9. Rifat, S.A.A.; Liu, W. Measuring Community Disaster Resilience in the Conterminous Coastal United States. Isprs Int. J. Geo-Inf. 2020, 9, 469. [Google Scholar] [CrossRef]
  10. NOAA NCEI. Billion-Dollar Weather and Climate Disasters: Events. 2018. Available online: https://www.ncdc.noaa.gov/billions/events/US/1980-2017 (accessed on 1 August 2020).
  11. Florida House of Representatives. Select Committee on Hurricane Response and Preparedness Final Report; Tallahassee, F.L., Ed.; State of Florida: Tallahassee, FL, USA, 2018. [Google Scholar]
  12. Blake, E.S.; Zelinsky, D.A. National Hurricane Center Tropical Cyclone Report: Hurricane Harvey. 2018. Available online: https://www.nhc.noaa.gov/data/tcr/AL092017_Harvey.pdf (accessed on 1 August 2020).
  13. Jonkman, S.N.; Godfroy, M.; Sebastian, A.; Kolen, B. Brief communication: Loss of life due to Hurricane Harvey. Nat. Hazards Earth Syst. Sci. 2018, 18, 1073–1078. [Google Scholar] [CrossRef] [Green Version]
  14. Federal Emergency Management Agency. Historic Disaster Response to Hurricane Harvey in Texas. 2017. Available online: https://www.fema.gov/news-release/2017/09/22/historic-disaster-response-hurricane-harvey-texas (accessed on 1 August 2020).
  15. Amadeo, K. Hurricane Harvey Facts, Damage and Costs: What Made Harvey So Devastating. 2019. Available online: https://www.lamar.edu/_files/documents/resilience-recovery/grant/recovery-and-resiliency/hurric2.pdf (accessed on 1 August 2020).
  16. Donner, W.; Rodriguez, H. Population Composition, Migration and Inequality: The Influence of Demographic Changes on Disaster Risk and Vulnerability. Soc. Forces 2008, 87, 1089–1114. [Google Scholar] [CrossRef]
  17. Benson, C.; Myers, M.; Twigg, J. NGO initiatives in risk reduction: An overview. Disasters 2001, 25, 199–215. [Google Scholar] [CrossRef] [PubMed]
  18. Crowder, K.; Downey, L. Interneighborhood Migration, Race, and Environmental Hazards: Modeling Microlevel Processes of Environmental Inequality. Am. J. Sociol. 2010, 115, 1110–1149. [Google Scholar] [CrossRef] [Green Version]
  19. Pais, J.; Crowder, K.; Downey, L. Unequal Trajectories: Racial and Class Differences in Residential Exposure to Industrial Hazard. Soc. Forces 2014, 92, 1189–1215. [Google Scholar] [CrossRef] [PubMed] [Green Version]
  20. Heijmans, A. Vulnerability: A Matter of Perception; Benfield Greig Hazard Research Centre: London, UK, 2001. [Google Scholar]
  21. Lu, Y. Hurricane Flooding and Environmental Inequality: Do Disadvantaged Neighborhoods Have Lower Elevations? Socius Sociol. Res. A Dyn. World 2017, 3, 237802311774070. [Google Scholar] [CrossRef]
  22. Hossain, M.K.; Meng, Q. A fine-scale spatial analytics of the assessment and mapping of buildings and population at different risk levels of urban flood. Land Use Policy 2020, 99, 104829. [Google Scholar] [CrossRef]
  23. Buckle, P.; Mars, G.; Smale, R.S. New approaches to assessing vulnerability and resilience. Aust. J. Emerg. Manag. 2000, 15, 8. [Google Scholar]
  24. Cutter, S.L.; Mitchell, J.T.; Scott, M.S. Revealing the Vulnerability of People and Places: A Case Study of Georgetown County, South Carolina Susan. Ann. Assoc. Am. Geogr. 2000, 90, 713–737. [Google Scholar] [CrossRef]
  25. Enarson, E.P.; Fordham, M.H. Lines that divide, ties that bind: Race, class, and gender in women’s flood recovery in the US and UK. Aust. J. Emerg. Manag. 2000, 15, 43–52. [Google Scholar]
  26. Wisner, B.; Blaikie, P.; Cannon, T.; Davis, I. At Risk: Natural Hazards, People’s Vulnerability and Disasters, 2nd ed.; Routledge: London, UK, 2003. [Google Scholar]
  27. Collins, T.W.; Jimenez, A.M.; Grineski, S.E. Hispanic health disparities after a flood disaster: Results of a population-based survey of individuals experiencing home site damage in El Paso (Texas, USA). J. Immigr. Minority Health 1997, 15, 415–426. [Google Scholar] [CrossRef]
  28. Jimenez, A.M.; Collins, T.W. Intra-Ethnic Disparities in Respiratory Health Problems among Hispanic Residents Impacted by a Flood. J. Asthma 2013, 463–471. [Google Scholar] [CrossRef]
  29. Zahran, S.; Brody, S.; Peacock, W.; Vedlitz, A.; Grover, H. Social vulnerability and the natural and built environment: A model of flood casualties in Texas. Disasters 2008, 32, 537–560. [Google Scholar] [CrossRef] [PubMed]
  30. Hossain, M.K.; Meng, Q. A thematic mapping method to assess and analyze potential urban hazards and risks caused by flooding. Comput. Environ. Urban Syst. 2020, 79, 101417. [Google Scholar] [CrossRef]
  31. Beady, C.H.; Bolin, R.; Farrell, W.C.; Reed, W.L. The role of the black media in disaster reporting to the black community (Alabama). In Natural Hazard Research, Working Paper; University of Colorado: Boulder, CO, USA, 1986; Volume 56. [Google Scholar]
  32. Bolin, R. Disaster Impact and Recovery: A comparison of Black and White Victims. Int. J. Mass Emergencies Disasters 1986, 4, 35–50. [Google Scholar]
  33. Fothergill, A.; DeRouen Darlington, J.A.; Maestas, E.G.M. Race, ethnicity and disasters in the United States: A review of the literature. Disasters 1999, 23, 156–173. [Google Scholar] [CrossRef] [PubMed]
  34. Chakraborty, J.; Collins, T.W.; Montgomery, M.C.; Grineski, S.E. Social and spatial inequities in exposure to flood risk in Miami, Florida. Nat. Hazards Rev. 2014, 15, 1–10. [Google Scholar] [CrossRef]
  35. Fielding, J.; Burningham, K. Environmental inequality and flood hazard. Int. J. Justice Sustain. 2005, 10, 379–395. [Google Scholar] [CrossRef]
  36. Grineski, S.E.; Collins, T.W.; Chakraborty, J. Hispanic heterogeneity and environmental injustice: Intra-ethnic patterns of exposure to cancer risks from traffic-related air pollution in Miami. Popul. Environ. 2013, 35, 26–44. [Google Scholar] [CrossRef]
  37. Montgomery, M.; Chakraborty, J. Social Vulnerability to Coastal and Inland Flood Hazards: A Comparison of GIS-Based Spatial Interpolation Methods. Int. J. Appl. Geospat. Res. (Ijagr) 2013, 4, 58–79. [Google Scholar] [CrossRef] [Green Version]
  38. Ueland, J.; Warf, B. Racialized topographies: Altitude and race in southern cities. Geogr. Rev. 2006, 96, 50–78. [Google Scholar] [CrossRef]
  39. Kulldorff, M. A spatial scan statistic. In Communications in Statistics—Theory and Methods; Birkhäuser: Boston, MA, USA, 1997; pp. 1481–1496. [Google Scholar] [CrossRef]
  40. Ayubi, E.; Mansournia, M.A.; Motlagh, A.G.; Mosavi-Jarrahi, A.; Hosseini, A.; Yazdani, K. Exploring neighborhood inequality in female breast cancer incidence in Tehran using Bayesian spatial models and a spatial scan statistic. Epidemiol. Health 2017, 39, e2017021. [Google Scholar] [CrossRef] [Green Version]
  41. Berra, T.Z.; de Queiroz, A.A.R.; Yamamura, M.; Arroyo, L.H.; da Garcia, M.C.C.; Popolin, M.P.; Santos, D.T.; Ramos, A.C.V.; Alves, L.S.; Fronteira, I.E.; et al. Spatial risk of tuberculosis mortality and social vulnerability in Northeast Brazil. Rev. Soc. Bras. Med. Trop. 2017, 50, 693–697. [Google Scholar] [CrossRef] [Green Version]
  42. Carrel, M.; Emch, M.; Streatfield, P.K.; Yunus, M. Spatio-temporal clustering of cholera: The impact of flood control in Matlab, Bangladesh, 1983–2003. Health Place 2009, 15, 771–782. [Google Scholar] [CrossRef] [Green Version]
  43. Cordes, J.; Castro, M.C. Spatial analysis of COVID-19 clusters and contextual factors in New York City. Spat. Spatio-Temporal Epidemiol. 2020, 34, 100355. [Google Scholar] [CrossRef]
  44. Fuchs, S.; Ornetsmüller, C.; Totschnig, R. Spatial scan statistics in vulnerability assessment: An application to mountain hazards. Nat. Hazards 2012, 64, 2129–2151. [Google Scholar] [CrossRef] [Green Version]
  45. Li, M.; Shi, X.; Li, X.; Ma, W.; He, J.; Liu, T. Sensitivity of disease cluster detection to spatial scales: An analysis with the spatial scan statistic method. Int. J. Geogr. Inf. Sci. 2019, 33, 2125–2152. [Google Scholar] [CrossRef]
  46. Meng, Q.; Cieszewski, C.J. Spatial clusters and variability analysis of tree mortality. Phys. Geogr. 2006, 27, 534–553. [Google Scholar] [CrossRef]
  47. Runadi, T.; Widyaningsih, Y. Application of hotspot detection using spatial scan statistic: Study of criminality in Indonesia. In AIP Conference Proceedings; AIP Publishing LLC: New York, NY, USA, 2017; Volume 1827. [Google Scholar] [CrossRef] [Green Version]
  48. United States Census Bureau. QuickFacts: Birmingham City, Alabama. 2019. Available online: https://www.census.gov/quickfacts/fact/table/birminghamcityalabama/IPE120218 (accessed on 1 August 2020).
  49. Khosravi, K.; Nohani, E.; Maroufinia, E.; Pourghasemi, H.R. A GIS-based flood susceptibility assessment and its mapping in Iran: A comparison between frequency ratio and weights-of-evidence bivariate statistical models with multi-criteria decision-making technique. Nat. Hazards 2016, 83, 947–987. [Google Scholar] [CrossRef]
  50. Jha, A.; Lamond, J.; Bloch, R.; Bhattacharya-Mis, N.; Lopez, A.; Papachristodoulou, N.; Bird, A.; Proverbs, D.; Davies, J.; Barker, R. Five Feet High and Rising: Cities and Flooding in 21st Century. Available online: http://documents.worldbank.org/curated/en/612141468176682794/Five-feet-high-and-rising-cities-and-flooding-in-the-21st-century (accessed on 1 August 2020).
  51. Lyu, H.M.; Sun, W.J.; Shen, S.L.; Arulrajah, A. Flood risk assessment in metro systems of mega-cities using a GIS-based modeling approach. Sci. Total Environ. 2018, 626, 1012–1025. [Google Scholar] [CrossRef]
  52. FEMA. Post—Disaster Economic Evaluation of Hazard Mitigation; 2000. Available online: https://www.fema.gov/media-library-data/20130726-1711-25045-3176/losses_avoided_in_birmingham__alabama.txt (accessed on 1 August 2020).
  53. City of Birmingham. Village Creek Watershed Improvement Plan: Stream and Channel Improvements; 2016. Available online: https://www.birminghamal.gov/wp-content/uploads/2017/10/Appendix-D-Channel-Improvements-HH-Report.pdf (accessed on 1 August 2020).
  54. US Army Corps of Engineers. Birmingham, Alabama Valley Creek Flood Risk Management Study. 2019. Available online: https://www.sam.usace.army.mil/Portals/46/docs/planning_environmental/images/ValleyCreekCODELFactsheet19MAR2019.pdf (accessed on 1 August 2020).
  55. FEMA. FEMA Flood Service Map Center. Available online: https://msc.fema.gov/portal/availabilitySearch (accessed on 15 January 2020).
  56. FEMA. Definitions of FEMA Flood Zone Designations. 2020. Available online: https://efotg.sc.egov.usda.gov/references/public/NM/FEMA_FLD_HAZ_guide.pdf (accessed on 1 August 2020).
  57. Manson, S.; Schroeder, J.; Van Riper, D.; Ruggles, S. IPUMS National Historical Geographic Information System: Version 14.0; University of Minnesota: Minneapolis, MN, USA, 2019. [Google Scholar] [CrossRef]
  58. United States Census Bureau. American Community Survey. 2020. Available online: https://www.census.gov/acs/www/data/data-tables-and-tools/data-profiles/2015/ (accessed on 1 August 2020).
  59. Patil, G.P.; Taillie, C. Geographic and network surveillance via scan statistics for critical area detection. Stat. Sci. 2003, 18, 457–465. [Google Scholar] [CrossRef]
  60. Ozdenerol, E.; Williams, B.L.; Kang, S.Y.; Magsumbol, M.S. Comparison of spatial scan statistic and spatial filtering in estimating low birth weight clusters. Int. J. Health Geogr. 2005, 4, 1–10. [Google Scholar] [CrossRef] [Green Version]
  61. Quick, M.; Law, J. No TitleaExploring Hotspots of Drug Offences in Toronto: A Comparison of Four Local Spatial Cluster Detection Methods. Can. J. Criminol. Crim. Justice 2013, 55, 215–238. [Google Scholar] [CrossRef]
  62. SaTScan. SaTScan: Software for the spatial, temporal, and space-time scan statistics. 2018. Available online: https://www.satscan.org/ (accessed on 5 March 2020).
  63. Rufat, S.; Tate, E.; Burton, C.G.; Maroof, A.S. Social vulnerability to floods: Review of case studies and implications for measurement. Int. J. Disaster Risk Reduct. 2015, 14, 470–486. [Google Scholar] [CrossRef] [Green Version]
Figure 1. One-hundred-year floodplain areas in Birmingham, AL, USA (FEMA, 2020) [55].
Sustainability 12 09139 g001
Figure 2. Spatial cluster of children and the elderly population in the floodplain areas in 2015.
Sustainability 12 09139 g002
Figure 3. Spatial cluster of children and the elderly population in the floodplain areas in 1990.
Sustainability 12 09139 g003
Figure 4. Spatial cluster of poor population in the floodplain areas in 1990.
Sustainability 12 09139 g004
Figure 5. Spatial cluster of poor population in the floodplain areas in 2015.
Sustainability 12 09139 g005
Figure 6. Spatial cluster of the White population in the floodplain areas in 1990.
Sustainability 12 09139 g006
Figure 7. Spatial cluster of the White population in the floodplain areas in 2015.
Sustainability 12 09139 g007
Figure 8. Spatial cluster of the African American population in the floodplain areas in 1990.
Sustainability 12 09139 g008
Figure 9. Spatial cluster of the African American population in the floodplain areas in 2015.
Sustainability 12 09139 g009
Figure 10. Spatial cluster of the Hispanic population in the floodplain areas in 2000.
Sustainability 12 09139 g010
Figure 11. Spatial cluster of the Hispanic population in the floodplain areas in 2015.
Sustainability 12 09139 g011
Table 1. Total number of populations of each demographic factor in the 100-year floodplain areas of Birmingham (IPUMS NHGIS and U.S. Census Bureau).
Total Number of Populations
Decennial Census Year
Demographic FactorsVillage CreekValley CreekFive Mile Creek
199020002010201519902000201020151990200020102015
Children (under 5 years) and elderly (over 65 years)21601896185718849888388901492435716100
Below poverty level2158243028023429944128513601461026685
White8123395543863085880701021006730
African American5863524860957418333640694005474306997239
Hispanic01022795140928310000
Total number of populations in 100-year floodplain areas67045911671686703829436042515153102129210334
Total number of residential buildings18511878218528331098127113481757516273118
Table 2. Total number of populations and residential buildings located in each spatial cluster in decennial census year 1990.
Demographic FactorsSpatial ClusterNumber of Population and %Number of Residential Buildings
Village CreekValley CreekFive Mile CreekVillage CreekValley CreekFive Mile Creek
Children (under 5 years and elderly (over 65 years)High Cluster-Significant0 (0)375 (9.79)0 (0)01050
High Cluster-Not Significant546 (8.14)111 (2.90)0 (0)4733560
Low Cluster-Significant191 (2.85)110 (2.87)0 (0)1272877
Low Cluster-Not Significant167 (2.49)0 (0)0 (0)8100
Below poverty levelHigh Cluster-Significant409 (6.10)509 (13.29)0 (0)862830
High Cluster-Not Significant0 (0)166 (4.34)0 (0)01650
Low Cluster-Significant37 (0.55)81 (2.12)0 (0)2663480
Low Cluster-Not Significant0 (0)0 (0)0 (0)000
WhiteHigh Cluster-Significant757 (11.29)249 (6.50)0 (0)4262290
High Cluster-Not Significant0 (0)0 (0)0 (0)000
Low Cluster-Significant3 (0.04)12 (0.31)0 (0)12136590
Low Cluster-Not Significant0 (0)0 (0)0 (0)0630
African AmericanHigh Cluster-Significant3276 (48.87)0 (0)0 (0)88200
High Cluster-Not Significant838 (12.50)1217 (31.78)0 (0)2633920
Low Cluster-Significant0 (0)331 (8.64)0 (0)491110
Low Cluster-Not Significant0 (0)152 (3.97)0 (0)0730
HispanicHigh Cluster-Significant0 (0)0 (0)0 (0)000
High Cluster-Not Significant0 (0)0 (0)0 (0)000
Low Cluster-Significant0 (0)0 (0)0 (0)000
Low Cluster-Not Significant0 (0)0 (0)0 (0)000
Table 3. Total number of populations and residential buildings located in each spatial cluster in census year 2015.
Demographic FactorsSpatial ClusterNumber of Population and %Number of Residential Buildings
Village CreekValley CreekFive Mile CreekVillage CreekValley CreekFive Mile Creek
Children (under 5 years) and elderly (over 65 years)High Cluster-Significant951 (10.97)555 (10.77)0 (0)9165400
High Cluster-Not Significant0 (0)0 (0)0 (0)000
Low Cluster-Significant109 (1.26)138 (2.68)0 (0)10794310
Low Cluster-Not Significant0 (0)0 (0)0 (0)0011
Below poverty levelHigh Cluster-Significant949 (10.95)748 (14.52)0 (0)2374890
High Cluster-Not Significant0 (0)0 (0)31 (9.28)0031
Low Cluster-Significant124 (1.43)92 (1.79)1 (0.30)64065127
Low Cluster-Not Significant0 (0)0 (0)0 (0)0180
WhiteHigh Cluster-Significant344 (3.97)62 (1.20)27 (8.08)25014427
High Cluster-Not Significant0 (0)0 (0)0 (0)000
Low Cluster-Significant15 (0.17)0 (0)0 (0)195983557
Low Cluster-Not Significant0 (0)0 (0)0 (0)01340
African AmericanHigh Cluster-Significant4224 (48.72)0 (0)0 (0)159400
High Cluster-Not Significant0 (0)0 (0)22 (6.59)0011
Low Cluster-Significant185 (2.13)749 (14.54)0 (0)1011260
Low Cluster-Not Significant0 (0)328 (6.37)0 (0)02680
HispanicHigh Cluster-Significant476 (5.49)0 (0)0 (0)29500
High Cluster-Not Significant0 (0)0 (0)0 (0)000
Low Cluster-Significant0 (0)0 (0)0 (0)169300
Low Cluster-Not Significant0 (0)0 (0)0 (0)000
Publisher’s Note: MDPI stays neutral with regard to jurisdictional claims in published maps and institutional affiliations.

