Article

Spray Drift Generated in Vineyard during Under-Row Weed Control and Suckering: Evaluation of Direct and Indirect Drift-Reducing Techniques

1
Department of Agricultural, Forest and Food Sciences (DiSAFA), University of Turin (UNITO), Largo Paolo Braccini 2, 10095 Grugliasco (TO), Italy
2
Institute of Bio-Economy & Agro-Technology, Centre of Research & Technology Hellas, Dimarchou Georgiadou 118, 38333 Volos, Greece
*
Author to whom correspondence should be addressed.
Sustainability 2020, 12(12), 5068; https://doi.org/10.3390/su12125068
Submission received: 8 April 2020 / Revised: 14 June 2020 / Accepted: 18 June 2020 / Published: 22 June 2020
(This article belongs to the Special Issue Suitable Agronomic Techniques for Sustainable Agriculture)

Abstract

:
The most widespread method for weed control and suckering in vineyards is under-row band herbicide application. It could be performed for weed control only (WC) or weed control and suckering (WSC) simultaneously. During herbicide application, spray drift is one of the most important environmental issues. The objective of this experimental work was to evaluate the performance of specific Spray Drift Reducing Techniques (SDRTs) used either for WC or WSC spray applications. Furthermore, spray drift reduction achieved by buffer zone adoption was investigated. All spray drift measurements were conducted according to ISO22866:2005 protocol. Sixteen configurations deriving from four nozzle types (two conventional and two air-induction—AI) combined with or without a semi-shielded boom at two different heights (0.25 m for WC and 0.50 m for WSC) were tested. A fully-shielded boom was also tested in combination with conventional nozzles at 0.25 m height for WC. Ground spray drift profiles were obtained, from which corresponding Drift Values (DVs) were calculated. Then, the related drift reduction was calculated based on ISO22369-1:2006. It was revealed that WC spray applications generate lower spray drift than WSC applications. In all cases, using AI nozzles and semi-shielded boom significantly reduced DVs; the optimum combination of SDRTs decreased spray drift by up to 78% and 95% for WC and WSC spray application, respectively. The fully-shielded boom allowed reducing nearly 100% of spray drift generation. Finally, the adoption of a cropped buffer zone that includes the two outermost vineyard rows lowered the total spray drift up to 97%. The first 90th percentile model for the spray drift generated during herbicide application in vineyards was also obtained.

1. Introduction

The area under vines represents one of the most important worldwide agricultural businesses covering 7.5 million hectares [1]. For total grape production, Italy (8.4 Mt) ranks second after China (13.7 Mt), followed by USA, France and Spain [1].
Similarly to other 3D crops, vineyard management requires a lot of different agricultural practices along the season; among these, weed control and suckering are essential for achieving adequate grapes’ yield [2]. The uncontrolled weed growth can have significant effects on vineyard development and vigor, due to the competition for soil moisture and nutrients. This aspect is of prime importance in the new vineyard plantations, as optimum young vines’ growth can be achieved in weed-free conditions during the first three years; it should be noted that uncontrolled weed growth in young vineyard plantations can reduce vines’ biomass by more than 80% [3]. Therefore, the most widespread practice to manage weeds in vineyards consists of maintaining the resident vegetation in the central zone of lanes between the rows by mowing or cultivating (e.g., cover crops with green manure) to guarantee the soil conservation and tractor’s accessibility, while weeds resident in the soil bands under the vines are fully controlled/removed. To date, the most widespread weed control techniques are: (i) chemical control by herbicide application; (ii) mechanical control through grass mowing; and (iii) soil harrowing [4]. Alternative weed control techniques are also available, such as (i) flame weeding [5,6], (ii) hot-foam [7] and (iii) pressurized water weed control [3], but not as widely used. Irrespective of inter-row or under-row weed control strategy, the techniques adopted are dependent on topographic area characteristics or vineyard training system [8].
The most common technique for weed control under the vines is the pre-emergence and post-emergence herbicide application, as it is relatively cheap and timely [5,9]. In addition, chemical control of weeds can be executed simultaneously with suckering operation by applying post-emergence herbicides, a practice that provides an additional advantage, due to substantial cost saving and possible environmental gains [5,10]. Indeed, suckering is another significant agricultural practice for vineyards [11,12]. Uncontrolled vine suckers’ development can negatively affect canopy growth rate with related impact on the final grapes’ yield [13] and quality [2]. Traditionally, suckering is conducted manually and is related to increased labor time and cost [14,15]. In order to overcome these disadvantages, mechanical methods, such as rotating scourges have been used thoroughly, but they can damage the trunk of vines [16] resulting in possible infections [17]. In addition, flaming is a feasible alternative method for the non-lignified suckers [7]. However, nowadays, spraying herbicides or synthetic growth regulators to terminate suckers has become the most popular technique by applying a band spray to the rootstock of the vine row, covering approximately one-third of the vineyard soil [13,14,18].
Since the early 1990s, a lot of studies demonstrated the adverse effect of herbicide use to both environmental and human health [19,20,21,22], especially when not applied appropriately [23]. The increased public concern has caused policy and regulatory institutions to enforce a series of actions aiming at herbicide application reduction. However, herbicide use maintains a crucial role for the economic sustainability of agriculture in the foreseeable future [22,24]. This is confirmed by the global herbicide market size that is expected to reach overall market revenue of $8 billion by 2025, by growing at a compound annual growth rate of 4.8% during the forecast period (2020–2025) (https://www.alliedmarketresearch.com/herbicides-market). The world herbicide consumption represents 48% of Plant Protection Products (PPPs) globally used [20].
In this context, various international organizations have addressed issues related to the correct use of PPPs. In March 2020, the Organization for Economic Co-operation and Development developed a report on how to manage biodiversity impacts of fertilizer and pesticide use [25]. The Food and Agriculture Organization has issued a Code of Conduct on the Distribution and Use of PPPs that promotes information exchange and best practices [26]. The World Health Organization has developed an International Program on Chemical Safety, where PPP handling is also covered [27]. At European level, in 2009, the Council of the European Union adopted Directive 2009/128/EC on Sustainable Use of Pesticides that highlighted pesticide drift risks generated during spray application [28]. This directive represents bedrock EU legislation for all improvements pertaining to spray drift reduction and efficiency of pesticide application, including an overall definition and requirement for dedicated indirect methods of drift reduction like buffer zones or no-spray zones [29,30]. Each EU Member State specifies the characteristics of these zones in its National Action Plan (NAP). Among the technical information contained in the NAP, the minimum width of buffer zones, that include both free or cropped no-spray zones, and their relationship to different spray application techniques must also be delineated (in terms of drift reduction or avoidance capacity). These requirements clearly indicate that drift measurement and the related drift reduction extent, unique to each sprayer/technology, are essential tools to achieve a more sustainable spray application [31].
According to ISO22866:2005, spray drift is “the quantity of PPP that is carried out of the sprayed (treated) area by the action of air currents during the application process” [32]. Among the pollutants from PPP use, agrochemical spray drift continues to be a major challenge because PPPs can be deposited in undesirable areas and pose risks to both the environment and bystanders [32,33,34,35,36,37,38]. Spray drift generated by field crop sprayers can reach 50% of the amount of PPP spray mixture applied [39], but in the case of vineyard under-row band application, this is expected to be lower due to the use of reduced boom height, length, and a low sprayer forward speed [40,41,42].
In order to accomplish the regulations about the spray drift reduction or avoidance, it is important to use herbicide application techniques which are able to minimize spray drift as well as increase the application efficiency simultaneously. Specific Spray Drift Reduction Techniques (SDRTs) can be used during the application of herbicides in vineyards. The SDRT of prime interest is the use of air-induction (AI) nozzles as they are broadly recognized to reduce spray drift, due to a larger droplet size spectrum than conventional flat fan nozzles [43,44,45,46]. In particular, the use of AI nozzles is of high relevance for this type of application because the most used herbicides in vineyards for both weed control and suckering are systemic (e.g., glyphosate-based herbicides) [2,47]. It is well documented that for systemic herbicides, AI flat fan nozzles guarantee the same efficacy to that obtained using conventional flat fan nozzles [48,49,50,51,52]. Another SDRT broadly used for herbicide application is boom shielding [53,54]. When the weed control and suckering is performed at the same time, a semi-shielded boom is commonly used consisting of a plastic cabin placed on top of the boom to protect the nozzle spray outlets. The semi-shielded boom does not interfere with the spray jet angle allowing the suckering operation. On the contrary, when the spray application is intended for weed control only, it is possible to further minimize the spray drift using a fully-shielded boom, consisting of a plastic cabin integral with a brush long enough to run on the soil. This last option is especially used for weed control in the young vine plantations, to avoid the spray contact with the green tissues, because herbicide exposure could significantly injure young vines [55]. Combination of different SDRTs could possibly provide better results in terms of drift reduction. A lot of research has been focused on spray drift generated during PPP canopy application in 3D crops using air-assisted sprayers [56,57,58,59,60,61] and PPP applications in arable field crops using boom sprayers [56,62,63,64,65]. However, to date, few experimental data are available for the spray drift generated during herbicide spray application in vineyards.
In this context, the objective of this experimental work was to compare spray drift of different under-row band herbicide spray application techniques (conventional vs. SDRTs) used for weed control only, and for weed control and suckering at the same time. Furthermore, the contribution of individual row spraying to the total ground deposition spray drift was evaluated, with the final aim to identify the spray drift reduction achievable by the adoption of cropped buffer zones. The 90th percentile model characteristics for the spray drift generated during herbicide applications in vineyards was also investigated.

2. Materials and Methods

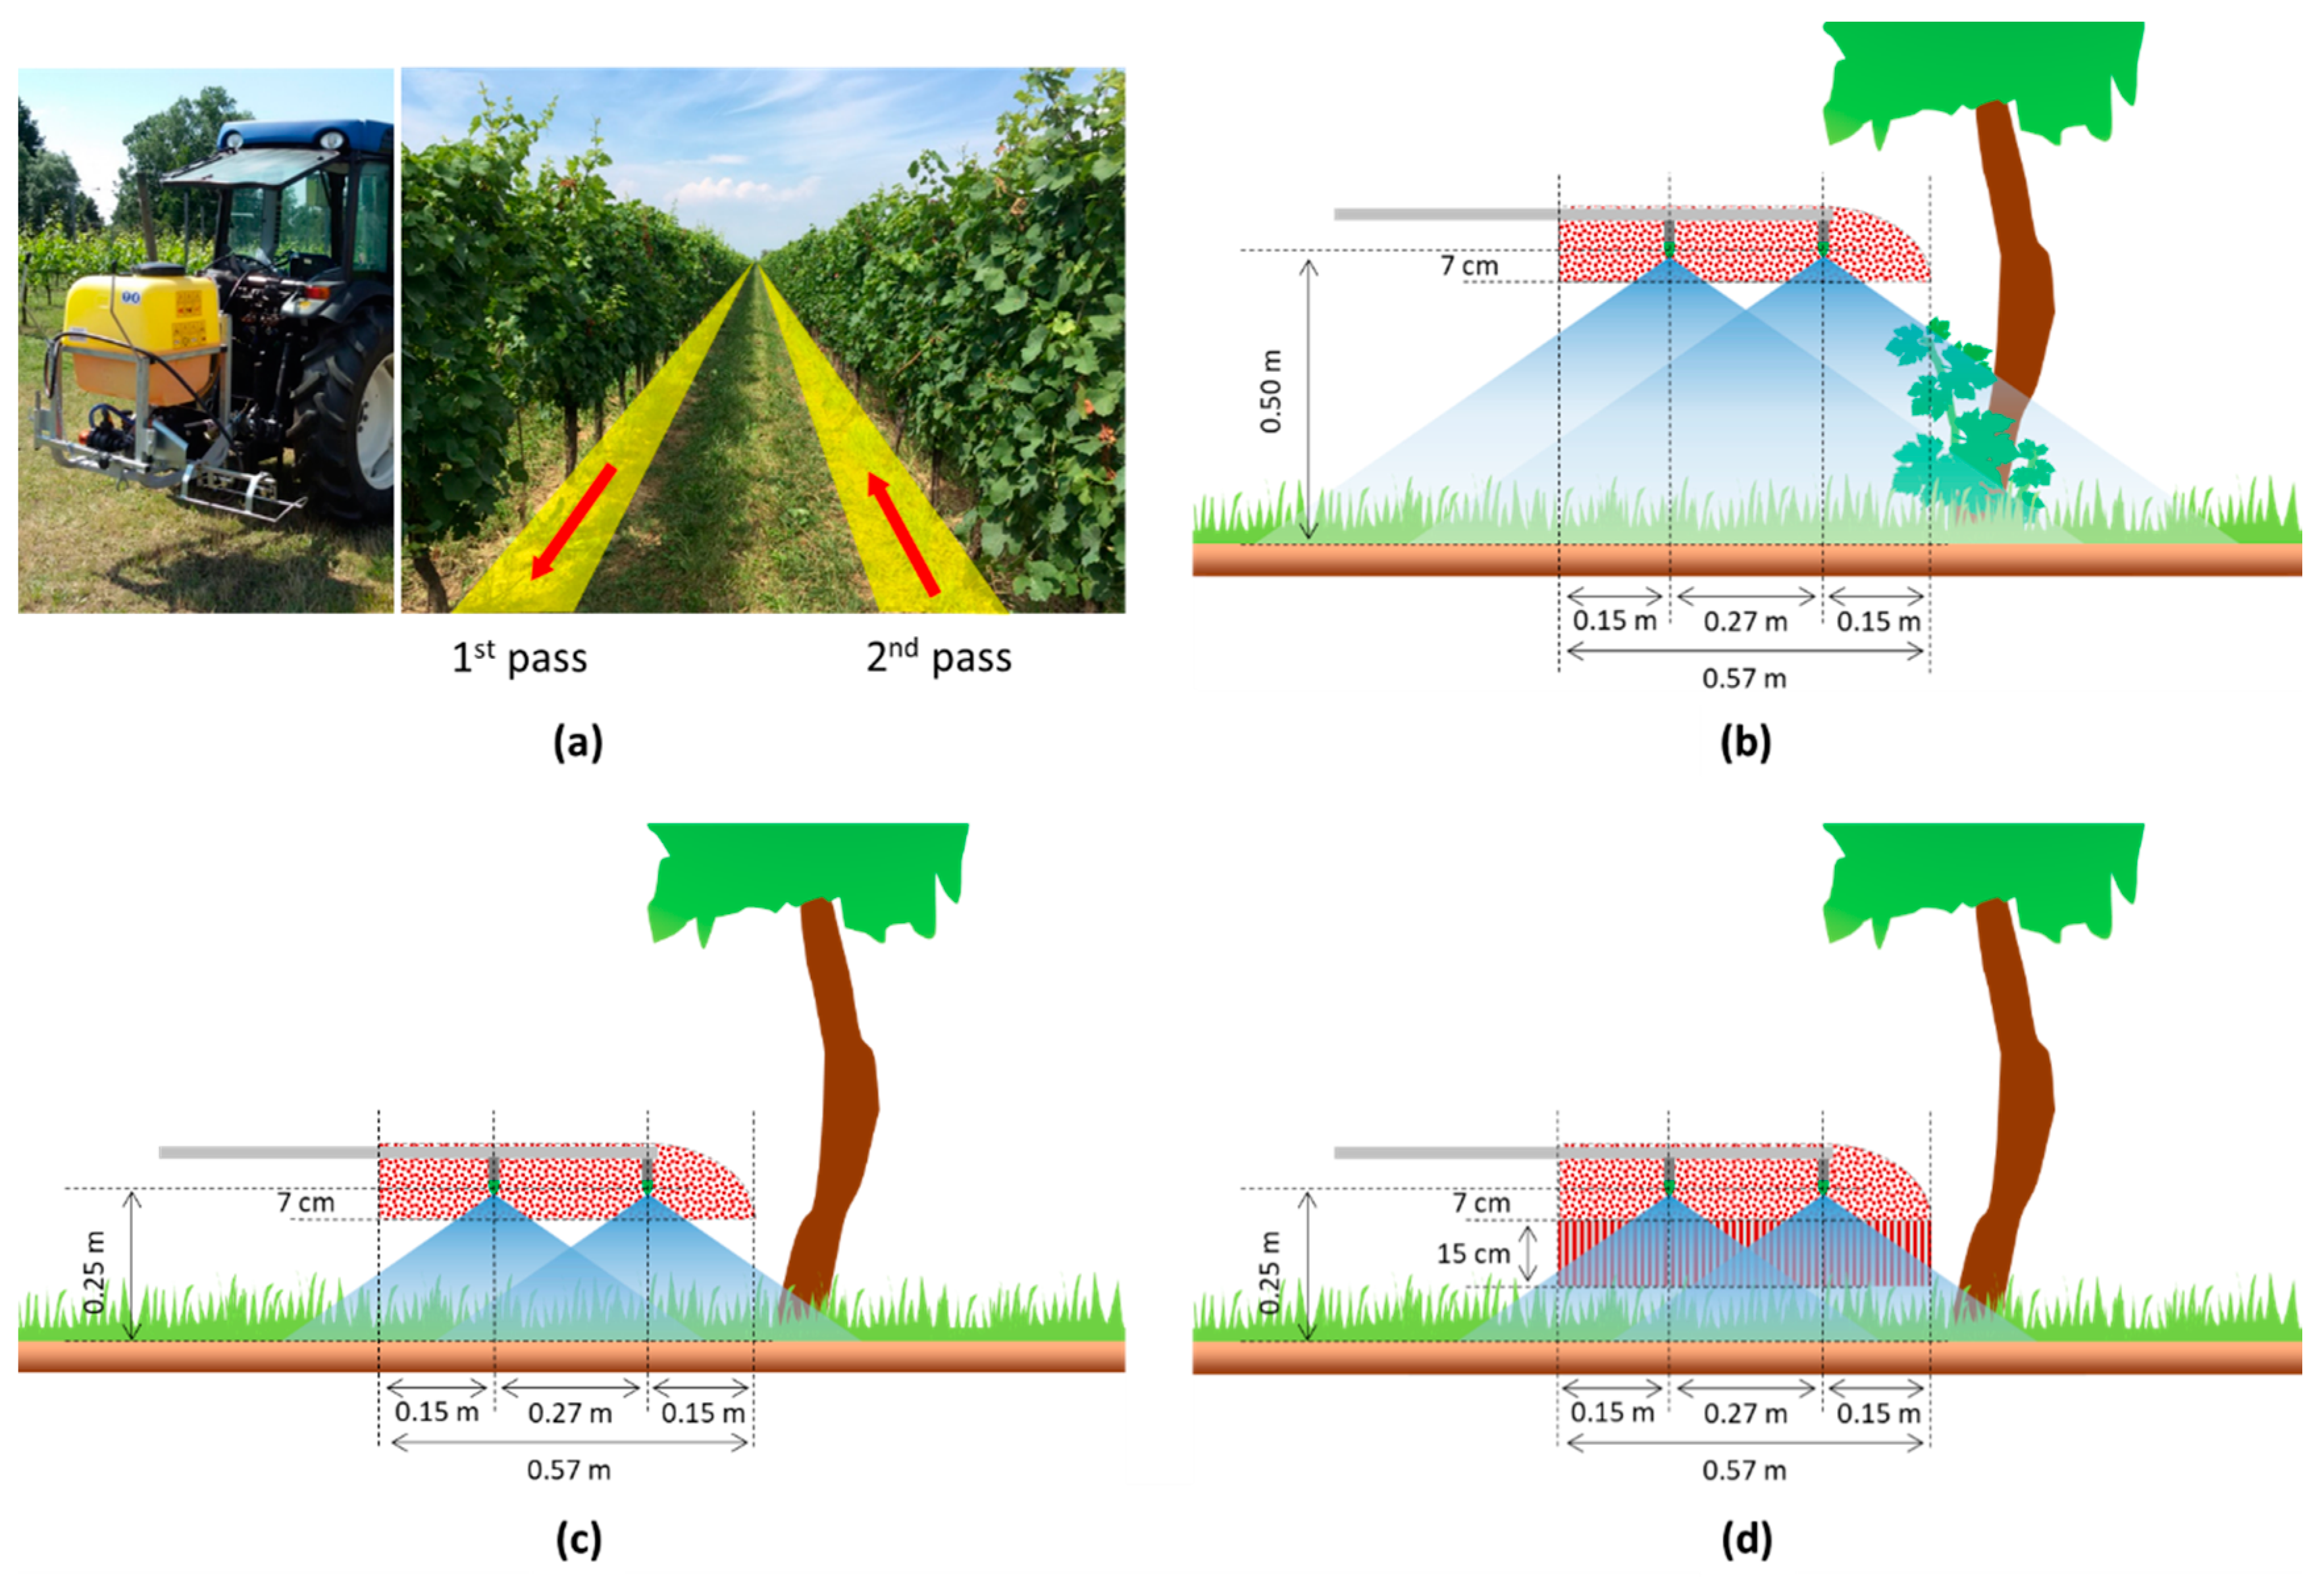
2.1. Characteristics of Spray Application Equipment and Its Configurations Tested

A conventional boom sprayer Abbà (Abbà s.n.c., Centallo—CN, Italy) specifically designed for under-row band herbicide application in vineyards was tested. The sprayer was composed of a short boom (0.57 m width) connected to the main 200 L polyethylene tank through a long flexible hose. The tank was mounted to the tractor through the three-point linkage. It is possible to mount the sprayer boom in three different lateral positions, namely front, mid or rear of the tractor, and at different heights above the ground. In this study, the spray boom unit was rear-mounted in lateral position and equipped with two nozzle holders characterized by 0.27 m nozzle spacing (Figure 1a). Furthermore, two types of shields could be mounted: (a) a plastic cabin that provides a partial shielding called “semi-shielded boom” and (b) a long brush protecting system integral with a plastic cabin that provides a full shielding called “fully-shielded boom”.
According to common farmer practices, boom height of 0.50 m was tested for simultaneous chemical weed control and suckering (Figure 1b), whilst height of 0.25 m was tested for only weed control (Figure 1c). Eight configurations for each boom height were tested, deriving from the use of conventional flat fan nozzles, XR110015 and XR11003, and AI flat fan nozzles, AI110015 and AI11003 (Teejet Technologies, IL, USA) in combination with or without the semi-shield (Table 1). The fully-shielded boom was used for weed control only (Figure 1d) combined with conventional nozzles (Table 1).
For all tested configurations, a fixed volume of 142 L ha−1 was applied (Table 1). To obtain the intended total sprayed volume, the tests were performed using forward speeds equal to 1.11 m s−1 (4 km h−1) and 2.22 m s−1 (8 km h−1) for the 015 and 03 nozzle sizes, respectively. The same working pressure of 0.3 MPa was used, corresponding to nominal nozzle flow rates of 0.59 min−1 and 1.18 L min−1 for the 015 and 03 nozzle sizes, respectively. Applied volume rate and spray liquid pressure was selected according to the most common practices used by the farmers, derived from surveys in the ambit of TOPPS project (http://www.topps-life.org/).

2.2. Characterization of Droplet Size Spectra

The droplet size spectra produced by both conventional and AI nozzles was also determined in laboratory measurements, conducted at DiSAFA facilities (Grugliasco, Turin, Italy), using a Malvern Spraytec laser diffraction system STP5342 (Malvern Instruments Ltd., Worcestershire, UK), using the methodology detailed in Grella et al. [59]. The liquid pressure and the liquid flow rate adopted in the lab trials were the same used in the field trials (Table 1). The droplet diameter for the 10th (D[v,0.1]), 50th or Volume Median Diameter (VMD) (D[v,0.5]) and 90th (D[v,0.9]) percentiles of spray liquid volume were determined for each nozzle. Additionally, the % of spray liquid volume generated with droplet diameters smaller than 100 µm were calculated as V100 parameter. For each nozzle type, two nozzles were randomly sampled from a batch and for each nozzle, three measurements were performed. The two nozzles used for the laboratory droplet size measurements were then mounted on the boom sprayer for field trials.

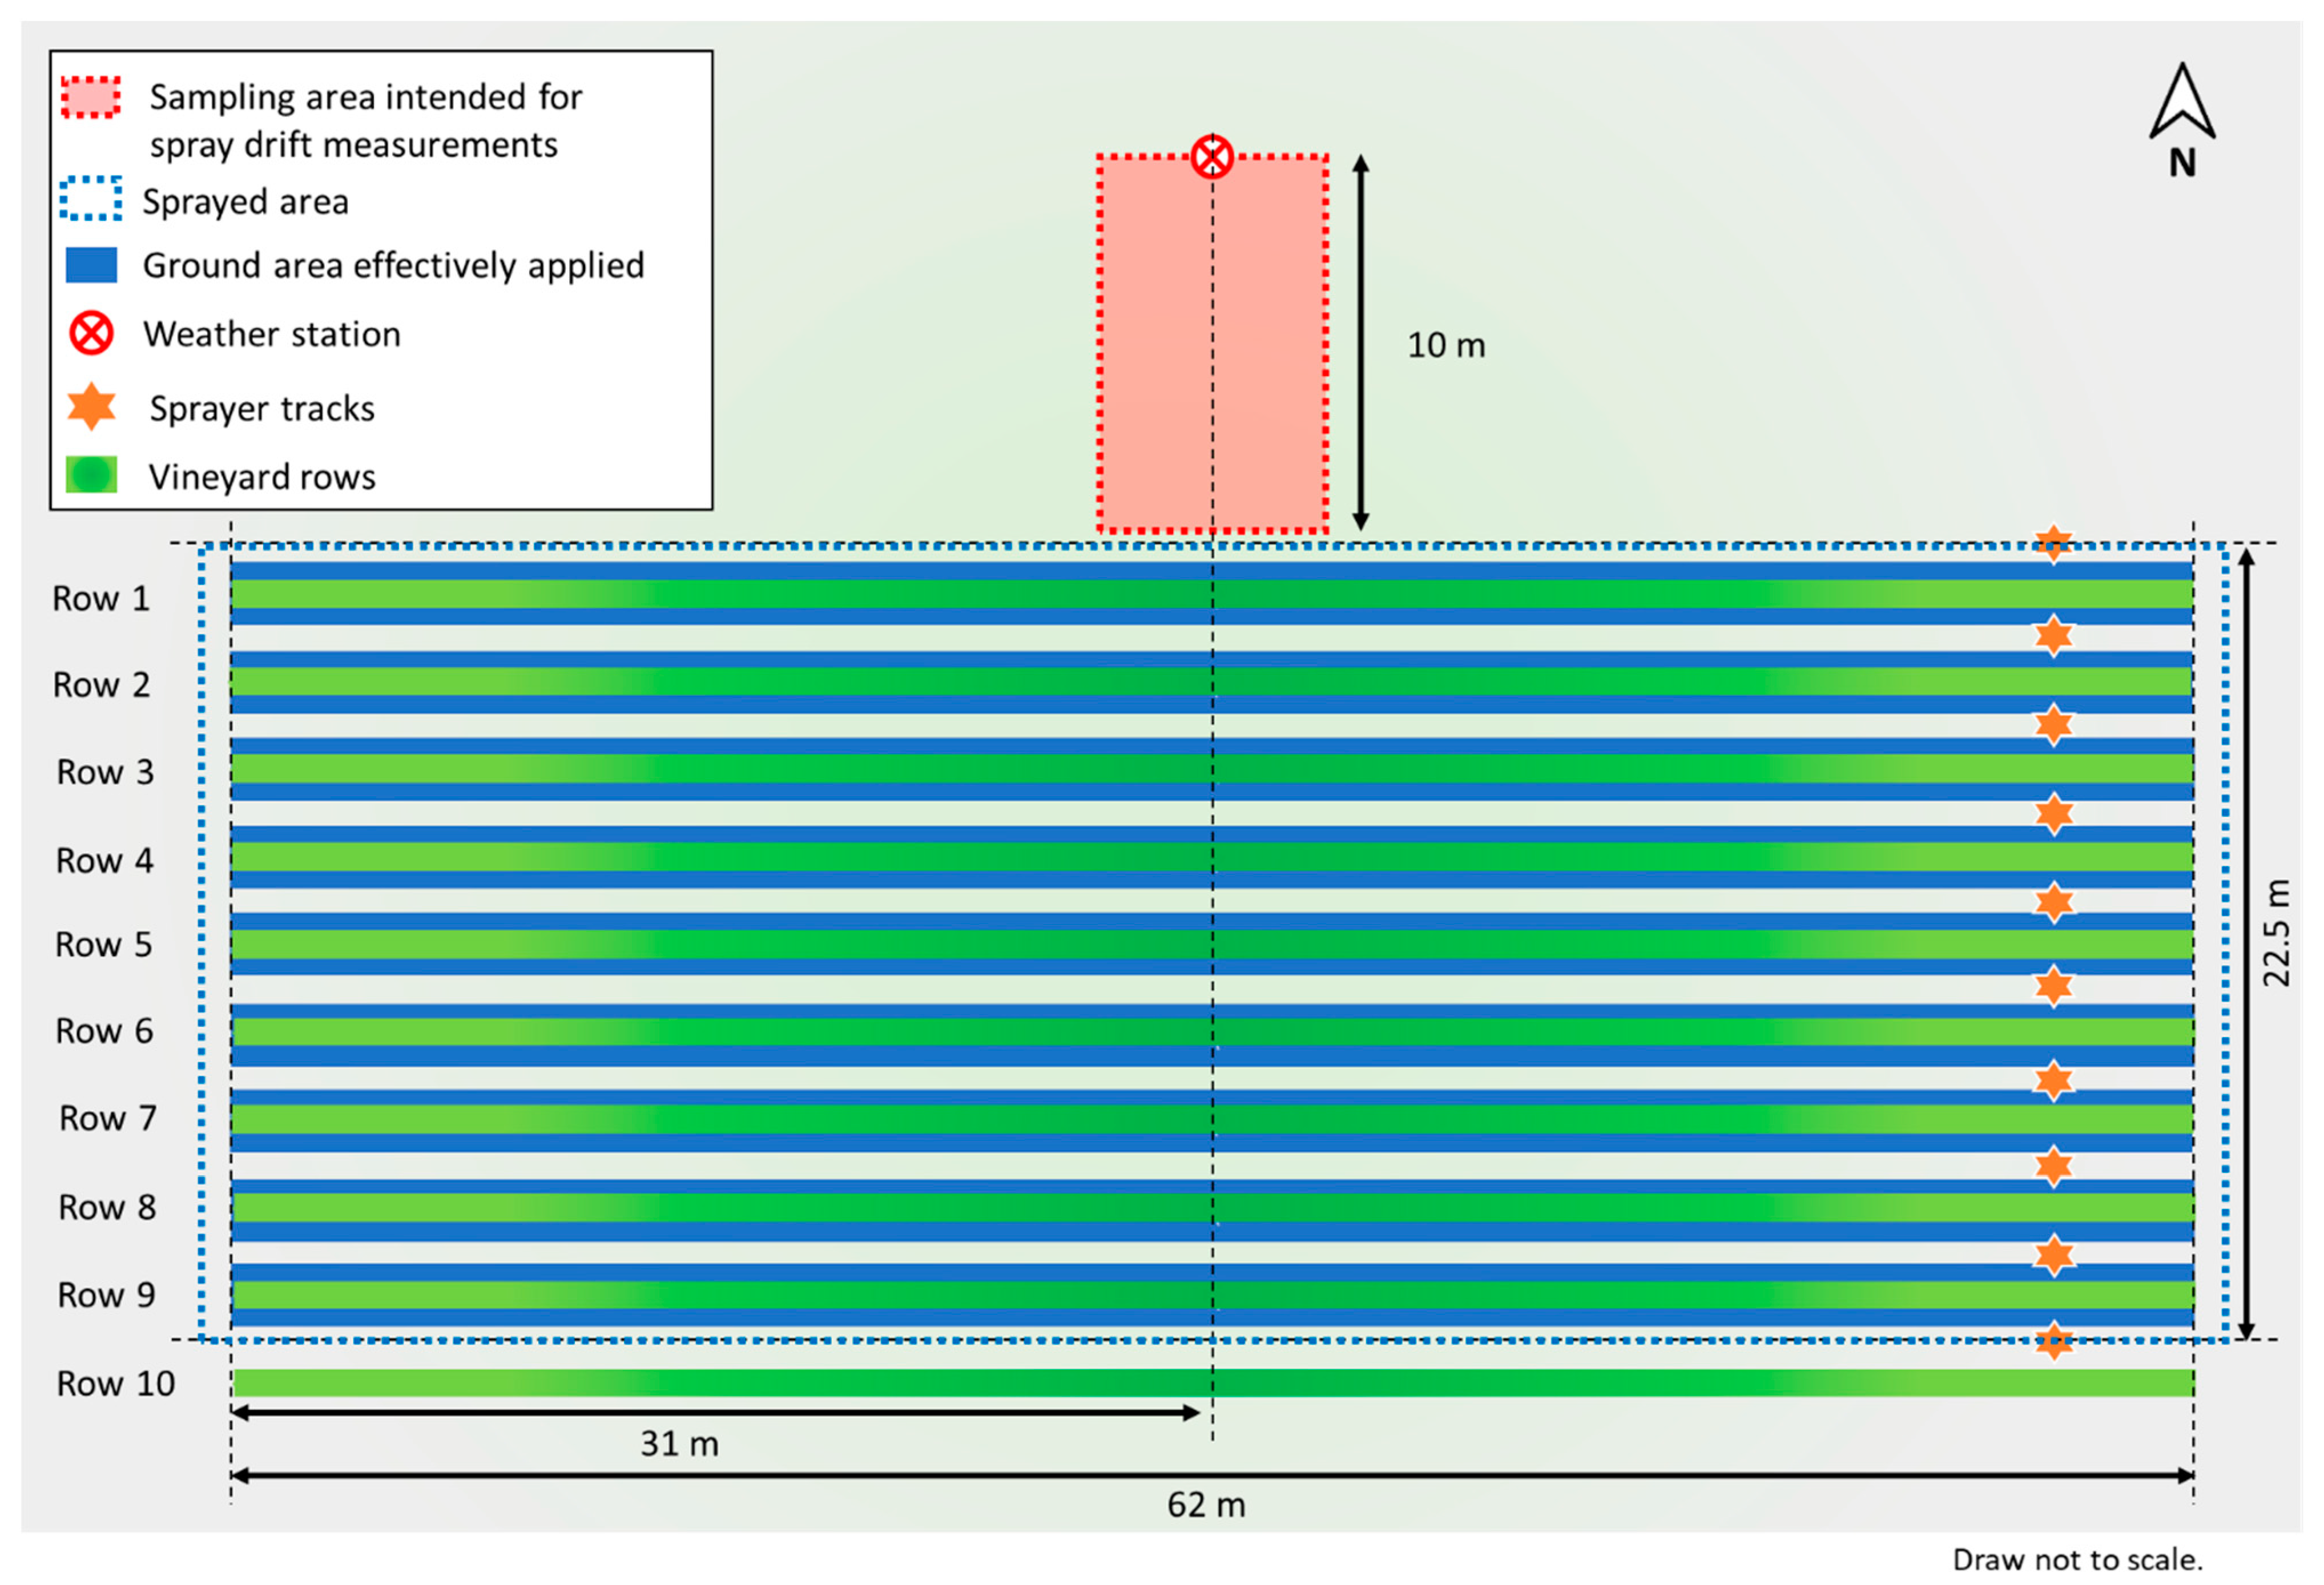
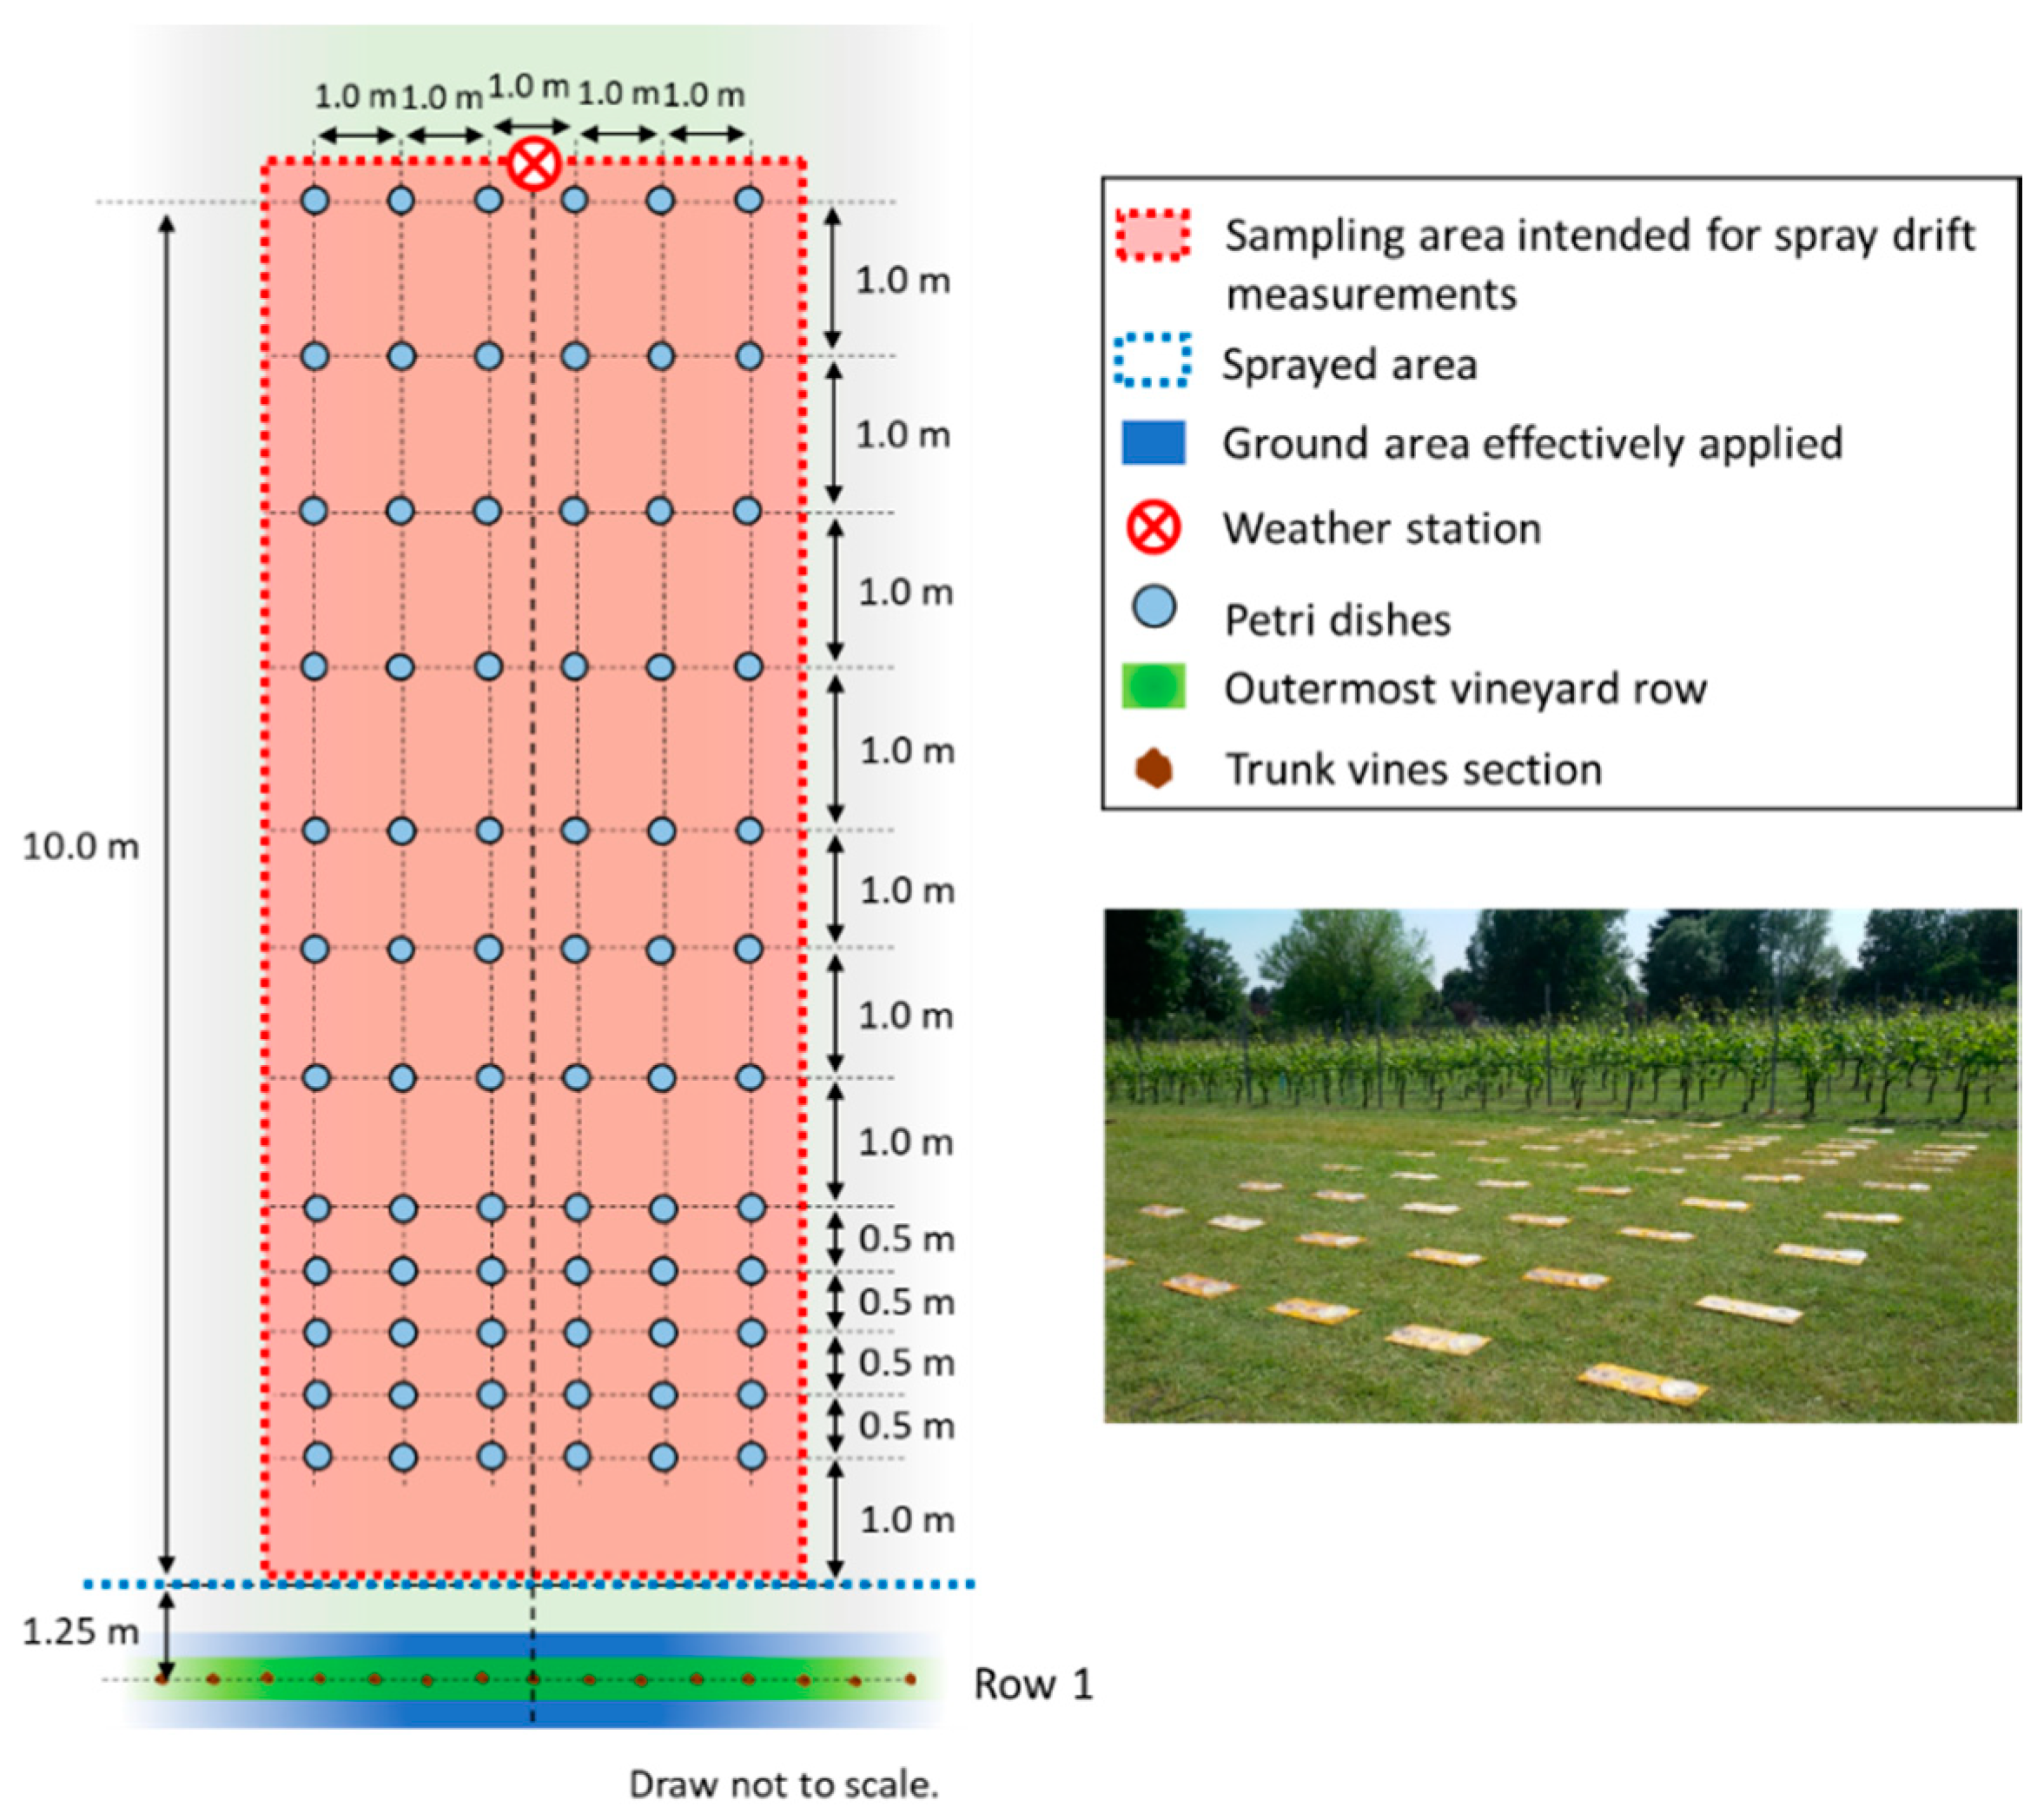
2.3. Test Location and Experimental Plot Design

Tests were performed in an espalier-trained vineyard (cv: Barbera) located at DiSAFA facilities (45°03′60″ N 7°35′65″ E). Planting distances were 2.5 m between rows and 0.8 m within rows, resulting in density of 5000 vines ha−1. The field trials were conducted at early-growth stage with BBCH-scale (Biologische Bundesanstalt, Bundessortenamt and CHemical industry) ranging between 16 and 55 [66].
Field drift measurements were carried out according to ISO22866:2005 [32]. Tests were performed by spraying a dye tracer solution in the nine outer downwind vineyard rows, covering surface area of 1395 m2 (62 × 22.5 m) every replicate (Figure 2).
For each replicate, ground spray drift was measured in twelve bare-soil sampling distances, corresponding to 1, 1.5, 2, 2.5, 3, 4, 5, 6, 7, 8, 9 and 10 m downwind, from the directly-sprayed area. At each location, six discrete ground level horizontal sampler Petri dishes (140 mm diameter) placed 1 m from each other were used to yield a total collection surface of 924 cm2 at each downwind distance (Figure 3). The first line of samplers was placed at 2.25 m from the outermost row, equal to 1 m distance from the sprayed area. Based on preliminary field trials, 10 m downwind was defined as the furthest sampling distance adequate to collect more than 99% of total spray drift [67]. Two minutes after each spray application, Petri dishes were covered and collected in closed dark boxes to prevent tracer photodegradation. Three replications of measurements were conducted for each sprayer configuration in wind conditions that are as similar as is practicable, and the main parameters tested are summarized in Table 1.

2.4. Weather Conditions—Measurements

According to ISO22866:2005 [32], a weather station was employed to monitor the environmental conditions during the trials. The station was equipped with a sonic anemometer 232 (Campbell Scientific, Logan, UT, USA) to measure wind speed and direction relative to the spray track at 4 m above the ground, and two thermo-hygrometer HC2S3 probes (Campbell Scientific, Logan, UT, USA) placed at 3 m and 4 m above the ground, respectively, to measure air temperature and humidity. All measurements were taken at a frequency of 0.1 Hz (1 per s) and all data was recorded automatically by a CR800 data-logger (Campbell Scientific, Logan, UT, USA). The weather station was positioned at the edge of the downwind area in the center of the drift sampling area (10 m away from the sprayed area) (Figure 2 and Figure 3). The environmental conditions were monitored for the full duration of each test, in order to follow specific conditions for each test replicate to be valid for our study [32]. More specifically, (a) average wind speed should be higher than 1 m s−1; (b) wind measurement counts of less than 1 m s−1 (outliers) should not exceed 10% of all measurements recorded; (c) mean wind direction should be 90° ± 30° to the spray track; (d) frequency of non-centered wind direction (>45°) to the spray track should not exceed 30% of data recordings; and (e) mean air temperature should remain between 5 °C and 35 °C.

2.5. Spray Liquid and Tracer Concentration

To measure deposits on collectors, the E-102 Tartrazine yellow dye tracer, 85% (w/w) (Novema S.r.l., Torino, Italy), was added to the sprayer tank at 10 g L−1; Tartrazine was chosen as tracer for its high extractability and low degradation [68]. Prior to each test, a Petri dish was placed in the middle of the sprayed area and was collected 30 s before spraying started, to be used as a blank sample of reference. Three samples of the sprayed liquid were also collected from the spray tank content (sampled directly from a nozzle) before and after the spraying to ascertain the precise tracer concentration at the nozzle outlet for each test replicate.

2.6. Determination of Tracer Deposit Amount

Each Petri dish sampler was washed out using 5 mL of deionized water and the extract containing the tracer was shaken for 10 min using an Advanced Orbital Shaker, model 5000 (VWR, Radnor, PA, USA) to completely homogenize the washing solution. Then, the Tartrazine concentration was determined by measuring the absorbance of the washing solution with a spectrophotometer UV-1600PC (VWR, Radnor, PA, USA), set at 427 nm wavelength for peak absorption of the Tartrazine dye. The results were compared against a calibration curve obtained in laboratory using pre-set Tartrazine concentrations prior to the analysis. For each sample, three absorbance measurements were taken and blank samples of deionized water were included to calibrate the equipment.
The deposit on each artificial collector (Di), expressed per unit area in µL cm−2, was calculated from Equation (1) according to ISO22401:2015 as follows [69]:
D i = ( p s m p l p b l k ) V d i l p s p r a y A c o l
where Di is the spray deposit on a single deposit collector, expressed in µL cm−2; psmpl is the absorbance value of the sample (adim.); pblk is the absorbance of the blanks (adim.); Vdil is the volume of the dilution liquid (deionized water) used to dissolve the tracer deposit from the collector in µL; pspray is the absorbance value of the spray mix concentration applied during the tests and sampled at the nozzle outlet (adim.); Acol is the projected area of the collector detecting the spray drift (Petri dish) in cm2.
Once the tracer amount on each sampler was calculated, the mean values derived from the six samples placed at each downwind distance was calculated and the deposit at different distances from the sprayed area was used to draw the drift curve. The amount (µL cm−2) obtained from each replicate was then transformed using a proportion to express ground sediments as percentage of application rate (%) where needed.

2.7. Drift Value (DV) and Relative Spray Drift Reduction Calculation

The surface area under the spray deposit curve, as most characteristic of near-field sedimentation [70,71], was deemed. Therefore, for each replicate, the total spray drift deposition was calculated by numerical integration of the sedimentation curves, as proposed by Grella et al. [59,72], to achieve the corresponding Drift Value (DV). The methodology allowed approximation of the definite integral using the mid-ordinate rule.
The spray drift reduction values (%) were derived from DV, averaged over replicates, according to the ISO22369-1:2006 formula for each configuration tested [73]. Therefore, drift reduction was determined through the pairwise comparison of reference spray configuration XR015_No_H with the other candidate configurations (Table 1).

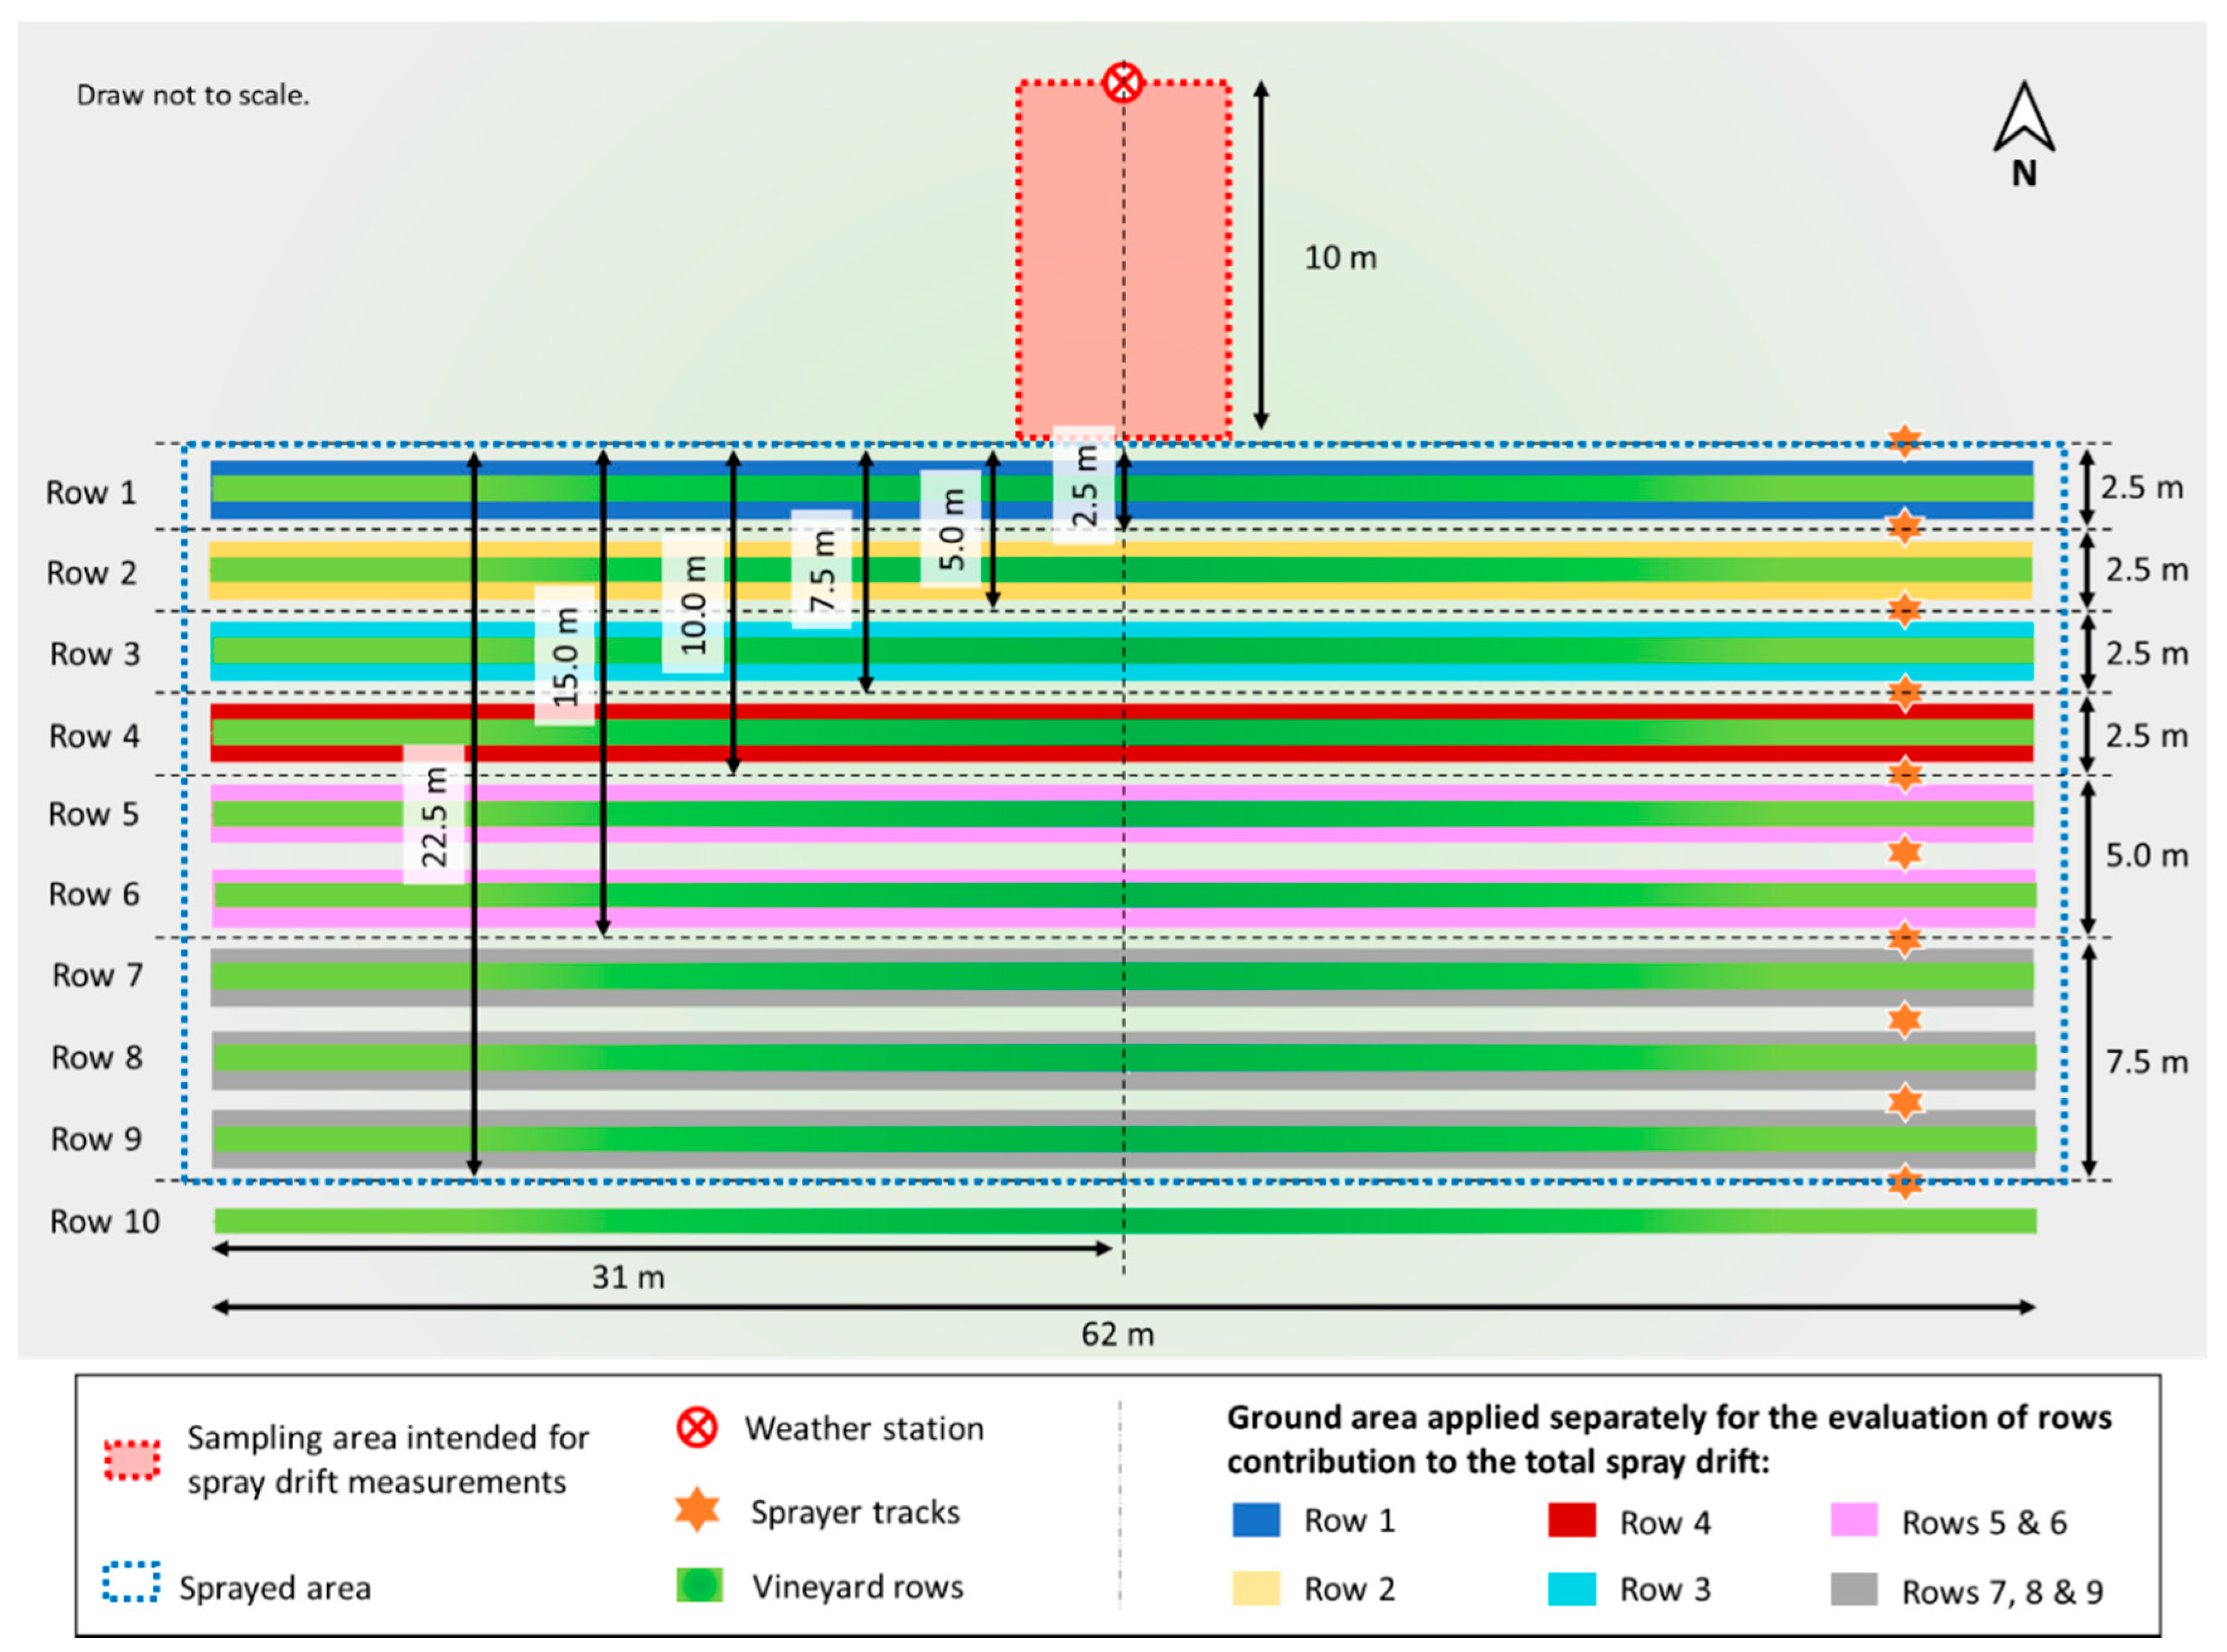
2.8. Contribution of Individual Row Spraying to the Total Ground Deposition Spray Drift

Additional trials were carried out to determine the contribution of individual row spraying to the total ground deposition spray drift [74]. Under-row herbicide application was executed separately for each row, applying the ISO22866:2005 methodology (see Section 2.3 and Section 2.4) [32]. The same sampling layout (Figure 3), consisting in 6 collectors per each distance per 12 sampled distances (from 1 to 10 m from the sprayed area), were adopted. The Petri dishes were collected at the end of each sprayed row and three replications of measurements were performed per each row. In particular, based on preliminary experiments, the row contribution to the total spray drift was assessed separately as follows: row 1, row 2, row 3, row 4, rows 5 and 6 together and rows 7, 8 and 9 together (Figure 4). For this purpose, the configurations XR015_No_H and XR03_No_H were tested (Table 1).
These trials were conducted to determine the possible drift reduction achievable by the adoption of a buffer zone (e.g., evaluation of drift reduction achievable without spraying the outermost row/s). For these purposes, DVs of each drift curve, derived from single row applications, were calculated as detailed in Section 2.7. Then, the spray drift contribution (%) of each sprayed row to the total spray drift was obtained.

2.9. Statistical Analyses

All statistical analyses were performed using IBM SPSS Statistics for Windows V26. The data were tested for normality using the Shapiro-Wilk test and by visual assessment of the Q-Q plots of residuals. A four-way Analysis of Variance (ANOVA) was performed to establish how the tested parameters act on the spray drift generation process with particular attention to their impact on drift reduction. The parameters investigated through four-way ANOVA were the nozzle type (conventional vs. air-induction), nozzle size (015 vs. 03), boom shield (not-shielded vs. semi-shielded) and boom height (0.50 m vs. 0.25 m above the ground); the dependent variable considered was DV. The two configurations characterized by the fully-shielded boom (XR015_Full_L and XR03_Full_L) were not included in the abovementioned statistical analyses.
Moreover, two-way ANOVA was used to evaluate the contribution of each vineyard row spray application to the total spray drift generation. Specifically, the effect of configuration (XR015_No_H vs. XR03_No_H) and rows applied individually was investigated; also in this case, the dependent variable considered was DV.
The Excel solver tool (version 2016 for Windows) was used to perform the 90th percentile experimental data fitting using the power law fit model [75]. The deviation of fitted values from measured 90th percentile deposits was determined using the Root Mean Square Error (RMSE). The RMSE is a standard way to measure the error of a model in predicting quantitative data [76]. The RMSE was then calculated from Equation (2), accordingly to Zande et al. [65], as follows:
R M S E = x = 1 N m ( l n ( Y f x ) l n ( Y m x ) ) 2 N m
where RMSE is a measure of the average deviation in ln(Y); Yfx is the fitted deposit at distance x; Ymx is the measured deposit at distance x; Nm is the number of deposits (i.e., distances—10).

3. Results and Discussion

3.1. Droplet Size Spectra Characteristics

Based on the analysis of droplet size spectra produced by both conventional and AI nozzles (Table 2), it can be seen that VMD was three time higher in AI nozzles than the conventional for the same nozzle size. It results that the flat fan conventional nozzles (XR-types) produce fine droplets while the flat fan air-induction (AI-types) produce very coarse droplets as classified by Southcombe et al. [46]. In addition, V100 was reduced significantly with AI nozzles, aligning this study with the widely recognized positive impact of V100 reduction in droplet driftability [62,77,78,79]. The higher the V100 parameter is, the higher is the potential for spray drift [80].

3.2. Environmental Conditions during Field Trials

All tests were conducted with a mean wind speed above 1.0 m s−1 as indicated in the standard protocol. The most frequent wind directions were SSE, S, and SSW in all tests and had perpendicular direction relative to the crop rows and spray track (180° azimuth according to the Figure 2 and Figure 5), as dictated by ISO22866:2005 [32]. Weather parameters during field trials are detailed for each replicate in Appendix A. In particular, the meteorological parameters (average wind speed and direction, mean temperature, relative humidity) measured during trials’ executions and the comparison with the ISO22866 specifications are given in Table A1 (trials with 0.50 m nozzles’ height above the ground—weed control and suckering), Table A2 (trials with 0.25 m nozzles’ height above the ground—weed control only), and Table A3 (trials for the evaluation of individual row spraying contribution to the total spray drift generation).
In general, the wind speeds were very similar across the trials and, in most cases, resulted higher than 2 m s−1; similarly to previous experimental work applying ISO22866:2005 test protocol [59]. The highest variation in wind direction was measured in trials characterized by lower average wind speed and higher outliers percentage. Furthermore, the wind direction was generally more uniform than wind speed during each trial. Bird et al. [81] underlined the difficulty of comparing different studies due to inability of isolate and correct for weather differences. Therefore, a similar wind speed and directions among the trials are of prime importance due to their high influence on spray drift deposit processes [82,83,84], especially for spray drift in the neighboring field [85]. However, it is well known that ISO22866:2005 field experiments using different spray systems cannot be performed under identical and perfectly repeatable conditions [30,32,57,59,60,65]. So, it is reasonable to obtain reliable information on the spray drift potential of a specific sprayer configuration for the under-row band herbicide application in vineyards, based on the analysis of weather conditions at the time of trials.

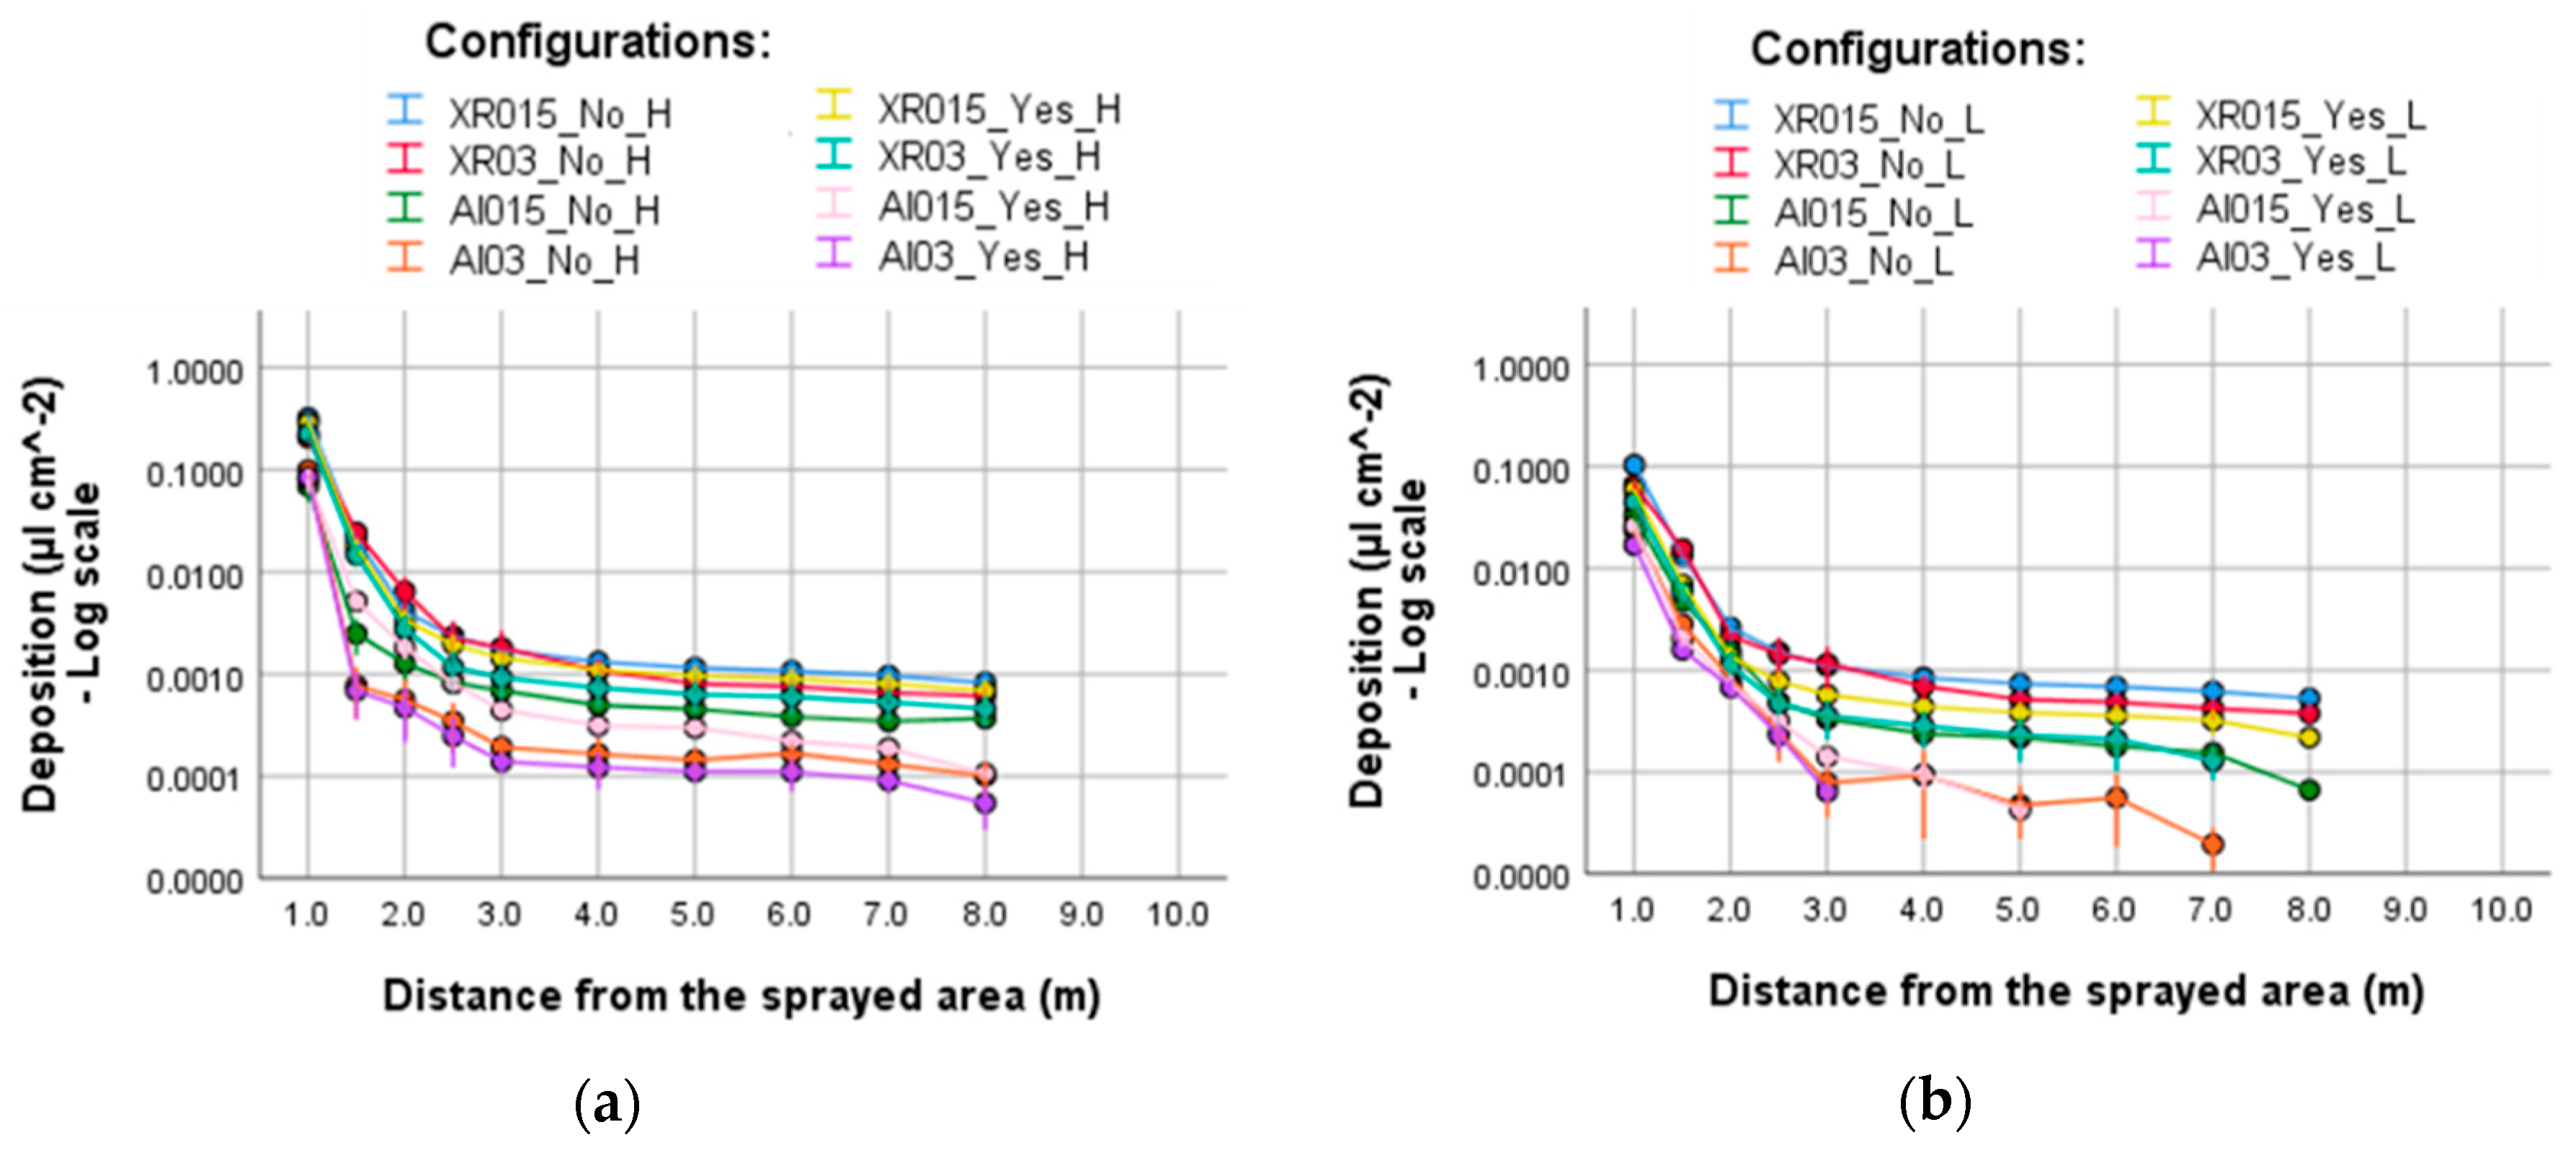
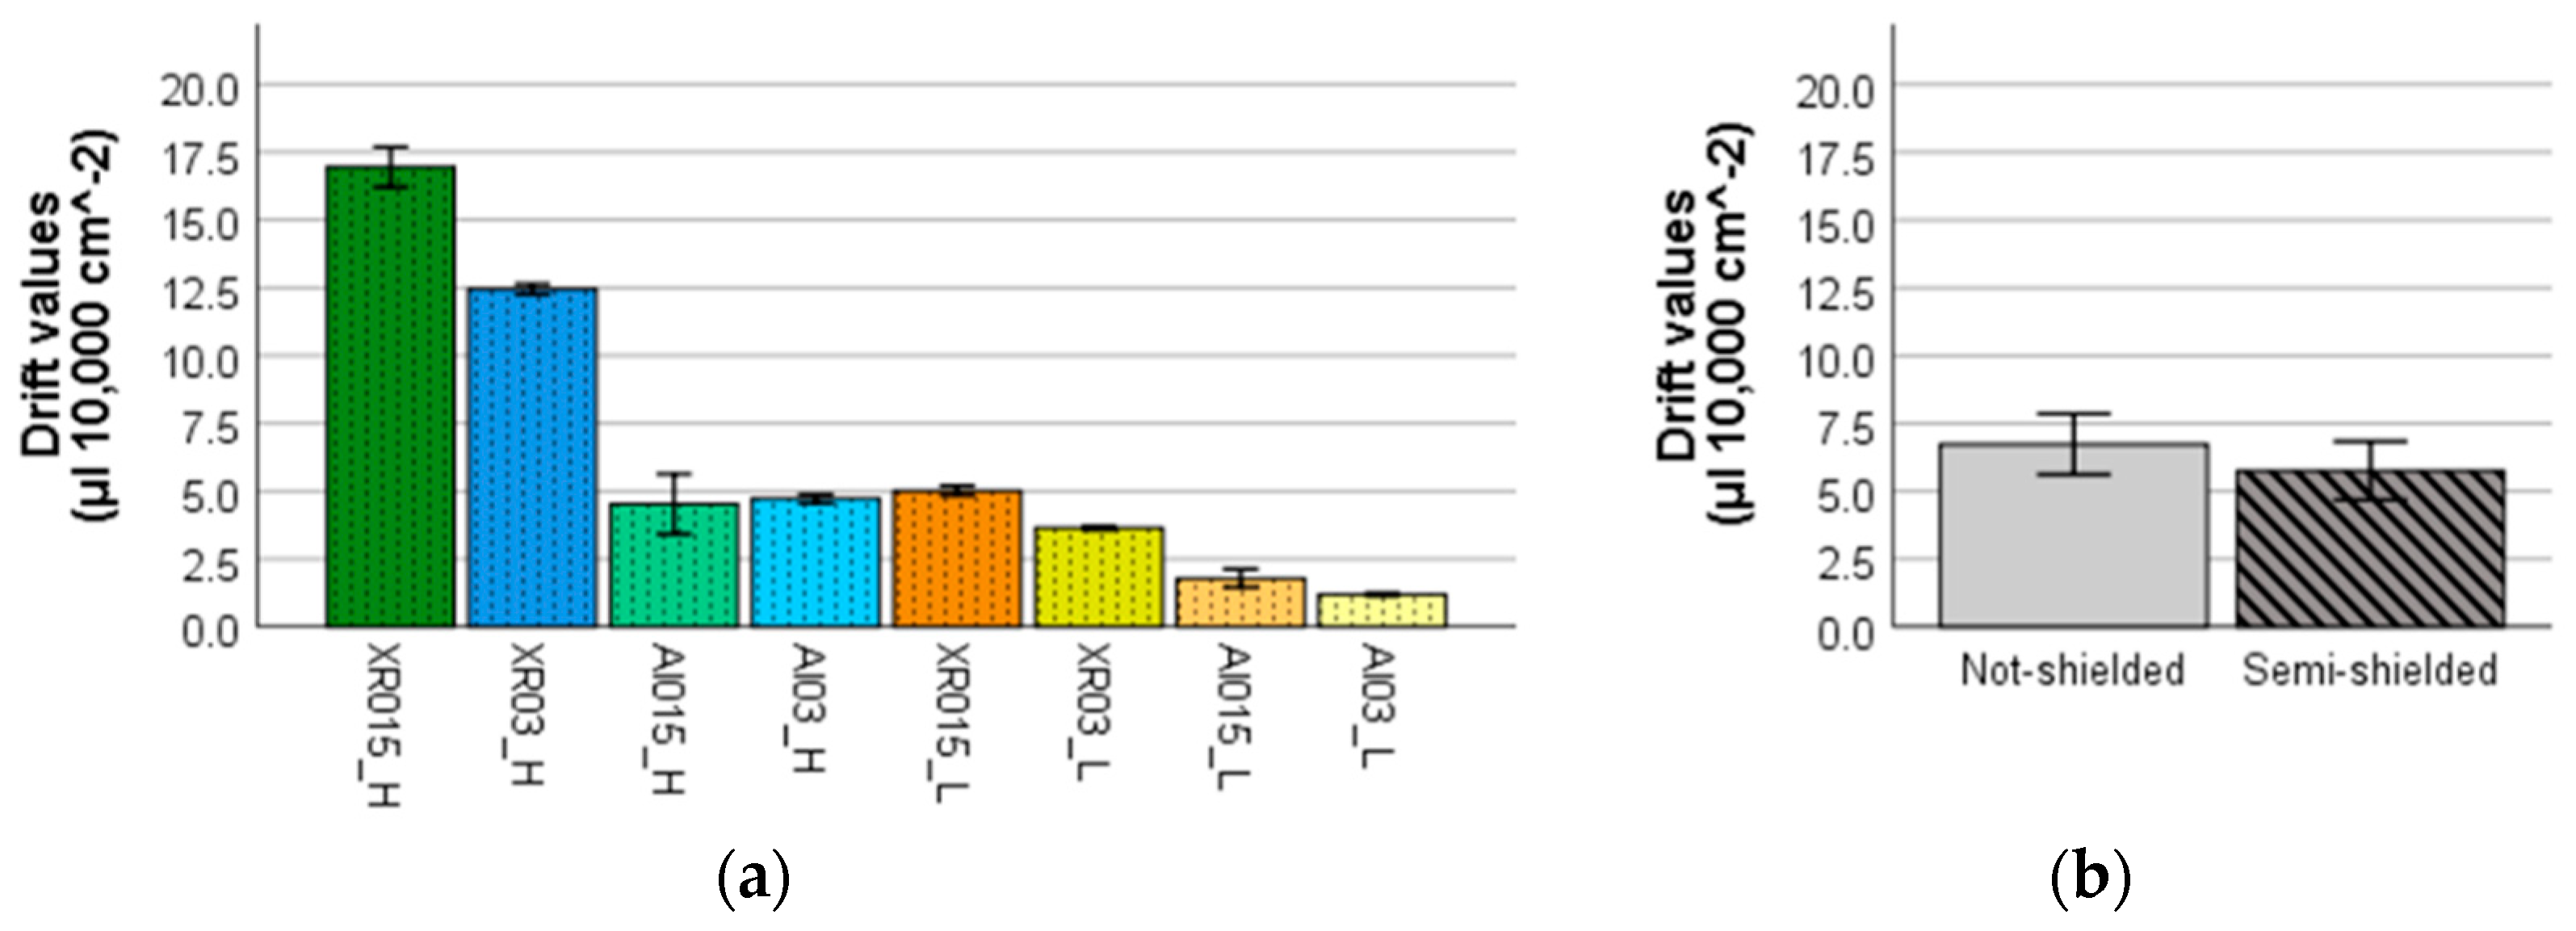
3.3. Evaluation of Spray Drift Generated by the Tested Configurations Using the Semi-Shielded and Not- Shielded Boom

Figure 5 displays the mean spray drift ground deposits (µl cm−2) at different distances downwind of the sprayed area. Figure 5a illustrates spray drift deposit profiles of the conventional boom sprayer for simultaneous weed control and suckering (0.50 m nozzle height above the ground), while Figure 5b for weed control only (0.25 m nozzle height above the ground). In both cases, irrespective of configuration considered, the spray drift deposition peaked one meter away from the sprayed area. In the first three meters, spray drift showed a strong decay that was then constantly decreasing in a slight pace. Interestingly, in all cases, the farthest sampling distance where deposits were detected was 8 m, even if the samplers were placed up to 10 m distance from the sprayed area (Figure 5). Even considering the worst case (XR015_No_H—Figure 5a), the spray drift did not overtake the 8 m distance from the sprayed area. The reduced boom height (0.25 m) reduced highly the distance that spray drift could reach, especially when using AI nozzles. As expected, the configurations tested using nozzles at 0.50 m height above the ground showed an average deposition at all sampled distances higher than when 0.25 m height was used. These results confirmed the negative effect of increased spray boom height on drift generation [41,62,63,64,65]. The effect of boom height on the spray drift profiles was evident in the first sampled distance (1 m from sprayed area), where spray drift was reduced on average from 25 to 6%, from 15 to 4%, from 5 to 3% and from 6 to 2% for XR110015, XR11003, AI110015 and AI11003, respectively. At the farthest distances, the drift reduction attributable to the boom height was also consistent. Furthermore, the comparison of the two spray application techniques in Figure 5 shows that the effect of AI nozzles was enhanced when the boom height was reduced, with the spray drift deposited only in the first few meters from the spray sources in most cases. When the AI03 nozzles were used combined with the semi-shielded boom (AI03_Yes_L—Figure 5b), spray drift reached maximum 3 m distance from the sprayed area. These results confirmed that using AI nozzles is the main strategy to reduce spray drift, thanks to the increase of droplet size (Table 2).
It should be noted that the percentage of sprayed liquid drifted was small, as even in the worst case (XR03_No_H). The average spray drift measured at 1.5 m distance from the sprayed area was equal to 1.7% of applied volume. In general, comparing the spray drift generated during the under-row band herbicide applications with the spray generated during the canopy PPP applications in the vineyard, it is clear that the drifted herbicide spray is very limited both in terms of total amount and maximum distance reached [56]. Grella et al. [59,72] measured spray drift during vineyard canopy PPP application using a conventional axial fan sprayer and identified consistent spray drift of nearly 1% of volume applied, 30 m away from the sprayed area. Similar values, ranging between 25–30%, were measured at 1 m distance from the sprayed area [59,72].
From the spray drift profile curves (Figure 5), the DVs (µl 10,000 cm−2—considering a strip of 1 cm × 10,000 cm of downwind ground area) were calculated for each tested configuration [71,72]. The results obtained from the four-way ANOVA based on the DVs (Table 3) showed that significant main effects of nozzles’ type, Nt; nozzles’ size, Ns; boom shielding, Bs; and boom height, Bh (p < 0.05) on spray drift were detected. Significant effects of the interaction among the considered factors were found for Nt, Ns and Bh. This underlines that the effect of each factor depends on the levels of the other two factors and vice versa. The averaged DVs over not-shielded and semi-shielded configurations, to display the effect of Nt*Ns*Bh, are provided in Figure 6a. In line with other studies, the results (Figure 6a and Table 3) demonstrated that AI nozzles represent the most interesting SDRT together with selection of appropriate nozzles’ size [43,44,65]. Interestingly, with conventional nozzles, the reducing boom height from 0.50 to 0.25 m decreased spray drift generation in a similar extent to the use of AI nozzles at 0.50 m height (Figure 6a). This means that when the spray application was intended for weed control and suckering at the same time, the potential risk of drift generation increases substantially. Unexpectedly, the use of semi-shielded boom, Bs, was significant in reducing spray drift, but with the lowest extent among other parameters tested (Figure 6b and Table 3). As mentioned, the semi-shielded boom could be considered a SDRT of major interest, determining a more consistent drift reduction when the spray application is intended for weed control only using the boom at 25 cm height above the ground (Figure 6b).

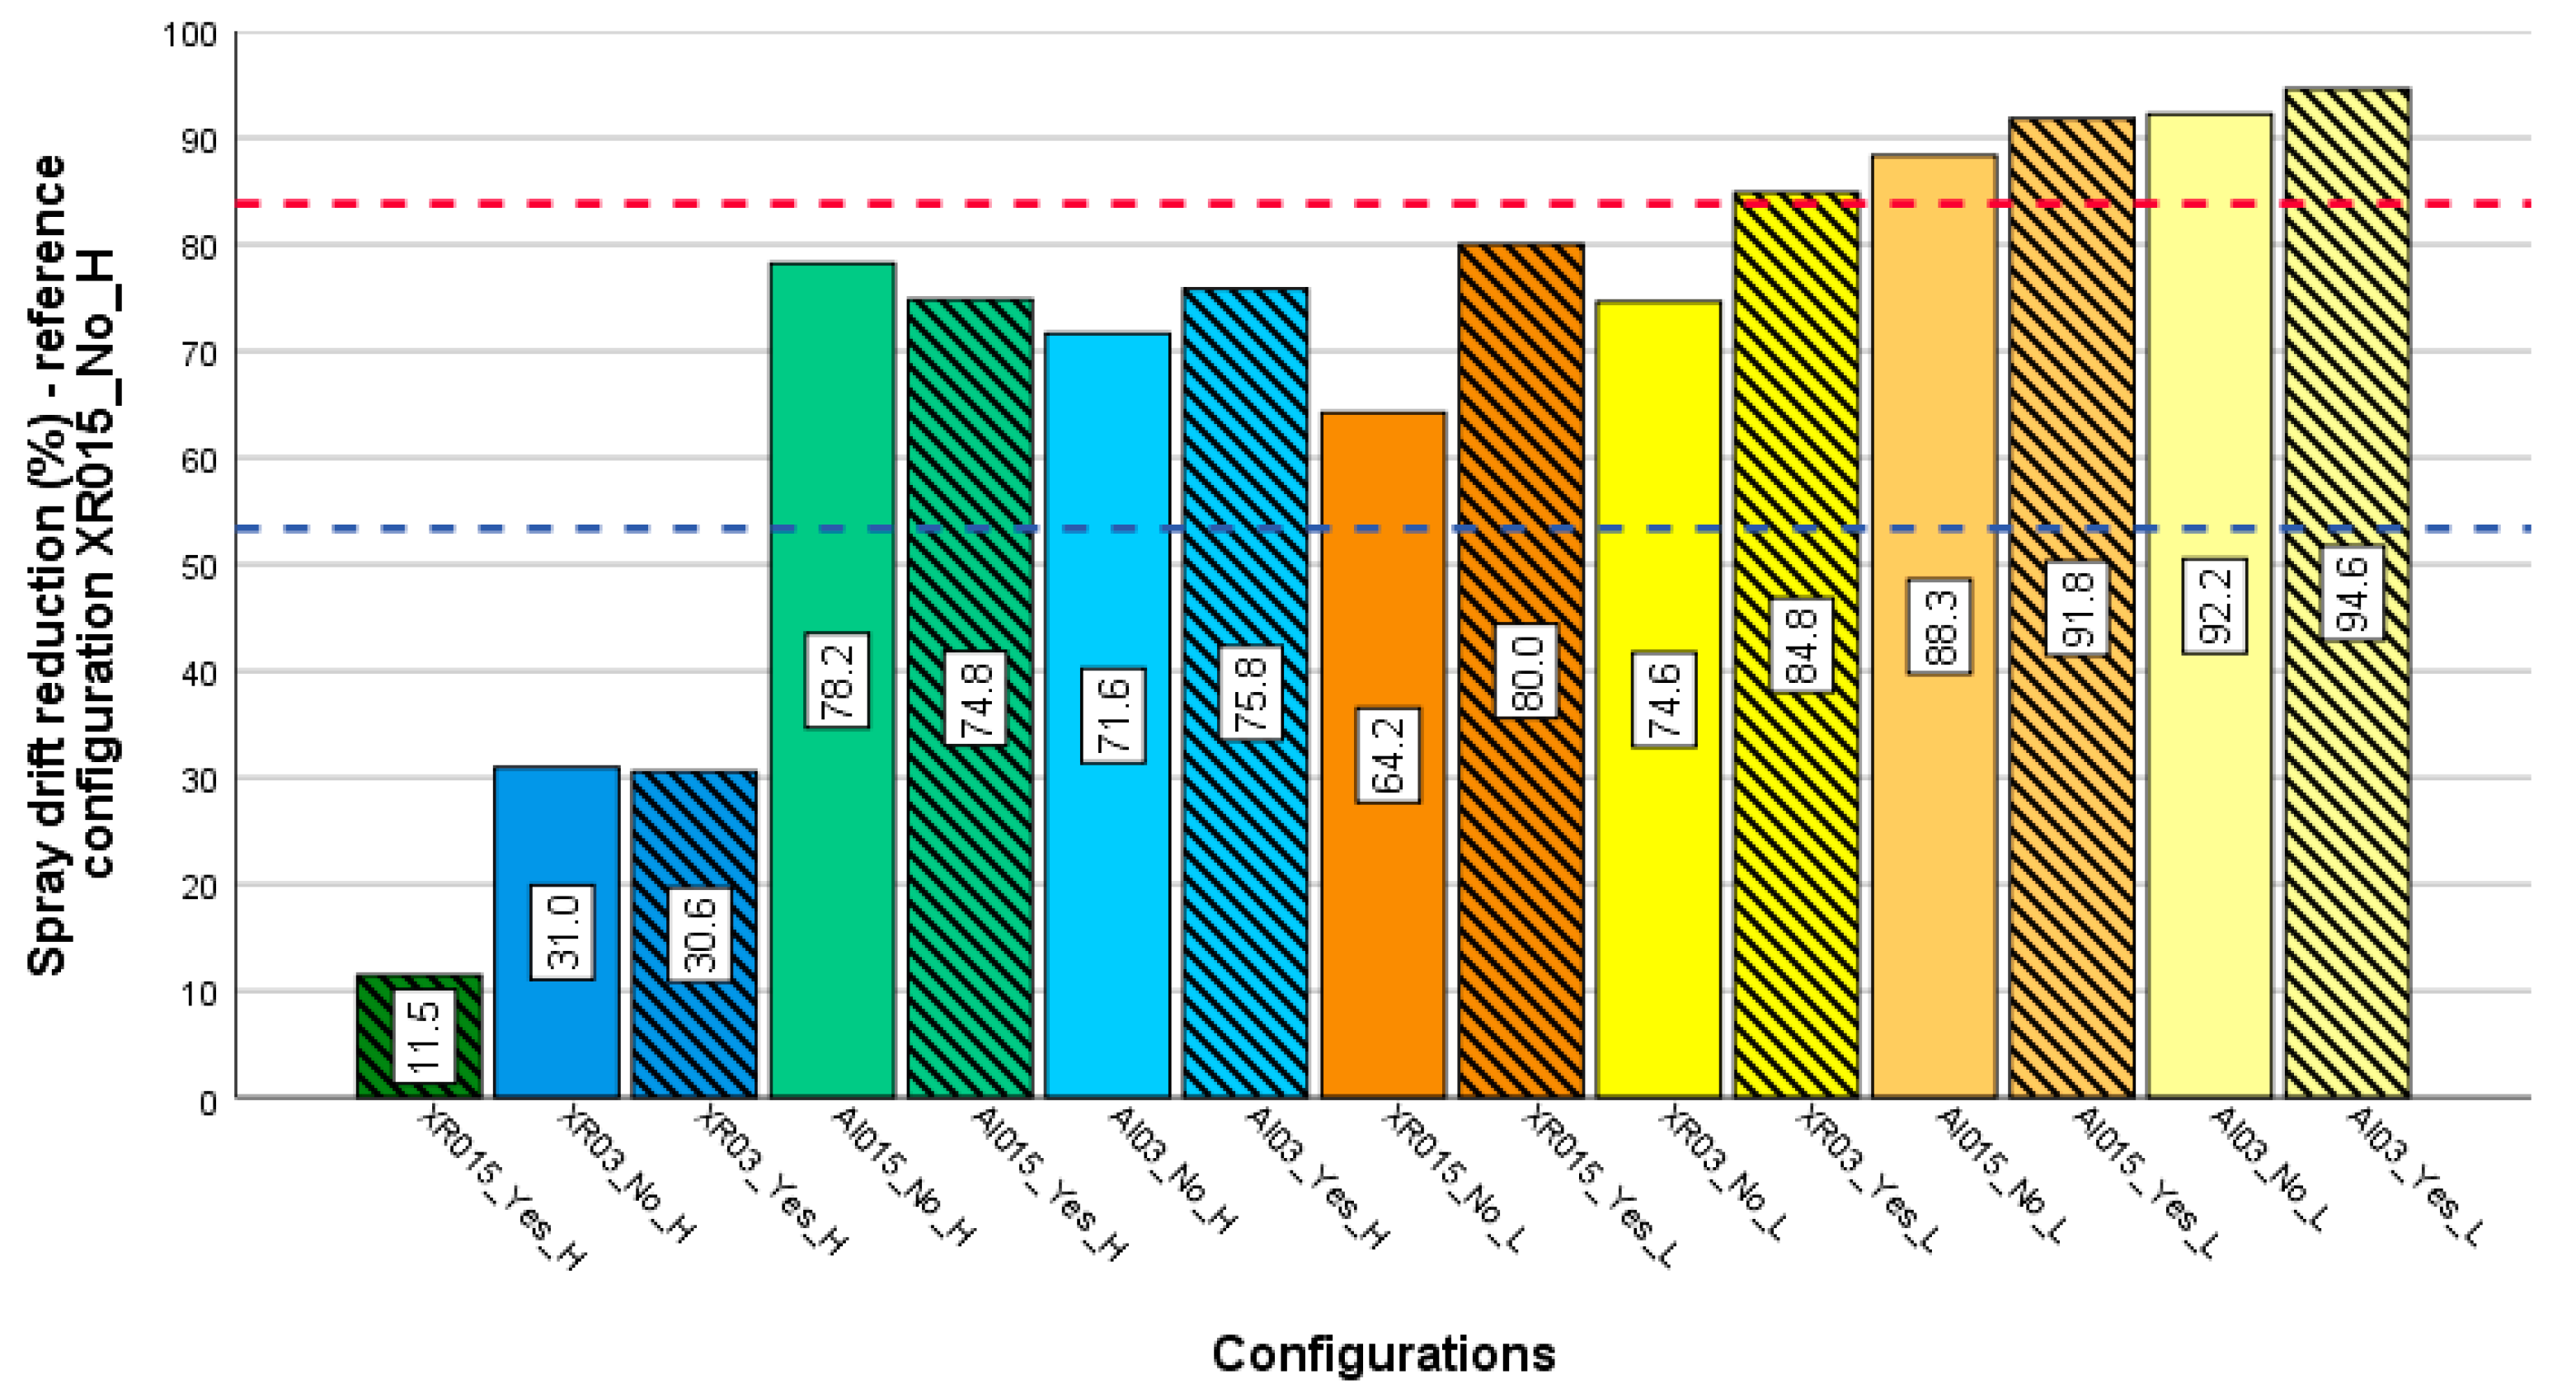
Drift Reduction Achievable Using the Tested Spray Drift Reducing Techniques (SDRTs)

Figure 7 shows the drift reduction achieved by the tested configurations for weed control and suckering at the same time or weed control only. The spray drift reduction was calculated based on ISO22369-1:2006 using the configuration XR015_No_H as reference [73], because it achieved the highest total spray drift. SDRTs for combined weed control and suckering reduced, on average, spray drift by 53% (light-blue dotted line—Figure 7). In particular, when conventional nozzles were used the potential spray drift reduction achieved was not higher than 30%; though, large orifice nozzles (03 size) increased drift reduction. At the same time, the adoption of AI nozzles allowed to achieve drift reductions in the range of 70–80%, independent of the nozzles’ size and the use of boom shield.
When SDRTs were used for weed control only, an average drift reduction of 83% was achieved (red dotted line—Figure 7). In this case, lowering boom height determined, in all cases, a drift reduction compared to the reference spray application technique XR015_No_H. Using conventional nozzles, the drift reduction achieved was in the range of 65–75% according to the nozzles’ size, while the use of semi-shielded boom allowed to further decrease spray drift. Additionally, using the spray boom at 0.25 m height, the AI nozzles allowed achieving the best drift reduction reaching 95%, when the 03 nozzles combined with the semi-shielded boom were used. However, drift reduction improvement due to the use of AI nozzles was less marked than when the spray boom was used at 0.50 m height. In general, the drift reduction results confirmed that AI nozzles were the best SDRT for combined weed control and suckering, while the use of semi-shielded boom did not have clear effect. On the contrary, when the spray application was intended for weed control only, the use of semi-shielded boom showed a clear effect in reducing spray drift also in combination with conventional nozzles. Nevertheless, the combination of AI nozzles and semi-shielded boom was the best SDRT combination in all cases for both spray application techniques investigated.

3.4. Evaluation of Spray Drift Generated by the Tested Configurations Using the Fully-Shielded Boom and Their Potential Drift Reduction

According to Table 1, the spray application technique for weed control only (0.25 m height above the ground) was tested also using the fully-shielded boom. For this purpose, only two configurations (XR015_Full_L and XR03_Full_L) were tested both showcasing conventional nozzles, namely XR110015 and XR11003. The results are not displayed in Figure 5b and are not included in the four-way ANOVA analysis (Table 3), because no detectable amount of spray deposits was collected at any distance from the sprayed area. This means that the use of fully-shielded boom allowed reducing nearly 100% of spray drift generation. However, the authors cannot exclude that in more severe wind conditions, some detectable amount of spray drift could be noticed; though, the above result is strongly supported by previous work on spray drift potential in wind tunnel using the same fully-shielded boom equipped with the same conventional nozzles. Under artificial constant air flow of 5 m s−1, mimicking severe wind conditions, very limited fraction of spray deposits were detected in the downwind area [54]. Therefore, when possible, the fully-shielded boom has to be chosen as the best SDRT to minimize the potential drift risk during spray application.

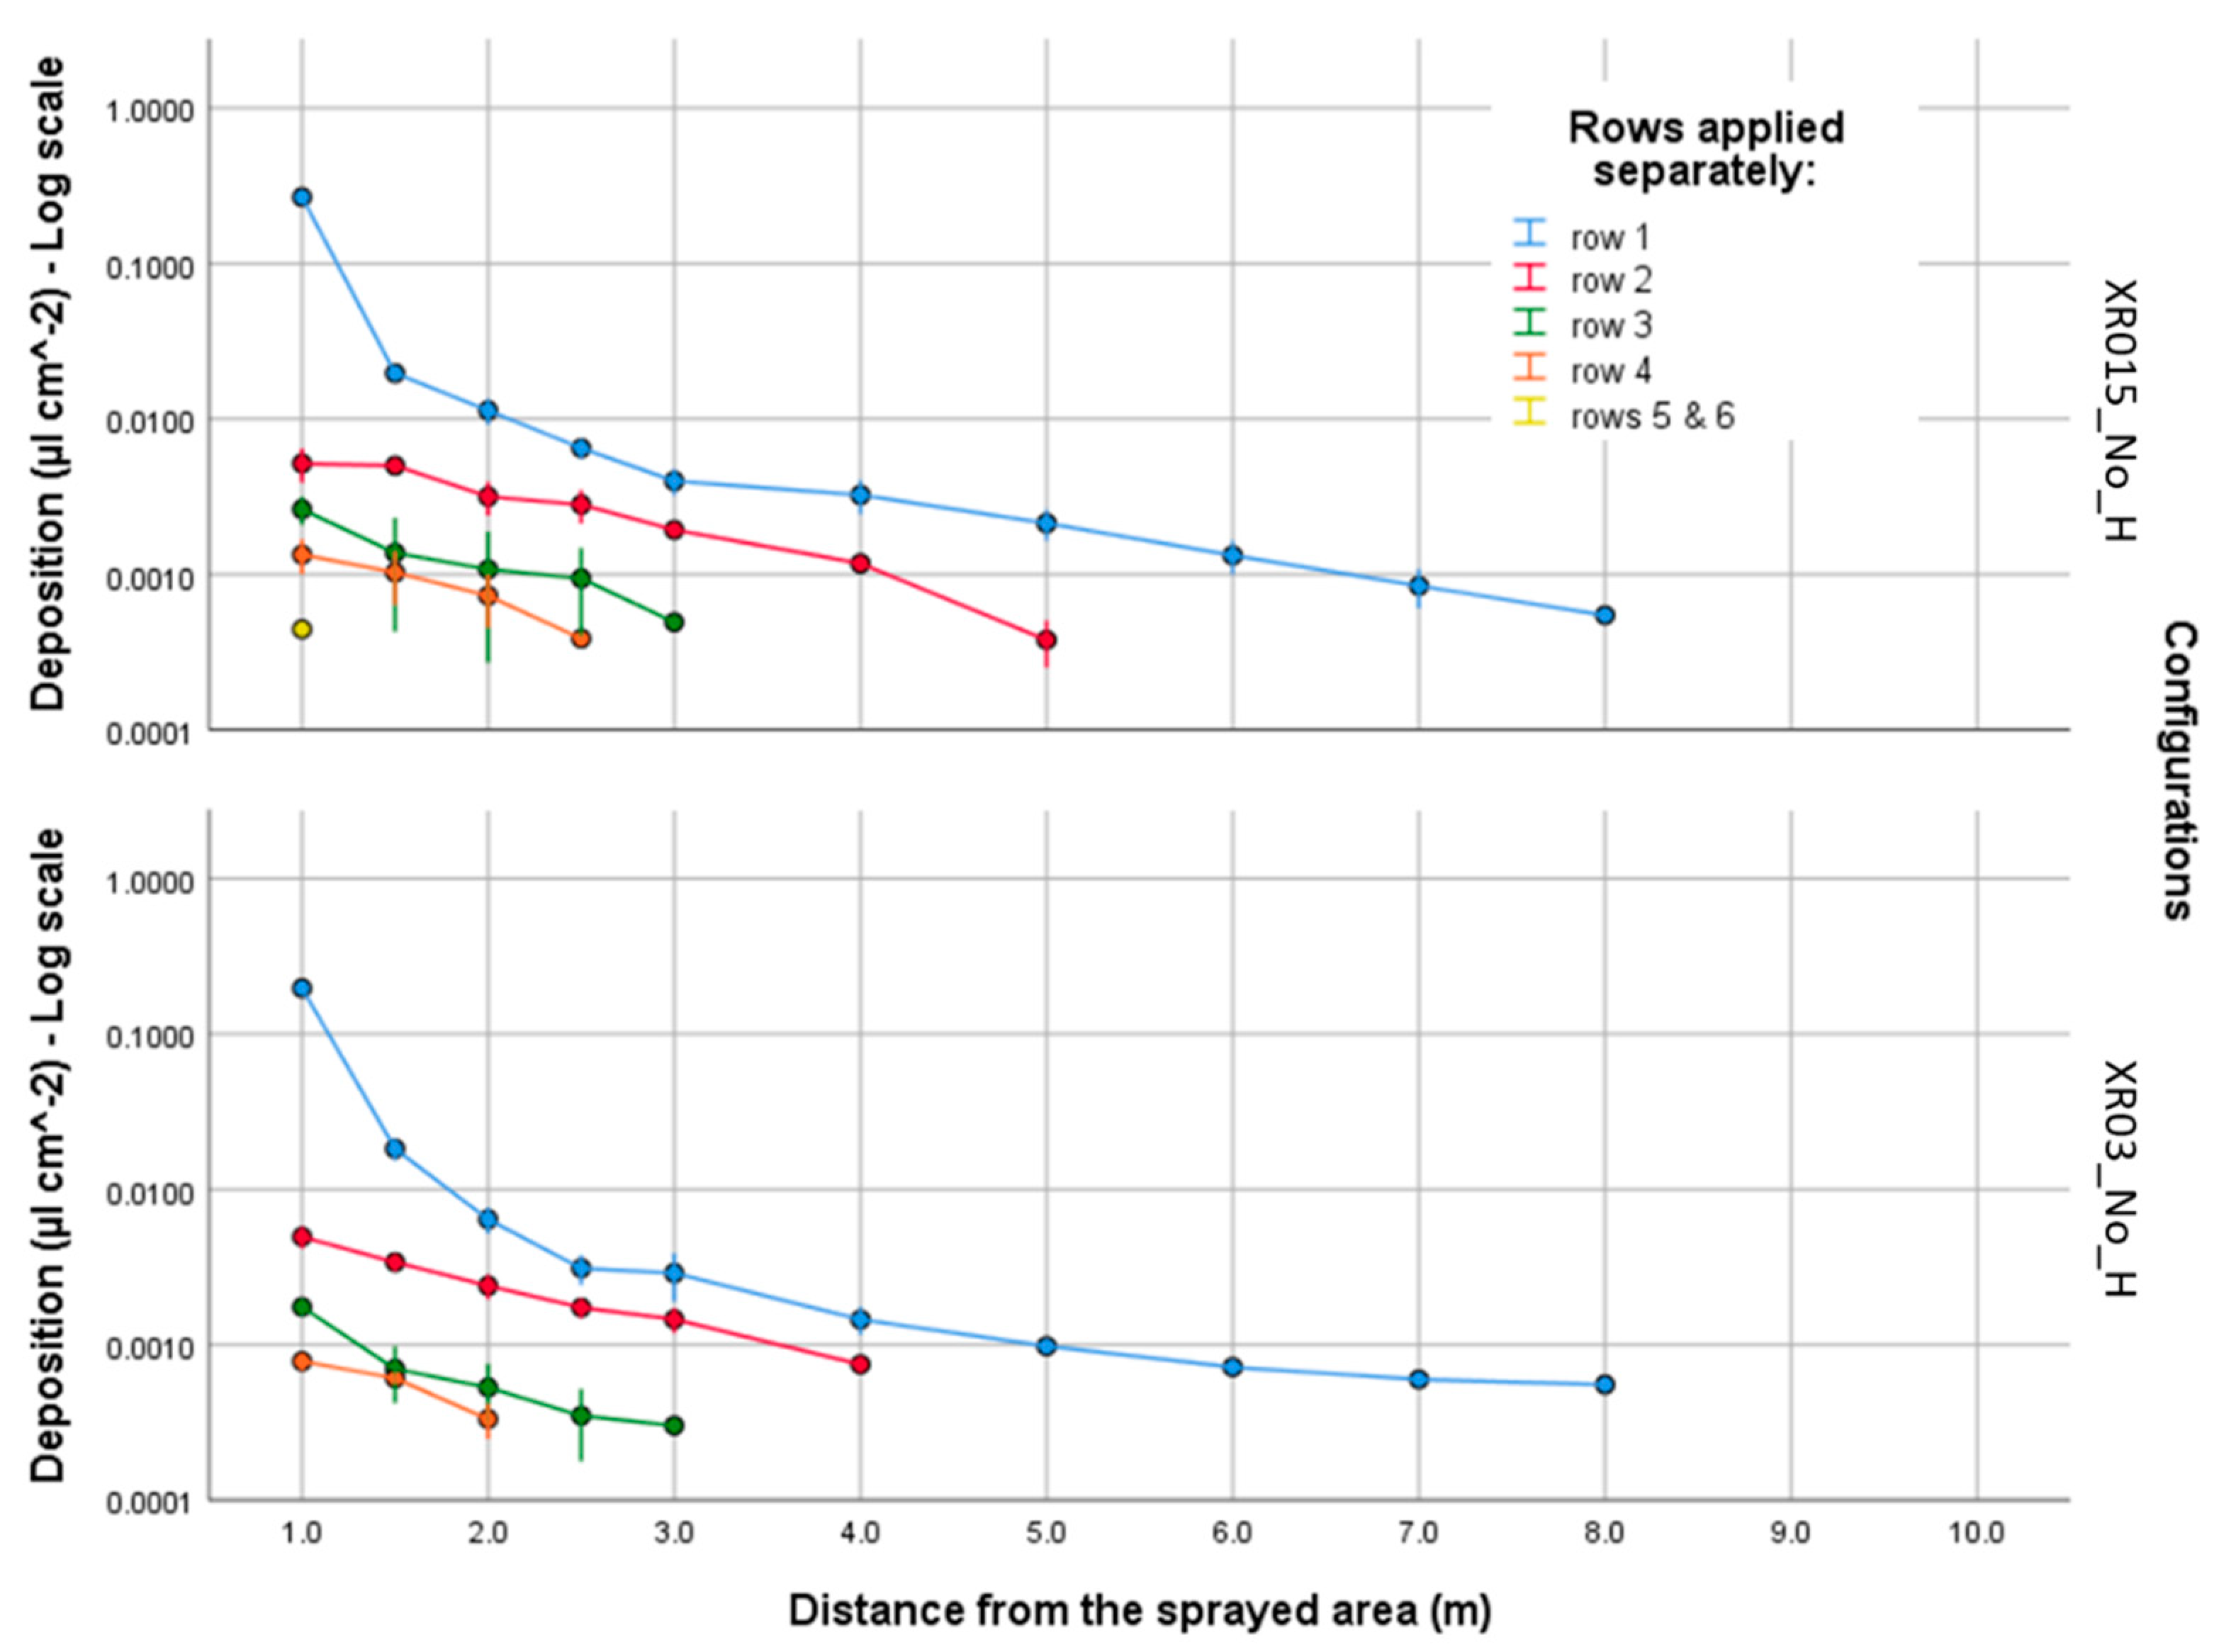
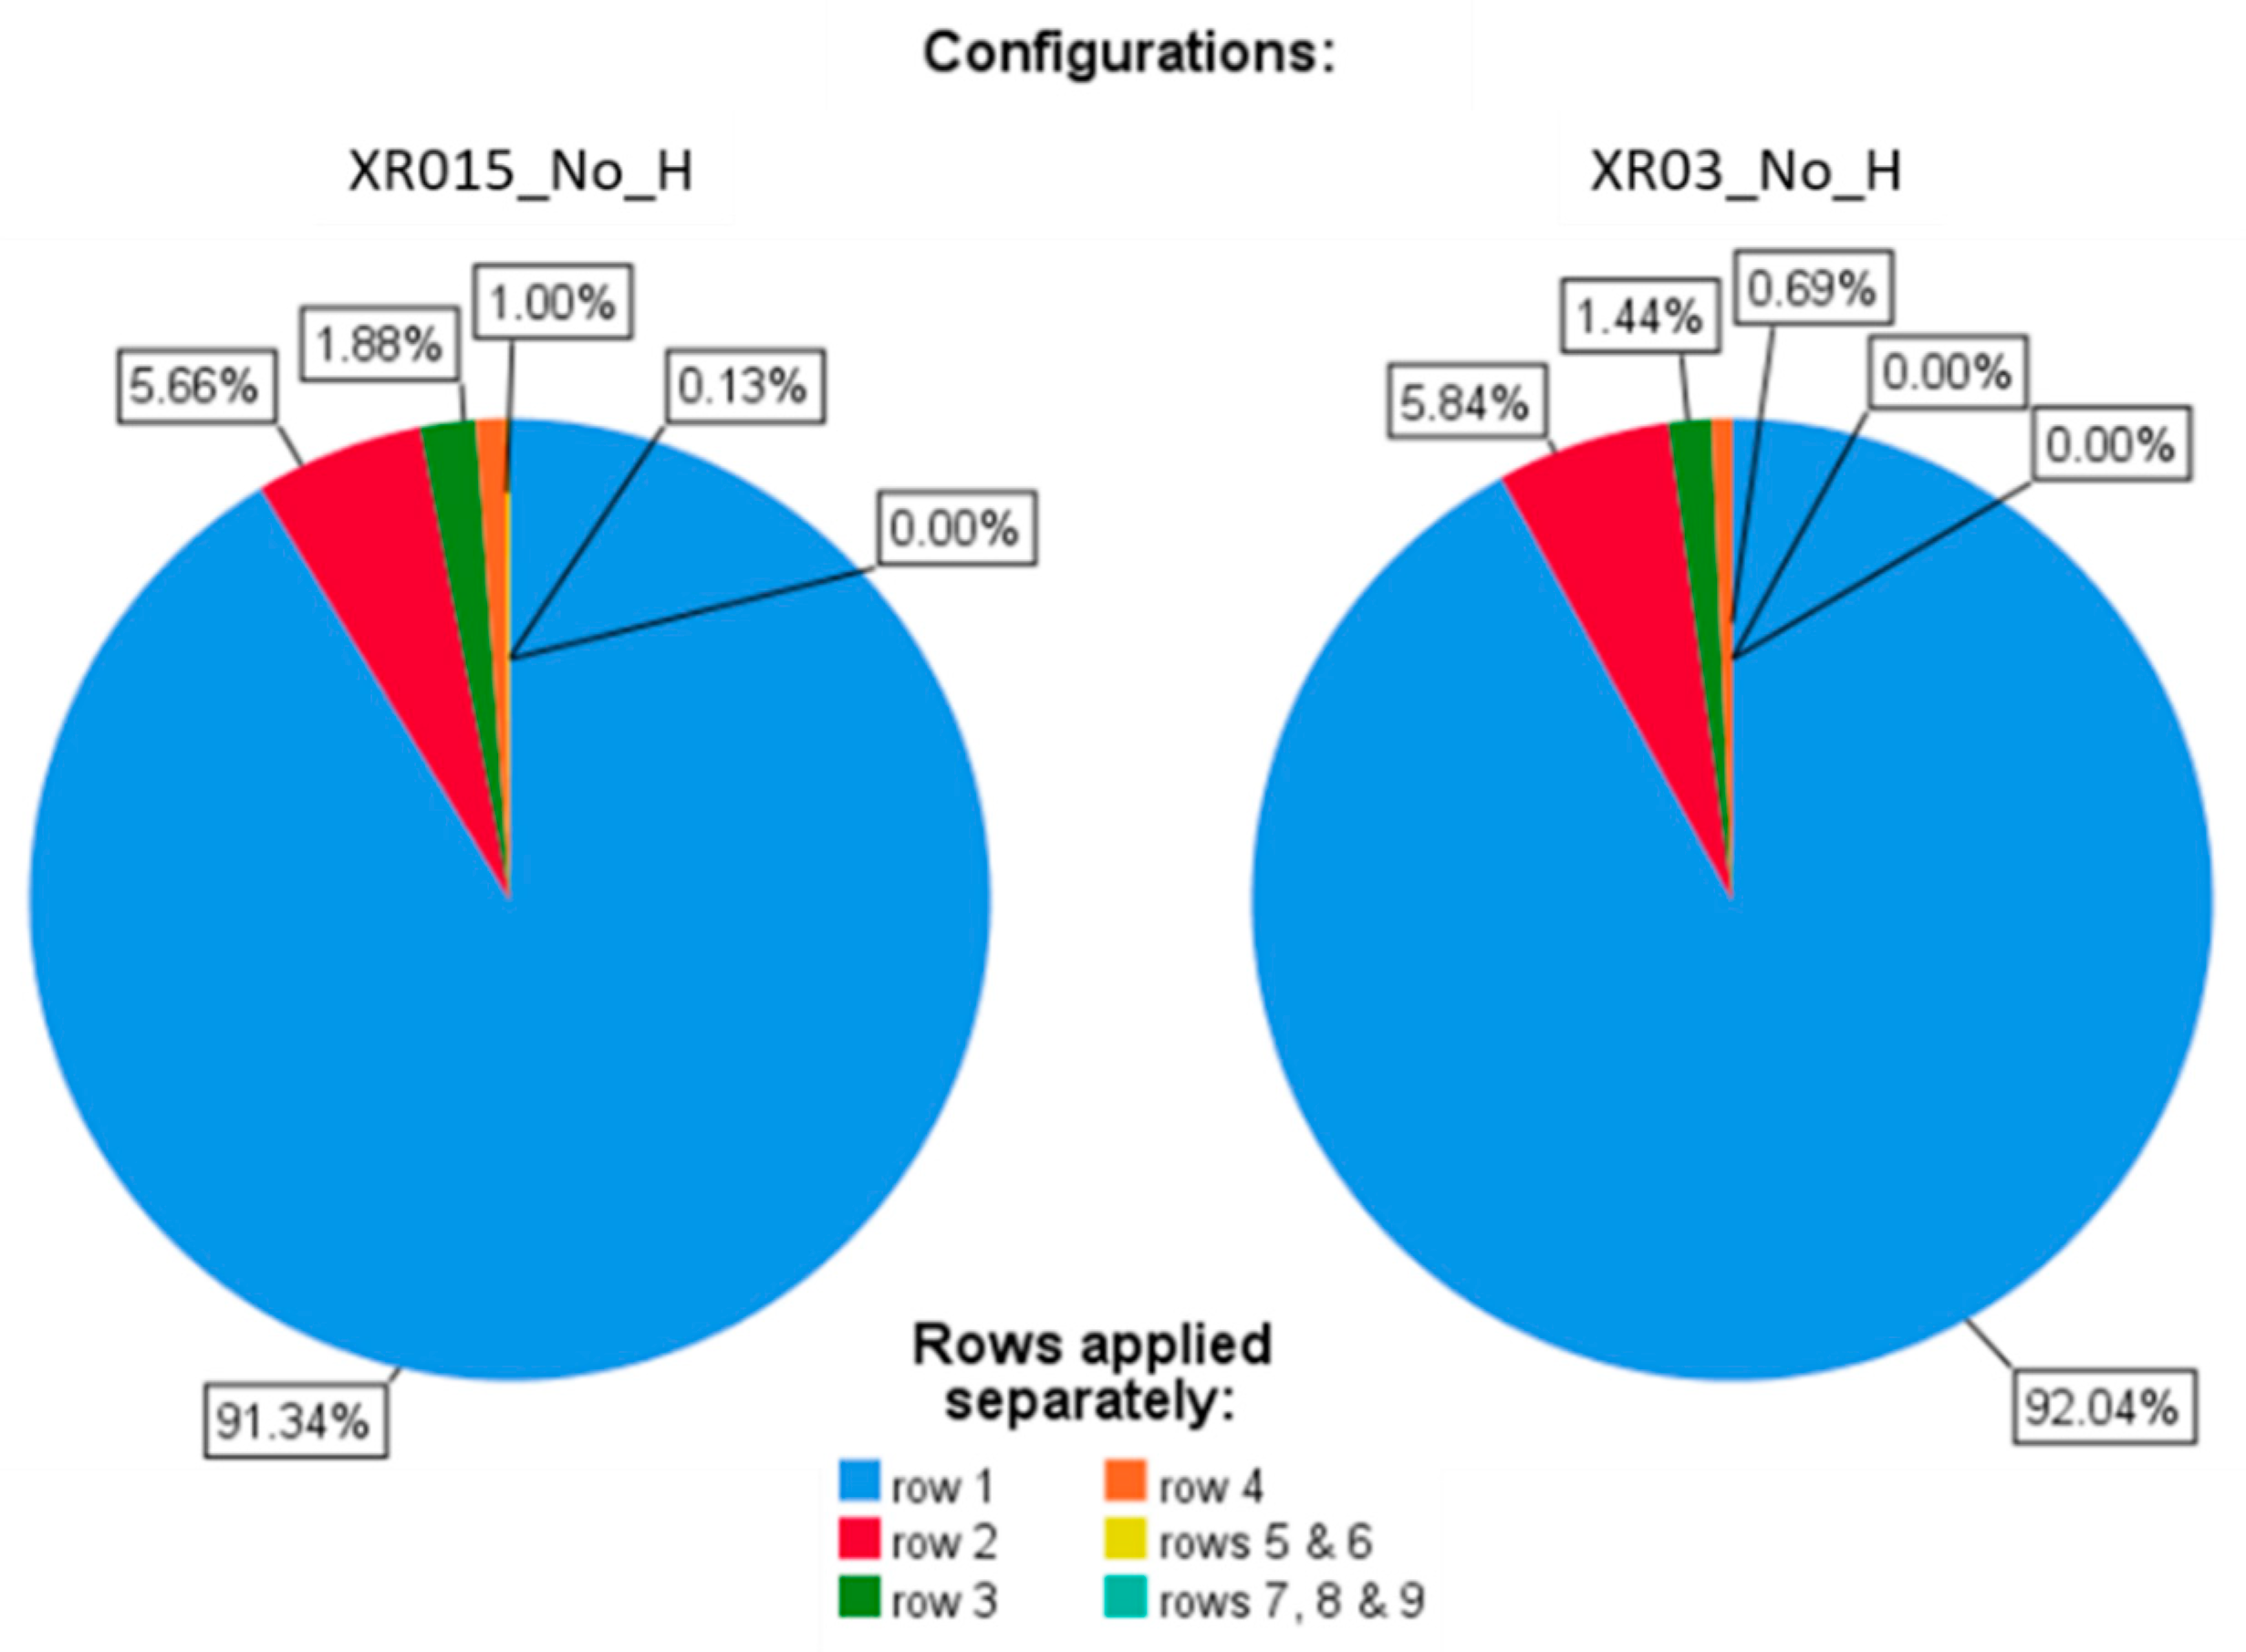
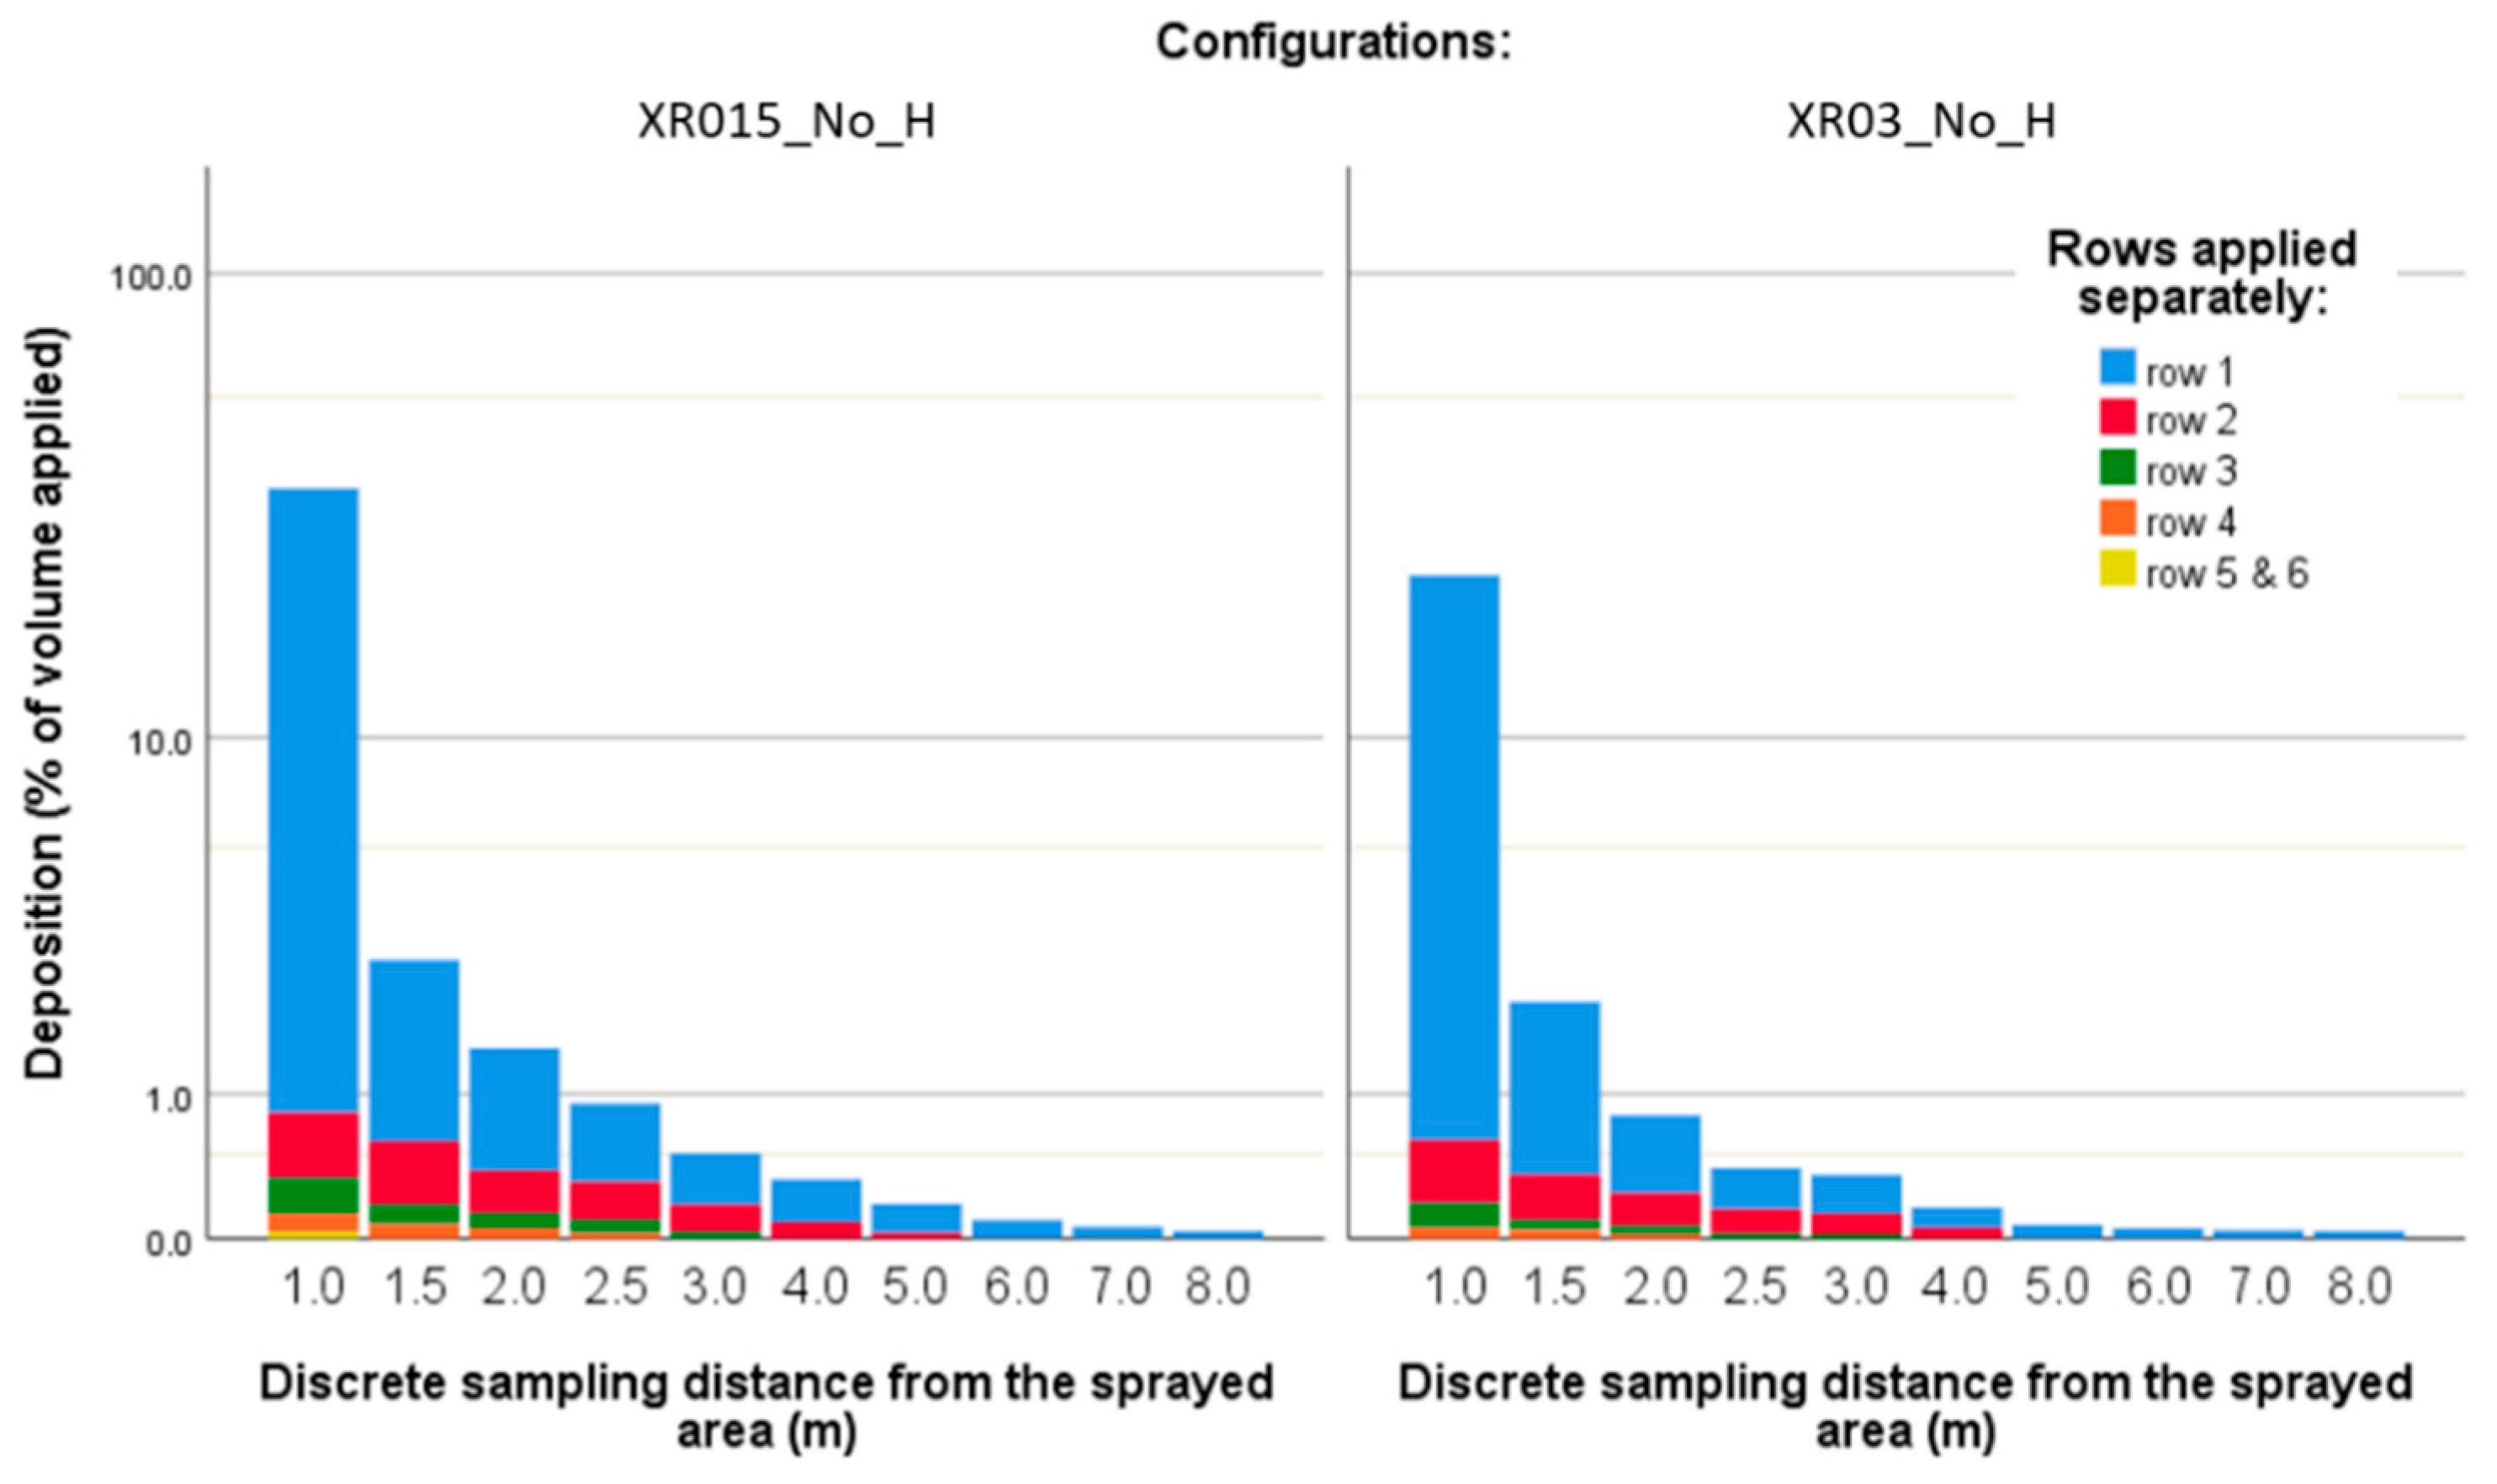
3.5. Contribution of Individual Row Spraying to the Total Ground Deposition Spray Drift

Figure 8 displays plots of the mean spray drift ground deposits (µl cm−2) measured at different distances downwind of the sprayed area. They correlate to plumes generated while spraying vineyard row/s separately. The spray drift is split by the two tested configurations, namely XR015_No_H and XR03_No_H. The two configurations were selected as the “worst cases” from the results displayed in Figure 5 that confirm previous experimental work [54,67]. Therefore, they were used for the determination of spraying single row contribution to the total spray drift. Based on the two-way ANOVA analysis of drift value (DV) the two configurations tested were not significantly different (F(1,24) = 3.363, p = 0.079) while the contribution of each row to the total spray drift was significantly different (F(5,24) = 30.053, p = 1.377 x 10⁻⁹). The highest amount of spray drift was generated during the spray application of the first row (Figure 8). In both configurations, it achieved the farthest distance from the sprayed area. Similarly to the previous results (Figure 5), the deposits did not overtake the 8 m sampling distance. In addition, the spray application of the second row determined a considerable amount of spray drift deposit, reaching 5 m distance from the sprayed area. A severe reduction of row/s contribution was measured when spraying the farther rows due to the increasing distance between drift samplers and spray source (Figure 4). The application of row 3 achieved, as farthest distance, 3 m from the sprayed area, while the application of row 4 achieved a maximum distance of 2.5 m. Spraying rows 5 and 6 together determined a detectable amount of spray drift distance of 1 m and only using the smaller nozzles (XR110015). In both configurations, the application of rows 7, 8 and 9 did not generate spray drift deposits detectable in the downwind sampling area. In the case of simultaneous weed control and suckering, testing the worst configurations, spray application of the two outermost vineyard rows (row 1 and 2—Figure 4) determined the highest contribution to the total spray drift measured at each sampling distance. The total amount of spray drift measured in each sampled distance from the sprayed area (Figure A1) were consistent with those obtained from conventional ISO22866:2005 methodology (Figure 5).
The stacked bars chart (Figure A1), showing the piled contribution of each row to the total spray drift at each sampled distances from the sprayed area, displays the first three meters of downwind area contributing the highest amount of the total spray drift (more than 97% of total deposition for both configurations). Spray drift is influenced by many factors related to environmental conditions [59,79,84], spray techniques [42,44,65], crop type and canopy structure [56,65,86]. In 3D crops like trellised vineyards, the canopy acts as a natural windbreak, especially when the wind direction is transverse to the rows’ orientation, as requested by the ISO22866:2005 test method for spray drift measurements. In this study, this led to limited contribution of farther rows to the total spray drift, but also determined the strong rate of deposition decrease in the first few meters from the sprayed area. The piled deposition in Figure A1 deposition decreased from 21 to 2% in 0.5 m width-distance (from 1 m to 1.5 m sampling distances for the configuration XR015_No_H). This suggests that even if the trials were conducted with an average wind speed higher than 2 m s−1 (Table A3), the real wind speed near the spray area, in most cases, was drastically reduced thanks to the action of the vine canopy, determining a limited total spray drift deposition. Similarly to the other PPP canopy spray application in vineyards, the under-row band herbicide application could also be potentially more susceptible to spray drift generation during the early growth stages than at the full-growth stages.

Drift Reduction Achievable through the Adoption of Cropped Buffer Zones

Figure 9 shows the total contribution of each sprayed row/s to the total spray drift generated during the under-row band herbicide application intended for weed control and suckering at the same time. The charts demonstrate that, in the worst cases, irrespective of nozzles’ size (XR015 vs. XR03), the spray application of the first outermost vineyard row contributed 91% of total spray drift. The application of the second row contributed to only 6% of the total spray drift. This means that avoiding the spray application of the two outermost rows would reduce the total spray drift by more than 97%. Indeed, the application of rows 3 to 9 (Figure 4) contributed to 3% of the total spray drift. It emerges that for combined weed control and suckering, the adoption of an indirect drift reducing method like cropped buffer zones [30] including the outermost row only or the two outermost rows, allowed to minimize deeply the total spray drift deposition. Furthermore, the adoption of a cropped no-spray zone determined not only the drift reduction in terms of amount, but allowed to minimize the maximum distance reached by the spray drift. Based on the experimental results (Figure 8), the spray application of the third row determined a ground deposition up to 3 m from the sprayed area as farthest distance. Adoption of a cropped no-spray zone including the two outmost vineyard rows has achieved 97% spray drift reduction and by also using SDRTs (e.g., drift-reducing nozzles and semi-shielded boom), it is possible to further minimize the total spray drift and the distance achieved by the drift. Therefore, SDRTs open up the possibility to reduce the width of cropped no-spray zones [31]. It is interesting to point out that, irrespective of spray application techniques and adopted SDRTs for the under-row band herbicide application, a cropped no-spray zone that included the first two rows or, at least, the first one, could, in any case, guarantee a spray drift reduction of at least 95% and 90%, respectively. In a practical way, when the cropped buffer zone is required to mitigate the impact of spray drift to the sensitive areas (e.g., water courses, ditches, schools, gardens, urban areas, bystanders in general) alternative environmentally-friendly techniques for weed control and suckering (e.g., mechanical control) should be adopted only for the rows included in the cropped buffer zones.

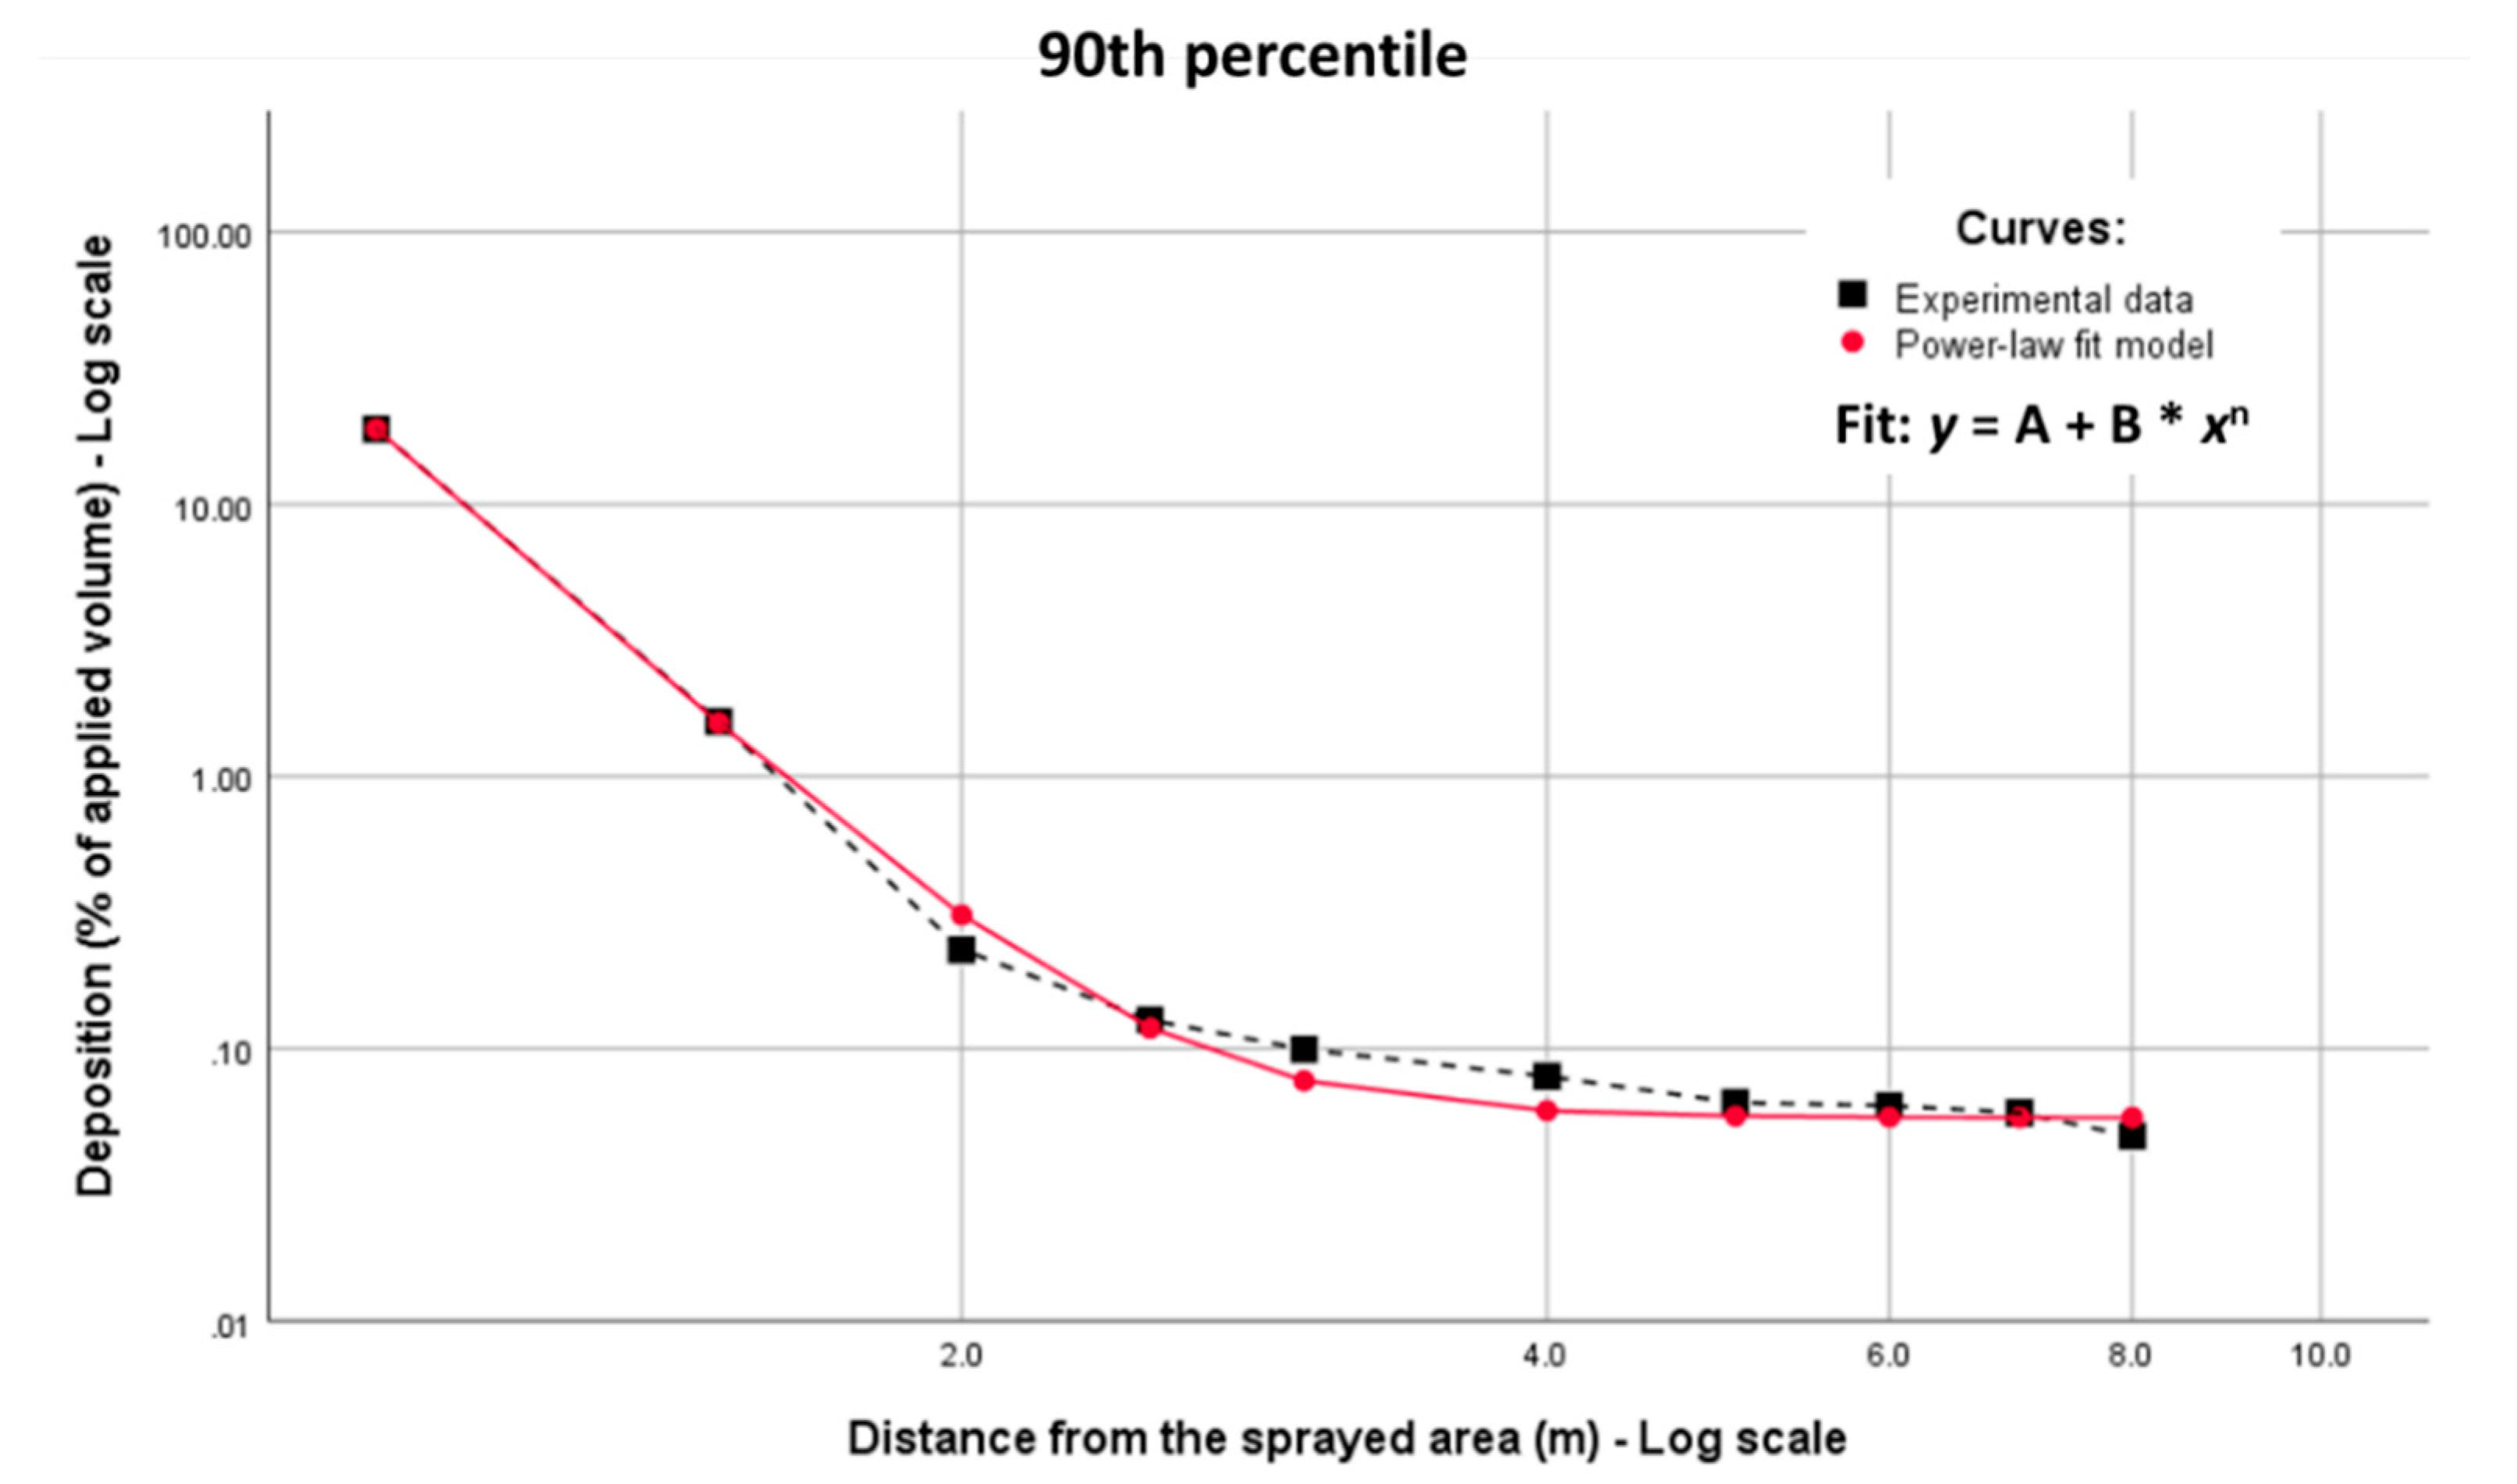
3.6. Fit Model for the Spray Drift Generated during Under-Row Band Herbicide Application

In Figure 10, the 90th percentile spray deposition of experimental data (black dotted line) obtained from the whole dataset (data deriving from both spray applications for combined weed control and suckering, and weed control only) are displayed. The data were obtained from 48 spray applications (16 configurations × 3 replicates) conducted according to ISO22866:2005 protocol under similar environmental conditions (Table A1 and Table A2). The use of the 90th percentile is in accordance with proposals made on EU-level by the FOCUS group [87]. The 90th percentile curves have been used since 1995 for the assessment of PPPs with regard to their effects on non-target organisms during the authorization procedure of PPPs [56,88,89].
Similarly, to other crops and the related spray application techniques [56,65,90], the red curve in Figure 10 shows a power law fit model, representing the spray drift reference curve peculiar for the under-row band herbicide application in vineyards. The power law model used to fit the 90th percentile spray drift experimental data is expressed according to Equation (3) as:
y = A + B x n
where y is the spray drift deposition (%); x distance from treated area; A, B and n are the function parameters: A = 0.056, B = 18.828 and n = −6.213
The error of proposed power law in predicting quantitative spray drift deposition data was evaluated based on the calculation of RMSE. The RMSE value obtained fitting the experimental data in Figure 10 was 0.14, demonstrating that the power law model successfully fits the experimental data. The RMSE value was close to that obtained by Zande et al. [65], equal to 0.08, fitting the 90th percentile of spray drift curves obtained by spraying a bare soil surface or short crop (<20 cm) using a boom sprayer equipped with standard flat fan nozzles (XR11003/XR11004) and a boom height of 0.50 m. Figure 10 shows the very steep decline of the spray drift deposition close to the field edge for the under-row band application in the vineyard; losses lower than 1% of volume applied can be guaranteed beyond 1.65 m distance from the sprayed area. According to the 90th percentile drift curves, the same amount detected at 2.85 m distance from the sprayed area during the under-row band spray application in vineyards was detected at 30 m distance for the arable field crop application.

4. Conclusions

The Spray Drift Reducing Techniques (SDRTs) tested for both the under-row herbicide application aimed for simultaneous weed control and suckering, and weed control only, resulted effectively in reducing substantial spray drift. In particular, when the boom sprayer was used at 0.50 m height above the ground with the purposes of weed control and suckering at the same time, the spray drift generated resulted, on average, three times higher than that generated during the spray application intended for weed control only, performed using the boom at 0.25 m height. In general, to minimize the spray drift as much as possible, the use of an AI nozzle combined with the semi-shielded boom is always recommended for both combined weed control and suckering (75% of drift reduction), and for weed control only spray applications (92% of drift reduction). When the weed control is performed with the fully-shielded boom, nearly 100% of drift reduction is achieved. Of particular interest, was the adoption of cropped buffer zones as indirect SDRTs to further minimize the potential risk of drift generation (97% of drift reduction including the two outermost rows in the buffer zone).
The right choice of direct or/and indirect measures, like buffer zones, to protect the environment, is the main strategy to minimize spray drift and maintain acceptable levels of eco-toxicological risk in the sensitive areas. Spray technology plays a key role in the environmental risk assessment for PPPs.
The 90th percentile curve, by the means of power law model, represents the first reference curve suitable in predicting quantitative data for the under-row band herbicide application in vineyards. It can be utilized during the environmental risk assessment undertaken in the ambit of studies that pave the way for the registration of herbicides [28] for this specific use. Indeed, the eco-toxicologic models accounted for ground spray drift are based on reference curves specific to both spray application techniques, crop type and growth stage.

Author Contributions

Conceptualization, M.G., P.M. and P.B.; methodology, M.G., P.M. and P.B.; validation, M.G. and P.M.; formal analysis, M.G.; investigation, M.G. and P.M.; resources, P.B.; data curation, M.G. and P.M.; writing—original draft preparation, M.G. and A.T.B.; writing—review and editing, M.G., P.M., A.T.B. and P.B.; visualization, M.G.; supervision, M.G.; project administration, P.B.; funding acquisition, P.B.; All authors have read and agreed to the published version of the manuscript.

Funding

This research received no external funding.

Acknowledgments

The authors would like to thank Abbà s.n.c. (Centallo—CN, Italy) for providing the boom sprayer for the under-row band herbicide application used in the experimental work.

Conflicts of Interest

The authors declare no conflict of interest.

Appendix A

Table A1. Environmental conditions recorded during field trials simulating the spray applications for the weed control and suckering at the same time (nozzles are 0.50 m height above the ground).
Config & ReplicatesWeather Parameters
TemperatureRHWind SpeedWind Direction
MeanaMeanbMin MaxMeanOutliers cMeanCentered dPrevalent Direction
°C°C%%m s−1m s−1m s−1%° az.%
XR015_No_HR125.70.2624.90.150.152.811.846.5158.178SSE
R232.40.2938.3−0.551.212.742.110.0199.583SSW
R331.80.1434.0−0.401.313.442.080.0184.187SSW
XR03_No_HR125.70.3024.2−0.270.574.611.987.6160.088SSE
R231.90.1837.7−0.411.163.241.870.0198.890SSW
R332.20.1233.2−0.440.662.261.747.2189.290S
AI015_No_HR125.50.2923.60.110.523.781.964.3162.486SSE
R231.70.1535.8−0.280.873.642.022.0156.089SSE
R332.40.0734.1−0.421.133.031.910.0181.986SSW
AI03_No_HR125.80.4023.6−0.481.303.842.360.0167.285S
R231.80.1135.7−0.160.422.881.843.6165.299SSE
R332.80.0632.6−0.080.433.432.076.8193.387S
XR015_Yes_HR132.20.1232.5−0.501.352.962.020.0200.895SSW
R229.10.0744.1−0.200.773.391.983.8185.7100S
R325.00.1353.3−0.020.793.532.161.1179.995S
XR03_Yes_HR132.10.0832.1−0.281.174.112.370.0172.9100S
R228.70.0045.1−0.170.473.611.832.1172.488S
R325.20.1454.6−0.280.724.262.442.9165.890S
AI015_Yes_HR131.80.0531.2−0.140.793.692.112.7178.187S
R224.30.1759.60.010.953.732.010.5163.090SSE
R325.00.1457.30.720.824.472.163.0200.685SSW
AI03_Yes_HR132.80.0430.8−0.141.313.131.930.0187.596S
R224.70.1757.2−0.150.663.411.618.7155.191SSE
R325.20.1056.80.110.223.702.029.8194.093SSW
a Difference of temperature C° between two heights (3 m and 4 m). b Difference of Relative Humidity (RH %) between two heights (3 m and 4 m). c Percentage of records < 1 m s−1. d Percentage of records between 180° ± 45°.
Table A2. Environmental conditions recorded during field trials simulating the spray applications for weed control only (nozzles are 0.25 m height above the ground).
Config & ReplicatesWeather Parameters
TemperatureRHWind SpeedWind Direction
MeanaMeanbMin MaxMeanOutliers cMeanCentered dPrevalent Direction
°C°C%%m s−1m s−1m s−1%° az.%
XR015_No_LR124.80.1042.8−0.260.355.023.161.1181.799S
R223.80.0648.7−0.160.834.112.711.1184.8100S
R322.10.0157.60.060.933.942.142.2199.992SSW
XR03_No_LR124.50.1543.2−0.291.514.643.150.0177.0100S
R223.70.0750.8−0.280.993.852.492.2185.9100S
R324.50.1857.4−0.750.983.682.091.1161.180SSE
AI015_No_LR124.20.1447.7−0.430.693.882.253.3181.8100S
R223.30.0451.9−0.160.823.001.733.3184.699S
R324.20.1858.0−0.680.794.502.382.2162.089SSE
AI03_No_LR124.00.0946.3−0.361.463.752.600.0176.9100S
R222.80.0255.2−0.090.993.181.781.1189.898S
R324.20.1558.4−0.640.433.432.076.5167.895SSE
XR015_Yes_LR124.40.1660.7−0.801.485.103.190.0159.797SSE
R223.80.1459.5−0.541.043.352.000.0170.395S
R323.60.0959.6−0.461.152.972.080.0157.399SSE
XR03_Yes_LR124.20.1360.0−0.660.894.092.551.1151.683SSE
R223.90.1558.8−0.690.872.881.814.3178.196S
R323.70.0359.9−0.391.183.931.970.0160.389SSE
AI015_Yes_LR123.90.1962.5−0.860.673.211.974.3171.398SSE
R223.80.1759.0−0.720.953.022.081.1185.399SSE
R323.30.0662.4−0.351.164.082.730.0153.8100SSE
AI03_Yes_LR123.90.1359.7−0.620.753.412.211.1200.698SSW
R223.80.1159.0−0.661.213.402.170.0190.8100SSW
R323.10.0363.1−0.291.103.421.920.0158.987SSE
AI015_Full_LR125.50.3229.70.371.213.302.300.0189.8100SSW
R225.90.4228.3−0.131.024.153.000.0160.593SSE
R324.70.4058.1−0.480.793.142.076.5163.183SSE
AI03_Full_LR125.90.2129.5−0.211.333.902.410.0178.298S
R226.30.4129.60.771.612.692.160.0164.196SSE
R325.00.3454.6−0.801.183.292.200.0183.995SSW
a Difference of temperature C° between two heights (3 m and 4 m). b Difference of Relative Humidity (RH %) between two heights (3 m and 4 m). c Percentage of records < 1 m s−1. d Percentage of records between 180° ± 45°.
Table A3. Environmental conditions recorded during field trials aimed to evaluate the contribution of each sprayed row to the total spray drift generation during the spray applications for the weed control and suckering at the same time (nozzles are 0.50 m height above the ground).
Config & ReplicatesRow/s eWeather Parameters
TemperatureRHWind SpeedWind Direction
MeanaMeanbMin MaxMeanOutliers cMeanCentered dPrevalent Direction
°C°C%%m s−1m s−1m s−1%° az.%
XR015_No_HR1115.40.3352.5−0.521.183.202.430.0199.498SSW
215.20.3154.8−0.280.882.681.703.7174.286S
315.70.3153.6−0.081.353.082.280.0156.091SSE
416.20.2151.1−0.181.434.022.460.0197.893SSW
5 & 616.50.2150.00.071.593.982.400.0195.695SSW
7, 8 & 916.70.2348.4−0.431.294.702.570.0190.996S
R2118.80.1247.1−0.051.334.252.450.0176.392S
218.90.0943.80.521.264.622.360.0176.3100S
319.50.1045.00.280.894.012.452.9200.090SSW
419.10.2241.0−0.090.785.122.542.0177.588S
5 & 618.80.1842.90.391.404.502.770.0167.5100S
7, 8 & 919.50.1138.60.530.974.312.781.1177.299SSE
R3116.80.4952.3−0.700.984.942.920.6180.5100S
216.20.3154.2−0.071.004.042.390.0166.689S
316.30.3153.0−0.650.964.512.652.4175.087S
416.60.3453.6−0.291.784.883.440.0176.199S
5 & 616.40.3154.4−0.491.275.403.190.0180.997S
7, 8 & 916.50.3153.7−0.401.074.462.780.0161.492SSE
XR03_No_HR1117.00.2347.0−0.331.433.162.050.0191.391S
217.30.2952.0−0.151.254.802.900.0184.5100S
317.50.2050.6−0.131.364.082.670.0161.092S
417.70.2049.5−0.241.784.622.950.0168.898S
5 & 618.10.2248.0−0.321.765.593.300.0165.885S
7, 8 & 918.20.2048.6−0.181.784.512.950.0171.093S
R2119.70.1241.91.070.784.272.382.3176.288SSE
219.70.0436.20.581.423.972.650.0176.599S
319.90.0134.0−0.041.594.042.570.0156.884SSE
420.10.0238.81.010.893.462.453.0169.883SSE
5 & 620.40.1631.50.360.783.982.383.4161.486SSE
7, 8 & 920.50.1134.40.851.605.152.810.0189.999S
R3117.00.3652.5−0.451.634.952.940.0173.487S
217.20.3852.0−0.620.903.992.470.9162.890SSE
317.00.2753.0−0.361.394.793.000.0174.696S
417.50.2653.7−0.221.925.103.170.0202.685SSW
5 & 617.30.3254.9−0.260.855.103.071.4198.097SSW
7, 8 & 917.20.3856.3−0.551.904.072.800.0192.198S
a Difference of temperature C° between two heights (3 m and 4 m). b Difference of Relative Humidity (RH %) between two heights (3 m and 4 m). c Percentage of records < 1 m s−1. d Percentage of records between 180° ± 45°. e Row/s applied separately.
Figure A1. Contribution of each row/s applied separately to the total spray drift deposits (% of applied volume), represented by stacked bars for each sampled downwind area distance. Row/s applied separately: row 1, row 2, row 3, row 4 and rows 5 and 6. Configurations: conventional nozzles (XR015 and XR03), boom not-shielded (No) and boom 0.50 m height above the ground (H). (Field trials conducted in trellised vineyard cv. Barbera, Piedmont region, Italy, spring 2018).
Sustainability 12 05068 g0a1

References

  1. International Organization of Vine and Wine. OIV Statistical Report on World Vitiviniculture. Available online: http://www.oiv.int/public/medias/6371/oiv-statistical-report-on-world-vitiviniculture-2018.pdf (accessed on 6 April 2020).
  2. Byrne, M.E.; Howell, G.S. Initial response of Baco Noir grapevines to pruning severity, sucker removal, and weed control. Am. J. Enol. Vitic. 1978, 29, 192–198. [Google Scholar]
  3. Moretti, M.L.; Peachey, E. Section N: Vegetation management in orchard, vineyard, and berry crops-vineyard and grape. In Pacific Northwest Weed Management Handbook; Peachey, E., Ed.; Oregon State University: Corvallis, OR, USA, 2019. [Google Scholar]
  4. Balsari, P.; Marucco, P.; Vidotto, F.; Tesio, F. Assessment of different techniques for weed control in vineyard. In Proceedings of the Giornate Fitopatologiche, Riccione, Italy, 27–29 March 2006; pp. 529–534. [Google Scholar]
  5. Pergher, G.; Gubiani, R.; Mainardis, M. Field testing of a biomass-fueled flamer for in-row weed control in the vineyard. Agriculture 2019, 9, 210. [Google Scholar] [CrossRef] [Green Version]
  6. Pergher, G.; Gubiani, R.; Mainardis, M. A biomass-fueled flamer for in-row weed control in vineyards: An economic evaluation. In Innovative Biosystems Engineering for Sustainable Agriculture, Forestry and Food Production, Lecture Notes in Civil Engineering; Coppola, A., Di Renzo, G., Altieri, G., D’Antonio, P., Eds.; Springer: Cham, Switzerland, 2020; Volume 67, pp. 381–388. [Google Scholar] [CrossRef]
  7. Martelloni, L.; Frasconi, C.; Sportelli, M.; Fontanelli, M.; Raffaelli, M.; Peruzzi, A. The use of different hot foam doses for weed control. Agronomy 2019, 9, 490. [Google Scholar] [CrossRef] [Green Version]
  8. Manzone, M.; Demeneghi, M.; Marucco, P.; Grella, M.; Balsari, P. Technical solutions for under-row weed control in vineyards: Efficacy, costs and environmental aspects analysis. J. Agric. Eng. 2020, 51, 36–42. [Google Scholar] [CrossRef] [Green Version]
  9. Monteiro, A.; Moreira, I. Reduced rates of residual and post-emergence herbicides for weed control in vineyards. Weed Res. 2004, 44, 117–128. [Google Scholar] [CrossRef]
  10. Lembo, S.; Ravizza, G. Gestione nel vigneto di polloni ed infestanti sottofila. L’Informatore Agrario 2000, 19, 57–61. [Google Scholar]
  11. Valenti, L.; Maccarrone, G. Confronto tra diverse tecniche di spollonatura della vite. L’Informatore Agrario 1996, 52, 61–66. [Google Scholar]
  12. Hellman, E.W. Grapevine structure and function. In Oregon Viticulture; Hellman, E.W., Ed.; Oregon State University Press: Corvallis, OR, USA, 2003; pp. 5–19. [Google Scholar]
  13. Dolci, M.; Galeotti, F.; Curir, P.; Schellino, L.; Gay, G. New 2-naphthyloxyacetates for trunk sucker growth control on grapevine (Vitis vinifera L.). Plant Growth Regul. 2004, 44, 47–52. [Google Scholar] [CrossRef]
  14. Kang, F.; Wang, H.J.; Pierce, F.; Zhang, Q.; Wang, S. Sucker Detection of Grapevines for Targeted Spray Using Optical Sensors. Trans. ASABE 2012, 55, 2007–2014. [Google Scholar] [CrossRef]
  15. Paliotti, A.; Poni, S.; Silvestroni, O. Interventi in verde. Spollonatura. In La nuova Viticoltura. Innovazioni Tecniche per Modelli Produttivi Efficienti e Sostenibili; Edagricole: Milano, Italy, 2015; p. 141. [Google Scholar]
  16. Lanini, W.T.; McGourty, G.T.; Thrupp, L.A. Weed management for organic vineyards. In Organic Winegrowing Manual; McGourty, G., Ed.; University of California, Agriculture and Natural Resources: Davis, CA, USA, 2011; pp. 69–82. [Google Scholar]
  17. Gramaje, D.; Úrbez-Torres, J.R.; Sosnowski, M.R. Managing grapevine trunk diseases with respect to etiology and epidemiology current strategies and future prospects. Plant Dis. 2018, 102, 12–39. [Google Scholar] [CrossRef] [Green Version]
  18. Ahmedullah, M.; Wolfe, W.H. Control of sucker growth on Vitis vinifera L. cultivar Sauvignon Blanc with naphthalene acetic acid. Am. J. Enol. Vitic. 1982, 33, 198–200. [Google Scholar]
  19. Aktar, M.W.; Sengupta, D.; Chowdhury, A. Impact of pesticides use in agriculture: Their benefits and hazards. Interdiscip. Toxicol. 2009, 2, 1–12. [Google Scholar] [CrossRef] [PubMed] [Green Version]
  20. Gupta, P.K. Chapter 39 -Herbicides and fungicides. In Reproductive and Developmental Toxicology; Gupta, R.C., Ed.; Academic Press: San Diego, CA, USA, 2011; pp. 503–521. [Google Scholar]
  21. Hewitt, A.J. Spray drift: Impact of requirements to protect the environment. Crop Prot. 2000, 19, 623–627. [Google Scholar] [CrossRef]
  22. Myers, J.P.; Antoniou, M.N.; Blumberg, B.; Carroll, L.; Colborn, T.; Everett, L.G.; Hansen, M.; Landrigan, P.J.; Lanphear, B.P.; Mesnage, R.; et al. Concerns over use of glyphosate-based herbicides and risks associated with exposures: A consensus statement. Environ. Health 2016, 15, 1–13. [Google Scholar] [CrossRef] [PubMed] [Green Version]
  23. Carlsen, S.C.K.; Spliid, N.H.; Svensmark, B. Drift of 10 herbicides after tractor spray application. 2. Primary drift (droplet drift). Chemosphere 2006, 64, 778–786. [Google Scholar] [CrossRef]
  24. Sharma, A.; Kumar, V.; Shahzad, B.; Tanveer, M.; Sidhu, G.P.S.; Handa, N.; Kohli, S.K.; Yadav, P.; Bali, A.S.; Parihar, R.D.; et al. Worldwide pesticide usage and its impacts on ecosystem. SN Appl. Sci. 2019, 1, 1446. [Google Scholar] [CrossRef] [Green Version]
  25. Sud, M. Managing the Biodiversity Impacts of Fertiliser and Pesticide Use: Overview and Insights from Trends and Policies Across Selected OECD Countries; OECD Publishing: Paris, France, 2020; Volume 155. [Google Scholar]
  26. Food and Agriculture Organization of the United Nations. FAO International Code of Conduct on the Distribution and Use of Pesticides. Available online: http://www.fao.org/fileadmin/templates/agphome/documents/Pests_Pesticides/Code/code.pdf (accessed on 6 April 2020).
  27. World Health Organization; WHO Chemical Safety. Available online: https://www.who.int/health-topics/chemical-safety#tab=tab_1 (accessed on 6 April 2020).
  28. EC. Directive 2009/128/EC of the European parliament and the council of 21 October 2009 establishing a framework for community action to achieve the sustainable use of pesticides. Off. J. Eur. Union L 2009, 309, 71–86. [Google Scholar]
  29. Muscutt, A.D.; Harris, G.L.; Bailey, S.W.; Davies, B.D. Buffer zones to improve water quality: A review of their potential use in UK agriculture. Agric. Ecosyst. Environ. 1993, 45, 59–77. [Google Scholar] [CrossRef]
  30. Brown, R.B.; Carter, M.H.; Stephenson, G.R. Buffer zone and windbreak effects on spray drift deposition in a simulated wetland. Pest Manag. Sci. 2004, 60, 1085–1090. [Google Scholar] [CrossRef]
  31. van de Zande, J.C.; Huijsmans, J.F.M.; Porskamp, H.A.J.; Michielsen, J.M.G.P.; Stallinga, H.; Holterman, H.J.; de Jong, A. Spray techniques: How to optimise spray deposition and minimise spray drift. Environmentalist 2008, 28, 9–17. [Google Scholar] [CrossRef] [Green Version]
  32. ISO. ISO22866:2005: Equipment for Crop Protection-Methods for Field Measurements of Spray Drift; International Organization for Standardization: Geneva, Switzerland, 2005; pp. 1–17. [Google Scholar]
  33. Felsot, A.S.; Unsworth, J.B.; Linders, J.B.H.J.; Roberts, G. Agrochemical spray drift; assessment and mitigation—A review. J. Environ. Sci. Health B 2011, 46, 1–23. [Google Scholar] [CrossRef]
  34. Lahr, J.; Gadji, B.; Dia, D. Predicted buffer zones to protect temporary pond invertebrates from groundbased insecticide applications against desert locusts. Crop Prot. 2000, 19, 489–500. [Google Scholar] [CrossRef]
  35. Dabrowski, J.M.; Schulz, R. Predicted and measured levels of azinphosmethyl in the Lourens River, South Africa. Comparison of runoff and spray drift. Environ. Toxicol. Chem. 2003, 22, 494–500. [Google Scholar] [CrossRef] [PubMed]
  36. Benbrook, C.M.; Baker, B.P. Perspective on dietary risk assessment of pesticide residues in organic food. Sustainability 2014, 6, 3552–3570. [Google Scholar] [CrossRef] [Green Version]
  37. Butler Ellis, M.C.; Lane, A.G.; O’Sullivan, C.M.; Miller, P.C.H.; Glass, C.R. Bystander exposure to pesticide spray drift: New data for model development and validation. Biosyst. Eng. 2010, 107, 162–168. [Google Scholar] [CrossRef]
  38. Butler Ellis, M.C.; Lane, A.G.; O’Sullivan, C.M.; Alanis, R.; Harris, A.; Stallinga, H.; van de Zande, J.C. Bystander and resident exposure to spray drift from orchard applications: Field measurements, including a comparison of spray drift collectors. Asp. Appl. Biol. 2014, 122, 187–194. [Google Scholar]
  39. van den Berg, F.; Kubiak, R.; Benjey, W.G.; Majewski, M.S.; Yates, S.R.; Reeves, G.L.; Smelt, J.H.; van der Linden, A.M.A. Emission of Pesticides into the Air. Water Air Soil Pollut. 1999, 115, 195–218. [Google Scholar] [CrossRef]
  40. Landers, A. Equipment for Weed Control in Vineyards. Available online: https://extension.umd.edu/sites/extension.umd.edu/files/_docs/programs/viticulture/WeedControlVineyards2005.pdf (accessed on 6 April 2020).
  41. Balsari, P.; Marucco, P.; Tamagnone, M. A test bench for the classification of boom sprayers according to drift risk. Crop Prot. 2007, 26, 1482–1489. [Google Scholar] [CrossRef]
  42. Nuyttens, D.; De Schampheleire, M.; Baetens, K.; Sonck, B. The influence of operator-controlled variables on spray drift from field crop sprayers. Trans. ASABE 2007, 50, 1129–1140. [Google Scholar] [CrossRef]
  43. Guler, H.; Zhu, H.; Ozkan, H.E.; Derksen, R.C.; Yu, Y.; Krause, C.R. Spray characteristics and drift reduction potential with air-induction and conventional flat fan nozzles. Trans. ASABE 2007, 50, 745–754. [Google Scholar] [CrossRef]
  44. Nuyttens, D.; Baetens, K.; De Schampheleire, M.; Sonck, B. Effect of nozzle type, size and pressure on spray droplet characteristics. Biosyst. Eng. 2007, 97, 333–345. [Google Scholar] [CrossRef]
  45. van de Zande, J.C.; Holterman, H.J.; Wenneker, M. Nozzle classification for drift reduction in orchard spraying: Identification of drift reduction class threshold nozzles. Agric. Eng. Int. 2008, 10, 1–12. [Google Scholar]
  46. Southcombe, E.S.E.; Miller, P.C.H.; Ganzelmeier, H.; van de Zande, J.C.; Miralles, A.; Hewitt, A.J. The international (BCPC) spray classification system including a drift potential factor. In Proceedings of the Brighton Crop Protection Conference-Weeds, Brighton, UK, 17–20 November 1997; pp. 371–380. [Google Scholar]
  47. Klingman, D.L.; Bovey, R.W.; Knake, E.L.; Lange, A.H.; Meade, J.A.; Skroach, W.A.; Stewart, R.E.; Wyse, D.L. Systemic Herbicides for Weed Control: Phenoxy Herbicides, Dicamba, Picloram, Amitrole, and Glyphosate; Published and Distributed in Cooperation with the Extension Service; U.S. Department of Agriculture: Washington, DC, USA, 1983.
  48. Ramsdale, B.K.; Messersmith, C.G. Drift-reducing nozzle effects on herbicide performance. Weed Technol. 2001, 15, 453–460. [Google Scholar] [CrossRef]
  49. Jensen, P.K. Herbicide performance with low volume low-drift and airinclusion nozzles. In Proceedings of the Brighton Crop Protection Conference-Weeds, Brighton, UK, 15–18 November 1999; pp. 371–380. [Google Scholar]
  50. Wolf, T.M. Low-drift nozzle efficacy with respect to herbicide mode of action. Asp. Appl. Biol. 2000, 57, 29–34. [Google Scholar]
  51. Cawood, P.N.; Robinson, T.H.; Whittaker, S. An investigation of alternative application techniques for the control of blackgrass. In Proceedings of the Brighton Crop Protection Conference-Weeds, Brighton, UK, 20–23 November 1995; pp. 521–528. [Google Scholar]
  52. Adams, A.J.; Chapple, A.C.; Hall, F.R. Droplet spectra for some agricultural fan nozzles, with respect to drift and biological efficiency. In Pesticide Formulations and Application Systems: Tenth Symposium; Bode, L.E., Hazen, J.L., Chasin, D.G., Eds.; ASTM STP 1078; American Society for Testing and Materials: Philadelphia, PA, USA, 1990; pp. 156–169. [Google Scholar]
  53. Foster, H.C.; Sperry, B.P.; Reynolds, D.B.; Kruger, G.R. Reducing Herbicide Particle Drift: Effect of Hooded Sprayer and Spray Quality. Weed Technol. 2018, 32, 714–721. [Google Scholar] [CrossRef]
  54. Balsari, P.; Bozzer, C.; Manzone, M.; Tamagnone, M. Drift assessment during chemical weed control. Acta Hortic. 2013, 978, 205–209. [Google Scholar] [CrossRef]
  55. Wise, A.; Senesac, A. Postemergence Weed Control in Vineyards. Available online: https://blogs.cornell.edu/nnygrapeupdate/2014/05/14/postemergence-weed-control-in-vineyards/ (accessed on 6 April 2020).
  56. Rautmann, D.; Streloke, M.; Winkler, R. New basic drift values in the authorization procedure for plant protection products. Mitteilungen aus der Biologischen Bundesanstaltd fur Land-und Forstwirtschaft 2001, 383, 133–141. [Google Scholar]
  57. Gil, E.; Llorens, J.; Montserrat Gallart, M.; Gil-Ribes, J.A.; Miranda-Fuentes, A. First attempts to obtain a reference drift curve for traditional olive grove’s plantations following ISO 22866. Sci. Total Environ. 2018, 627, 349–360. [Google Scholar] [CrossRef]
  58. Garcerá, C.; Moltó, E.; Chueca, P. Spray pesticide applications in Mediterranean citrus orchards: Canopy deposition and off-target losses. Sci. Total Environ. 2017, 599–600, 1344–1362. [Google Scholar] [CrossRef]
  59. Grella, M.; Montserrat Gallart, M.; Marucco, P.; Balsari, P.; Gil, E. Ground deposition and airborne spray drift assessment in vineyard and orchard: The influence of environmental variables and sprayer settings. Sustainability 2017, 9, 728. [Google Scholar] [CrossRef] [Green Version]
  60. Grella, M.; Marucco, P.; Manzone, M.; Gallart, M.; Balsari, P. Effect of sprayer settings on spray drift during pesticide application in poplar plantations (Populus. spp.). Sci. Total Environ. 2017, 578, 427–439. [Google Scholar] [CrossRef] [PubMed] [Green Version]
  61. van de Zande, J.C.; Wenneker, M.; Michielsen, J.M.G.P.; Stallinga, H. Spray drift and resident risk in orchard spraying; reference and spray drift reducing techniques. In Proceedings of the 13th Workshop on Spray Application in Fruit Growing—Suprofruit2015, Lindau, Germany, 15–18 July 2015; pp. 40–41. [Google Scholar]
  62. Nuyttens, D.; De Schampheleire, M.; Baetens, K.; Brusselman, E.; Dekeyser, D.; Verboven, P. Drift from field crop sprayers using and integrated approach results of a five year study. Trans. ASABE 2011, 54, 403–408. [Google Scholar] [CrossRef] [Green Version]
  63. Rimmer, D.A.; Johnson, P.D.; Kelsey, A.; Warren, N.D. Field experiments for the evaluation of pesticide spray-drift on arable crops. Pest Manag. Sci. 2009, 65, 665–671. [Google Scholar] [CrossRef] [PubMed]
  64. Ravier, I.; Haouisee, E.; Clément, M.; Seux, R.; Briand, O. Field experiments for the evaluation of pesticide spray-drift on arable crops. Pest Manag. Sci. 2005, 61, 728–736. [Google Scholar] [CrossRef] [PubMed]
  65. van de Zande, J.C.; Rautmann, D.; Holterman, H.J.; Huijsmans, J.F.M. Joined Spray Drift Curves for Boom Sprayers in The Netherlands and Germany. Available online: https://edepot.wur.nl/353554 (accessed on 19 June 2020).
  66. Lorenz, D.; Eichorn, D.; Bleiholder, H.; Klose, R.; Meier, U.; Weber, E. Phänologische Entwicklungsstadien der Weinrebe (Vitis vinifera L. ssp. vinifera). Codierung und Beschreibung nach der erweiterten BBCH-Skala. Vitic. Enol. Sci. 1994, 49, 66–70. [Google Scholar]
  67. Grella, M.; Marucco, P.; Balsari, P. Valutazione della deriva generata dalle barre irroratrici impiegate per l’applicazione degli erbicidi in vigneto: Prime esperienze di campo e proposta di una nuova metodologia di prova. In Proceedings of the Giornate Fitopatologiche, Chianciano Terme, Italy, 6–9 March 2018; pp. 641–649. [Google Scholar]
  68. Pergher, G. Recovery rate and tracers dye used for spray deposit assessment. Trans. ASAE 2001, 44, 787–794. [Google Scholar] [CrossRef]
  69. ISO. ISO22401:2015: Equipment for Crop Protection—Method for Measurement of Potential Drift from Horizontal Boom Sprayer Systems by the Use of a Test Bench; International Organization for Standardization: Geneva, Switzerland, 2015; p. 12. [Google Scholar]
  70. Taylor, W.A.; Cooper, S.E.; Miller, P.C.H. An appraisal of nozzles and sprayers abilities to meet regulatory demands for reduced airborne drift and downwind fallout from arable crop spraying. In Proceedings of the Brighton Crop Protection Conference-Weeds, Brighton, UK, 15–18 November 1999; pp. 447–452. [Google Scholar]
  71. Nuyttens, D.; Taylor, W.A.; De Schampheleire, M.; Verboven, P.; Dekeyser, D. Influence of nozzle type and size on drift potential by means of different wind tunnel evaluation methods. Biosyst. Eng. 2009, 103, 271–280. [Google Scholar] [CrossRef]
  72. Grella, M.; Marucco, P.; Balsari, P. Toward a new method to classify the airblast sprayers according to their potential drift reduction: Comparison of direct and new indirect measurement methods. Pest Manag. Sci. 2019, 75, 2219–2235. [Google Scholar] [CrossRef] [PubMed]
  73. ISO. ISO22369–1:2006(E): Crop Protection Equipment—Drift Classification of Spraying Equipment—Part 1: Classes; International Organization for Standardization: Geneva, Switzerland, 2006; p. 1. [Google Scholar]
  74. Wenneker, M.; Michielsen, J.M.G.P.; Heijne, B.; van de Zande, J.C. Contribution of individual tree row sprayings to the total spray drift deposition next to an apple orchard. In Proceedings of the 8th Workshop on Spray Application Techniques in Fruit Growing—Suprofruit 2005, Barcelona, Spain, 29 June–1 July 2005; pp. 47–53. [Google Scholar]
  75. Martinson, D. Smoothed Curve Fittin. In Quantitative Methods of Data Analysis for the Physical Sciences and Engineering, 1st ed.; Cambridge University Press: Cambridge, UK, 2018; pp. 128–177. [Google Scholar] [CrossRef]
  76. Chai, T.; Draxler, R.R. Root mean square error (RMSE) or mean absolute error (MAE)? Geosci. Model. Dev. 2014, 7, 1525–1534. [Google Scholar] [CrossRef] [Green Version]
  77. Arvidsson, T.; Bergström, L.; Kreuger, J. Comparison of collectors of airborne spray drift. Experiments in a wind tunnel and field measurements. Pest Manag. Sci. 2011, 67, 725–733. [Google Scholar] [CrossRef]
  78. Baetens, K.; Ho, Q.T.; Nuyttens, D.; de Schampheleire, M.; Endalew, A.; Hertog, M.; Nicolai, B.; Ramon, H.; Verboven, P. Development of a 2-D-diffusion advection model for fast prediction of field drift. Atmos. Environ. 2008, 43, 1674–1682. [Google Scholar] [CrossRef]
  79. Gil, E.; Gallart, M.; Balsari, P.; Marucco, P.; Almajano, M.P.; Llop, J. Influence of wind velocity and wind direction on measurements of spray drift potential of boom sprayers using drift test bench. Agric. For. Meteorol. 2015, 202, 94–101. [Google Scholar] [CrossRef] [Green Version]
  80. Zhu, H.; Reichard, D.L.; Fox, R.D.; Brazee, R.D.; Ozkan, H.E. Simulation of drift of discrete sizes of water droplets from field sprayers. Trans. ASAE 1994, 37, 1401–1407. [Google Scholar] [CrossRef]
  81. Bird, S.L.; Esterly, D.M.; Perry, S.G. Off-target deposition of pesticides from agricultural aerial spray application. J. Environ. Qual. 1996, 25, 1095–1104. [Google Scholar] [CrossRef]
  82. Threadgill, E.D.; Smith, D.B. Effect of physical and meteorological parameters on drift of controlled size droplets. Trans. ASAE 1975, 18, 51–56. [Google Scholar]
  83. Combellack, J.H.; Western, N.M.; Richardson, R.G. A comparison of the drift potential of a novel twin fluid nozzle with conventional low volume flat fan nozzles when using a range of adjuvants. Crop Prot. 1996, 15, 147–152. [Google Scholar] [CrossRef]
  84. Arvidsson, T.; Bergström, L.; Kreuger, J. Spray drift as influenced by meteorological and technical factors. Pest Manag. Sci. 2011, 67, 586–598. [Google Scholar] [CrossRef]
  85. Crabbe, R.S.; Mc Cooeye, M.; Mickle, R.E. The influence of atmospheric stability on wind drift from ultra-low volume aerial forest spray applications. J. Appl. Meteorol. 1994, 33, 500–507. [Google Scholar] [CrossRef] [Green Version]
  86. Duga, A.T.; Ruysen, K.; Dekeyser, D.; Nuyttens, D.; Bylemans, D.; Nicolaï, B.M.; Verboven, P. Spray deposition profiles in pome fruit trees: Effects of sprayer design, training system and tree canopy characteristics. Crop Prot. 2015, 67, 200–213. [Google Scholar] [CrossRef]
  87. FOCUS. FOCUS Surface Water Scenarios in the EU Evaluation Process under 91/414/EEC. Available online: https://esdac.jrc.ec.europa.eu/projects/surface-water (accessed on 19 June 2020).
  88. Golla, B.; Strassemeyer, J.; Gutsche, V.; Kotch, H. Method for a stochastic simulation of spray drift values as basis for a probabilistic and spatially explicit exposure assessment of surface waters. In Proceedings of the 10th Workshop on Spray Application in Fruit Growing—Suprofruit2009, Wageningen, The Netherlands, 30 September–2 October 2009; pp. 118–119. [Google Scholar]
  89. EFSA PPR Panel (EFSA Panel on Plant Protection Products and their Residues), Guidance on tiered risk assessment for plant protection products for aquatic organisms in edge-of-field surface waters. EFSA J. 2013, 11, 3290. [CrossRef]
  90. Holterman, H.J.; van der Zande, J.C.; Huijsmans, J.F.M.; Wenneker, M. Development of a spray drift model for spray applications in fruit orchards. In Wageningen Plant Research Rapport; No. WPR-566; Stichting Wageningen Research, Wageningen Plant Research, Business Unit Agrosystems Research: Wageningen, The Netherlands, 2018. [Google Scholar] [CrossRef]
Figure 1. (a) Boom sprayer for the under-row band herbicide application in vineyard. The spray equipment could be used for (b) chemical suckering and weed control at the same time or for (c,d) weed control only; it could be employed (b,c) not-shielded, (b,c) semi-shielded and (d) fully-shielded.
Sustainability 12 05068 g001
Figure 2. Overall aerial view scheme of trials’ layout intended for ground spray drift measurements in vineyard (Piedmont region, Italy, spring 2018).
Sustainability 12 05068 g002
Figure 3. Test plot layout for spray drift measurements in vineyard (Piedmont region, Italy, spring 2018).
Sustainability 12 05068 g003
Figure 4. Overall aerial view scheme of trials’ layout, “ad hoc” designed for the evaluation of the contribution of each vineyard row spray application to the total spray drift generation (Piedmont region, Italy, spring 2018).
Sustainability 12 05068 g004
Figure 5. Spray drift deposit profiles using a conventional boom sprayer for the under-row band herbicide application (a) for weed control and suckering at the same time and (b) for weed control only. The mean ± SEM (μL cm−2) of the spray deposit on the collectors is represented at downwind distances from the sprayed area. Configurations: nozzles (XR015 and XR03: conventional, AI015 and AI03: air-induction), boom shielding (No: not-shielded, Yes: semi-shielded) and boom height (H: nozzles 0.50 m, L: nozzles 0.25 m). (Field trials conducted in trellised vineyard cv. Barbera, Piedmont region, Italy, spring 2018).
Sustainability 12 05068 g005
Figure 6. Drift Values (DVs) (a) averaged over not-shielded and semi-shielded configurations to display the effect of interaction among nozzle type*nozzle size*boom height and (b) averaged over nozzle type, nozzle size and boom height to display the main effect of shielding. The DVs were obtained using a conventional boom sprayer for the under-row band herbicide application intended for weed control and suckering at the same time or for weed control only according to the boom height. The mean ± SEM (μL 10,000 cm−2) of the total spray drift deposition under the curve is represented. Factors tested: nozzle type (XR: conventional, AI: air-induction), nozzle sizes (015 and 03) boom shielding (not-shielded, semi-shielded) and boom height (H: nozzles 0.50 m, L: nozzles 0.25 m). (Field trials conducted in trellised vineyard cv. Barbera, Piedmont region, Italy, spring 2018).
Sustainability 12 05068 g006
Figure 7. Drift reduction values (%) obtained for each configuration tested using a conventional boom sprayer for the under-row band herbicide application in vineyards. The drift reduction values were obtained considering the XR015_No_H configuration as a reference. The light-blue dotted line represents the average spray drift reduction for the spray application configurations intended for weed control and suckering at the same time (0.50 m boom height), while the red dotted line represents the average spray drift reduction for the spray application configurations intended for weed control only (0.25 m boom height). Configurations: nozzles (XR015 and XR03: conventional, AI015 and AI03: air-induction), boom shielding (No: not-shielded, Yes: semi-shielded) and boom height (H: 0.50 m boom height, L: 0.25 m boom height). (Field trials conducted in trellised vineyard cv. Barbera, Piedmont region, Italy, spring 2018).
Sustainability 12 05068 g007
Figure 8. Spray drift deposit profiles obtained by applying separately the vineyard row/s using a conventional boom sprayer for the under-row band herbicide application intended for weed control and suckering at the same time. The mean ± SEM (μL cm−2) of the spray deposit on the collectors is represented at downwind distances from the sprayed area. Row/s applied separately: row 1, row 2, row 3, row 4, rows 5 and 6 and rows 7, 8 and 9. Configurations: conventional nozzles (XR015 and XR03), boom not-shielded (No) and boom 0.50 m height above the ground (H). (Field trials conducted in trellised vineyard cv. Barbera, Piedmont region, Italy, spring 2018).
Sustainability 12 05068 g008
Figure 9. Contribution % of each row/s applied separately to the total spray drift represented by pie charts. Row/s applied separately: row 1, row 2, row 3, row 4, rows 5 and 6 and rows 7, 8 and 9. Configurations: conventional nozzles (XR015 and XR03), boom not-shielded (No) and boom 0.50 m height above the ground (H). (Field trials conducted in trellised vineyard cv. Barbera, Piedmont region, Italy, spring 2018).
Sustainability 12 05068 g009
Figure 10. 90th percentile spray drift deposition, obtained using a conventional boom sprayer for the under-row band herbicide applications, is represented at downwind distances from the sprayed area. The experimental data (black dotted line) deriving from both spray application intended for weed control and suckering at the same time, and weed control only are plotted together with spray drift curves fitted as power law function (red solid line). (Field trials conducted in trellised vineyard cv. Barbera, Piedmont region, Italy, spring 2018).
Sustainability 12 05068 g010
Table 1. Parameter of all configurations examined using a boom sprayer for the under-row band herbicide application in vineyard (Piedmont region, Italy, spring 2018).
Configuration ID aNozzle TypeN° of Active NozzlesWorking Pressure (Mpa)Total Liquid Flow Rate (L min−1)Forward Speed (m s−1)Volume Rate Applied (L ha−1)Boom Height (m)Boom Shielding
XR015_No_HXR110015VS20.31.181.11141.60.50None
XR03_No_HXR11003VS20.32.362.22141.60.50None
AI015_No_HAI110015VS20.31.181.11141.60.50None
AI03_No_HAI11003VS20.32.362.22141.60.50None
XR015_Yes_HXR110015VS20.31.181.11141.60.50Semi
XR03_Yes_HXR11003VS20.32.362.22141.60.50Semi
AI015_Yes_HAI110015VS20.31.181.11141.60.50Semi
AI03_Yes_HAI11003VS20.32.362.22141.60.50Semi
XR015_No_LXR110015VS20.31.181.11141.60.25None
XR03_No_LXR11003VS20.32.362.22141.60.25None
AI015_No_LAI110015VS20.31.181.11141.60.25None
AI03_No_LAI11003VS20.32.362.22141.60.25None
XR015_Yes_LXR110015VS20.31.181.11141.60.25Semi
XR03_Yes_LXR11003VS20.32.362.22141.60.25Semi
AI015_Yes_LAI110015VS20.31.181.11141.60.25Semi
AI03_Yes_LAI11003VS20.32.362.22141.60.25Semi
XR015_Full_LXR110015VS20.31.181.11141.60.25Fully
XR03_Full_LXR11003VS20.32.362.22141.60.25Fully
a ID is composed by the nozzle type (conventional: XR015 and XR03; air-induction: AI015 and AI03), the boom shielding (not-shielded: no; semi-shielded: yes) and boom height (0.50 m: H; 0.25 m: L): nozzle type_boom shielding_boom height.
Table 2. Main characteristics of nozzles used in the trials and relative droplet size spectra (CPT laboratory belonging to DiSAFA, University of Turin, Italy, 2018).
Nozzle TypeSpray Angle (°)Nozzle SizeWorking Pressure (Mpa)Flow Rate (L min−1)D[v,0.1] a (µm)D[v,0.5] a (µm)D[v,0.9] a (µm)V100 b (%)
XR110015VS1100150.30.596213230037.73
XR11003VS110030.31.186916439828.26
AI110015VS1100150.30.591614348194.80
AI11003VS110030.31.182145139653.11
a D[v,0.1], 10% of spray liquid volume fraction is made up of droplets smaller than this value; D[v,0.5], volume median diameter –VMD; D[v,0.9], 90% of spray liquid volume is made up of droplets smaller than this value. b V100: Spray liquid fraction generated with diameter smaller than 100 µm.
Table 3. Significance obtained in four-way ANOVA for drift values (DVs) as affected by nozzle type (flat fan: conventional vs. air-induction), nozzle size (015 vs. 03), boom shielding (not-shielded vs. semi-shielded) and boom height (0.50 m vs. 0.25 m nozzle height above the ground). The DVs are the numerical integral of spray drift curves generated by the configurations tested for the weed control only, and weed control and suckering at the same time using a boom sprayer for under-row band herbicide application (field trials conducted in trellised vineyard cv. Barbera, Piedmont region, Italy, spring 2018).
SourcesSum of SquaresdfMean SquareFpSignif. a
Nozzles type –Nt-511.971511.97364.774.666 × 10−19***
Nozzles size –Ns-26.75126.7519.061.242 × 10−4***
Boom shielding –Bs-11.55111.558.230.007**
Boom height –Bh-534.561534.56380.862.466 × 10−19***
Nt * Ns24.95124.9517.781.901 × 10−4***
Nt * Bs5.6115.614.000.054NS
Nt * Bh163.471163.47116.463.402 × 10−12***
Ns * Bs0.7210.720.510.480NS
Ns * Bh3.0913.092.200.148NS
Bs * Bh2.4112.411.720.199NS
Nt * Ns * Bs3.4613.462.470.126NS
Nt * Ns * Bh13.41113.419.550.004**
Nt * Bs * Bh0.5910.590.420.521NS
Ns * Bs * Bh0.0310.030.020.877NS
Nt * Ns * Bs * Bh1.3611.360.970.333NS
a Statistical significance level: NS Pr > 0.05; * Pr < 0.05; ** Pr <0.01; *** Pr < 0.001.

