Communication

Neural Modeling of the Distribution of Protein, Water and Gluten in Wheat Grains during Storage

by
Katarzyna Szwedziak
1,
Ewa Polańczyk
1,
Żaneta Grzywacz
1,
Gniewko Niedbała
2,* and
Wiktoria Wojtkiewicz
1
1
Department of Biosystems Engineering, Faculty of Production Engineering and Logistic, Opole University of Technology, Prószkowska 76, 45-758 Opole, Poland
2
Institute of Biosystems Engineering, Faculty of Agronomy and Bioengineering, Poznań University of Life Sciences, Wojska Polskiego 50, 60-627 Poznań, Poland;
*
Author to whom correspondence should be addressed.
Sustainability 2020, 12(12), 5050; https://doi.org/10.3390/su12125050
Submission received: 20 May 2020 / Revised: 16 June 2020 / Accepted: 18 June 2020 / Published: 20 June 2020
(This article belongs to the Special Issue Suitable Agronomic Techniques for Sustainable Agriculture)

Abstract

:
An important requirement in the grain industry is to obtain fast information on the quality of purchased and stored grain. Therefore, it is of great importance to search for innovative solutions aimed at the monitoring and fast assessment of quality parameters of stored wheat The results of the evaluation of total protein, water and gluten content by means of near infrared spectrometry are presented in the paper. Multiple linear regression analysis (MLR) and neural modeling were used to analyze the obtained results. The results obtained show no significant changes in total protein (13.13 ± 0.15), water (10.63 ± 0.16) or gluten (30.56 ± 0.54) content during storage. On the basis of the collected data, a model artificial neural network (ANN) MLP 52-6-3 was created, which, with the use of four independent features, allows us to determine changes in the content of water, protein and gluten in stored wheat. The chosen network returned good error values: learning, below 0.001; testing, 0.015; and validation, 0.008. The obtained results and their interpretation are an important element in the warehouse industry. The information obtained in this way about the state of the quality of stored grain will allow for a fast reaction in case of the threat of lowering the quality parameters of the stored grain.

1. Introduction

It is a growing challenge and problem for mankind to meet the growing demand and need for adequate food supplies that result from the growing world population. By 2050, the population is projected to grow to 9.1 billion and food production will have to increase by about 70% to cover all food needs [1,2,3]. It is also estimated that the majority of this population growth will be attributed to developing countries, and it should be noted that at present some of these countries are facing the problem of hunger and lack of adequate food. Additional factors influencing the increase in demand for food will be increased urbanization, climate change and land use for non-food production [4,5,6,7].
Wheat, maize, rye, oats and rice grains are an important source of nutrients and energy. They have to be transported and stored in a manner that ensures their parameters and appropriate quality indicators [8,9]. The storage of cereal grains has been practiced for millennia. Cereals need to be transported and stored correctly in order to maintain their quality, because the production of cereal plants is seasonal in nature and, depending on the location, takes place under different conditions.
The storage of cereal grain plays a key role in developing countries’ economies. This is due to the need for the regularity and availability of supplies from the agricultural sector, which also affects the economic stability of the country. Losses related to improper storage conditions constitute almost 20% of the total production [10,11]. However, farmers from developing countries still rely on traditional methods of cereal grain storage, which continue to expose the stored grain to inappropriate climatic and temperature conditions, which promotes the development of microorganisms, molds and fungi. Additionally, such conditions favor rodent and insect attacks, which lead to further post-harvest losses [12]. Cereal grain storage with the use of specifically developed machines and devices ensures proper conditions which allow the elimination of the occurrence of diseases and pests and reduces the occurrence of mechanical damage which may affect the grain quality [13]. During the storage period, it is necessary to carry out regular inspections of the stored grain, ensuring a proper aeration to prevent warming. These requirements are important for the safety and quality of stored grain [14,15].
Wheat and baked products are considered as an essential source of carbohydrates, protein, dietary fiber, vitamins, micronutrients, and antioxidants worldwide [16,17]. The protein content in wheat at the level of 13% gives it an advantage over other cereals [18].
The total world wheat production in 2018 was estimated at 734.04 million tons, with an estimated production volume of 656.06 million tons in 2009–2010. The area cultivated with wheat in the world in 2018 was 214.29 million hectares, while it was 12.8 million hectares in 1966–1967 and 26.8 million hectares in 2009–2010. In 2018, the wheat yield was 3425.4 kg/ha; for comparison, in the years 1966–1967 it was 887 kg/ha, while in 2009–2010 it was 2707 kg/ha [19,20]. Wheat consumption is growing worldwide, even in countries with climates unfavorable to cultivation. Common wheat is a species with high soil, weather and agrotechnical requirements [8,21]. The yield and its quality are particularly adversely affected by rain shortages during the heading period (according to the Biologische Bundesanstalt, Bundessortenamt und CHemische Industrie (BBCH) 51 phenological phase identification scale, when the tip of inflorescence emerges from the sheath, and the first spikelet is visible), flowering (BBCH 61, when the first anthers are visible) and the development of grain (BBCH 71, when the first grains have reached half their final size). The correct determination of the developmental phase of a plant is determined using the BBCH scale. The extended BBCH scale is a system for uniform phenological coding, determining the various stages of growth of all species of monocotyledonous and dicotyledonous plants used in EU countries. The BBCH scale uses a decimal coding system with ten main phases (0–9), each of which is subdivided into substages. Therefore, two-digit numbers are used to define a given growth phase in detail. The beginning of a given phase is assumed to be the moment when 10% of plants show features described in a given phase [22]. The studies by Lopez-Bellido et al. [23,24] show that warm and moderately humid summer months increase the protein content in the grain. Cold and humid weather during this period increases the alpha-amylase activity, which leads to pre-harvest grain sprouting [23,24]. A moderately dry and warm vegetation season promotes protein accumulation in winter wheat grain, especially a high gluten content and high Zeleny sedimentation index [18]. The yield of wheat grain and its technological quality depend on cultivar characteristics, habitat factors and the applied agrotechnology. Quality and bread-making cultivars are characterized by high protein and gluten content in grain and the high value of the sedimentation index, as well as the lack of premature germination signs. The density and uniformity of grain and the total ash content are also important technological features [25].
An important element of the grain industry is to obtain fast information on the quality of purchased and stored grain. To this end, a fast method of grain quality assessment should be developed. Undoubtedly, technological workshops in grain warehouses should be improved. One of the fastest developing laboratory technologies in the cereal industry is analysis using color measurement and artificial neural networks (ANN) [26,27]. Artificial neural networks, which are methods of nonlinear modelling, allow accepting the forecasting error. As a rule, they give better forecasting results than classical mathematical models and enable combining quantitative and qualitative data [28,29,30]. Therefore, it seems justified to develop an innovative method allowing for the determination of the most important features of grain in an easy and fast way. Therefore, a modern method based on neural networks included in machine learning was used [31].
The aim of the study was to determine the changes in the content of water, protein and gluten in cereals during the storage process in silos. Near-infrared spectrometry with an Infratec 1241 analyzer and neural modelling methods allowing for the analysis of the obtained empirical results were used in the study. These methods will be used to determine important process parameters during the storage of wheat grain.

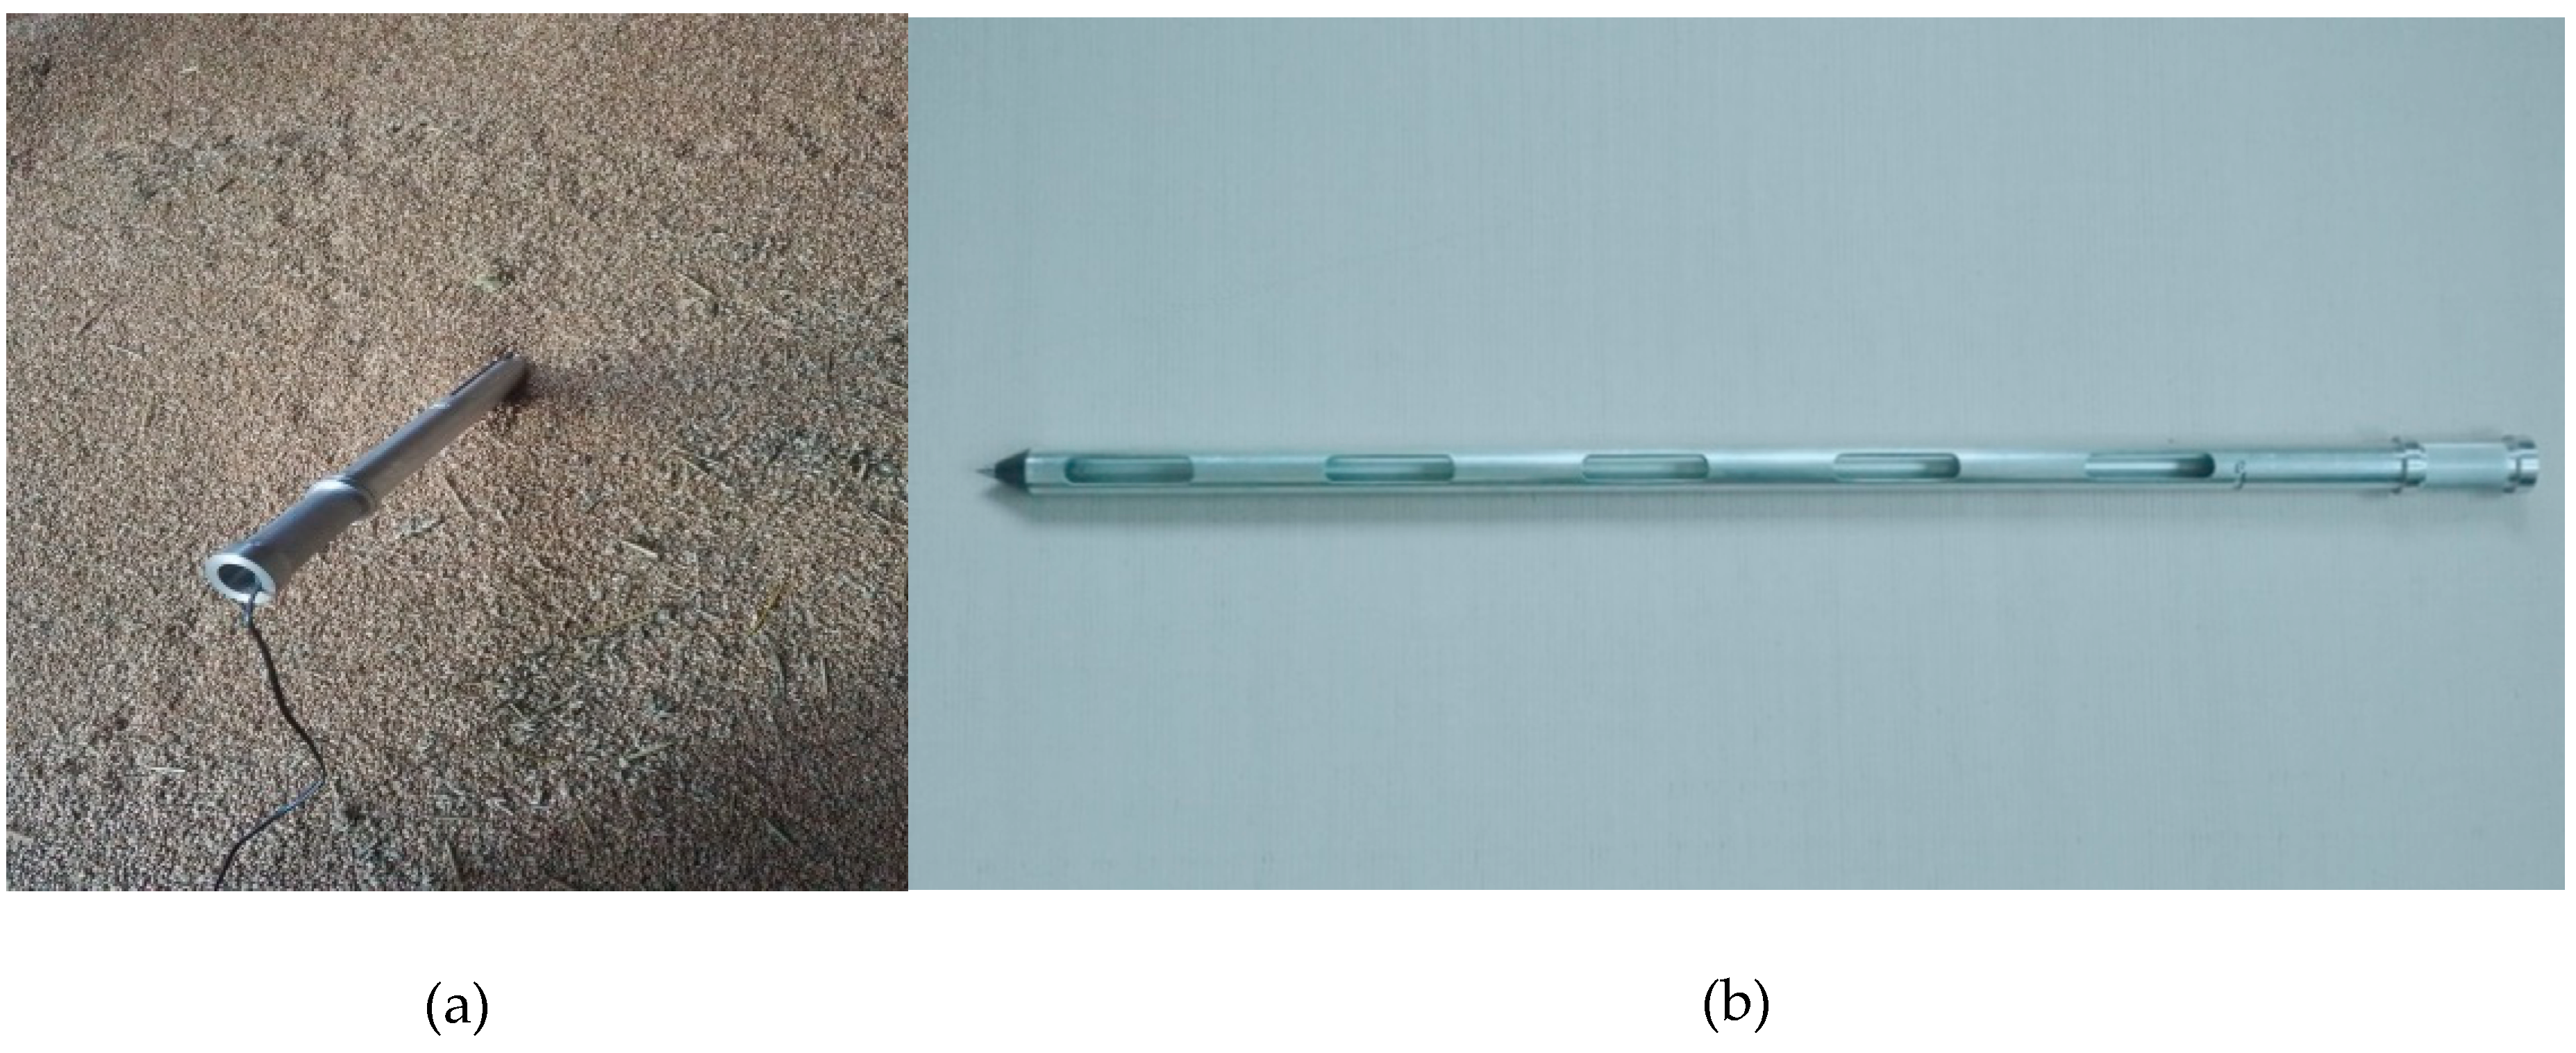
2. Materials and Methods
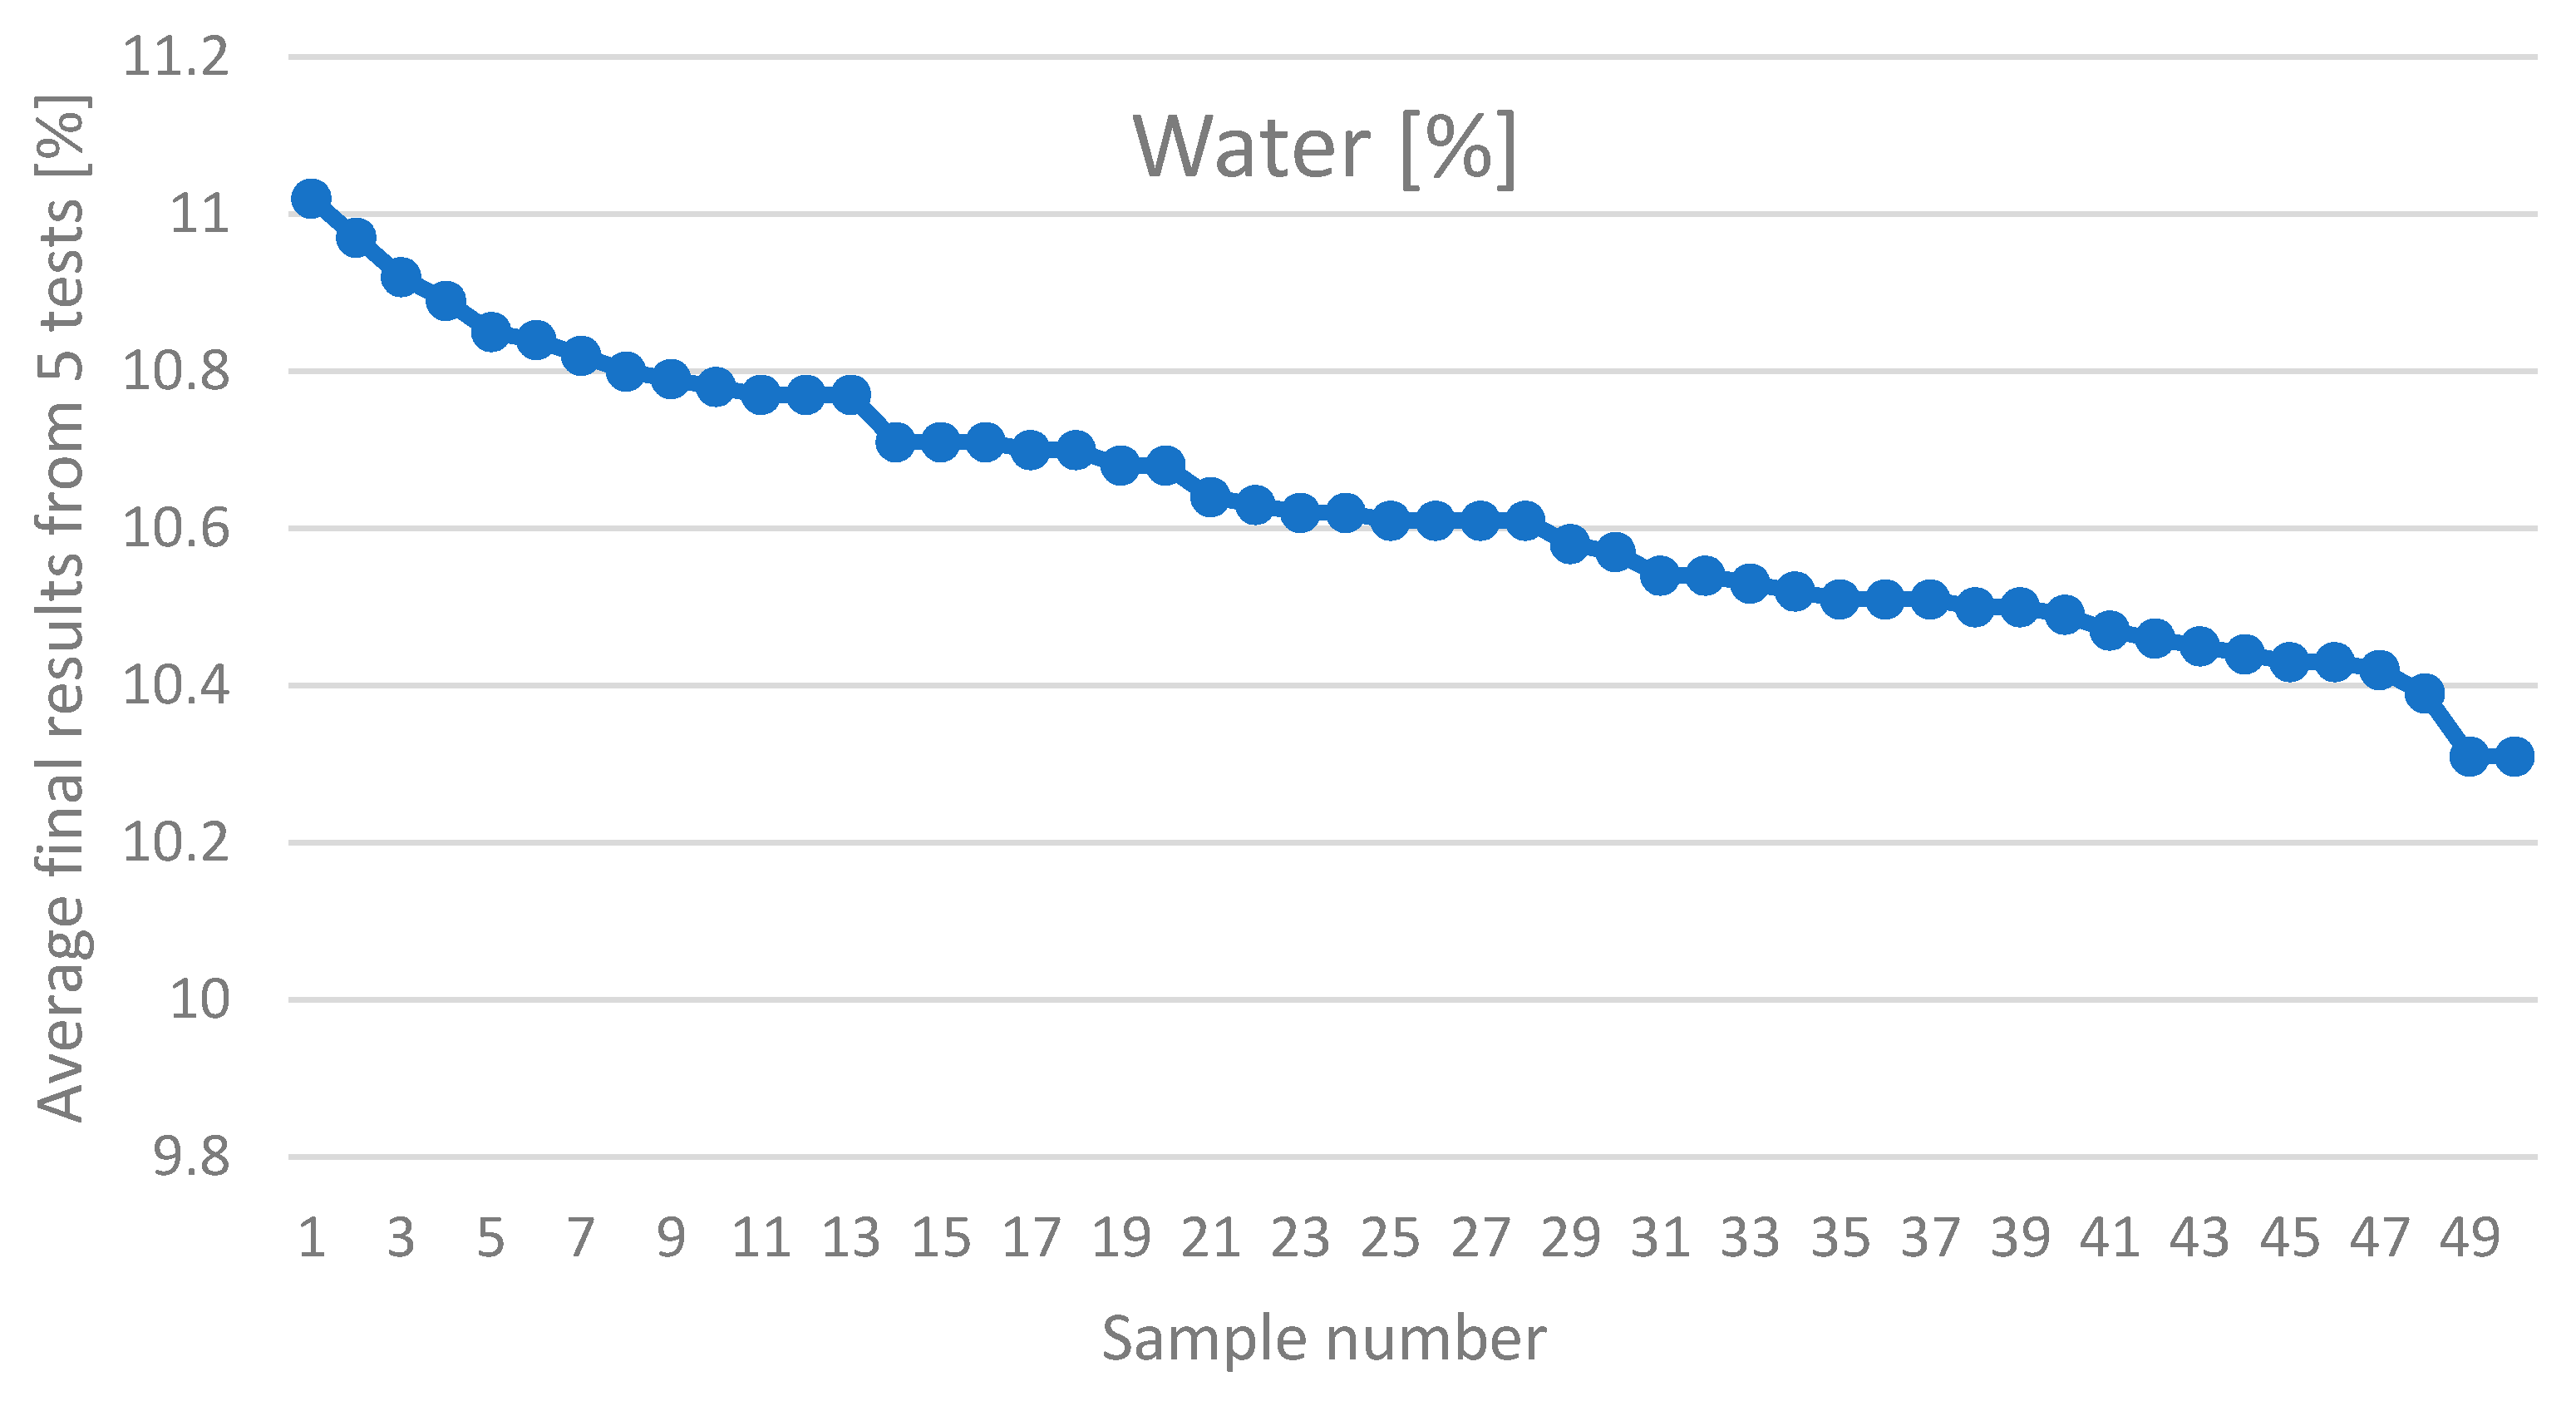
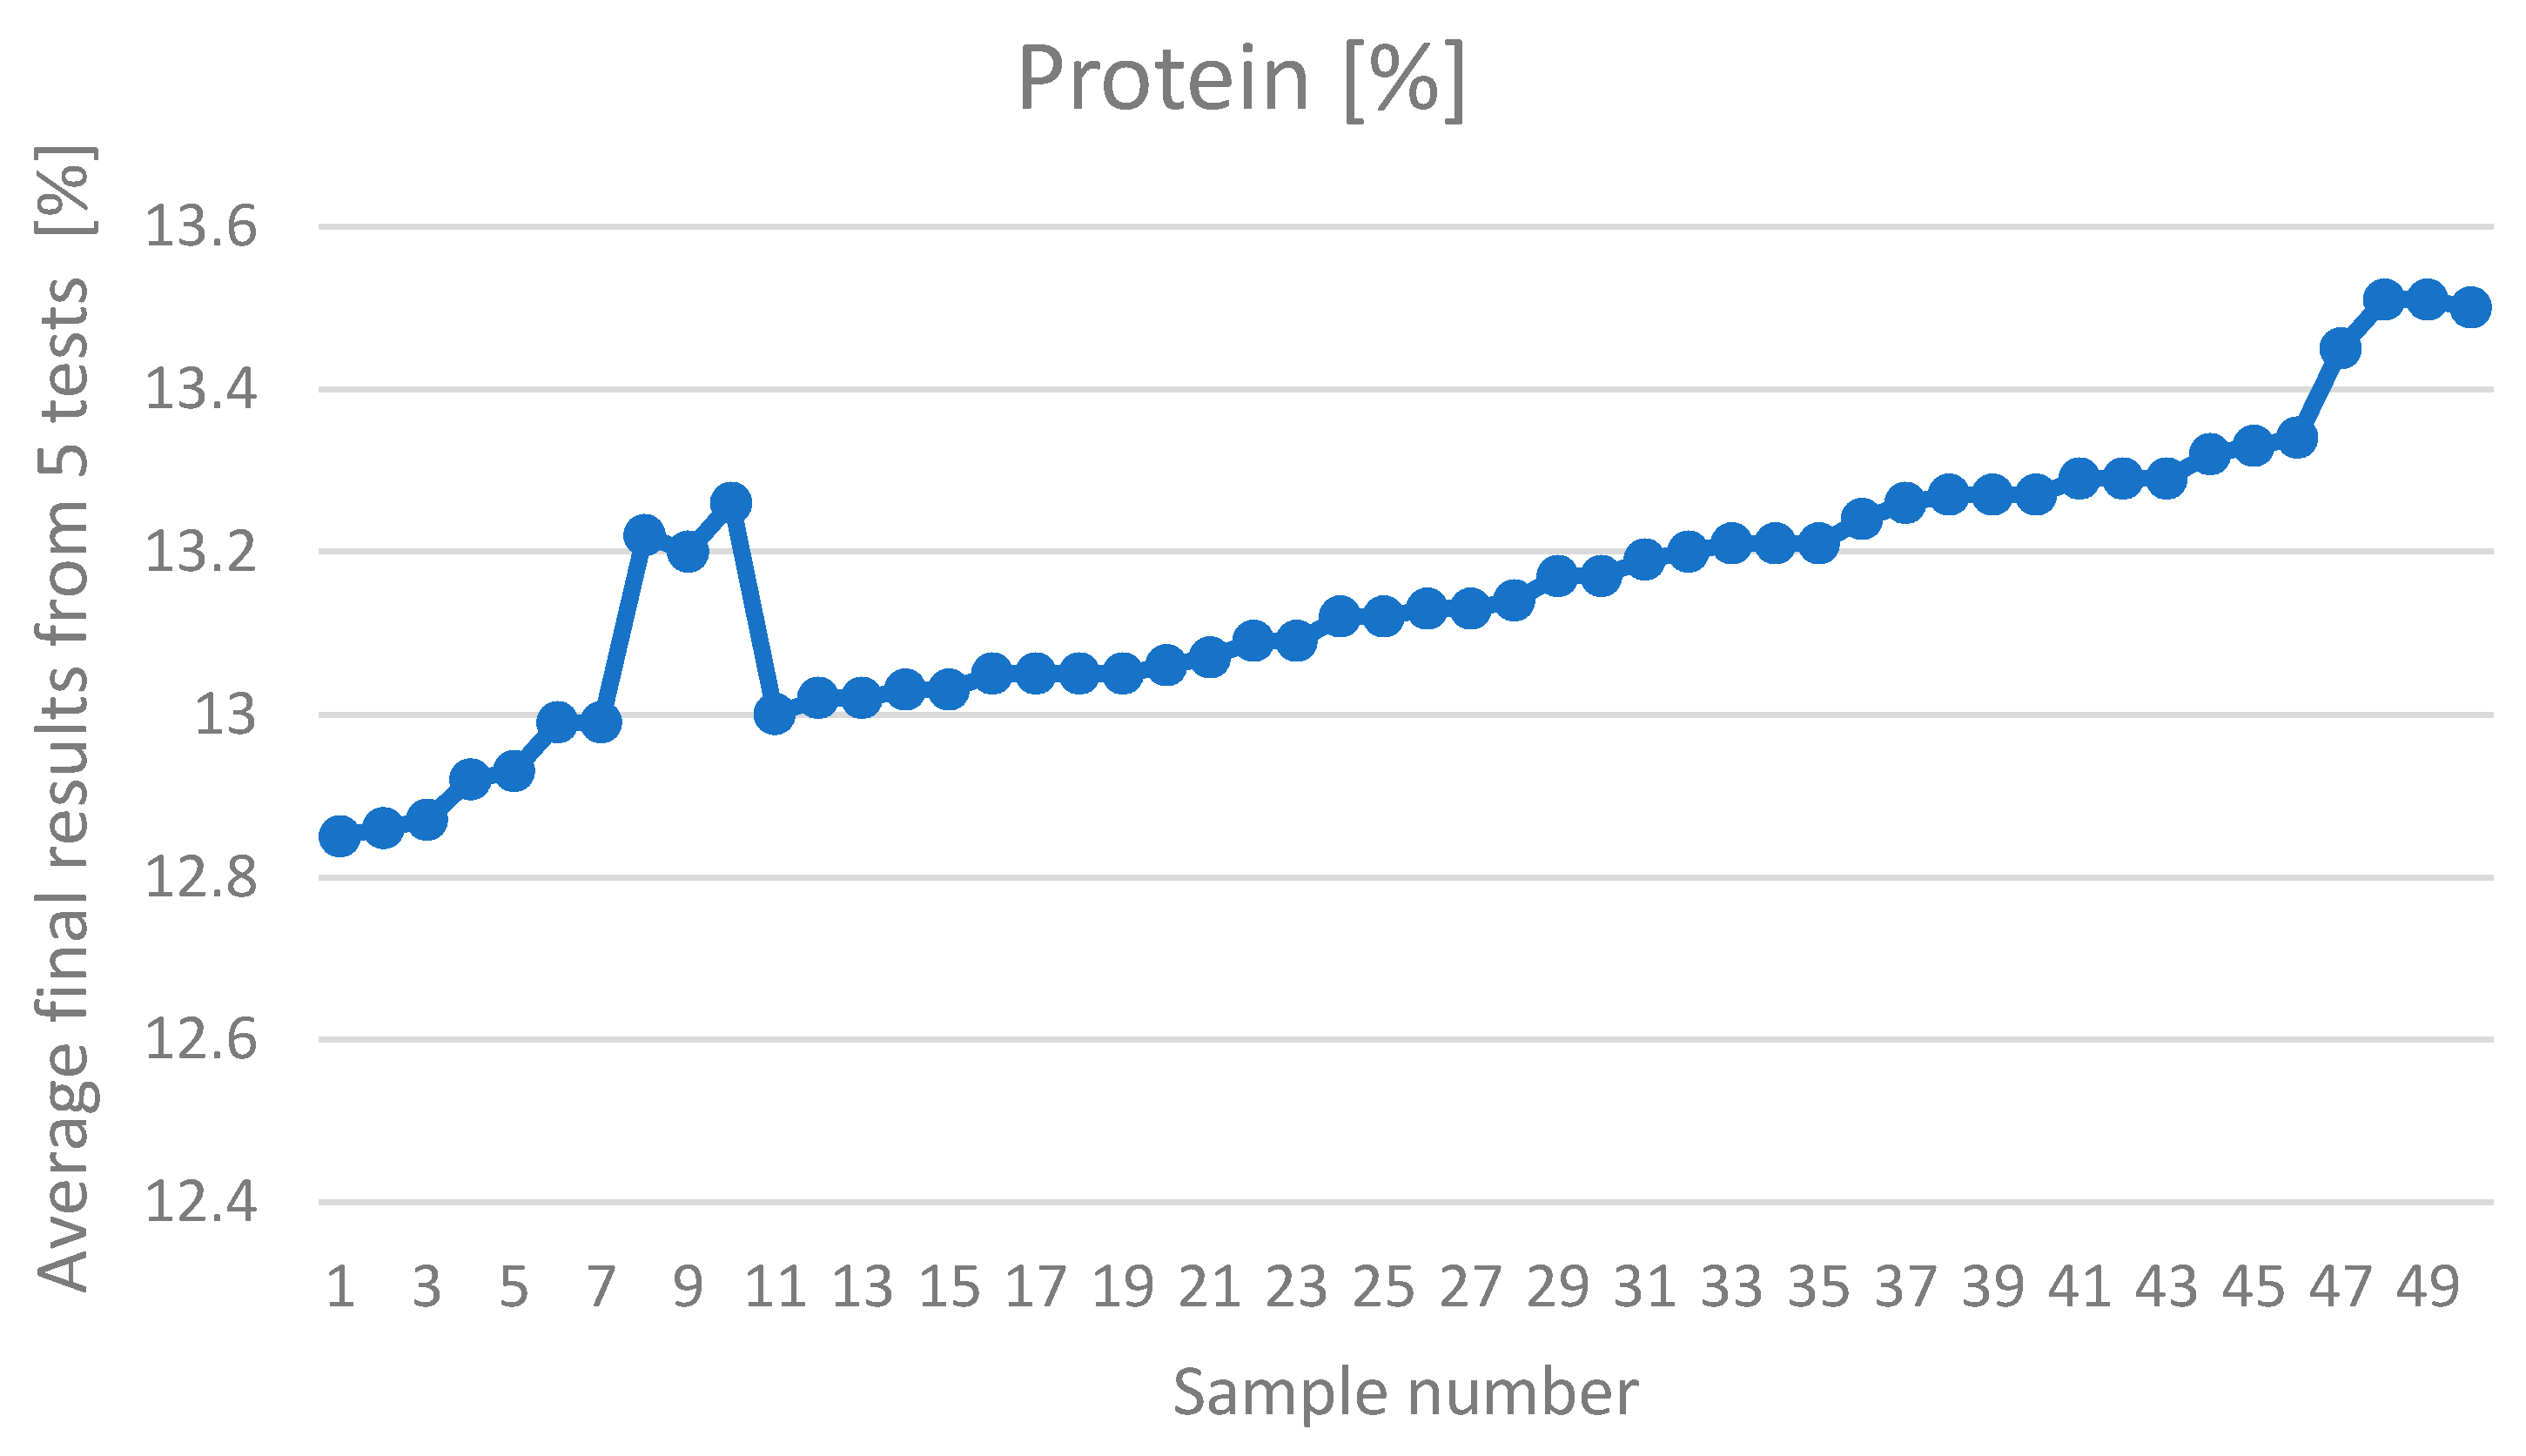
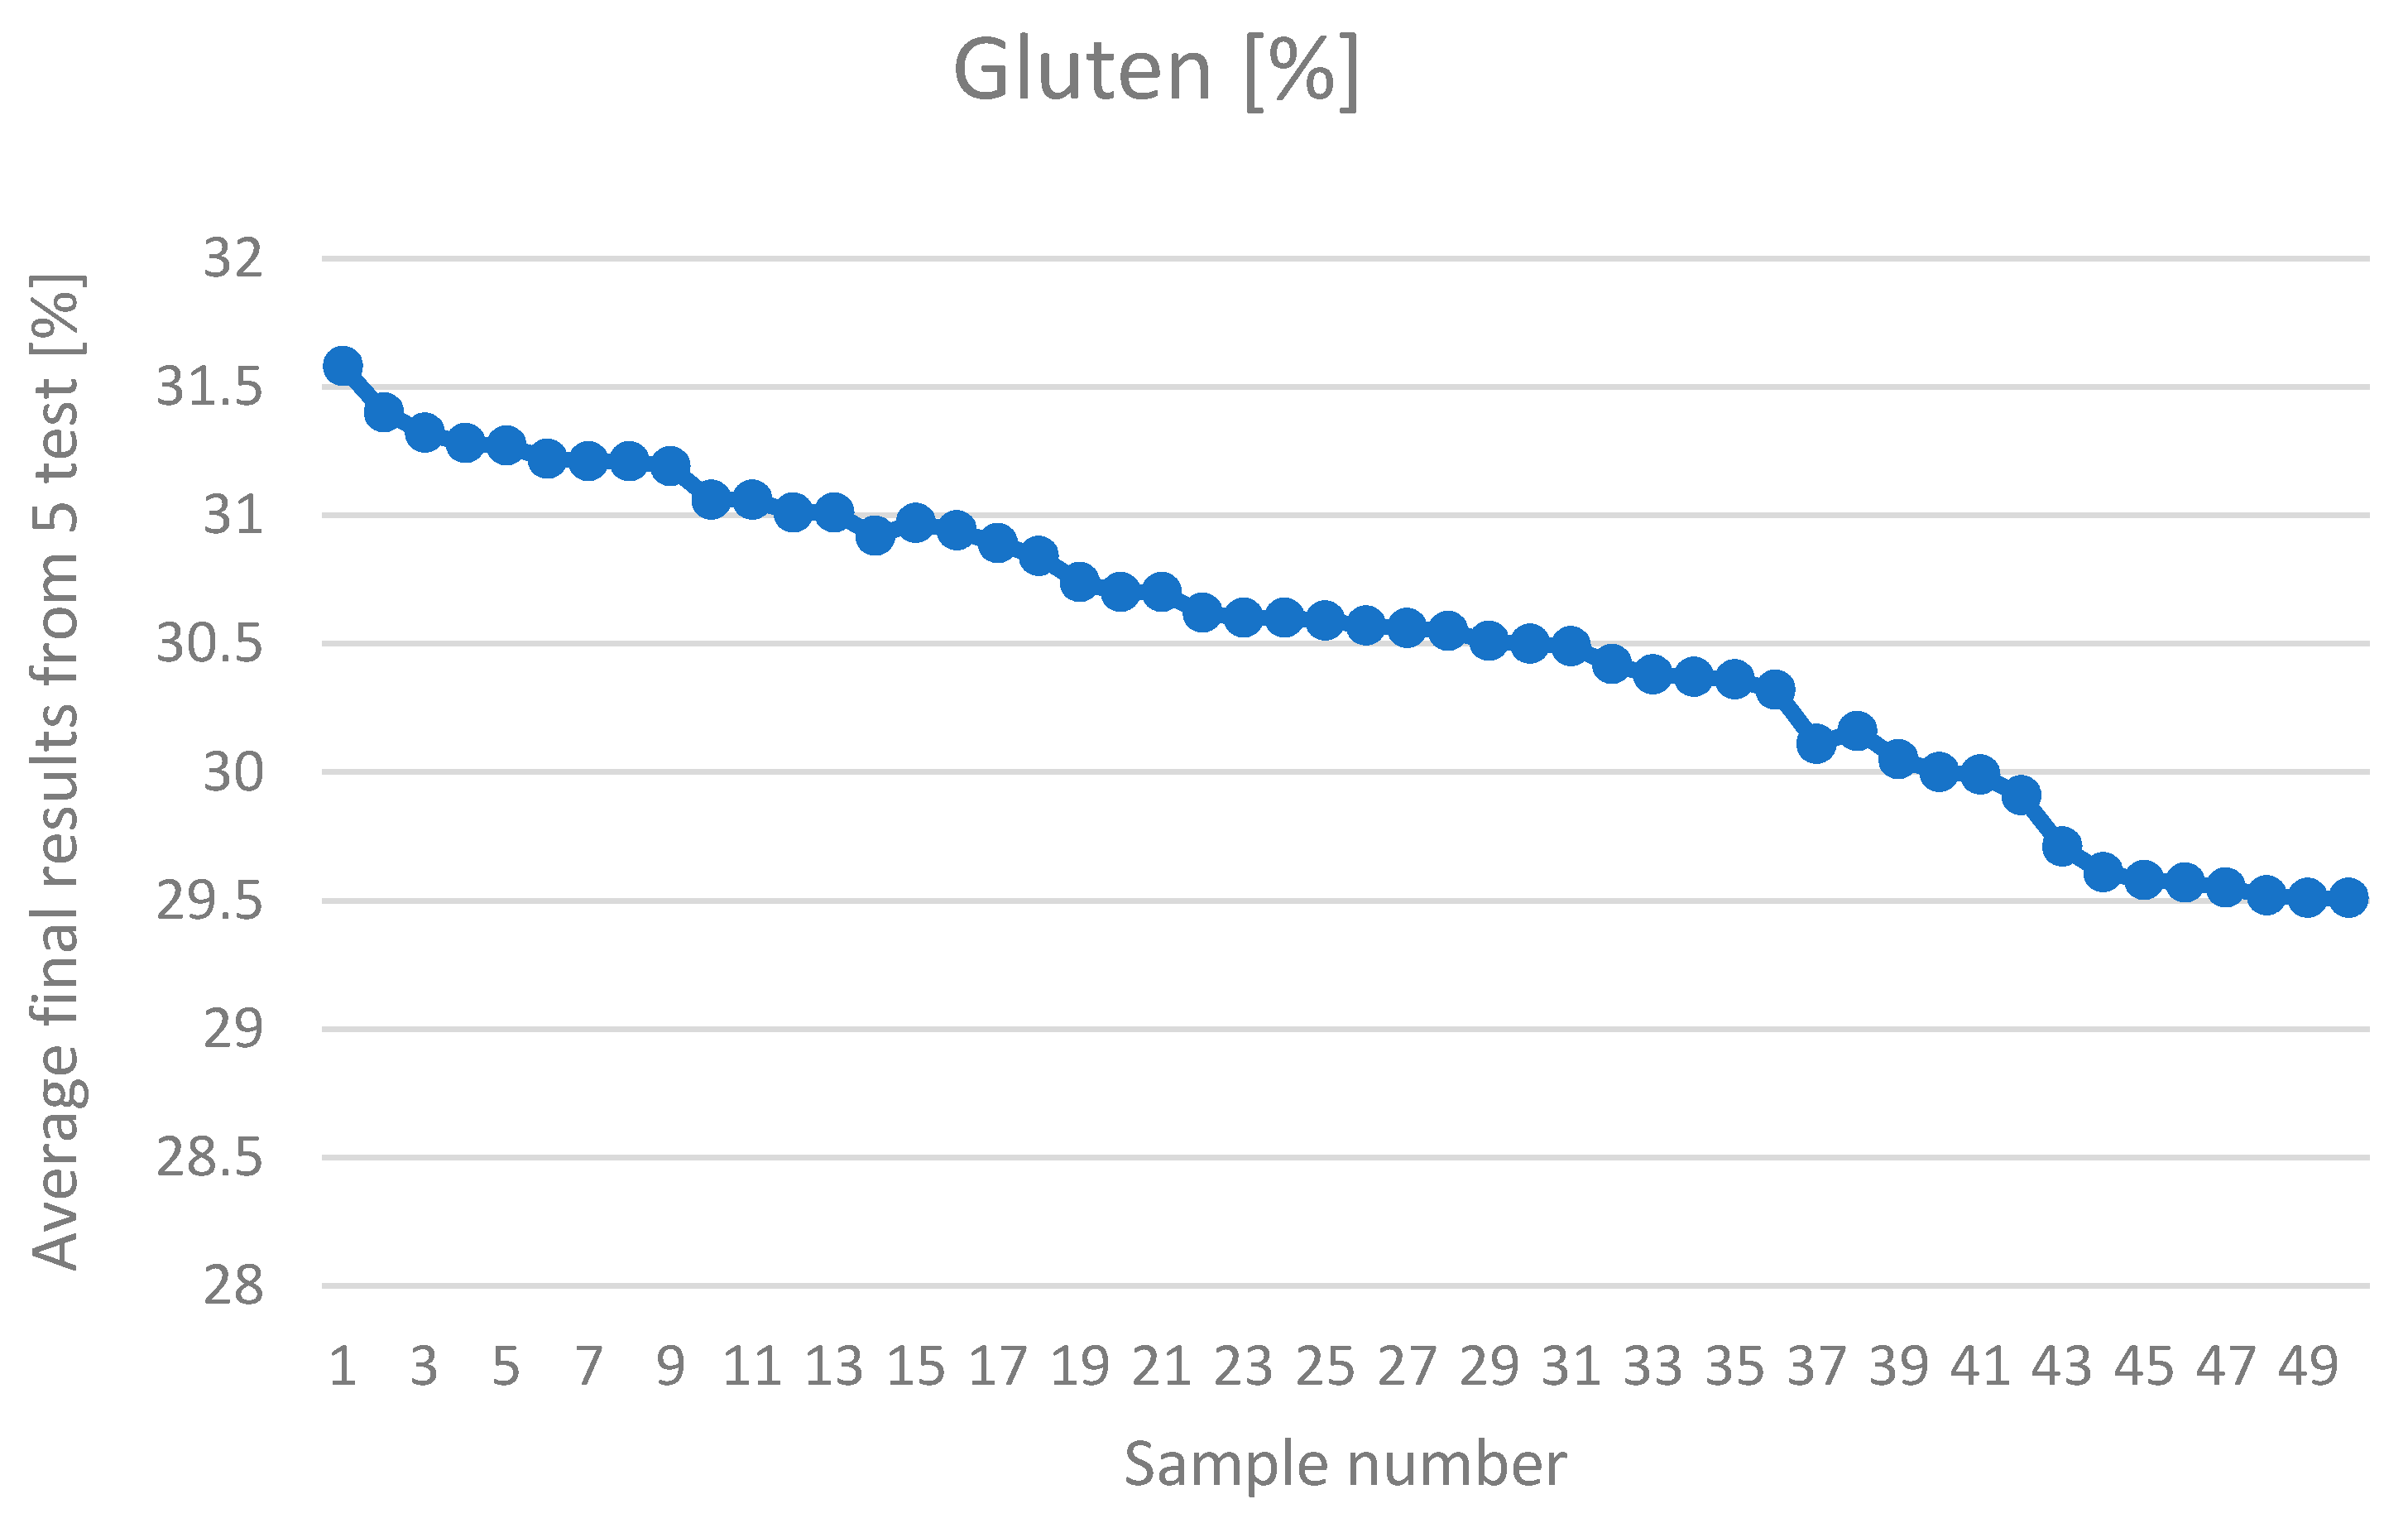
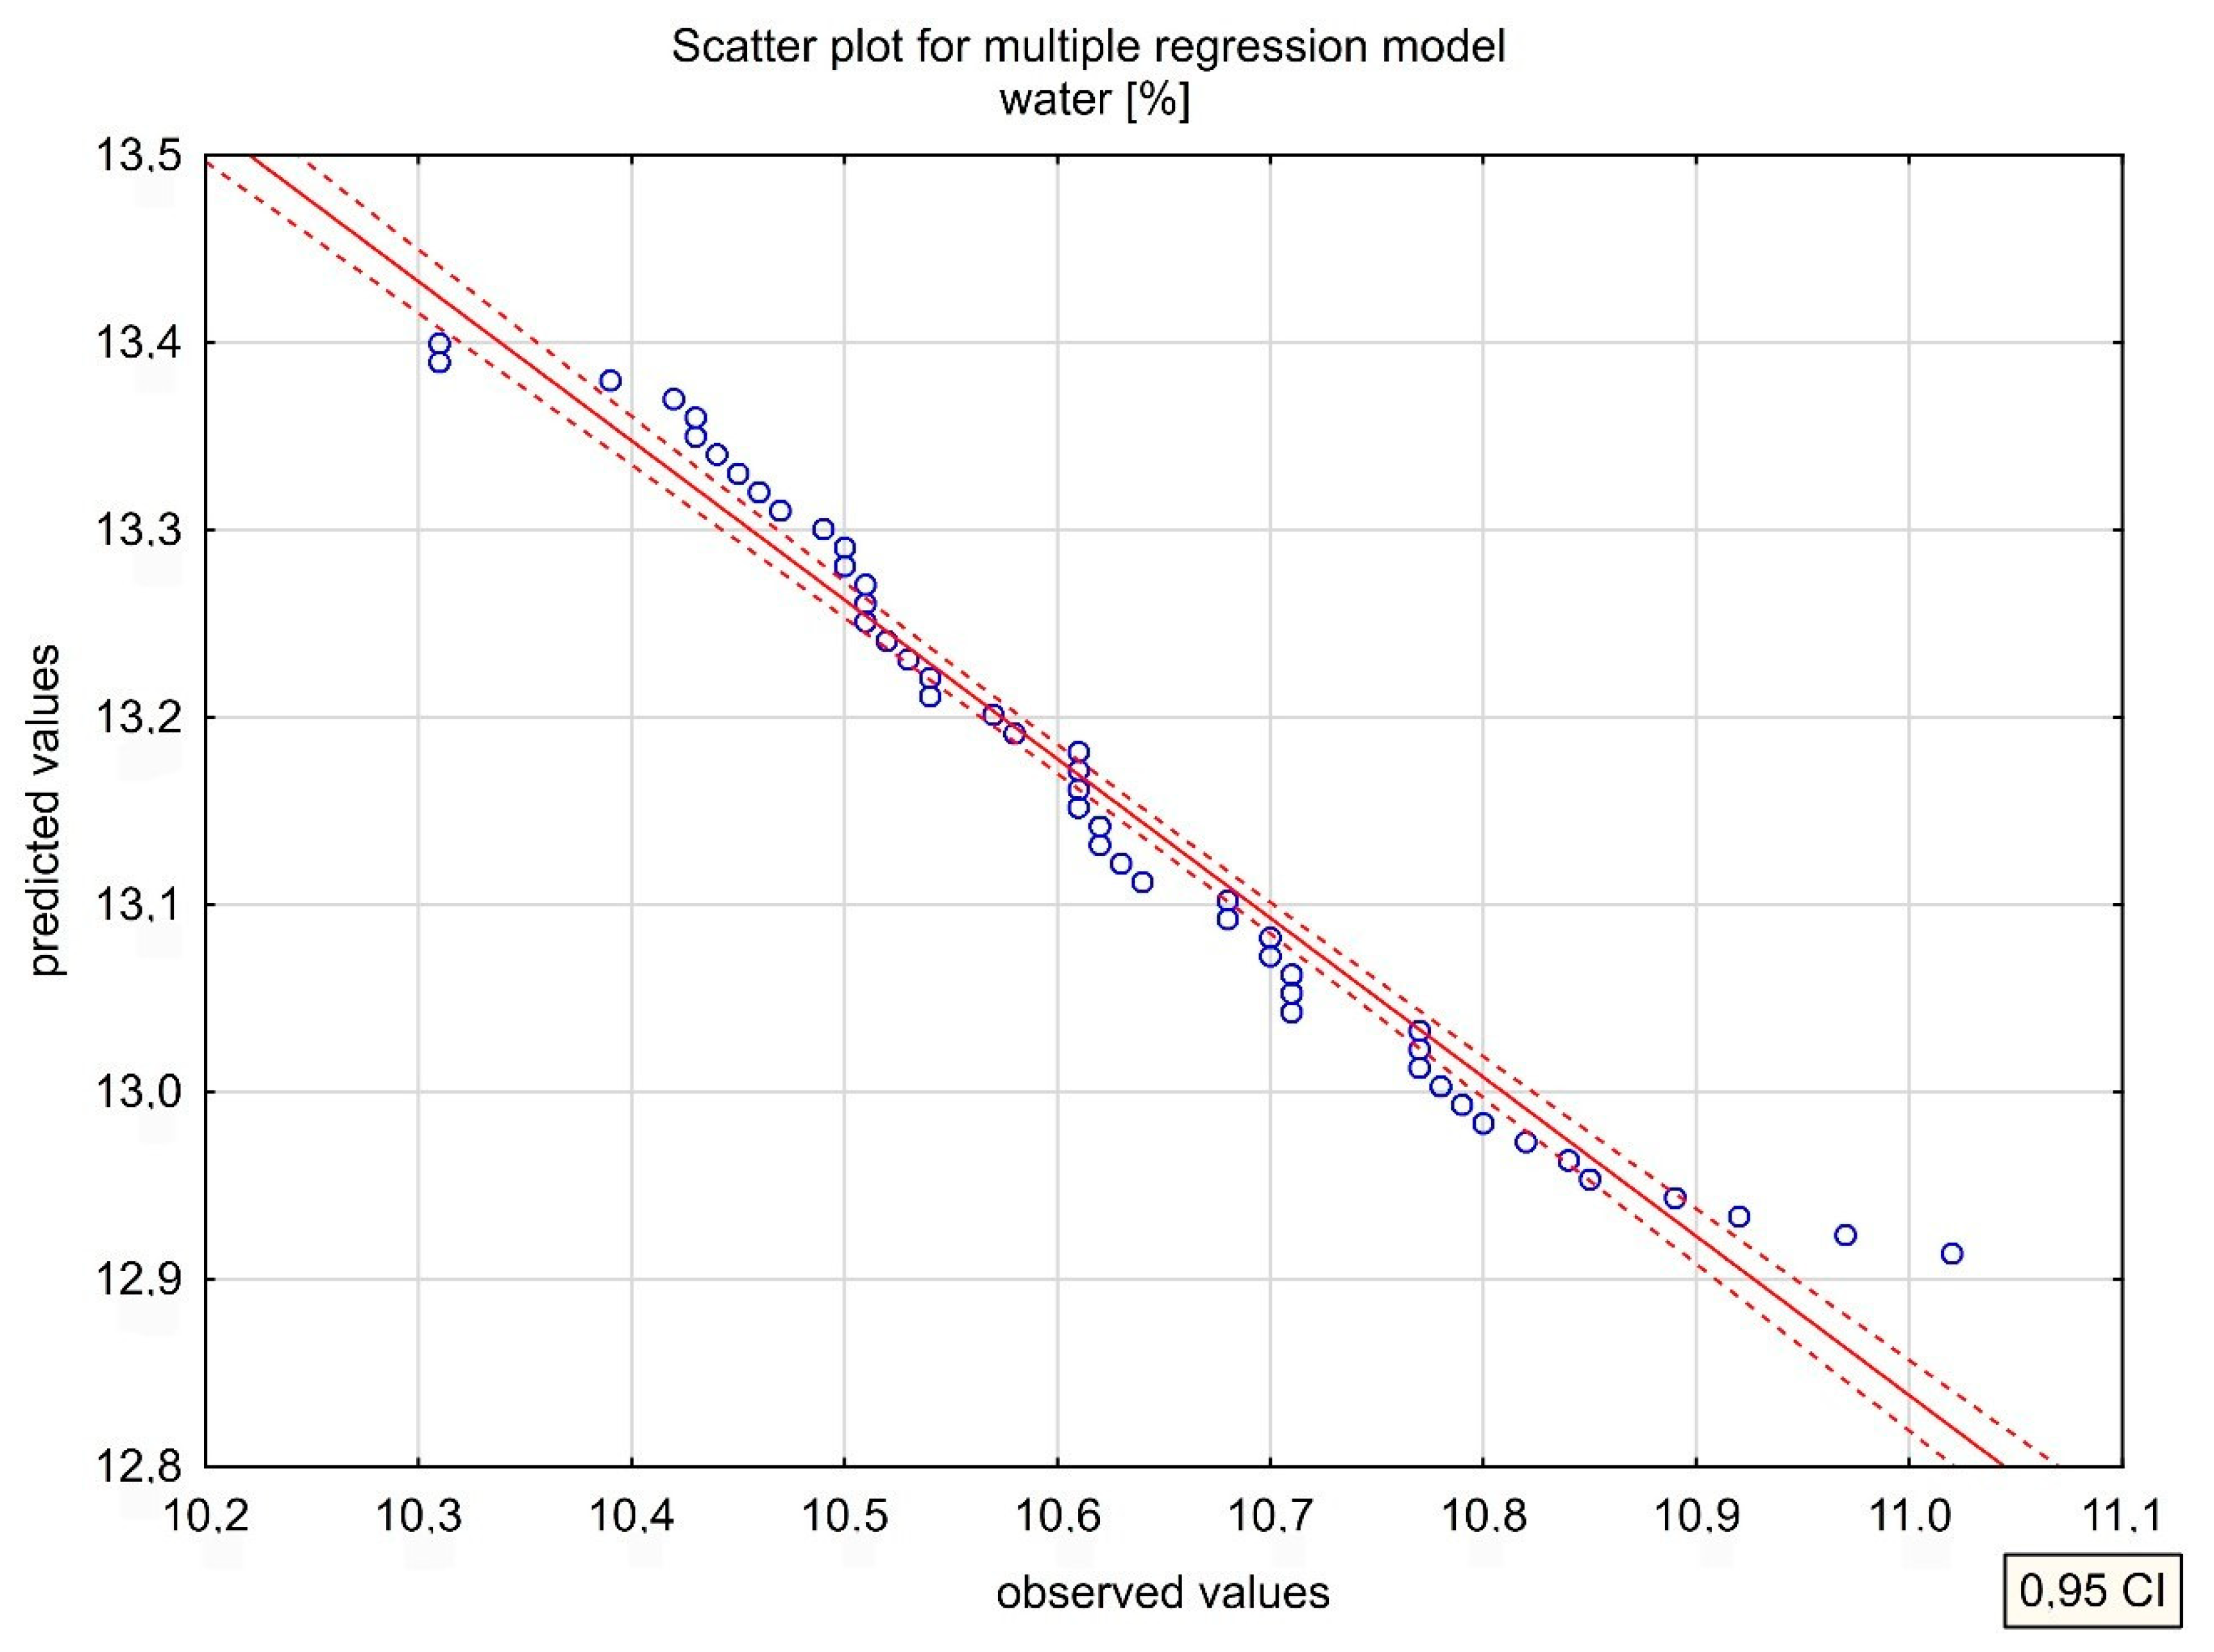
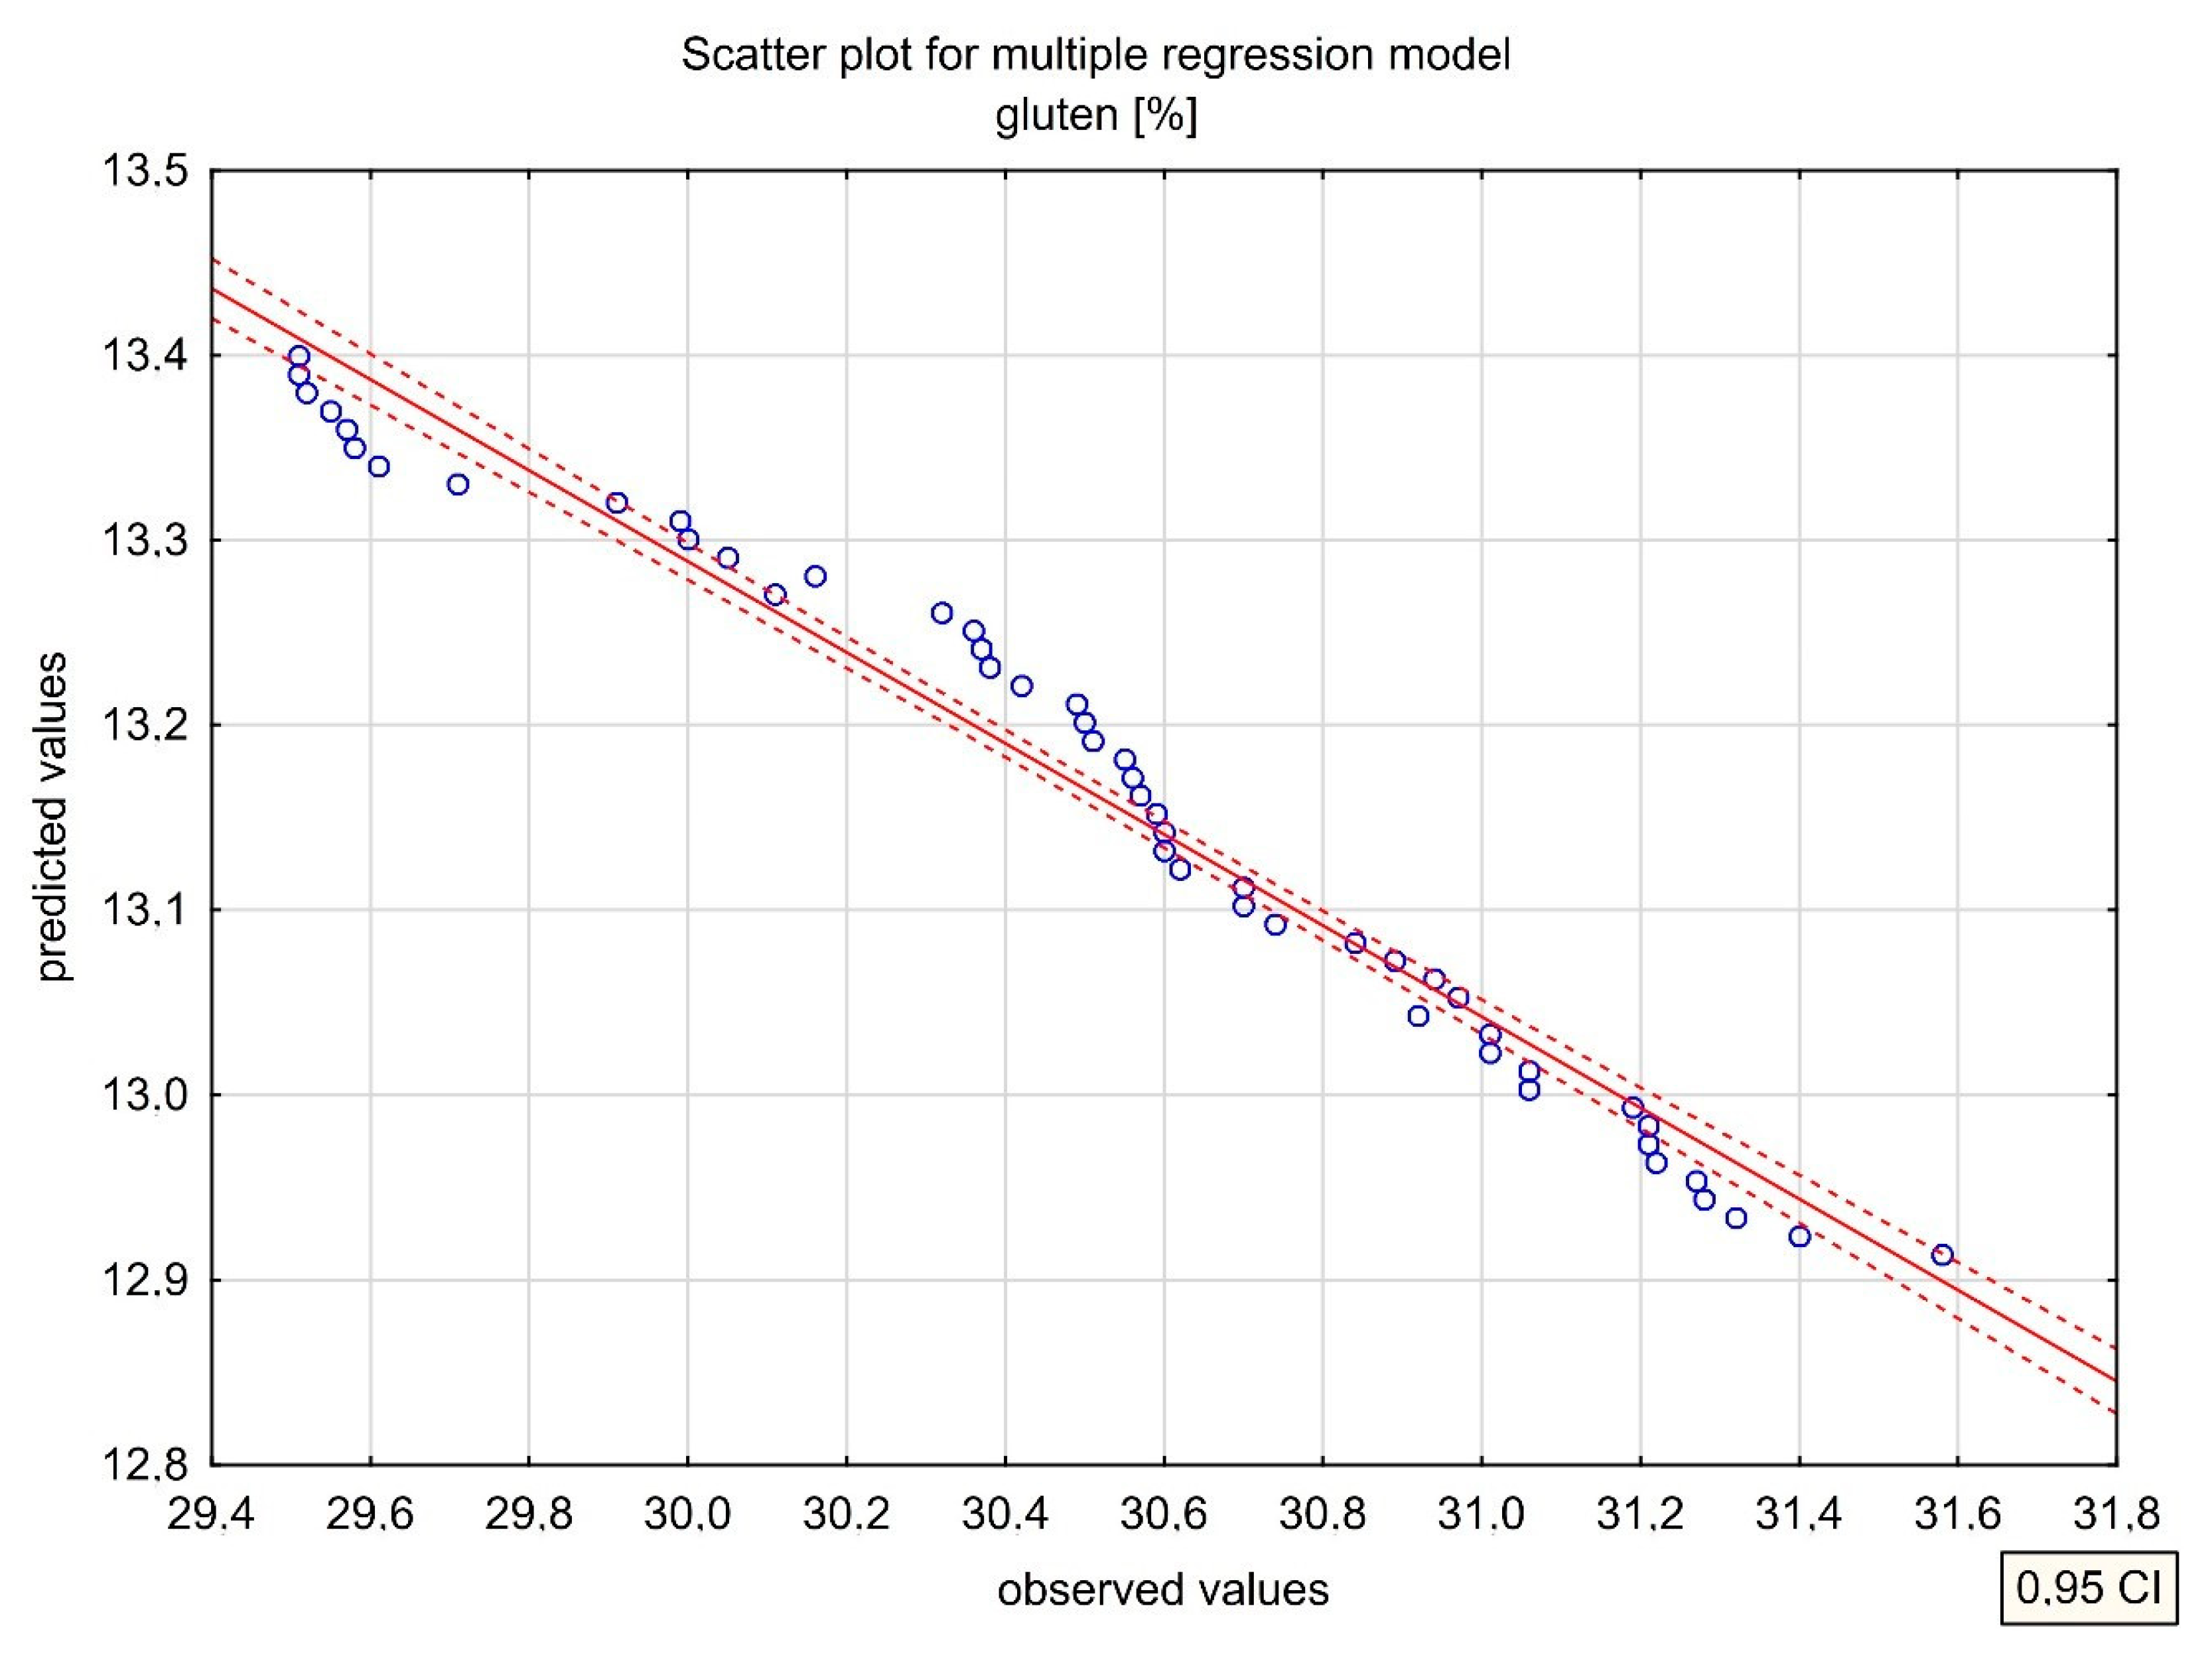
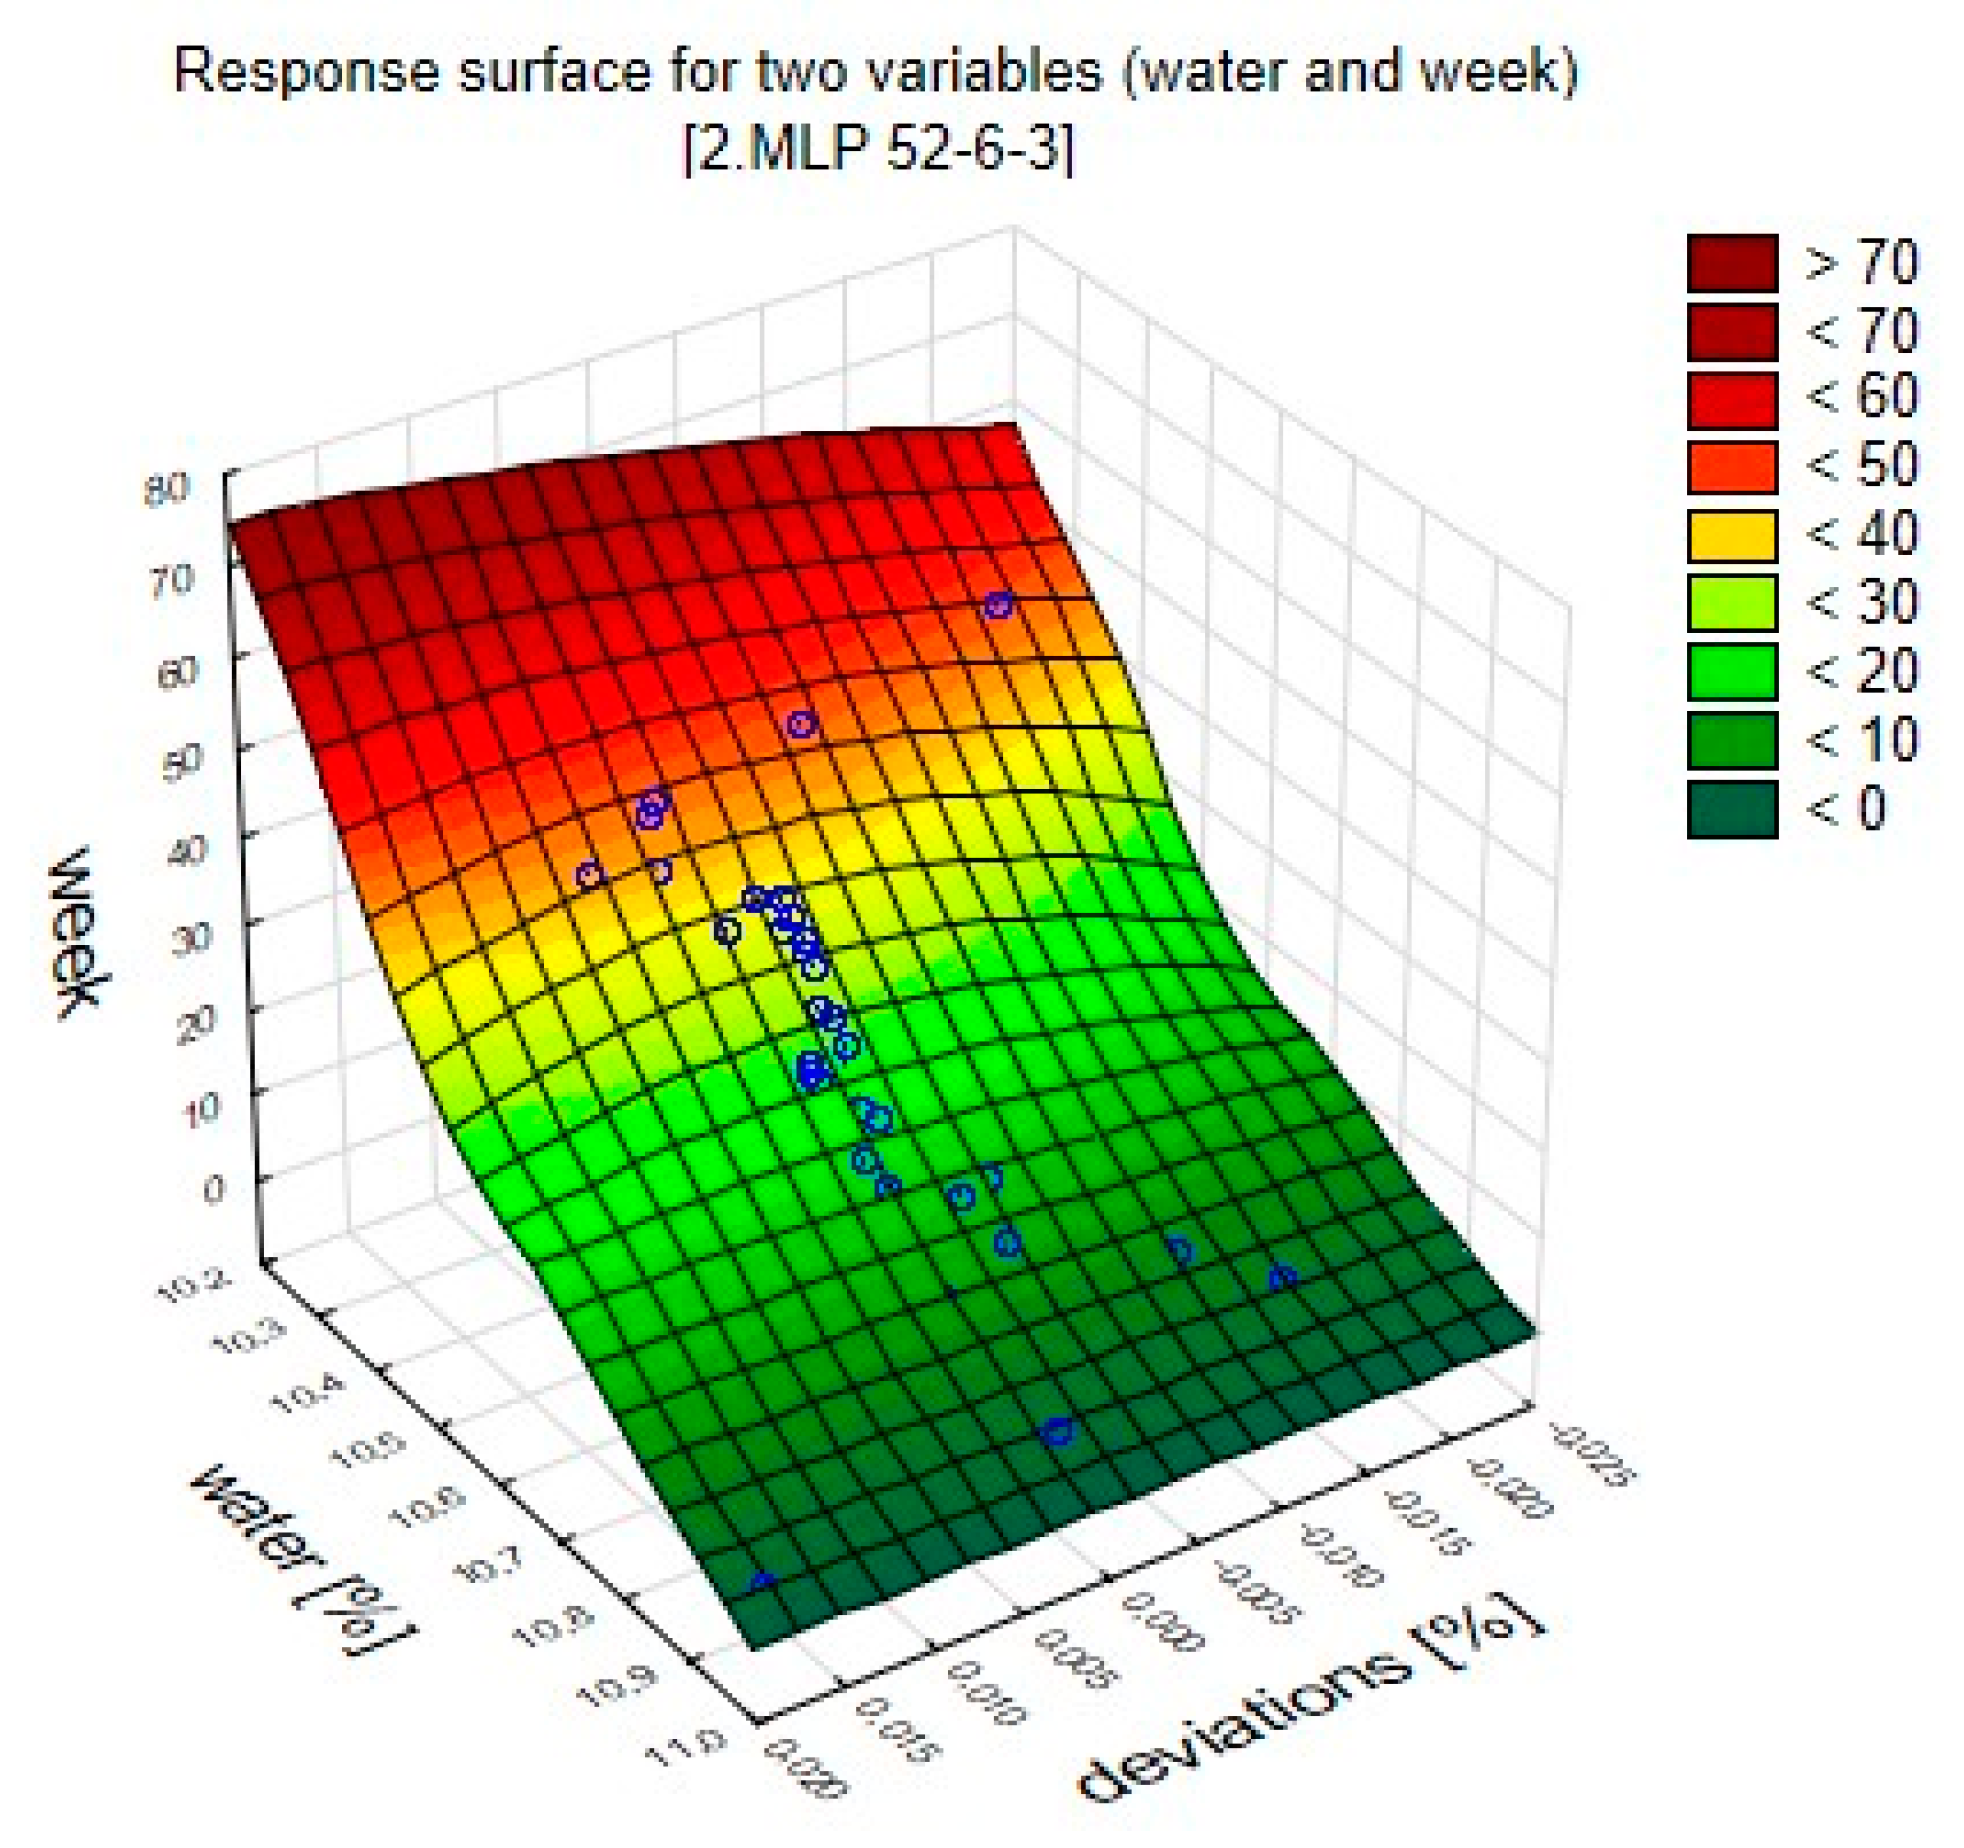
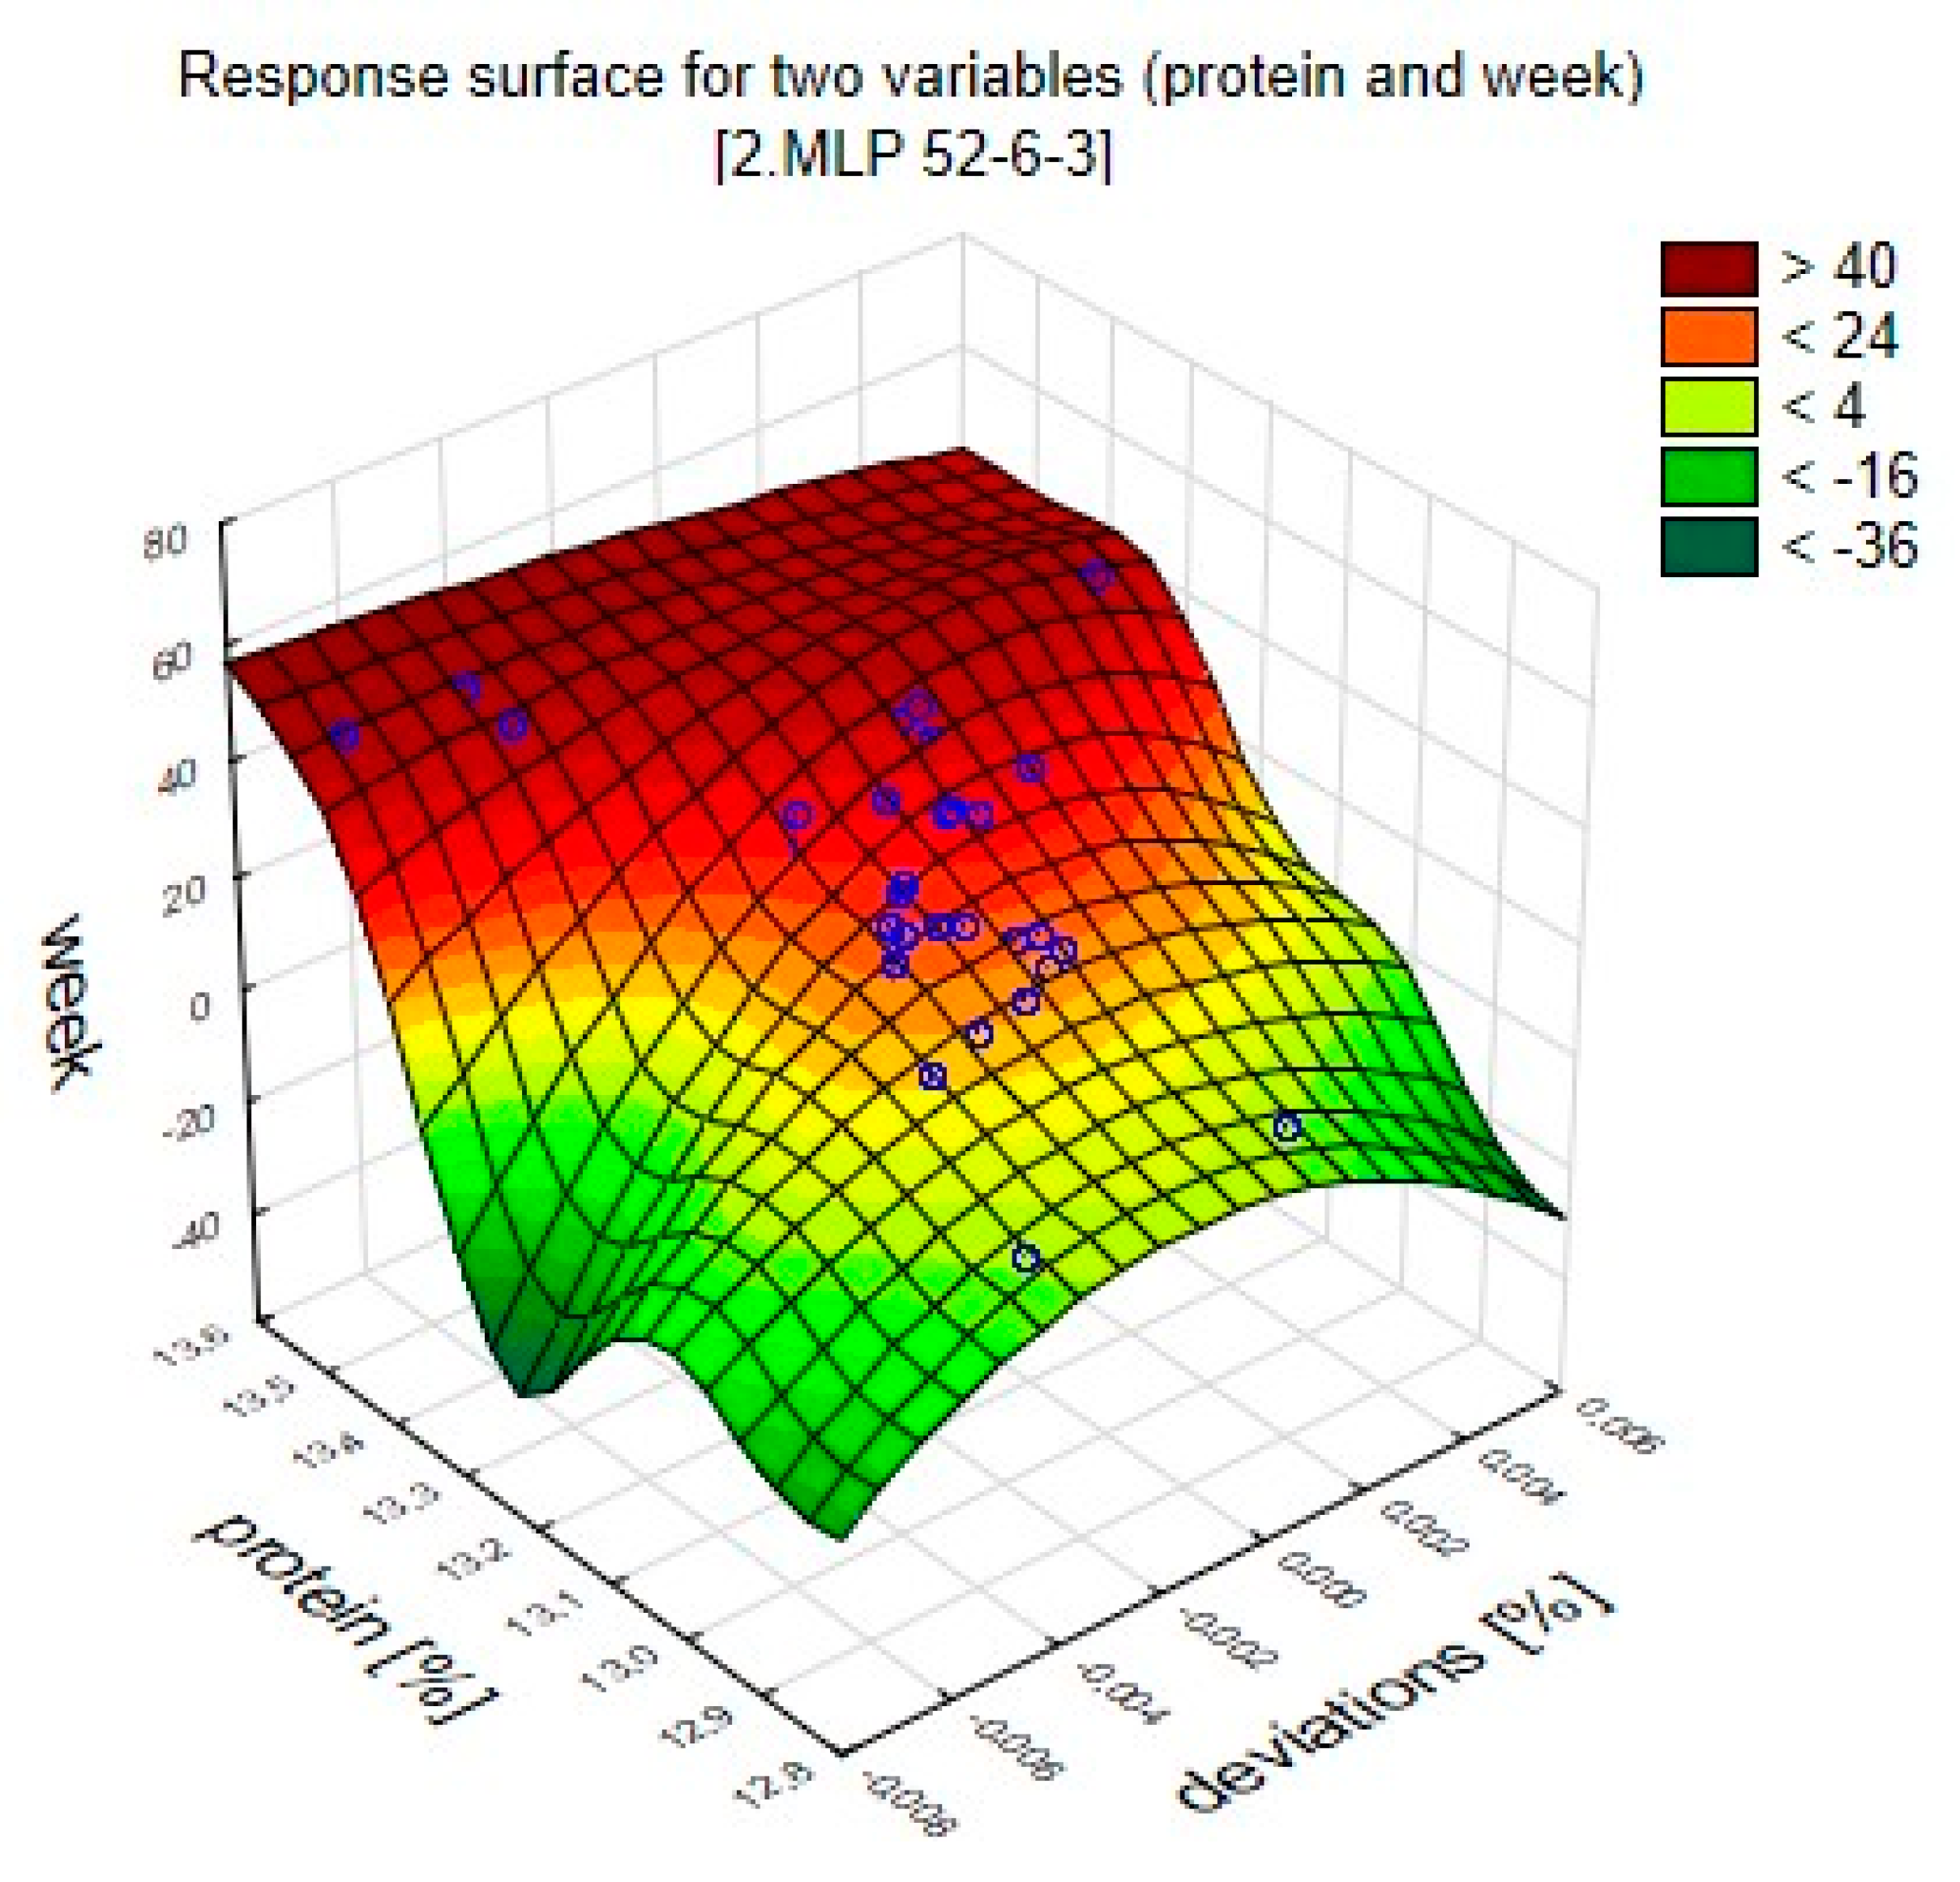
The research was carried out from 3 June to 30 December 2019 in grain warehouses on the premises of the production plant located in Brzeg municipal district, Opolskie Voivodeship. Quality wheat variety called “Patras”, which is winter wheat, was tested. Samples were taken twice a week at the same time intervals, every 3 days at 7:00 a.m. (Monday and Thursday). Fifty series of research were carried out. In each series, five samples were taken from a randomly selected batch of stored grain, and their average final score was obtained. In total, 250 results were analyzed. Wheat grain, which was stored in grain warehouses with a usable area of 1217.3 m2, 885 m2 and 1173 m2, was tested.
The weight of a single sample was 50 g, give or take 0.01 g. Samples were collected in accordance with the PN-EN ISO 24333:2009 standard, in which all variants of sampling in cereal material are included [32].
The samples were collected using a prototype multi-chamber probe with an overall length of 150 cm, which was equipped with a humidity and temperature sensor type AM2302 (Figure 1). The probe enables the acquisition of a representative cross-sectional sample at a depth of up to 120 cm and for the study of temperature and humidity in the intergranular space at a depth of about 100 cm. An ARDUINO programmable board with an AM2302 sensor was used to build the prototype. The sensor parameters were: sensor AM2302 (DHT22); supply voltage from 3.3 V to 5.5 V; module dimensions: 40 mm × 15 mm × 10 mm. The temperature measurement ranged from –40 °C to +80 °C, the resolution was 8 bits (0.1 °C), with an accuracy of ±0.5 °C. The measuring range of humidity was from 0% to 100% RH, resolution of 8 bits ±0.1% RH, with an accuracy of ±2% RH. The measurement was made according to the following procedure: connection of the probe to the control element, starting the device, putting the probe in the mass of grain, starting the measurement, the collection of grain, pulling the probe out of the mass of grain, pouring grain into the container, ending the measurement.
To determine the levels of protein, water and gluten content, the near-infrared spectrometry method was used using the Infratec 1241 grain analyzer by Foss Analytical (Hilleroed, Denmark) [33].
The analysis of cereals using the near-infrared technique is characterized by the highest accuracy for measurements in the transmission mode and not in the reflection mode [33]. Transmission measurements were performed in the wavelength range 570−1050 nm, while basic quality information in reflective measurements was obtained in the wavelength range 1100−2500 nm. Higher radiation energy in the wavelength range 570–1050 nm enables deeper penetration of particles by the measuring beam; not only their surface, but also the whole interior is covered by the measurement. This allows larger sample volumes to be used for transmission measurements, enabling greater representativeness of the analyzed samples. The obtained results were subjected to statistical analysis using the Statistica 13.1 package. The multiple linear regression (MLR) method was applied, on the basis of which statistical significance was analyzed and a graph of the scattering of observed values to predicted values was created. As a result of this analysis, it was confirmed that the analyzed data were not linear. Therefore, artificial neural networks were used for further analyses. It was assumed that under repeatability conditions the input value Xi is Q. For n statistically independent observations (n > 1), an estimator of the input value Q determined by x ¯ was the average value of single observations xj (j = 1, 2, 3, .... n). The standard uncertainty associated with the estimator x ¯ was determined by the probability distribution s2 (x) of xj expressed by the equation:
s 2 ( x ) = 1 n 1 j = 1 n ( x j x ¯   )
When planning the regression model, the correlation of individual quantities was previously examined based on the Pearson’s correlation. The model was built using the Multiple Regression module in Statistica 13.1, which gives access to the optimization of the model, among others, by using stepwise regression. This means that in the first step a standard regression was performed, as a result of which significant and statistically insignificant variables were indicated for a given model for the level of significance α = 0.05. If statistically insignificant variables are indicated, despite previous confirmation of the correlation, stepwise regression was applied. This ensured that only dependent variables were introduced to the model. In this case, backwards stepwise regression was applied, which initially assumes the introduction of all predictors and their stepwise removal from the model. The model fitting analysis was possible based on two coefficients: determination and F. The F (Fisher) test was carried out within the framework of the multiple regression module and served to assess the significance of the model by examining the ratio of variance estimates. The final assessment of model fitting was made on the basis of predicted and observed value charts.
The neural network wizard in Statistica 13.1 was used for neural modeling, which includes mainly multilayer perceptrons (MLPs). Networking is based on input, hidden and output layers. Each variable has its own input layer neuron. For the output layer, when using a neural network in the regression issue, there is only one neuron. Neurons of the hidden layer are involved in information processing. In addition to the correct classification of predictors to the individual layers, it is also important to divide the data set into learning, validation and testing data at a ratio of 70:15:15. One hundred networks were created in order to find the best fitting network, of which the top five were selected. To assess the quality of the network, the errors of the network were taken into account. These included the learning, validation and testing error. The most important figure is the learning error, as the network is adjusted to the learning cases. It is also important that other errors are compared in size and slightly larger than the learning error. For similar error values, the quality of the network is taken into account. A well-fitted network is characterized by a similar quality of responses to the learning and validation data.
In addition, a sensitivity analysis can be performed in neural networks. This process analyzes the input data to assess a rank of relevance, assigning them a degree of utility. In the case of Statistica 13.1, such analysis is performed automatically. The procedure assumes the presentation of network results in such a way that in subsequent repetitions the data will be converted into data gaps. When presenting data, the total error is calculated as in the case of standard learning. As a measure of sensitivity, we treated the quotient of the error obtained when starting the network without a variable and with a set of variables. If the result was greater than 1, this variable was important, and the greater the result of the variables, the greater its usefulness. If the result was equal to 1, removing the variable does not affect the result. On the other hand, in the case of values below 1, removing a variable may even improve the quality of the network.

3. Results

The average levels of protein, water and gluten are shown in Table 1 and the graphical interpretation is shown in Figure 2, Figure 3 and Figure 4.
The protein and gluten content of the analyzed wheat samples were within the standard (Table 1). In quality wheat, an amount of gluten less than 20% and a protein content less than 9.5% of dry matter indicate the suitability of the grain for the production of flour for certain confectionery products only. The minimum criterion of wheat grain suitability for the production of flour for bread-making purposes is the amount of gluten, at least 25%, and protein content, at least 11.5% of dry matter. The grain, which may play the role of the so-called “improving agent” in milling mixes with grain of medium or low baking value, should contain over 14% protein and show an amount of gluten higher than 30%. [4]. The gluten content in the grain tested ranged from 29 to 32%.
As can be seen in Figure 2, Figure 3 and Figure 4, the protein content of the tested wheat samples is more differentiated than that of gluten and water. The increase in protein content at the beginning of the measurements could result from the differences in harvesting, dominant weather conditions in the area and cultivation technology. In grain harvested from the field, post-harvest ripening processes take place. They are longer if the weather during the formation of protein and gluten is rainy. The optimum value of the grain is reached within about 6 weeks after harvesting. Cultivation technologies—medium-intensive and intensive—can also have a significant impact on the protein content of the grain [34]. In a further part of the study, the statistical analysis of protein, water and gluten content in the tested samples during storage in individual weeks was performed. Correlations between the data were examined in order to examine the variability of the content of three fractions during grain storage. The values show Pearson’s coefficient of linear correlation, and the results are collected in Table 2.
In order to generate a regression model, multiple regression was performed. Since all cases of correlation showed dependencies to their structure, they were all taken into account. However, the original regression model based on four variables showed variables that were statistically insignificant. The summary of regression modelling is presented in Table 3.
Thus, the multiple stepwise backward regression method was applied to eliminate the insignificant variable. A summary of the regression model using the backwards stepwise regression method is presented in Table 4.
On the basis of the two models, the increase in Fisher’s test parameter F is also worth noting from 1044.2 for four parameters (degree of freedom = 3) to 1559.4 for three parameters (degree of freedom = 2). A higher parameter value means a better model fit. In order to examine whether this is not a falsely high correlation, the data were checked on the basis of a graph of predicted values from those observed for the multiple regression model (Figure 5 and Figure 6). As you can see, there are deviations that suggest that despite the high regression coefficient this model is not correct.
As mentioned in the Materials and Methods section, the final evaluation of the models, obtained on the basis of multiple regressions, will take place on the basis of graphs. Due to the occurring deviations, an attempt was made to create a non-deterministic model based on neural networks. To generate neural networks, the data were remodeled: output data for each of the three characteristics describing water, protein and gluten content were added, depending on the week. This means that the initial value of k-week was the final value of (k-1)-week. Due to the properties of the network, it was decided not to exclude protein despite the results of earlier modeling with multiple regression, because the influence of this variable, in the case of a non-deterministic model, could be significant. Eventually, the data were divided into three types:
  • Qualitative input: week;
  • Quantitative input: water, protein, gluten;
  • Quantitative output: water output, protein output, gluten output.
Table 5 shows the learning parameters of five selected networks.
On the basis of the obtained correlation coefficients between the given values and quality of learning, the second neural network of MLP 52-6-3 was selected. This network was characterized by the highest quality values: learning, 0.999; testing, 0.978; and validation, 0.948. Moreover, it had good values of errors: learning, below 0.001; testing, 0.015; and validation, 0.008.
On the basis of the generated MLP 52-6-3 network, the changes of water, protein and gluten content in wheat during storage are graphically presented in Figure 7, Figure 8 and Figure 9.
As mentioned in the Materials and Methods section, it is also important to determine the sensitivity of the network. In Statistica software, the network sensitivity analysis is performed automatically. For the MLP 52-6-3 network, the following sensitivity values were obtained for individual data (Table 6).
Thus, the significance of all the variables in the model was also demonstrated, as no value of the error quotient was less than or equal to 1.

4. Discussion

On the basis of the conducted tests, we can conclude that the water, protein and gluten content of wheat during storage was within the standard. The statistical analysis and neural modeling did not show significant change in water, protein, and gluten content during wheat storage. The generated neural network MLP 52-6-3 satisfactorily described changes in water, protein and gluten content in wheat during storage. Moreover, it had good values of errors: learning, below 0.001; testing, 0.015; and validation, 0.008. In their study, Niedbała et al. also stated that the use of artificial neural networks for predicting yield in winter rapeseed was satisfactory [35]. According to the authors, the network that turned out to be appropriate for predicting was the MLP 21:21-13-6-1:1, characterized by a learning error of 0.07376, testing of 0.08536 and validation of 0.07346 [36]. A correctly constructed predictive model should correctly describe the analyzed phenomenon [28], which means that the model should be similar to the tested empirical system. Therefore, the common problem is to choose an appropriate neural network topology for a given problem, which most often takes place by reviewing many variants of network topology. For predictive applications, the MLP network is the most commonly used. [37,38,39,40]. In wheat and flour processing, quality control requires fast analytical tools to predict physical, rheological and chemical properties. Mutlu et al. [41,42,43] used near infrared spectrometry (NIR) combined with an artificial neural network to predict flour quality parameters such as the protein content, moisture content, Zeleny sedimentation, water absorption, dough development time, dough stability time, dough softening degree, tenacity, extensibility, strength and baking test (loaf volume and weight) [41]. In total, 79 flour samples of different wheat cultivars grown in different regions of Turkey were subjected to chemical analysis and the results of both NIR spectrum (400–2498 nm) and chemical analysis were used for training/testing the network using different ANN architectures. The results obtained gave also very good accuracy with the coefficient of determination (R2) from 0.83 to 0.952, respectively. The results indicate that NIR in combination with ANN can be successfully used for forecasting wheat flour quality parameters [41]. Studies on wheat quality indicators also point out to a significant correlation between protein and gluten content during storage. However, an attempt to apply linear multiple regression for the results obtained in the study showed that this relation cannot be treated as linear. The neural network that was chosen to describe the regression model is characterized by good parameters. The learning error, which for the selected network was the lowest and amounted to 0.001, was taken into account. This network was also characterized by very similar values of validation and test errors, which were 0.008 and 0.015, respectively. As the value of errors of other networks were comparable, for the purpose of the evaluation of the network, the quality of responses to the learning and validation data was also taken into account. The smallest difference in these two types of quality was shown by the previously selected MLP 52-6-3 neural network. This means that this network shows the best fit, which is also confirmed by the graphs showing the response surface of individual variables. In the studies of Mao et al. [44] on wheat protein content, the algorithm of near infrared reflection and the RBF (Radial Basis Function) algorithm of neural networks were applied [44]. This method was used due to its high speed and better efficiency compared to the traditional method. The algorithm was proposed to optimize the concentration of data in hidden layers of the RBF neural network. The experimental analysis showed that the improved algorithm significantly reduced the complexity of the network and improved the quality and learning speed of RBF networks [14]. Since there are no studies on the modeling of proteins in plant material during processing, Pietsch et al. [9] made attempts at neural modeling. They found that the forecasting of gluten behavior using neural modelling is more accurate than that resulting from isothermal modelling. The RBF neural network is a type of feedback network that is widely used because of its strong global optimization capacity and good generalization ability. Therefore, in studies, NIR’s and RBF neural networks were combined to establish a predictive model for wheat protein measurement [45,46]. In real applications, the number of cluster centers in hidden layers of the RBF neural network and the output mass value have a large impact on the performance of the RBF neural network, so establishing the exact number of cluster centers in hidden layers is crucial, and the wrong choice of the number can easily lead to a “curse of dimensionality” [47]. However, so far, there are no effective methods for the theoretical calculation of the optimal number of clusters, so this value can be only obtained by several experiments. To some extent, this increases the difficulty of using the RBF neural network and limits the widespread use of the RBF neural network in practice.

5. Conclusions

On the basis of the research and neural modelling, it can be concluded that the water (10.63 ± 0.16), protein (13.13 ± 0.15) and gluten (30.56 ± 0.54) contents in wheat samples were within the standard. The results of the protein content determination were characterized by greater variability than the results of the gluten and water content. The obtained correlation results do not indicate a statistically significant relationship between the protein, water and gluten content during storage. The application of artificial neural networks made it possible to determine changes in the content of water, protein and gluten in wheat during storage. The network suitable for forecasting is the MLP 52-6-3 type network with good error values: learning, below 0.001; testing, 0.015; and validation, 0.008. All input variables used in the model were shown to be significant due to the fact that no error quotient value was lower than or equal to 1. The proposed system of sampling with a multi-chamber probe enabled correct sampling. The modality of the result interpretation is essential for the storage industry. Currently, there is a constant need to search for new solutions allowing for the fast evaluation of the selected quality parameters of stored grain. Obtaining information about the quality of stored grain will allow rapid reaction in the case of a threat related to lowering the quality parameters of the stored grain. The proposed method can be successfully applied in companies purchasing and storing wheat and allows for a rapid assessment of the selected quality parameters of stored grain, enabling the control of different Triticum species.

Author Contributions

All authors contributed equally to this work.

Funding

This research received no external funding.

Conflicts of Interest

The authors declare no conflict of interest.

References

  1. Godfray, H.C.J.; Beddington, J.R.; Crute, I.R.; Haddad, L.; Lawrence, D.; Muir, J.F.; Pretty, J.; Robinson, S.; Thomas, S.M.; Toulmin, C. Food Security: The Challenge of Feeding 9 Billion People. Science 2010, 327, 812–818. [Google Scholar] [CrossRef] [PubMed] [Green Version]
  2. Cappelli, A.; Cini, E.; Lorini, C.; Oliva, N.; Bonaccorsi, G. Insects as food: A review on risks assessments of Tenebrionidae and Gryllidae in relation to a first machines and plants development. Food Control 2020, 108, 106877. [Google Scholar] [CrossRef]
  3. Alexandratos, N.; Bruinsma, J. World Agriculture Towards 2030/2050: The 2012 Revision; ESA Working paper No. 12-03; FAO: Rome, Italy, 2012. [Google Scholar]
  4. Bourne, M.C. Post Harvest Food Losses-The Neglected Dimension In Increasing The World Food Supply. (Cornell International Agriculture Mimeograph 53); New York State College of Agriculture and Life Sciences, Cornell University: Ithaca, NY, USA, 1977. [Google Scholar]
  5. Greeley, M. Food, technology and employment: The farm-level post-harvest system in developing countries. J. Agric. Econ. 1986, 37, 333–347. [Google Scholar] [CrossRef]
  6. Kitinoja, L.; Saran, S.; Roy, S.K.; Kader, A.A. Postharvest technology for developing countries: Challenges and opportunities in research, outreach and advocacy. J. Sci. Food Agric. 2011, 91, 597–603. [Google Scholar] [CrossRef]
  7. Pantenius, C.U. Storage Losses in Traditional Maize Granaries in Togo. Int. J. Trop. Insect Sci. 1988, 9, 725–735. [Google Scholar] [CrossRef]
  8. Bucklin, R.; Thompson, S.; Montross, M.; Abdel-Hadi, A. Grain Storage Systems Design. In Handbook of Farm, Dairy and Food Machinery Engineering; Elsevier: Amsterdam, The Netherlands, 2013; pp. 123–175. [Google Scholar]
  9. Pietsch, V.L.; Schöffel, F.; Rädle, M.; Karbstein, H.P.; Emin, M.A. High moisture extrusion of wheat gluten: Modeling of the polymerization behavior in the screw section of the extrusion process. J. Food Eng. 2019, 246, 67–74. [Google Scholar] [CrossRef]
  10. Grain Storage and Healthy Storage Conditions. Available online: https://www.millermagazine.com/english/grain-storage-and-healthy-storage-conditions (accessed on 10 January 2020).
  11. Said, P.; Pradhan, R. Food Grain Storage Practices-A Review. J. GRAIN Process. 2014, 1, 1–5. [Google Scholar]
  12. Ngamo, L.; Martin, N.; Mapongmestsem, P.; Malaisse, F.; Haubruge, E.; Lognay, G.; Hance, T. Current Post Harvest Practices to Avoid Insect Attacks on Stored Grains in Northern Cameroon. Agric. J. 2007, 2, 242–247. [Google Scholar]
  13. Tüfekçi, S. Effects of Storage Systems on Grain Quality. Available online: https://www.millermagazine.com/80/index.html (accessed on 10 January 2020).
  14. Mishra, A.; Prabuthas, P.; Mishra, H.N. Grain storage: Methods and measurements. Qual. Assur. Saf. Crop. Foods 2012, 4, 144. [Google Scholar] [CrossRef]
  15. Mrema, G.C.; Gumbe, L.O.; Chepete, H.J.; Agullo, J.O. Grain Crop Drying, Handling and Storage. In Rural Structures in the Tropics: Design and Development; FAO: Rome, Italy, 2011; pp. 363–411. [Google Scholar]
  16. Cappelli, A.; Canessa, J.; Cini, E. Effects of CO2 snow addition during kneading on thermoregulation, dough rheological properties, and bread characteristics: A focus on ancient and modern wheat cultivars. Int. J. Refrig. 2020, 117, 52–60. [Google Scholar] [CrossRef]
  17. Boyacioglu, M.H.; D’Appolonia, B.L. Durum wheat and bread products. Cereal Foods World 1994, 39, 168–174. [Google Scholar]
  18. Shewry, P.R.; Hey, S.J. The contribution of wheat to human diet and health. Food Energy Secur. 2015, 4, 178–202. [Google Scholar] [CrossRef] [PubMed]
  19. Singh, S.S. Wheat production in India and Future prospects. In Proceedings of the 8th International wheat Conference, Petersburg, Russia, 18 June 2010. [Google Scholar]
  20. Food and Agriculture Organization of the United Nations (FAO). FAOSTAT Online Statistical Service. 2019. Available online: http://faostat.fao.org (accessed on 10 January 2020).
  21. Sawant, S.D. Modern grain storage for reducing storage losses. Agric. Eng. Today 1994, 1, 12–20. [Google Scholar]
  22. Ventura, F.; Marletto, V.; Traini, S.; Tomei, F.; Lucio, B.; Pisa, P. Validation of development models for winter cereals and maize with independent agrophenological observations in the BBCH scale. Ital. J. Agrometeorol. 2009, 3, 17–26. [Google Scholar]
  23. López-Bellido, L.; Fuentes, M.; Castillo, J.E.; López-Garrido, F.J.; Fernández, E.J. Long-Term Tillage, Crop Rotation, and Nitrogen Fertilizer Effects on Wheat Yield under Rainfed Mediterranean Conditions. Agron. J. 1996, 88, 783–791. [Google Scholar] [CrossRef]
  24. López-Bellido, L.; Fuentes, M.; Castillo, J.E.; López-Garrido, F.J. Effects of tillage, crop rotation and nitrogen fertilization on wheat-grain quality grown under rainfed Mediterranean conditions. Field Crop. Res. 1998, 57, 265–276. [Google Scholar] [CrossRef]
  25. Hrušková, M.; Švec, I.; Kocourková, Z. Interaction between wheat variety and harvest year analysed by statistical methods. Cereal Technol. 2011, 4, 152–159. [Google Scholar]
  26. Szwedziak, K.; Wojtkiewicz, K. Zastosowanie analizy morfologicznej w badaniu cech jakościowych ziarna. Inżynieria Rol. 2015, 2, 109–118. [Google Scholar]
  27. Szwedziak, K. Artificial neural networks and computer image analysis in the evaluation of selected quality parameters of pea seeds. E3S Web Conf. 2019, 132, 01027. [Google Scholar] [CrossRef] [Green Version]
  28. Niedbała, G.; Piekutowska, M.; Weres, J.; Korzeniewicz, R.; Witaszek, K.; Adamski, M.; Pilarski, K.; Czechowska-Kosacka, A.; Krysztofiak-Kaniewska, A. Application of Artificial Neural Networks for Yield Modeling of Winter Rapeseed Based on Combined Quantitative and Qualitative Data. Agronomy 2019, 9, 781. [Google Scholar] [CrossRef] [Green Version]
  29. Niedbała, G.; Nowakowski, K.; Rudowicz-Nawrocka, J.; Piekutowska, M.; Weres, J.; Tomczak, R.J.; Tyksiński, T.; Pinto, A.Á. Multicriteria prediction and simulation of winter wheat yield using extended qualitative and quantitative data based on artificial neural networks. Appl. Sci. 2019, 9, 2773. [Google Scholar] [CrossRef] [Green Version]
  30. Niedbała, G.; Kurasiak-Popowska, D.; Stuper-Szablewska, K.; Nawracała, J. Application of Artificial Neural Networks to Analyze the Concentration of Ferulic Acid, Deoxynivalenol, and Nivalenol in Winter Wheat Grain. Agriculture 2020, 10, 127. [Google Scholar] [CrossRef] [Green Version]
  31. Szwedziak, K. The use of vision techniques for the evaluation of selected quality parameters of maize grain during storage. E3S Web Conf. 2019, 132, 01026. [Google Scholar] [CrossRef] [Green Version]
  32. ISO 24333 - Cereals and Cereal Products Sampling. Available online: http://www.standardgoogle.com/en/detail/28405709-cereals-and-cereal-products-sampling.html (accessed on 10 January 2020).
  33. FOSS Analytical Solutions for Food Quality Analysis and Control. Available online: https://www.foss.dk (accessed on 10 January 2020).
  34. Oleksy, A.; Szmigiel, A.; Kołodziejczyk, M. Wpływ intensywności uprawy na zawartość i plon białka odmian pszenicy ozimej. Acta Sci. Pol. Agric. 2008, 7, 47–56. [Google Scholar]
  35. Niedbała, G. Application of artificial neural networks for multi-criteria yield prediction of winter rapeseed. Sustain. 2019, 11, 533. [Google Scholar] [CrossRef] [Green Version]
  36. Niedbała, G. Simple model based on artificial neural network for early prediction and simulation winter rapeseed yield. J. Integr. Agric. 2019, 18, 54–61. [Google Scholar] [CrossRef] [Green Version]
  37. Gonzalez-Sanchez, A.; Frausto-Solis, J.; Ojeda-Bustamante, W. Attribute Selection Impact on Linear and Nonlinear Regression Models for Crop Yield Prediction. Sci. World J. 2014, 2014, 509429. [Google Scholar] [CrossRef]
  38. Li, F.; Qiao, J.; Han, H.; Yang, C. A self-organizing cascade neural network with random weights for nonlinear system modeling. Appl. Soft Comput. 2016, 42, 184–193. [Google Scholar] [CrossRef] [Green Version]
  39. Niedbała, G.; Kozłowski, R.J. Application of Artificial Neural Networks for Multi-Criteria Yield Prediction of Winter Wheat. J. Agric. Sci. Technol. 2019, 21, 51–61. [Google Scholar]
  40. Zhang, G.P.; Patuwo, E.B.; Michael, Y.H. Forecasting with artificial neural networks: The state of the art. Int. J. Forecast. 1998, 14, 35–62. [Google Scholar] [CrossRef]
  41. Mutlu, A.C.; Boyaci, I.H.; Genis, H.E.; Ozturk, R.; Basaran-Akgul, N.; Sanal, T.; Evlice, A.K. Prediction of wheat quality parameters using near-infrared spectroscopy and artificial neural networks. Eur. Food Res. Technol. 2011, 233, 267–274. [Google Scholar] [CrossRef]
  42. Cappelli, A.; Cini, E.; Guerrini, L.; Masella, P.; Angeloni, G.; Parenti, A. Predictive models of the rheological properties and optimal water content in doughs: An application to ancient grain flours with different degrees of refining. J. Cereal Sci. 2018, 83, 229–235. [Google Scholar] [CrossRef]
  43. Szwedziak, K.; Stadnyk, I.; Golyachuk, S.; Grzywacz, Ż. Justification of the Rheological Model of Process of Plastic Material Injection by the Rollers. Agric. Eng. 2019, 23, 101–114. [Google Scholar] [CrossRef] [Green Version]
  44. Mao, X.; Sun, L.; Hui, G.; Xu, L. Modeling research on wheat protein content measurement using near-infrared reflectance spectroscopy and optimized radial basis function neural network. J. Food Drug Anal. 2014, 22, 230–235. [Google Scholar] [CrossRef] [Green Version]
  45. Huang, G.; Han, L. Near Infrared Reflectance Spectroscopy Analysis of Compost Products Using Nonlinear Support Vector Machine With RBF Nucleus. Acta Opt. Sin. 2009, 29, 3556–3560. [Google Scholar] [CrossRef]
  46. Lu, J.; Zhang, Y.; Zhang, Z.; Meng, Q.; Guo, W.; Teng, L. Application of wavelet transform-radial basis function neural network in NIRS for determination of rifampicin and isoniazide tablets. Guang Pu Xue Yu Guang Pu Fen Xi 2008, 28, 1264–1268. [Google Scholar] [PubMed]
  47. Zhong, L.; Rao, W. Neural Network and Its Fusion Technology; Science Press house: Beijing, China, 2007. [Google Scholar]
Figure 1. Sampling: (a) sampling from the grain mass, (b) multi-chamber probe.
Sustainability 12 05050 g001
Figure 2. Water content in wheat samples.
Sustainability 12 05050 g002
Figure 3. Protein content in wheat samples.
Sustainability 12 05050 g003
Figure 4. Gluten content in wheat samples.
Sustainability 12 05050 g004
Figure 5. Multiple regression model diagram for water.
Sustainability 12 05050 g005
Figure 6. Multiple regression model diagram for gluten.
Sustainability 12 05050 g006
Figure 7. Response surface of changes in water content in wheat during storage.
Sustainability 12 05050 g007
Figure 8. Response surface of changes in protein content in wheat rage.
Sustainability 12 05050 g008
Figure 9. Response surface of changes in gluten content in wheat during storage.
Sustainability 12 05050 g009
Table 1. Average protein, water and gluten content in wheat samples.
Determined parameter [%]
ProteinWaterGluten
x ¯ ± S D 13.13 ± 0.1510.63 ± 0.1630.56 ± 0.54
Table 2. Correlation matrix for changes in water, protein and gluten content during individual weeks of storage.
The Marked Correlations are Significant with p < 0.05000
N = 50
VariableWeekProtein [%]Water [%]Gluten [%]
Week1.0000000.894549 *−0.982858 *−0.984709 *
Protein [%]0.894549 *1.000000−0.902216 *−0.900626 *
Water [%]−0.982858 *−0.902216 *1.0000000.964927 *
Gluten [%]−0.984709 *−0.900626 *0.964927 *1.000000
Statistically significant results are indicated (*) in Table 2. Minus signs at the coefficient indicate inverse correlation.
Table 3. Summary of regression of the dependent variable.
N = 50Summary of Regression of Dependent Variable: Week R = 0.99273775 R2 = 0.98552825 Correlation R2 = 0.98458444 F(3.46) = 1044.2 p < 0.0000; Estimation Standard Error: 1.8099.
BetaStandard Error of BetaGradientStandard Error of Betat(46)p
Absolute term 962.628886.0051611.192690.000000
Protein [%]−0.0465090.042656−4.19693.84928−1.090320.281251
Water [%]−0.4966840.070617−43.31926.15898−7.033500.000000
Gluten [%]−0.5473320.070079−13.80891.76806−7.810220.000000
Table 4. Summary of the dependent variable regression using the backwards stepwise method.
N = 50Summary of Regression of Dependent Variable: Week R = 0.99273775 R2 = 0.98552825 Correlation R2 =0.98458444 F(3.46) = 1044.2 p < 0.0000; Estimation Standard Error: 1.8136.
BetaStandard Error of BetaGradientStandard Error of Betat(47)p
Absolute term 871.037218.4804347.132960.000000
Water [%]−0.474290.067701−41.36635.90463−7.005750.000000
Gluten [%]−0.527050.067701−13.29721.70805−7.785010.000000
Table 5. Summary of selected best fitted neural networks.
Network NameLearning QualityTesting QualityValidation QualityLearning ErrorTesting ErrorValidation ErrorLearning AlgorithmError FunctionActivation HiddenActivation Output
MLP
52-10-3
0.9950.9770.9440.0020.0220.010BFGS 12SOSTanhLinear
MLP 52-6-30.9990.9780.948> 0.0010.0150.008BFGS 20SOSTahnLinear
MLP 52-10-30.9890.9760.9550.0030.0160.008BFGS 15SOSLinearTanh
MLP 52-6-30.9970.9650.9440.0010.0110.011BFGS 19SOSTahnTanh
MLP 52-4-30.9650.9610.940.0050.0130.011BFGS 17SOSLogisticExponential
BFGS—Broyden-Fletcher-Goldfarb-Shanno algorithm; MLP—multilayer perceptron.
Table 6. Sensitivity analysis of neural networks.
Network NameWeekWater [%]Gluten [%]Protein [%]
MLP 52-6-392.4589.6055.1236.50
Rank1234

