Article

Reduction of Nitrogen Fertilizer Requirements and Nitrous Oxide Emissions Using Legume Cover Crops in a No-Tillage Sorghum Production System

1
Department of Agronomy, 2004 Throckmorton Plant Science Center, Kansas State University, Manhattan, KS 66506, USA
2
Council for Scientific and Industrial Research–Savanna Agricultural Research Institute, P.O. Box 494 Wa, Ghana
3
Division of Biology, 116 Ackert Hall, Kansas State University, Manhattan, KS 66506, USA
*
Author to whom correspondence should be addressed.
Sustainability 2020, 12(11), 4403; https://doi.org/10.3390/su12114403
Submission received: 28 April 2020 / Revised: 22 May 2020 / Accepted: 25 May 2020 / Published: 28 May 2020
(This article belongs to the Special Issue Suitable Agronomic Techniques for Sustainable Agriculture)

Abstract

:
Nitrous oxide (N2O) emission from denitrification in agricultural soils often increases with nitrogen (N) fertilizer and soil nitrate (NO3) concentrations. Our hypothesis is that legume cover crops can improve efficiency of N fertilizer and can decrease N2O emissions compared to non–cover crop systems. The objectives of this study were to (a) evaluate the performance of summer leguminous cover crops in terms of N uptake and carbon (C) accumulation following winter wheat and (b) to quantify the effects of summer leguminous cover crops and N fertilizer rates on N2O emissions and grain yield of the subsequent grain sorghum crop. Field experiments were conducted in the context of a wheat-sorghum rotation for two seasons in Kansas. Treatments consisted of double-cropped leguminous cover crops following winter wheat harvest with no fertilizer applied to the following grain sorghum or no cover crop after wheat harvest and N fertilizer rates applied to the grain sorghum. The cover crops were cowpea (Vigna unguiculata L. Walp.), pigeon pea (Cajanus cajan L. Millsp.), and sunn hemp (Crotalaria juncea L.). The three N treatments (were 0, 90, and 180 kg·N·ha−1). Fallow systems with 90 and 180 kg·N·ha−1 produced significantly greater N2O emissions compared with cropping systems that received no N fertilizer. Emissions of N2O were similar for various cover crops and fallow systems with 0 kg·N·ha−1. Among cover crops, pigeon pea and cowpea had greater C accumulation and N uptake than sunn hemp. Grain yield of sorghum following different cover crops was similar and significantly higher than fallow systems with 0 kg·N·ha−1. Although fallow systems with 90 and 180 kg·N·ha−1 produced maximum sorghum grain yields, N2O emissions per unit of grain yield decreased as the amount of N fertilizer was reduced. We conclude that including leguminous cover crops can decrease N fertilizer requirements for a subsequent sorghum crop, potentially reducing N2O emissions per unit grain yield and providing options for adaptation to and mitigation of climate change.

1. Introduction

One of the challenges for agriculture is to minimize nitrogen (N) losses to the environment while maintaining adequate N supply for high cash crop yields [1]. These losses are primarily the result of timing asynchrony of the supply or availability of nitrogen and crop demand along with environmental factors. Of particular environmental concern are emissions of nitrous oxide (N2O), a greenhouse gas (GHG) from agricultural soils that contributes to global warming and ozone destruction. Although emissions of N2O are smaller in magnitude than those of other GHGs such as carbon dioxide, they are a major contributor (about 15%) to global warming [2] because the global warming potential of N2O is about 298 times greater than that of CO2 [3]. In addition, N2O destroys the stratospheric ozone, which is a major concern [4].
Agricultural soils are known to be the largest anthropogenic source of N2O [5]. Decreasing N2O emissions from field-crop soils is necessary from not only an environmental quality perspective, but also an agro-economic perspective, because it decreases the efficacy of expensive applied N fertilizers. The challenge for field-crop producers is that underuse of N fertilizer can result in lower crop yields, but overuse results in excess soil inorganic N, which may be lost as N2O and/or leach as nitrate (NO3) into surface and groundwater resources. Over-applying fertilizer N simultaneously pollutes the environment and wastes an expensive crop nutrient. Maintaining the right amount of N in the root zone throughout the growing season is extremely difficult, but important [6]. Therefore, developing crop and soil management practices for efficient use of N and to minimize N2O emissions is important. Use of summer legume cover crops in the farming systems is one such management practice to improve soil health, reduce environmental pollution, and improve crop yields [7].
Leguminous cover crops have the capacity to fix atmospheric N through biologic nitrogen fixation (BNF), thus decreasing fertilizer N demand in the following cereal and oil seed crops, because soil mineral N availability is greater in the year following legumes [8]. In addition, use of leguminous cover crops can decrease disease and weed pressure, particularly in cereal based cropping systems [9]. The benefits of legume cover crops or grain crops in rotation with cereal crops is largely attributable to improved N supply, improvement in soil physical and chemical properties such as bulk density, water-holding capacity, and improved cation exchange capacity because of soil organic matter increase over time [10].
The effects of cover crops on N2O emissions are mixed [11]. Short-term peaks in N2O emissions often were observed after crop residues are returned to the soil [12]. The magnitude of the emissions depends on environmental conditions, such as temperature and rainfall, and the quantity of plant residue added to the soil. The influence of summer leguminous cover crops in rotation systems with cereals or fallow on N2O emissions during the cropping season is not understood. Research conducted by Garcia–Ruiz and Baggs (2007) [13] reported N2O emissions up to three times greater in a soil with a legume residue input than in a non-amended soil, but the magnitude of response to legume residue addition depends on environmental and soil conditions [14].
Cover crop adoption is increasing substantially throughout the US [15,16], especially in the Midwest and in the mid-Atlantic states [17], including Maryland, Pennsylvania and Virginia. These states also have a high concentration of animal husbandry; thus, it may be possible to couple excess manure from animal production with cover crop selection to improve N management and reduce nitrous oxides emissions. Therefore, understanding N2O emissions from leguminous cover crops and N fertilizers and/or amendments in cropping systems is particularly important. This is because cover crops are increasingly promoted as components of GHG mitigation strategies [18] and integrated soil management strategies, especially in Sub-Saharan Africa. Synthetic fertilizer N use in Africa is lower when expressed on an area basis than on any other continent, and inadequate availability of synthetic N often limits the production of agricultural crops. For this reason, alternative sources of nutrients such as leguminous cover crops to improve crop production and at the same time reducing N2O emission are critical for mitigating the negative impact of N2O to the atmosphere.
Our hypothesis is that legume cover crops can improve efficiency of N fertilizer and can decrease N2O emissions compared to non-cover crop systems. The objectives of this study were (a) to evaluate the performance of leguminous summer cover crops for N uptake and carbon (C) accumulation following winter wheat, and (b) to quantify the effects of leguminous summer cover crops and N fertilizer on N2O emissions and grain yield of the subsequent grain sorghum (Sorghum bicolor L. Moench) crop.

2. Materials and Methods

2.1. Study Site and Experimental Design

On-station trials were carried out during the cropping seasons of 2012/2013 and 2013/2014. The study site was at the Kansas State University (KSU) Department of Agronomy research facility located at the Agronomy North Farm (39°11′30″ N, 96°35′30″ W, 308 m above sea level) on well-drained Kennebec silt loam (fine-silty, mixed, superactive, mesic Cumulic Hapludolls).
Treatments in this cropping system included no-tillage double-cropped leguminous cover crops following winter wheat variety, cv. Everest rotated with grain sorghum hybrid DKS54-00 and N fertilizer rates applied to the grain sorghum. The experimental design was a randomized complete block design with four replications. The plot size was 4.5 m × 9.0 m.
Each block included a randomized arrangement of six treatments assigned to the six experimental units in each block. Three treatments included no cover crops after wheat, but with three N rates (0, 90, and 180 kg·N·ha−1) applied as dry urea (46% N by weight) at time of grain sorghum planting. The other three treatments included cover crops (CC); cowpea, Vigna unguiculata L. Walp., California black eye variety; pigeon pea, Cajanus cajan L. Millsp., White Bold variety; and sunn hemp, Crotalaria juncea L., but with no N fertilizer applied at the time of grain sorghum planting as presented in Table 1 and field layout as shown in Table 2.
Treatments without cover crops but with the three N fertilizer rates established N2O emission and sorghum responses to N fertilizer that were used to contextualize responses to legume cover crops as well as to estimate equivalent N contributions from legume cover crops to the subsequent sorghum crop [19].

2.2. Management of Winter Wheat, Cover Crops, and Grain Sorghum

Winter wheat was drilled in October 2011 and 2012. Before seeding the wheat, glyphosate-4 plus herbicide [N-(phosphonomethyl) glycine] at a rate of 1.67 a.i. kg·L−1 was applied with a backpack knapsack sprayer to kill all weeds in the field. Seeding was performed with a John Deere 1590 (Deere & Co., Moline, IL, USA) with a target seeding rate of 115 kg·L−1 with inter row spacing of 19 cm. Nitrogen fertilizer in the form of liquid urea ammonium nitrate solution (28% N) was applied at the rate of 68 kg·N·ha−1 with 20 kg·N·ha−1 applied at wheat planting and 48 kg N ha−1 applied at spring green up in both years. After wheat harvest in June (2012) and July (2013), the stubble was sprayed with 3.5 L·ha−1 glyphosate 4 plus herbicide (N-(phosphonomethyl) glycine) to control weeds. After harvesting the wheat, three leguminous CC (cowpea, pigeon pea, and sunn hemp) were planted into the wheat stubble without tillage. Before planting the cover crops, seeds were treated with a commercial Rhizobium inoculant at rate of 1 kg of seed to 5 g of inoculants. The seeding rate used for cowpea, pigeon pea, and sunn hemp was 56, 28, and 12.5 kg·ha−1, respectively. Planting was carried out on 17 June 2012 and 8 July 2013.
Cowpea, pigeon pea, and sunn hemp were terminated 69, 86, and 87 days after planting, respectively, in 2012. Corresponding values in 2013 were 72, 88, and 89 days after planting. Cover crop aboveground biomass production was estimated by harvesting an area of 4.5 m2 at two spots from all CC plots by hand in 2012 and 2013. After weighing, fresh CC aboveground biomass sub-samples of roughly 1000 g of the CC were obtained. The remaining CC aboveground biomass was distributed uniformly on the harvested plots to decompose and act as dead mulch for the subsequent grain sorghum crop. The two subsamples of aboveground biomass from each CC plots were dried in a forced-air dryer at 65 °C until they reached constant weight. The dried CC aboveground biomass (leaves and stems) of the sub-samples were used to calculate dry matter content of harvested material, which was used to adjust plot fresh weights for estimates of total dry CC aboveground biomass production. The dried CC aboveground biomass samples (leaves and stems) were ground in a Thomas Wiley laboratory mill (Model 4, Arthur H. Thomas Company, Philadelphia, PA, USA) and passed through a 2.0-mm screen. The dried CC aboveground biomass samples were analyzed for N and C by dry combustion (modified Dumas method) using a LECO CHN-2000 elemental analyzer (LECO Corp., St. Joseph, MI, USA) by the Kansas State University Soil Testing Laboratory. Nitrogen and C accumulation in the aboveground biomass of the CC were determined by multiplying mass of aboveground dry matter by percentage N concentration or percentage C concentration. The succeeding grain sorghum (DKS54-00) crop was planted in May (2013) and June (2014) with a two-row planter (John Deere 1590, Deere & Co.) without tillage. Weeds on the experimental field were sprayed with 3.5 L ha−1 glyphosate 4 plus herbicide [N-(phosphonomethyl) glycine] before planting. Standard spacing for sorghum (75 cm between rows) was used during planting in both years with a target plant population of 125,000 plants ha−1. Weeds were controlled with pre-emergence herbicide, atrazine (1-chloro-3-ethylamino-5-isopropylamino-2,4,6-triazine) and 2,4-dichlorophenoxyacetic acid (2,4-D) sprayed at the rate of 1.1 L·ha−1, with a tractor-mounted boom sprayer. Hand-weeding was also done when necessary throughout the growing season to keep fields weed-free.
Each sorghum plot was sampled at physiological maturity and separated into leaf, stem, and panicle components from ten randomly selected plants in the two inner rows. The samples were dried for 72 h at 60 °C in a forced-air oven. Total aboveground biomass was calculated and expressed in kg·ha−1 based on plant population in each plot. Grain sorghum panicles were hand threshed, and the grains ground with the aid of a Cyclone sample mill (Model 3010-030, Udy Corporation, Fort Collins, CO, USA). A Thomas Wiley laboratory mill was used to grind the leaves and stems. Leaf, stem, and grain N were analyzed by the Kansas State University Soil Testing Laboratory. Aboveground N uptake and grain N uptake of grain sorghum were determined by multiplying dry matter mass by percentage N concentration of each component. At physiological maturity, plots were harvested using a 2-row Gleaner (modified EIII, AGCO Corporation, Duluth, GA, USA). Grain yields in both years were corrected to 135 g·kg−1 moisture content.

2.3. Soil Gas Sampling and Analyses

Soil gas samples were collected using custom-built static polyvinyl chloride (PVC) chambers designed in accordance with the USDA-ARS GRACEnet chamber-based trace gas flux measurement [20]. The chambers consisted of two parts: a chamber base and a vented sampling chamber head covered with reflective tape. The chamber base was made from white PVC pipe (30 cm inside diameter, 6 mm thick, and 15 cm high). The chamber bases were driven 10 cm into the ground using a rectangular wooden block and a rubberized mallet, leaving a soil collar 5 cm above the ground in the center of the two middle rows of each plot.
Three tight-fitting butyl rubber septa were fitted to the top of the flux chamber head (30 cm inside diameter, 6 mm thick, and 10 cm high). A 10-cm-long and 4.8-mm-inside-diameter PVC vent tube was inserted into the first butyl rubber cork on top of the flux chamber head to offset pressure differences between the inside and outside of the flux chamber during measurements. A thermometer was inserted into the second butyl rubber septum to measure temperature inside the flux chamber during measurements. The third butyl rubber septum was used as a sampling port into which a syringe needle was inserted during gas sampling. The chamber anchor bases were kept open at all times except during gas sampling.
During gas sampling, the chamber anchor bases were fitted with the tight-fitting vented chamber heads. At each gas sampling, the air inside the chamber was mixed by pumping air into the syringe and expelling the air three to five times. In 2013, gas sampling during the sorghum growing period started on May 15 and ended on October 12, whereas in 2014, sampling began on April 28 and ended on October 14. Gas samples were extracted at 0-, 15-, 30-, and 45-min time intervals. Sampling was typically restricted to between 9:00 a.m. and 1:00 p.m. to avoid large temperature fluctuations during gas collection periods. Immediately after extraction, the 25-mL gas samples were transferred to 12-mL pre-evacuated vials sealed with butyl rubber septa (Exetainer vial, Labco, Ltd., Lampeter, Ceredigion, UK) that over pressurized the system to ensure that in case of leakage, gas movement would be only out of the vials and not into the vials. We sampled every week and more intensively (twice/week) following fertilizer application and after rainfall events to cover most of the crop growth period. Sampling was reduced to once every 2 weeks when fluxes were observed to be at background levels. The 12-mL gas samples were transported to the laboratory for analyses. Gas concentrations were determined by gas chromatography (Model GC 14A; Shimadzu, Kyoto, Japan) equipped with a 63Ni electron capture detector and a stainless steel column (0.318-cm diameter by 74.5-cm long) with Poropak Q (80–100 mesh, Shimadzu, Kyoto, Japan).

2.4. Surface Flux Calculations

Surface fluxes were calculated using the following equation by [21]:
f = Δ C Δ t × V A × m V m
where:
  • f = the flux rate of soil gas (μgm2 min1)
  • ΔC/Δt = change in N2O concentration inside the chamber during the measuring time Δt
  • V = the head–space volume of the measuring chamber (0.0109 m3)
  • A = the surface area of the measuring chamber (0.0706 m2)
  • m = the molecular weight of N2O (44 gmol1)
  • Vm = the molar volume of gas (m3 mol1)

2.5. Cumulative Nitrous Oxide Calculations

The average N2O flux for each treatment was the arithmetic means of four replications of each treatment. Total cumulative N2O fluxes were calculated by plotting daily fluxes through time, interpolating linearly between them and integrating the area under the curve, which in effect assumes that fluxes changed linearly between sampling dates.
Cumulative   N 2 O   ( g · N · ha 1 ) = i = 1 n ( X i + X i + 1 ) 2   ( t i + 1 t i )
where Xi was the initial N2O-N flux (g·ha−1·day−1) reading and Xi+1 was the next reading at times ti and ti+1, respectively, and n was the last N2O-N flux estimated during the study period.
In addition, percentage emission factor (EF) was calculated according to the following equation (IPCC, 1997):
EF = [(cumulative flux (fertilizer treatment) − cumulative flux (control))/(fertilizer applied)] × 100

2.6. Soil Properties, Analyses and Ancillary Measurements

A week before planting, composite soil samples were taken from each plot to a depth of 30 cm with a hand probe (4.5 cm in internal diameter). Samples consisted of 12 to 15 individual cores mixed to form individual composite samples. The soil was analyzed for both physical and chemical properties. Analyses were conducted by the Kansas State University Soil Testing Laboratory. Soil texture was determined by hydrometer method with the addition of Na6P6O18 to break down complex Ca2+, Al3+, Fe3+, and other cations that bind clay and silt particles into aggregates. Soil pH was estimated using a 1:1 slurry method with a 10-g scoop of soil and 10 mL of deionized water. Mehlich-3 P was analyzed by the HCl-ammonium fluoride extraction method [22]. The Walkley-Black procedure [23] was used to analyze organic matter with the aid of a hydrometer (Model 6026Q20, Thomas Scientific). Extractable (plant-available) K and Na were determined by the ammonium acetate (1 mol·L−1, pH 7.0) extraction method. In addition, chloride was extracted by CaNO3 and analyzed by the mercury thiocyanate method. In addition, the turbidimetric method [24] was used to determine sulfate-S. Nitrate and ammonium were measured by an indophenol colorimetric reaction [25] after soil samples were extracted with 1 mol·L−1 KCl. The soil test results are presented in Table 3.
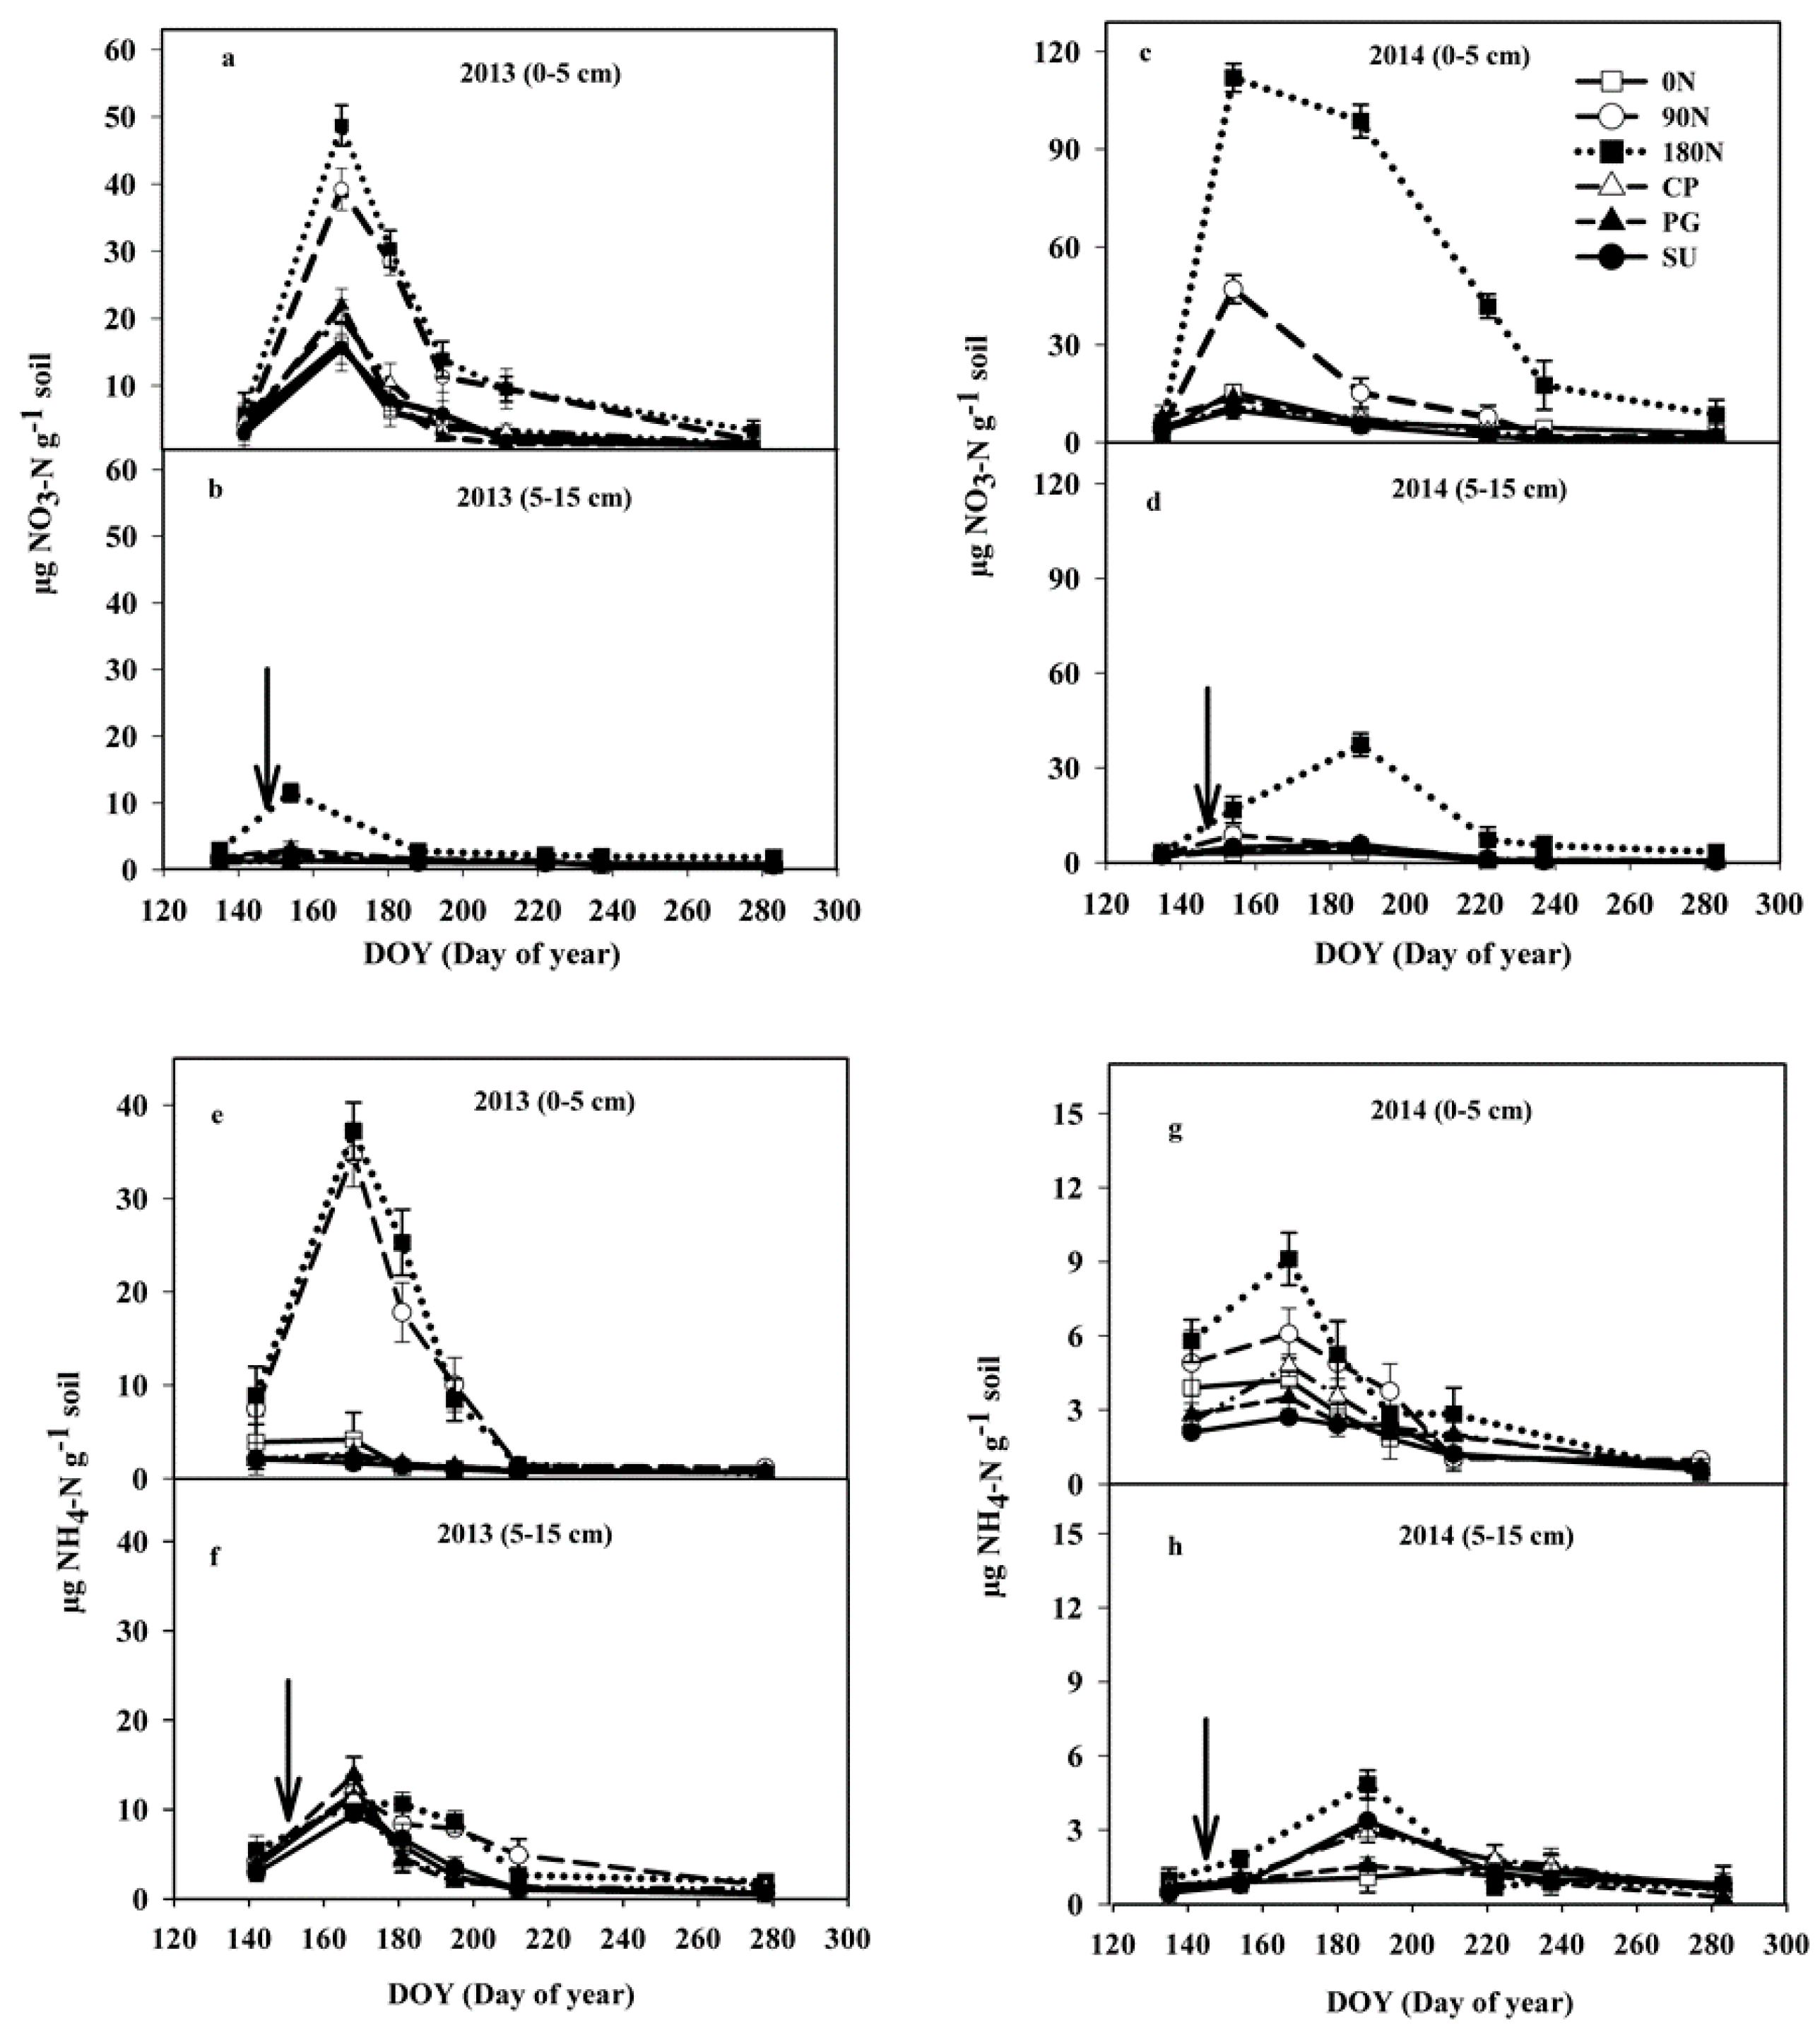
Another set of soil samples was collected at six locations within each plot from 0–5-cm- and 5–15-cm-depth using a 19-mm ID soil core sampler (Oakfield Apparatus, Inc., Oakfield, WI, USA) during the N2O sampling period. Sampling locations were randomly selected from within the center 0.38 m of the inner row region, avoiding areas affected by obvious wheel traffic compaction. Cores from each depth were pooled for a given plot, homogenized, and refrigerated before analysis of each plot collected for the determination of mineral NO3-N and NH4+-N. A 25-g fresh soil subsample from each sample was extracted with 100 mL 2 M KCl, filtered (Whatman no. 42), shaken at 300 rpm for 60 min and then filtered. Soil mineral N concentrations (NH4+-N and NO3-N) in the filtrate were determined colorimetrically with a TRAACS 800 Auto–Analyzer (Bran-Luebbe, Analyzing Technologies, Elmsford, NY, USA) by the Kansas State University Soil Testing Laboratory.
Surface water content (0 to 5 cm) and soil and air temperature were measured at the time of each gas flux sampling event using a dielectric constant-measurement Hydra Probe soil sensor (POGO, Stevens Systems, Inc., Beaverton, OR, USA) and handheld digital thermometers (Fisher, Hampton, NH, USA), respectively. Soil water contents were determined on samples by weighing before and after samples were dried at 105 °C.
Additional soil samples were collected for analysis of bulk density at two sampling dates in each year. Because soil bulk density was observed not to vary with time or treatment during the period of measurement, soil volumetric water data were converted to water-filled pore space (WFPS) using the average bulk density (1.18 g·cm−3) for the site. Therefore, WFPS was calculated using the following equation:
WFPS = (soil gravimetric water content × bulk density)/[1 − (bulk density/particle density)]
In addition, three different indices of yield-scaled N2O emissions were calculated by dividing cumulative area-scaled emissions by (i) grain yield, (ii) grain N uptake, and (iii) total aboveground plant N uptake.
Daily precipitation and average air temperatures were obtained from the Kansas State University Digital Weather Library that collected data from weather station within 25 m of the experimental plots.

2.7. Statistical Analyses

General and mixed linear models (PROC GLM, PROC MIXED) (9.3 SAS Institute, Inc., Cary, NC) were utilized for the analyses. Data for aboveground CC biomass yields, C accumulation of CC, N uptake of CC, yields of sorghum, and soil inorganic N content were analyzed using the GLM procedure of SAS (Version 9.1, SAS Institute and Cary, NC, USA). Data distribution normality was assessed by the Shapiro-Wilk test. A repeated measures ANOVA model was employed for parameters measured multiple times over the study year. In repeated-measures mixed models, block was included as a random effect, sampling date as the repeated factor, and treatments and their interaction as fixed effects using PROC MIXED in SAS (Version 9.1, SAS Institute, Cary, NC, USA). The best model for covariance was tested by stepwise inclusion of different covariance structures available in SAS. Based on lower Akaike information criterion and convergence, we chose Ante-dependence 1, which permits the variance among observations to vary over time. Ante-dependence was used because for our data, the times of measurement were common across units. Nitrous oxides emissions were estimated by linear interpolation between sampling dates. Linear correlations were carried out to determine relationships between gas fluxes and WFPS, NH4+-N, and NO3-N. These correlation analyses were performed using the mean data of replicates for all treatments (n = 6) and all the dates when soil and N2O was sampled in 2013 (n = 22), 2014 (n = 26) or the entire cropping cycle (2013 and 2014; n = 48). Treatment means were separated via pairwise t-tests. Statistical significance was evaluated at p < 0.05, unless noted otherwise.

3. Results

3.1. Climatic Conditions

Climatic conditions varied among the growing seasons from 2012–2014 (Table 4). Mean maximum temperature during the growing season in 2012 was 28.6 °C. However, 37.4 °C was recorded in July, the hottest month during the growing season. In 2013, average maximum air temperature during the sampling period was below 30 °C, except in July, when the maximum air temperature exceeded 32.1 °C. However, in 2014, maximum air temperature in August was above 30 °C. Maximum soil temperature ranged from 14.6–27.6 °C, 12.0–25.5 °C, and 13.4–29.3 °C in 2012, 2013, and 2014, respectively. In addition, rainfall amounts of 338 mm, 550 mm, and 589 mm were recorded in 2012, 2013, and 2014, respectively. In 2012, mean solar radiation was 20.7 MJ/m−2, and was 18.4 MJ/m−2 in 2013. While in 2014, mean solar radiation recorded was 18.9 MJ/m−2.

3.2. Aboveground Biomass, Carbon, and Nitrogen Uptake by Cover Crops

Aboveground biomass, C accumulation, N uptake, and C: N ratio of CC were all affected by year and cropping system (p < 0.05) (Table 5 and Figure 1). Among the cover crops, PG had the greatest aboveground biomass compared to cowpea and sunn hemp in 2012 when the rotation was established. While sunn hemp produced the greatest amount of aboveground biomass in 2013, followed by pigeon pea and then cowpea (Figure 1a).
Aboveground C accumulation was significantly (p < 0.05) greater for PG followed by SU and CP in 2012. In 2013, CP had the lowest C accumulation, but C accumulation was significantly higher for PG and SU (Figure 1b). In 2012, N uptake was similar for cowpea and pigeon pea, but was significantly lower for SU. On the other hand, CP had the lowest N uptake when compared to PG and SU in 2013 (Figure 1c). Carbon-to-nitrogen ratio was less than 20 for all cover crops in both years, and the ranking was similar in both years, with CP > PG > SU (Figure 1d).

3.3. Soil Inorganic Nitrogen

Soil inorganic N was affected by day of sampling and cropping systems (p < 0.05) (Table 5 and Figure 2). Soil inorganic N (NO3-N and NH4+-N) at both 0–5-cm and 5–15-cm depths in 2013 and 2014 was less than 10 µg N g−1 soil at the beginning of each growing season and start of gas sampling (Figure 2). Maximum soil inorganic N concentrations were observed 11 to 15 d after N application in 2013 and 2014. Generally, more soil inorganic N was recorded in the cropping system with 90N and 180N in both years compare to CP, PG, and SU (Figure 2). Soil inorganic N (NO3-N) of 48.69 µg N g−1 and 30.33 µg N g−1 at the soil depth of 0–5 cm were recorded in 2013 in the cropping system with 180N when soil were sampled at DOY 168 and 181, respectively (Figure 2). While in 2014, for the same cropping system with 180N, on DOY (154 and 188), soil inorganic N (NO3-N) were 111.94 µg N g−1 and 96.66 µg N g−1, respectively at soil depth of 0–5 cm (Figure 2). In both years, at soil depth of 5–15 cm, soil inorganic N (NO3-N) values were less than 40 µg N g−1 irrespective of the sampling date and cropping system (Figure 2). For soil inorganic N (NH4+-N), in 2013 at a depth of 0–5 cm, on DOY (168), cropping system with 90N and 180N recorded 34.67 µg N g−1 and 37.21 µg N g−1, respectively. However, in 2014, both at 0–5 and 5–15 cm soil depth, soil inorganic N (NH4+-N) values were less than 20 µg N g−1 for all the cropping systems (Figure 2).

3.4. Precipitation, Water-Filled Pore Space, and Daily Nitrous Oxide Emissions

Precipitation influenced water filled space and daily nitrous oxide emissions in 2013 and 2014 (Figure 3). Water-filled pore space increased to 68% on day of year (DOY 157) after several rainfall events totaling 46 mm. During the gas-sampling period, the lowest WFPS was recorded on DOY 251 as a result of less than 2 mm of rainfall from DOY 227 to DOY 251 (Figure 3a). The daily emissions of N2O-N differed significantly among the sampling dates, which was clearly related to precipitation events and WFPS (Table 6 and Figure 3). Emissions increased dramatically on DOY 175 in 2013 because a precipitation event of 27.2 mm immediately preceding that sample date resulted in WFPS of 89.5% (Figure 3a,b). Among the cropping systems, application of 180N usually had the greatest daily emission followed by 90N, which was followed by cropping system with CP throughout the sampling period (p < 0.05). The cropping systems with the smallest daily and cumulative emissions were when N was not applied (0N), plots with PG and SU (Figure 3b). The largest precipitation event during the sampling period was at DOY 258 with 70.4 mm and WFSP of 99.9%, but the precipitation event did not influence amount of emission (Figure 3a,b).
In 2014, WFPS at DOY 118 was 95% due to total precipitation amount of 69 mm on DOY 117. WFPS was generally greater than 50% in 2014, except on DOY 125 (46%), DOY 197 (20%), DOY 204 (18%), DOY 210 (10%), and DOY 271 (43%) due to precipitation amount less than 5.0 mm (Figure 3c). Emissions in 2014 were generally less than in 2013 (often < 30 g·N·ha−1·d−1) (Figure 3d). Within the season, N2O emissions were low from late April through early June, then increased considerably on DOY 167, with total precipitation of 21.0 mm and WFPS of 94% (Figure 3c,d), especially with cropping systems applied with 90N and 180N.
Emissions of N2O were affected by N application, amount of rainfall and soil N available from the CC residues. In 2014, little precipitation was received from early July through early August, resulting in low WFPS and thus low N2O emissions. The most notable emissions were recorded in cropping system with 90N and 180N, which peaked in mid-August following closely spaced rainfall events (Figure 3c,d). Season-long cumulative emissions in 2014 followed a pattern similar to that observed in 2013, but cropping system including the PG had greater emissions than the 0N.

3.5. Growing Season Cumulative Nitrous Oxide Emissions

A significant (p < 0.05) treatment effect was observed on cumulative N2O emissions at the end of the sampling period. The values for cumulative emissions for each treatment closely reflected daily emissions. In 2013, 180N had the greatest cumulative (annual) emissions, followed by 90N and CP (Figure 4a). No difference was detected among cropping systems with 0N, PG, and SU (Figure 4a). Similarly, in 2014, 180N had the greatest annual emission compared with cropping system with 90N and CP (Figure 4b). However, 0N and SU had the lowest cumulative nitrous oxide emissions, but was significantly higher in cropping system with PG (Figure 4b).

3.6. Sorghum Grain Yield Following Cover Crops and Specific Nitrous Oxide Emissions

Grain yield, N uptake, grain N uptake, total N uptake, per unit of grain yield, per unit of grain N uptake, and per unit of total N were significant (p < 0.05) among the cropping systems with application of N only or inclusion of CC only in 2013. Grain yield ranged from 4540 to 7581 kg·ha−1 (Table 7). Percentage increase in grain yield with inclusion of SU, PG, and CP in the cropping system over 0N was 12%, 27%, and 29%, respectively. For N2O-N emission per unit of grain yield, cropping system with 0N, CP, PG, and SU obtained lower values, but were significantly higher for 90N and 180N. Nitrous oxides emission per unit grain N uptake was much higher with cropping system with 180N when compared to other cropping systems. The lowest N2O-N emission per unit grain N uptake was observed in cropping system with PG. Among all the cropping systems, application of 180N had the highest N2O-N emission per unit total N uptake compared to other cropping systems (Table 7). Emission factor in the cropping system with 90N was lower, but significantly higher in cropping system with 180N.
There were significant (p < 0.05) differences among the cropping systems for all the variables estimated (Table 8) in 2014. Grain yield was similar for all the cropping systems, except for 0N, which had a lower value. Percentage increase in grain yield with inclusion of SU, PG, and CP in the cropping system over 0N was 31%, 33%, and 32%, respectively. The results showed that N uptake, grain N uptake, and total N uptake were similar among cropping system that had CP, PG, and SU. However, N2O-N emissions per unit of grain N were not statistically different between cropping system with CC and 0N. However, the cropping system with SU had N2O-N emissions per unit of grain N similar to 0N. Although N2O-N emissions per unit of total N uptake were not statistically different between PG, SU, and 0N, the Emission factor was greater with applications of 180N than 90N.
Nitrous oxide emissions significantly correlated with soil temperature in 2013 (p < 0.05, n = 22, r = 0.57) and 2014 (p < 0.05, n = 26, r = 0.63). In addition, daily N2O emissions significantly correlated with NH4+ topsoil content (p < 0.05, n = 22, r = 0.81) in 2013 and (p < 0.05, n = 26, r = 0.76) in 2014. During the entire cropping cycle (2013 and 2014), N2O fluxes significantly correlated with WFPS (p < 0.05, n = 48, r = 0.65), NO3 (p < 0.05, n = 48, r = 0.60), and NH4+ (p < 0.05, n = 48, r = 0.8).

4. Discussion

Soil analyses from the study site showed differences in both physical and chemical characteristics. Percentage organic matter was higher in 2013 than 2014 (Table 3). Crop production worldwide has generally resulted in a decline in soil organic matter levels and, consequently, in a decline of soil fertility. Therefore, maintenance of soil organic matter levels and the optimization of nutrient cycling are essential to the sustained productivity of agricultural systems. The growing seasons (April–October) for 2012, 2013, and 2014 were different. During all the growing seasons, the month of July recorded the least amount of rainfall (Table 3). This resulted in inadequate soil moisture during early CC growth or late vegetative stages of sorghum growth. Overall, the amount of rainfall recorded in 2012 was less than in 2013 and 2014. Thus, the climatic conditions and soil characteristics observed during the growing season may have contributed to the variations in the results of this study.
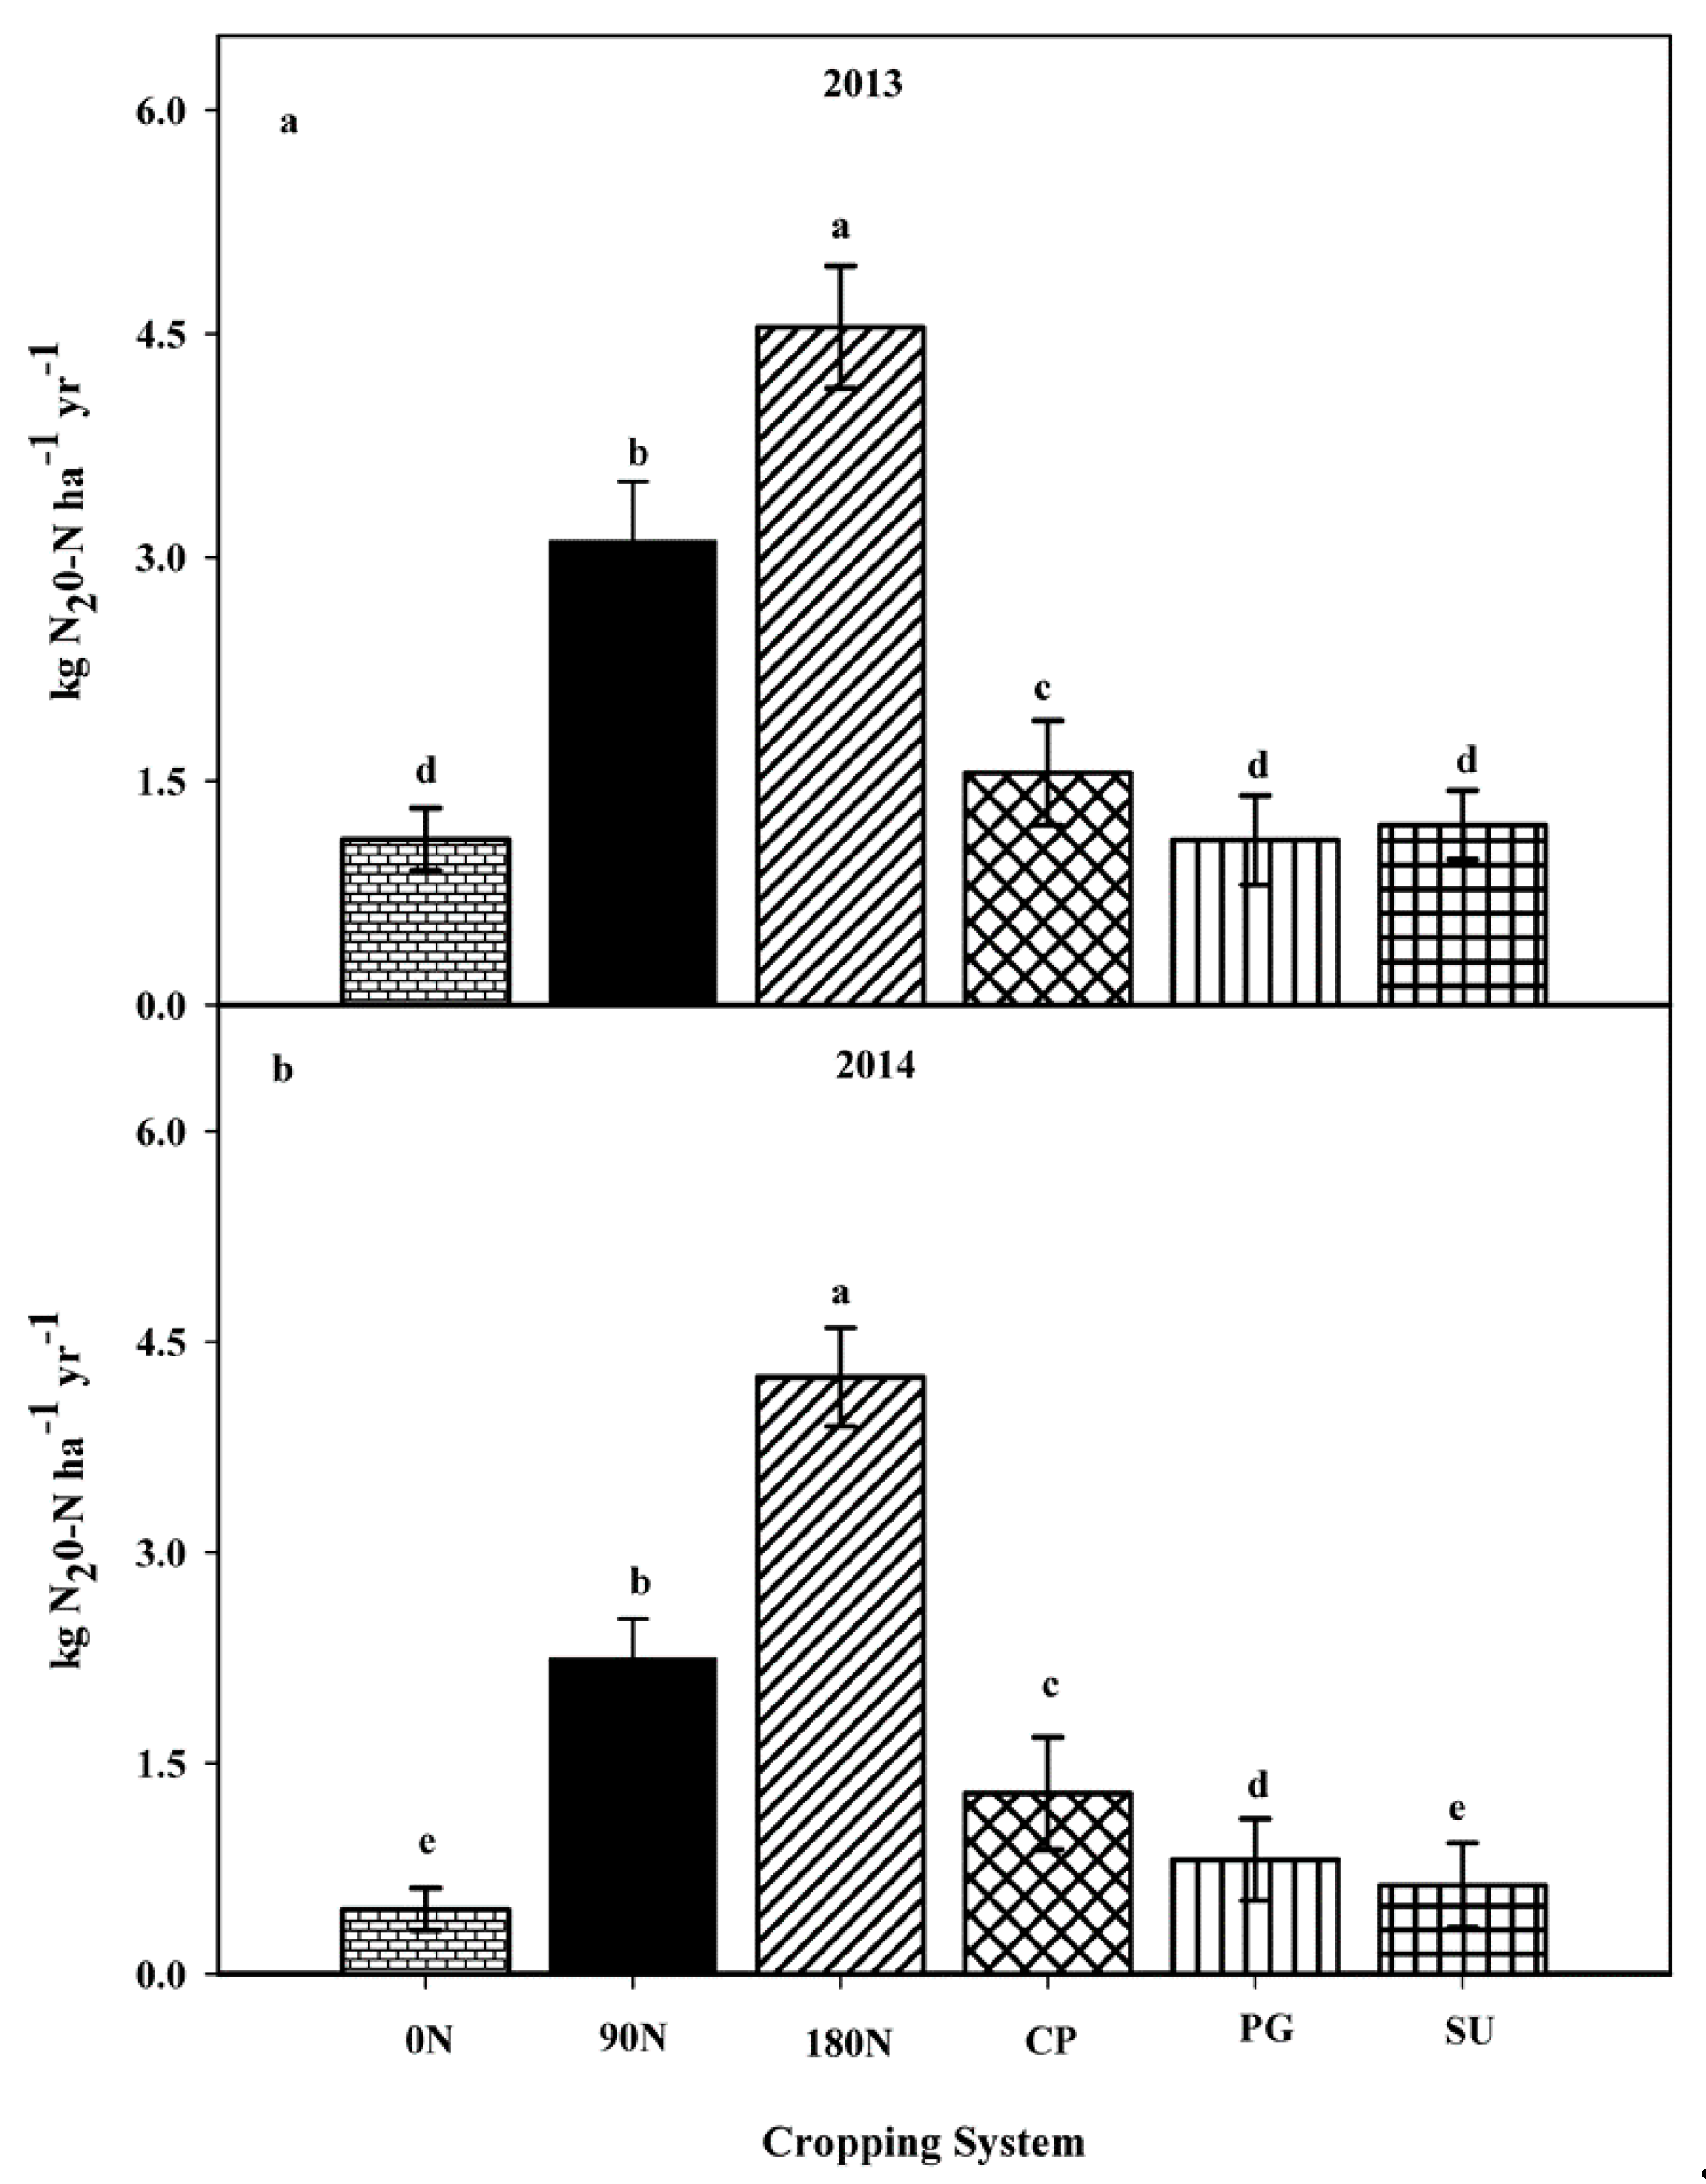
In our study, cumulative N2O emissions were greater in fertilized cropping systems (180 kg·N·ha−1 and 90 kg·N·ha−1) compared with cover crops or fallow systems without N fertilizer (Figure 3). Nitrogen fertilizer is a major contributor to N2O emissions from cultivated soils [26]. Emissions of N2O have been found to increase with N fertilizer rate [27], but some studies have not found consistent increases in N2O emissions with increasing N fertilizer rate [28,29].
The use of cover crops can decrease N2O emissions from cropping systems because of their ability to decrease mineral N availability for N2O-N producing processes [30]. Our research showed that pigeon pea and sunn hemp had significantly smaller N2O emissions than cowpea (
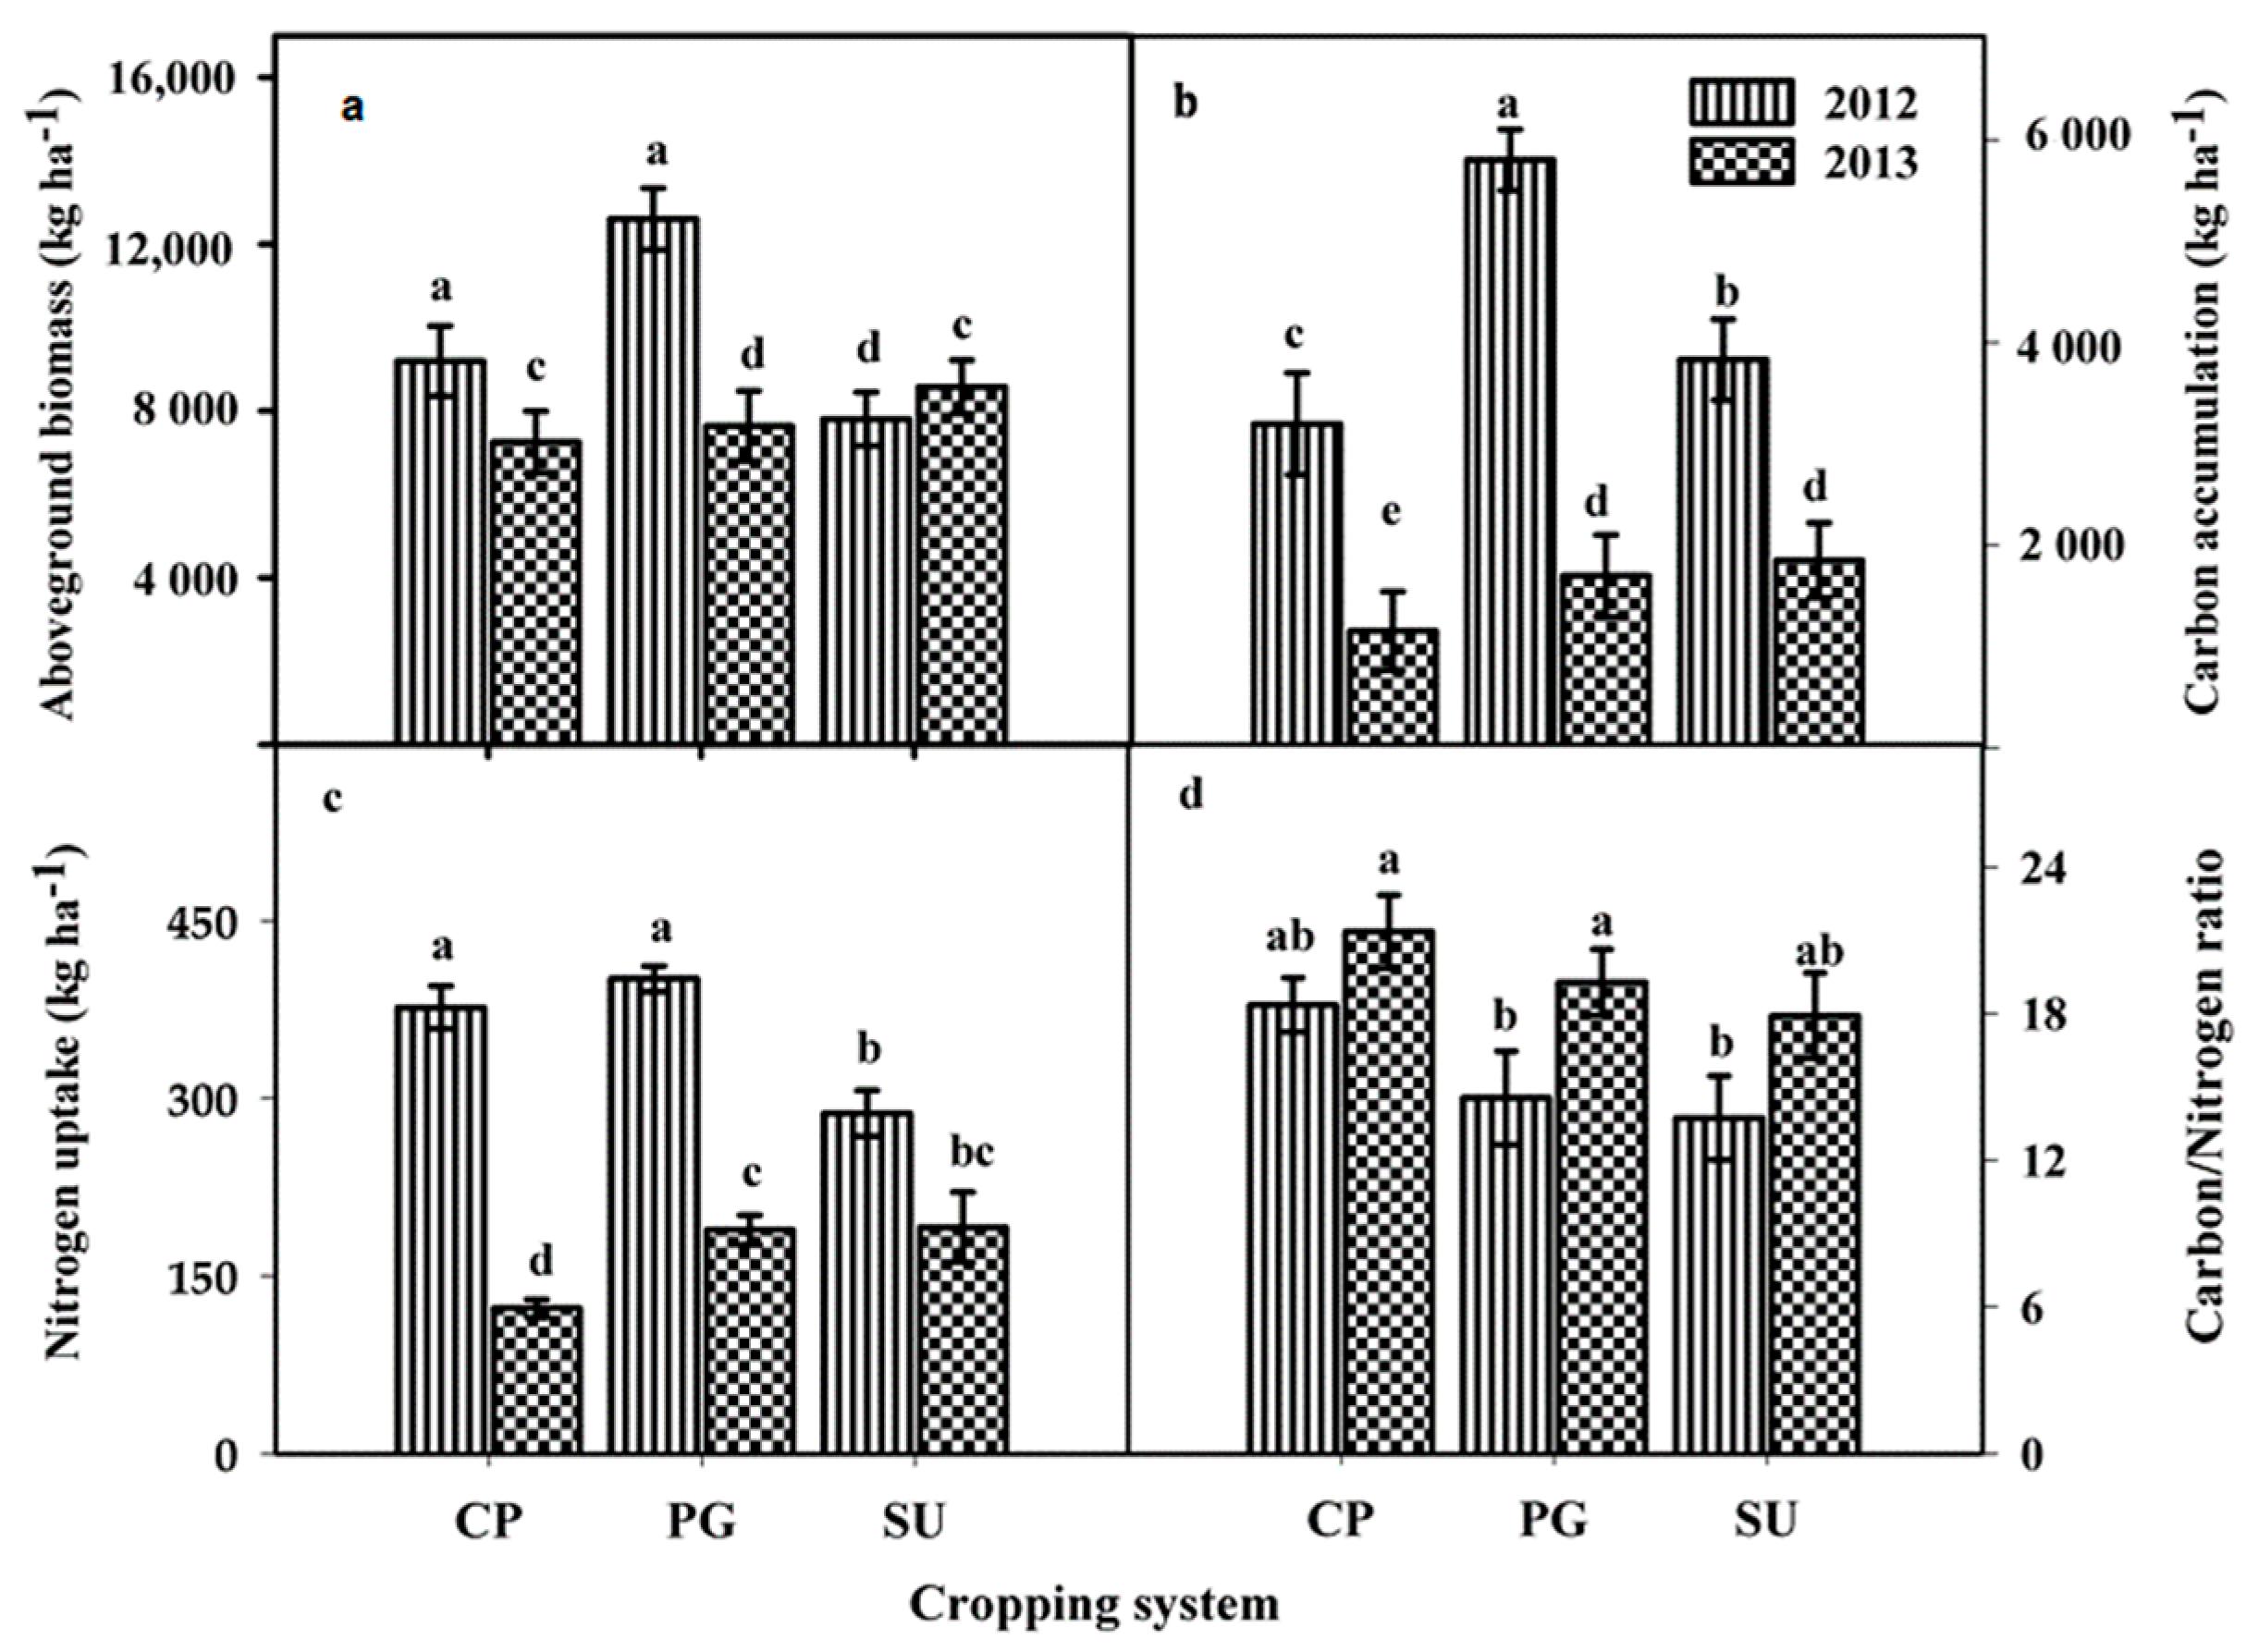
Figure 3). The smaller emissions from pigeon pea and sunn hemp treatments in both years could be due to less water-soluble C, greater accumulation of C and N, or readily decomposable organic C in these plant tissues. The growth, biomass accumulation, and N uptake by cover crops can vary based on adaptability to specific soil and climatic conditions. Among the CC, PG had the greatest C accumulation and aboveground biomass in the relatively drier year of 2012 (338 mm rainfall during CC season), but sunn hemp performed better in the wetter year of 2013 (550 mm rainfall). Overall, performance of all CC was better in 2012 than in 2013 because rainfall was better distributed throughout the cropping season in 2012. These differences in rainfall events explain the difference in total aboveground biomass that eventually influenced N uptake and C accumulation of the various cover crops in 2012 and 2013. Development of crop, soil, and nutrient management practices that decrease N2O emissions would have a significant impact on atmospheric GHG levels and their subsequent effects on climate change [31].
The performance of the grain sorghum crop that followed various cropping systems was significantly influenced by N application and cover crops. Sorghum grain yield was significantly greater with 90N and 180N than in cropping systems with no fertilizer applied; however, sorghum grain yield following the three legume CC: CP, PG, and SU, with 0 kg·N·ha−1 was 42%, 37%, and 14% greater than 0N, respectively, in 2013% and 47%, 49%, and 44%, respectively, in 2014 (Table 6 and Table 7). This result suggests the contribution of N and C from the CC was beneficial to the following cereal grain crop [32]. It also showed that incorporation of the leguminous CC in a cereal production system can help improve N availability, resulting in improved biomass accumulation and grain yield of maize. Leguminous cover crop biomass is a source of organic matter that stimulates soil biologic activity and results in better nutrient and moisture management.
Previous researchers [33] have suggested that it was better to assess N2O emissions as a function of crop yield. In our study, the ratios of N2O cumulative fluxes to grain yields of sorghum in 2013 and 2014 ranged from 178 to 598 and 105 to 571 g N2O-N·Mg·yield−1, respectively (Table 5 and Table 6). Overall, in both years, N2O emissions per unit of grain yield, per unit grain N uptake, or per unit total N uptake was greatest when fertilizer N was added: 180N followed by 90N (Table 4 and Table 5). This result also was reflected in emission factors, which provided the quantity of a pollutant released to the atmosphere with an activity associated with the release of that pollutant. The emission factors in both years was greater in the 180N than in 90N (Table 6 and Table 7), which shows that higher emission factors are usually associated with higher N rates. In both years, sorghum grown after cover crops had greater grain yield, but N emissions per unit grain yield similar to that for the fallow system without N fertilizer. This suggests that legume cover crops supply N to a subsequent sorghum crop in a way that minimizes risk of N2O emissions.
The interrelationships among fertilizer N application, soil water content, crop growth, soil N dynamics, and N losses through N2O emissions during the season are complex. In-season N
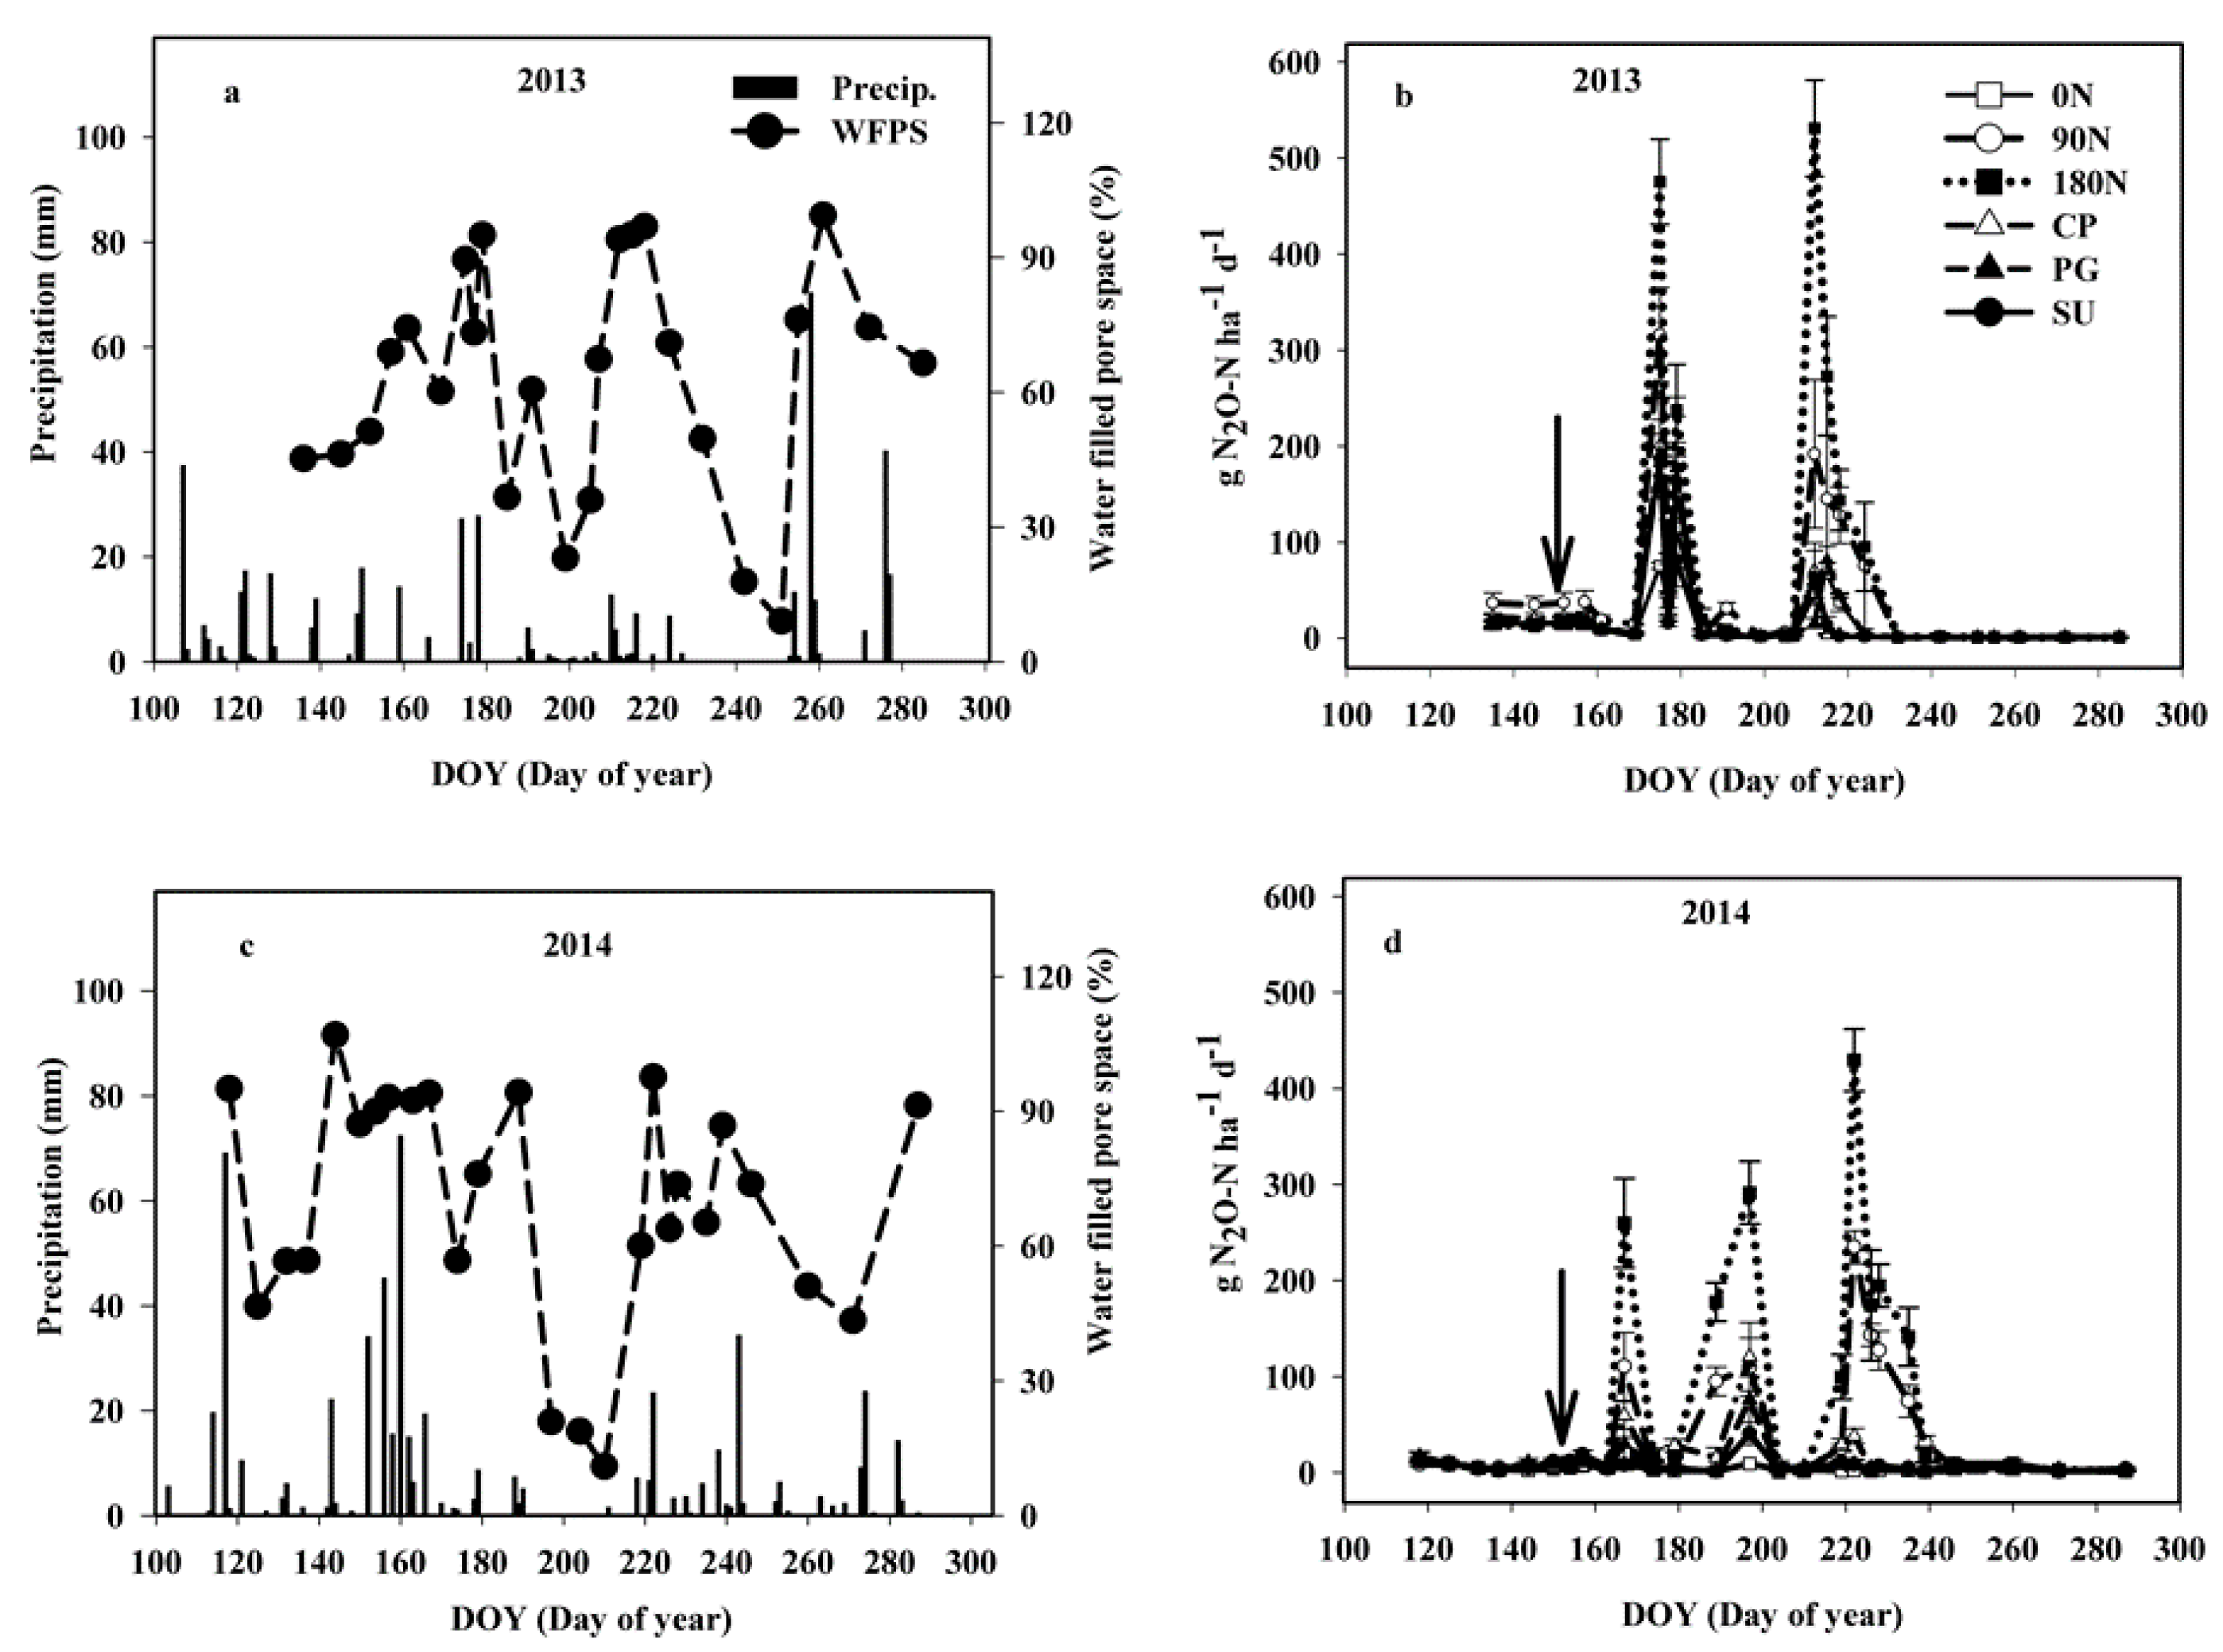
2O emissions were affected by timing of N fertilizer application, rainfall events, and cover crops (Figure 3). The first N2O emission was observed 11 to 15 d after fertilization and depended on the wetness of the soil during fertilizer application. In 2013, the first flux was recorded 15 d after urea application, which was 29.3% of the season emissions, and in 2014 it was 11 d after urea application, which was 33.2% of total season emissions (Figure 3). In a long-term tillage and crop rotation study on silty loam soil in Indiana, [34] researchers found that 50% of the N2O emissions occurred shortly after N fertilizer was applied. Nitrous oxide emissions in the fertilized plots peaked under wet conditions (WFPS > 60%) favorable to denitrification [35]. The 114 mm of precipitation in June through July 2013 was significantly less than the average rainfall (241 mm), but contributed to the wet soil conditions, which favored high N2O losses during the latter part of the growing season. Denitrification and N2O emissions increase with higher WFPS, reaching maximum N2O emission at WFPS values from 60% to 75% and with maximum denitrification occurring at saturation [36].
Nitrous oxide emissions were greater in 2013, with losses from 1.1 to 4.5 kg·N·ha−1·year−1 compared with 2014 losses of 0.46 to 4.4 kg·N·ha−1·year−1. In addition to the influence of fertilizer application and rainfall events, the pool of NO3-N and NH4+-N also can influence timing of N2O emissions [37]. The soil was low in mineral N content (2–5 µg·N·g1) at the beginning of emission measurements in each growing season when N fertilizers were not applied. Soil mineral N concentrations always increased after N-fertilizer application to 15 to 100 µg·N·g1 soil but were never high for longer than three weeks and were always back to less than 10 µg·N·g1soil at the end of the growing season. The high N2O emissions measured from mid-June through early July 2013 also corresponded to large decreases in soil inorganic N at both the 0 to 5-cm and 5 to 15-cm depths. Hence, the variability in precipitation following N application in both years contributed to elevated N2O emissions, especially in 90N and 180N. Correlation between WFPS and emissions from fertilized plots was fairly strong in 2013 (r = 0.58), but strong in 2014 (r = 0.70), illustrating the complexity of interactions between soil water and available pools of soil N and their effect on N2O emissions. The positive correlation of N2O fluxes and soil NO3-N content and WFPS during the entire duration of the study supports the importance of denitrification process for explaining N2O losses in this study site [38,39]. On the other hand, the strong positive correlation of N2O with NH4+-N indicated that nitrification was also a major process leading to N2O fluxes and showed that the continuous drying-wetting periods during summer sorghum crop in a semiarid region can lead to favorable WFPS conditions for both nitrification and denitrification processes (Figure 3). Overall, soil inorganic N in 2014 was greater than in 2013 after N application, which could help explain the contrasting results regarding N2O emissions.

5. Conclusions

Cropping systems significantly influenced N2O emissions, plant N uptake, C accumulation by cover crops, and grain yields of sorghum that followed various systems. Fallow systems with 180 and 90 kg·N·ha−1 produced significantly greater N2O emissions than all other cropping systems. Emissions of N2O were similar for various CC or 0N. Among various cropping systems with cover crops, pigeon pea and cowpea had greater C accumulation and N uptake than sunn hemp. Grain yield of sorghum following different cover crops was similar and usually significantly greater than 0N. Although the fallow systems with 90N and 180N produced maximum grain yields of sorghum, these yields were associated with the greatest N2O emissions per unit grain yield. The N2O emissions per unit of grain yield decreased as the amount of N fertilizer was reduced. We conclude that including leguminous cover crops can reduce N fertilizer requirements for a subsequent sorghum crop, potentially reducing N2O emissions per unit grain yield and providing options for adaptation and mitigation to climate change.

Author Contributions

P.V.V.P. and K.L.R. conceived and designed experiments and guided data collection and analyses. G.Y.M. carried out the experiments, collected and analyzed the data and drafted the manuscript. C.W.R. and J.B.N. guided data collection, laboratory analyses, statistical analysis, data interpretation and edited the manuscript. All authors have read and agreed to publish the final version of the manuscript.

Funding

This research was funded by the United States Agency for International Development (USAID) through the Sustainable Agricultural and Natural Resource Management—Collaborative Research Support Program (SANREM-CRSP); and Center for Sorghum Improvement at Kansas State University. Publication was supported by Feed the Future Innovation Lab for Collaborative Research on Sustainable Intensification (Grant no. AID-OAA-L-14-00006 from USAID). The contents are the sole responsibility of authors and do not reflect the views of funding agencies and organizations. Contribution number 15-343-J from the Kansas Agricultural Experiment Station.

Acknowledgments

The authors thank Peter Tomlinson, Leonardo Bastos, Andrew McGowan and Alix Carole Onmalela Bilip for assistance in measuring nitrous oxide emissions.

Conflicts of Interest

The authors declare no conflict of interest.

References

  1. Robertson, G.P.; Vitousek, P.M. Nitrogen in agriculture: Balancing the cost of an essential resource. Annu. Rev. Environ. Res. 2009, 34, 97–125. [Google Scholar] [CrossRef] [Green Version]
  2. Isermann, K. Agricultures share in the emission of trace gases affecting them climate and some cause–oriented proposals for sufficiently reducing this share. Environ. Pollut. 1994, 83, 95–111. [Google Scholar] [CrossRef]
  3. Myhre, G.; Shindell, D.; Breon, R.; Collins, W.; Fuglestvedt, J.; Huang, J.; Koch, D.; Lamarque, J.; Lee, D.; Mendoza, B.; et al. Anthropogenic and natural radiative forcing. In The Physical Science Basis; Stocker, T.F., Qin, D., Plattner, G., Tignor, M., Allen, S.K., Boschung, J., Nauels, A., Xia, Y., Bex, V., Midgley, P.M., Eds.; Contribution of Working Group I to the Fifth Assessment Report of the Intergovernmental Panel on Climate Change; Cambridge University: Cambridge, UK, 2013; p. 659. [Google Scholar]
  4. Portmann, R.W.; Daniel, J.S.; Ravishankara, A.R. Stratospheric ozone depletion due to nitrous oxide: Influences of other gases. Philos. Trans. R. Soc. B 2012, 367, 1256–1264. [Google Scholar] [CrossRef] [Green Version]
  5. Reay, D.S.; Davidson, E.A.; Smith, K.E.; Smith, P.; Melillo, J.M.; Dentener, R.; Crutzen, P.J. Global agriculture and nitrous oxide emissions. Nat. Clim. Chang. 2012, 2, 410–416. [Google Scholar] [CrossRef]
  6. Drury, C.F.; Reynolds, W.D.; Tan, C.S.; McLaughlin, N.B.; Yang, X.M.; Calder, W.; Oloya, T.O.; Yang, J.Y. Impacts of 49–51 years of fertilization and crop rotation on growing season nitrous oxide emissions, nitrogen uptake and corn yields. Can. J. Soil Sci. 2014, 94, 421–433. [Google Scholar] [CrossRef] [Green Version]
  7. Fageria, N.K.; Baligar, V.C.; Bailey, B.A. Role of cover crops in improving soil and row crop productivity. Commun. Soil Sci. Plant Anal. 2005, 36, 2733–2757. [Google Scholar] [CrossRef]
  8. Jensen, E.S.; Hauggaard–Nielsen, H. How can increased use of biological N2 fixation in agriculture benefit the environment? Plant Soil 2003, 252, 177–186. [Google Scholar] [CrossRef]
  9. Cavigelli, M.A.; Del Grosso, S.J.; Liebig, M.A.; Snyder, C.S.; Fixen, P.E.; Venterea, R. US agricultural nitrous oxide emissions: Context, status, and trends. Front. Ecol. Environ. 2012, 10, 537–546. [Google Scholar] [CrossRef]
  10. Teasdale, J.R. Interaction of light, soil moisture, and temperature with weed suppression by hairy vetch residue. Weed Sci. 1993, 41, 46–51. [Google Scholar] [CrossRef]
  11. Kuo, S.; Sainju, U.M.; Jellum, E.J. Winter cover crop effects on soil organic carbon and carbohydrate in soil. Soil Sci. Soc. Am. J. 1997, 61, 145–152. [Google Scholar] [CrossRef]
  12. Millar, N.; Baggs, E.M. Chemical composition, or quality, of agroforestry residues influences N2O emissions after their addition to soil. Soil Biol. Biochem. 2004, 36, 935–943. [Google Scholar] [CrossRef]
  13. Garcia–Ruiz, R.; Baggs, E.M. Nitrous oxide emissions from soil following combined application of fertiliser–N and ground weed residues. Plant Soil. 2007, 299, 263–274. [Google Scholar] [CrossRef]
  14. Rochette, P.; Angers, D.A.; Belanger, G.; Chantigny, M.H.; Prevost, D.; Levesque, G. Emissions of N2O from alfalfa and soybean crops in eastern Canada. Soil Sci. Soc. Am. J. 2004, 68, 93–506. [Google Scholar] [CrossRef]
  15. CTIC. Report of the 2016–2017 National Cover Crop Survey; Joint Publication of the Conservation Technology Information Center, the North Central Region Sustainable Agriculture Research and Education Program, and the American Seed Trade Association: West Lafayette, IN, USA, 2017. [Google Scholar]
  16. Baranski, M.; Caswell, H.; Claassen, R.; Cherry, C.; Jaglo, K.; Lataille, A. Agricultural Conservation on Working Lands: Trends from 2004 to Present; Technical Bulletin Number 1950; Office of the Chief Economist, United States Department of Agriculture: Washington, DC, USA, 2018.
  17. Hamilton, A.V.; Mortensen, D.A.; Allen, M.K. The state of the cover crop nation and how to set realistic future goals for the popular conservation practice. J. Soil Water Conserv. 2017, 72, 111A–115A. [Google Scholar] [CrossRef]
  18. Eagle, A.J.; Olander, L.P. Greenhouse gas mitigation with agricultural land management activities in the United States: A side–by–side comparison of biophysical potential. Adv. Agron. 2012, 115, 79–179. [Google Scholar]
  19. Mahama, G.Y.; Prasad, P.V.V.; Roozeboom, K.L.; Nippert, J.B.; Rice, C.W. Cover crops, fertilizer nitrogen rates, and economic return of grain sorghum. Agron. J. 2016, 108, 1–16. [Google Scholar] [CrossRef] [Green Version]
  20. Parkin, T.B.; Venterea, R.T. Chamber-Based Trace Gas Flux Measurements. In Sampling Protocols; Follett, R.F., Ed.; United States Department of Agriculture: Washington DC, USA, 2010; pp. 3–39. [Google Scholar]
  21. Jantalia, C.P.; Santos, H.P.; Urquiaga, S.; Boddey, R.M.; Alves, B.J.R. Fluxes of nitrous oxide from soil under different crop rotations and tillage systems in the South of Brazil. Nutr. Cycl. Agroecosyst. 2008, 82, 161–173. [Google Scholar] [CrossRef]
  22. Hanlon, E.A.; Johnson, G.V. Mehlich 3 soil test extractant: A modification of Mehlich 2 extractant. Commun. Soil Sci. Plant Anal. 1984, 15, 277–294. [Google Scholar] [CrossRef]
  23. Bouyoucos, G.J. Hydrometer method improved for making particle size analysis of soils. Agron. J. 1962, 54, 464–465. [Google Scholar] [CrossRef]
  24. Combs, S.M.; Nathan, M.V. Soil organic matter. In Recommended Chemical Soil Test Procedure for the North Central Region, N0. 221 ed.; Brown, J.R., Ed.; NCR Publ.: Columbia, MO, USA, 1998; pp. 57–58. [Google Scholar]
  25. Gelderman, R.H.; Denning, J.L.; Goos, R.J. Chlorides. In Recommended Chemical Soil Test Procedures for the North Central Region, N0. 221 ed.; Brown, J.R., Ed.; NCR Publ.: Columbia, MO, USA, 1998; pp. 53–56. [Google Scholar]
  26. Stehfest, E.; Bouwman, L. Nitrous oxide and NO emission from agricultural fields and soils under natural vegetation: Summarizing available measurement data and modeling of global annual emissions. Nutr. Cycl. Agroecosyst. 2006, 74, 207–228. [Google Scholar] [CrossRef]
  27. Kim, D.G.; Hernandez-Ramirez, G.; Giltrap, G. Linear and nonlinear dependency of direct nitrous oxide emissions on fertilizer nitrogen input: A meta–analysis. Agric. Ecosyst. Environ. 2012, 168, 53–65. [Google Scholar] [CrossRef]
  28. Van Groenigen, J.W.; Kasper, G.J.; Veltho, G.L.; van den Pol–van Dasselaar, A.; Kuikman, P.J. Nitrous oxide emissions from silage maize fields under different mineral nitrogen fertilizer and slurry applications. Plant Soil. 2004, 263, 101–111. [Google Scholar] [CrossRef]
  29. Adviento–Borbe, M.A.A.; Haddix, M.L.; Binder, D.L.; Walters, D.T.; Dobermann, A. Soil greenhouse gas fluxes and global warming potential in four high yielding maize systems. Glob. Chang. Biol. 2007, 13, 1972–1988. [Google Scholar] [CrossRef]
  30. McSwiney, C.P.; Snapp, S.S.; Gentry, L.E. Use of N immobilization to tighten the N cycle in conventional agro ecosystems. Ecol. Appl. 2010, 20, 648–662. [Google Scholar] [CrossRef] [PubMed]
  31. Calderia, K.; Morgan, M.G.; Baldocchi, D.; Brewer, P.G.; Chen, C.T.A.; Nabuurs, G.T.; Nakicenovic, N.; Robertson, G.P. A portfolio of carbon management options. In The Global Carbon Cycle; Field, B., Raupach, M.R., Eds.; Island Press: Washington, DC, USA, 2004; pp. 103–130. [Google Scholar]
  32. Cheruiyot, E.K.; Mumera, L.M.; Nakhone, L.N.; Mwonga, S.M. Rotational effects of legumes on maize performance in the rift valley highlands of Kenya. J. Afr. Crop. Sci. 2001, 9, 667–676. [Google Scholar] [CrossRef]
  33. Van Groenigen, J.W.; Velthof, G.L.; Oenema, O.; van Groenigen, K.J.; van Kessel, C. Towards an agronomic assessment of N2O emissions: A case study for arable crops. Eur. J. Soil Sci. 2010, 61, 903–913. [Google Scholar] [CrossRef]
  34. Omonode, R.A.; Smith, D.R.; Gál, A.; Vyn, T.J. Soil nitrous oxide emissions in corn following three decades of tillage and rotation treatments. Soil Sci. Soc. Am. J. 2010, 75, 152–163. [Google Scholar] [CrossRef] [Green Version]
  35. Mosier, A.R.; Doran, J.W.; Freney, J.R. managing soil denitrification. J. Soil Water Conserv. 2002, 57, 505–512. [Google Scholar]
  36. Almaraz, J.J.; Mabood, F.; Zhou, X.M.; Madramootoo, C.; Rochette, P.; Ma, B.L.; Smith, B.L. Carbon dioxide and nitrous oxide fluxes in corn grown under two tillage systems in southwestern Quebec. Soil Sci. Soc. Am. J. 2009, 73, 113–119. [Google Scholar] [CrossRef]
  37. Hellebrand, H.J.; Scholz, V.; Kern, J. Fertilizer induced nitrous oxide emissions during energy crop cultivation on loamy sand soils. Atmos. Environ. 2008, 42, 8403–8411. [Google Scholar] [CrossRef]
  38. Davidson, E.A. Fluxes of nitrous oxide and nitric acid from terrestrial ecosystem. In Microbial Production and Consumption of Greenhouse Gases: Methane, Nitrous Oxide and Halomethane; Rogers, J.E., Whitman, W.B., Eds.; American Society of Microbiology: Washington, DC, USA, 1991; pp. 219–236. [Google Scholar]
  39. García-Marco, S.; Ravella, S.R.; Chadwick, D.; Vallejo, A.; Gregory, A.S.; Cárdenas, L.M. Ranking factors affecting emissions of GHG from incubated agricultural soils. Eur. J. Soil Sci. 2014, 65, 573–583. [Google Scholar]
Figure 1. Effects of year by cropping system on (a) aboveground biomass, (b) carbon accumulation, (c) nitrogen uptake, and (d) carbon-to-nitrogen ratio of cover crops. Error bars represent standard error of means. Letter on bars describe the significance of the treatments. Bars with same letter are not significantly different based on their standard errors.
Sustainability 12 04403 g001
Figure 2. Effects of date of sampling and cropping systems on (a) NO3-N at 0–5-cm depth in 2013; (b) NO3-N at 5–15-cm depth in 2013 (c) NO3-N at 0–5-cm depth in 2014; (d) NO3-N at 5–15-cm depth in 2014; (e) NH4+-Nat 0–5-cm depth in 2013 (f) NH4+-N at 5–15-cm depth in 2013; (g) NH4+-N at 0–5-cm depth in 2014, and (h) NH4+-N at 5–15-cm depth in 2014. Arrows show the fertilizer application dates (7 June 2013 and 4 June 2014). Error bars on symbols represent standard error of treatment means for that sample date.
Sustainability 12 04403 g002
Figure 3. Daily (a) precipitation and water-filled pore space (WFPS) in 2013, (b) N2O-N emissions in 2013, (c) daily precipitation, and water-filled pore space (WFPS) in 2014, and (d) N2O-N emissions in 2014. Arrows show date of fertilizer application (7 June 2013 and 4 June 2014). Error bars on symbols represent standard error of treatment means for that sample date.
Sustainability 12 04403 g003
Figure 4. Cumulative N2O-N emissions of different cropping systems in (a) 2013 and (b) 2014 growing seasons. Error bars represent standard error of means. Letter on bars describe the significance of the treatments. Bars with same letter are not significantly different based on their standard errors.
Sustainability 12 04403 g004
Table 1. Treatment description of the experiment during the growing seasons.
Treatment CodeCover Crop Planted after Winter Wheat Harvest (CC)Nitrogen Fertilizer Applied to Sorghum at Planting (kg·ha−1)
0NNone0
90NNone90
180NNone180
CPCowpea
Vigna unguiculata L. Walp.
0
PGPigeon pea
Cajanus cajan L. Millsp.
0
SUSunn hemp
Crotalaria juncea L.
0
Table 2. Field plan showing plots/treatments in the experiment during the growing seasons. For details of the treatments, see Table 1.
101, 180N106, 0N201, CP206, 0N
102, SU105, CP202, 180N205, 90N
103, 90N104, PG203, SU204, PG
301, 0N306, CP401, PG406, SU
302, 90N305, PG402, CP405, 180N
303, 180N304, SU403, 0N404, 90N
Table 3. Physical and chemical characteristics of soil from the study site at a depth of 30 cm.
ParametersUnits2012–20132013–2014
Sand%15.017.0
Silt%53.050.0
Clay%32.033.0
pH 7.796.90
Mehlich-3 Pmg·kg−111.212.5
Kmg·kg−1225218
Namg·kg−118.117.9
Clmg·kg−18.808.10
SO4-Smg·kg−12.702.90
Organic Matter%3.142.99
Table 4. Climatic conditions (maximum air temperature, maximum soil temperature, rainfall, and solar radiation) during 2012–2014 growing seasons.
201220132014
MonthMax Air TempMax. Soil TempRainfallSolar RadiationMax Air TempMax. Soil TempRainfallSolar RadiationMax Air TempMax. Soil TempRainfallSolar Radiation
°C°CmmTotal MJ/m2°C°CmmTotal MJ/m2°C°CmmTotal MJ/m2
April22.314.649.719.216.31287.616.119.713.4105.416.4
May28.620.127.224.323.817.99918.82620.94921.6
June32.923.483.826.130.024.588.423.029.325.1224.321.3
July37.427.614.724.931.126.036.820.231.528.117.124.0
August32.323.5106.920.830.625.523.819.533.029.3101.320.2
September27.019.641.616.929.724.8104.718.526.824.029.215.7
October20.014.114.212.720.116.7109.912.521.817.662.513.1
Source: Kansas State University Weather Library.
Table 5. Significance of main effects of year, cropping system, and their interactions from the analysis of variance (ANOVA) for the effect of cover crops growth during 2012 and 2013 growing seasons.
ParameterYear (Y)Cropping SystemInteraction
Cover crop aboveground biomass*****
Cover crop aboveground C accumulation****
Cover crop aboveground N uptake*****
Carbon-to-nitrogen ratio****
*, **, and *** are significant at the p < 0.05, 0.01 and 0.001 level, respectively.
Table 6. Significance of main effects of cropping system (CS), date of sampling (DOS), and their interactions from the analysis of variance (ANOVA) on daily nitrous oxide emissions, cumulative nitrous oxide emissions, nitrate-N, and ammonium-N during 2013 and 2014 growing season.
20132014
Parameter↓/Treatments→CSDOSCS × DOSCSDOSCS × DOS
Daily N2O emissions**************
Cumulative N2O emissions******************
Nitrate-N (0–5 cm)*************
Nitrate-N (5–15 cm)***************
Ammonium-N (0–5 cm)************
Ammonium-N (5–15 cm)***********
N2O, Nitrous oxide, *, **, and *** are significant at the p < 0.05, 0.01, and 0.001 level, respectively.
Table 7. Effects of N rate and cropping systems on cumulative N2O-N emissions, grain yield, N uptake and N2O emission per unit of grain N, and total N uptake of grain sorghum in 2013 growing season.
N2O-N Emissions
Cropping System Grain YieldN UptakeGrain N UptakeTotal N UptakePer Unit of Grain YieldPer Unit Grain N UptakePer Unit Total N UptakeEmission Factor
kg·ha−1g·N·Mg−1g·N·kg−1%
0N4540d36.3b34.6c70.9c246.3c32.2c15.6c
90N7134ab56.1ab55.8ab111.9ab438b50.1b25.2b1.91
180N7581a61.1a62.0a123.2a598a81.4a40.6a2.22
CP6439abc44.3ab46.0bc90.3abc243.0c30.2c16.8bc
PG6228bc43.9ab55.9ab99.8abc178.1c19.8d11.1c
SU5181cd38.6ab42.2bc80.8bc231.7c28.6c14.9c
0N, 90N, and 180N = 0, 90, and 80 kg N ha−1 applied to sorghum crop at planting; CP, PG, and SU = Cowpea, Pigeon pea, or Sunn hemp cover crops planted between wheat harvest and sorghum planting. Estimate of percent of fertilizer N lost via N2O emissions. Values within a column followed by the same letter are not significantly different.
Table 8. Effects of N rate and cropping systems on cumulative N2O-N emissions, grain yield, N uptake and N2O emissions per unit of grain N, and total N uptake of grain sorghum in 2014 growing season.
N2O-N emissions
Cropping System Grain YieldN
Uptake
Grain N UptakeTotal N UptakePer Unit of Grain YieldPer Unit Grain N UptakePer Unit Total N UptakeEmission Factor
kg·ha−1g·N·Mg−1g·N·kg−1%
0N4197b21.8c31.5c53.3c109.3d20.1b11.9cd-
90N6853a46.6c64.4ab110.9a325.8b69.2a40.2a1.98
180N7754a38.6ab84.1a122.7a571.3a54.2ab37.1a2.11
CP6176a24.5c50.7bc75.2b207.3c44.3ab29.9b-
PG6238a29.1b41.9c71.0bc131.1cd30.7b18.1c-
SU6049a30.1bc47.8bc77.9b105.5d17.0b10.4d-
0N, 90N, and 180N = 0, 90, and 80 kg N ha−1 applied to sorghum crop at planting; CP, PG, and SU = Cowpea, Pigeon pea, or Sunn hemp cover crops planted between wheat harvest and sorghum planting. Estimate of percent of fertilizer N lost via N2O emissions. Values within a column followed by the same letter are not significantly different.

