Article

The Application of the Multiple Criteria Decision Aid to Assess Transport Policy Measures Focusing on Innovation

by
Katarzyna Nosal Hoy
,
Katarzyna Solecka
and
Andrzej Szarata
*
Faculty of Civil Engineering, Cracow University of Technology, Warszawska 24, 31-155 Krakow, Poland
*
Author to whom correspondence should be addressed.
Sustainability 2019, 11(5), 1472; https://doi.org/10.3390/su11051472
Submission received: 5 February 2019 / Revised: 26 February 2019 / Accepted: 6 March 2019 / Published: 10 March 2019

Abstract

:
The sustainable development of transport is fostered by innovations. To implement innovations, the European Commission issues different regulations, programs and initiatives and the European Transport Policy has a significant impact on transport policy in the member states. At the same time, transport policy is dynamic and requires new solutions that will allow the planned goals to be achieved. In this context, it is important to analyze the effectiveness of the current innovation policies, and to create recommendations for future actions that bring innovations to the market. This article concerns the subject of innovation policy in the transport sector. It illustrates the possibility of applying one of the methods of the multiple criteria decision aid, i.e., the simple additive weighting (SAW) method to assess the European Union (EU) and national policy measures in surface transport in terms of their influence on the market take-up of innovations. The use of this method allows for the analyzed policy measures to be contemplated in terms of various criteria and to identify those that best meet the adopted criteria, and thus those that could contribute the most to the stimulation of innovation. The article focuses on the method itself, indicating its flexibility and ease of use, while the analyzed collection of policy measures constitutes only the background of the deliberations.

1. Introduction

Transport is one of the strategic sectors of the economy [1] which covers several areas, including: economic, political or tourist in the international, national and regional dimensions [2]. Helping to connect markets plays an important role in the development of international economic relations [3] and is one of the determinants of the competitiveness of the European market [4]. As one of the sectors of the European economy that is subject to legal Community regulations [2], the implementation of the concept of the sustainable development of transport constitutes one of the greatest challenges of the European Union’s (EU) transport policy [5,6,7]. The aim of this concept is to create conditions for the efficient, safe, economically effective, and at the same time socially, economically and spatially justified transport of persons and goods within the limits set by the natural resources available for this purpose and the possibility of releasing pollution resulting from this into the environment [8,9]. The sustainable development of transport is fostered by innovations.
The word innovation, which comes from the Latin language (innovatio—renewal; innovare—to renew), is subject to constant change and is constantly being expanded with the emergence of new concepts [10]. As a result, there is no uniform, universally accepted definition of innovation in literature. For instance, according to Twiss and Goodridge [11] innovation is a process that combines science, technology, economics and management and allows it to achieve novelty and extends from the emergence of the idea to its commercialization in the form of production, exchange and composition. According to Rogers [12], in turn, it involves both knowledge creation and diffusion of existing knowledge. Chlad and Strzelczyk [13] present two ways of defining innovation, while in the first one, they focus on the process, the sequence of activities and in the second on the outcome, e.g., a new solution. The authors point out that innovations may be introduced as forms of new activities, services, products, devices, processes, strategies or systems not commonly used so far. However, the most frequently quoted definition is that introduced by Joseph Schumpeter [14], who treated innovation as a factor of economic development, and his approach is considered a classic one. According to Schumpeter, innovation concerns one of the following five situations [14]:
  • the introduction of a new product that consumers have not yet experienced, or the introduction of new product characteristics;
  • the introduction of a new production method not yet tested in a given field;
  • opening up a new market, i.e., one in which the industry in question had not previously been active;
  • the acquisition of a new source of raw materials or semi-finished products;
  • the new organization of economic processes.
In transport, innovation is understood as actions to improve existing or introduce new solutions or processes concerning all aspects of change and contributing to the economic, financial, technical and technological efficiency, environment of transport systems in order to maximize social effects and results of public and private sector management [15]. Innovations concern both infrastructure and means of transport as well as the organization of transport processes [6,16,17,18]. Examples of innovation would be means of transport greening technologies, for instance alternative, eco-friendly drives or new designs of engines [19,20,21], ICT-related innovations, concerning, e.g., advanced technologies for the collection and analysis of vehicle traffic data [13], passenger information [19] or autonomous vehicles [22].
The development of innovations results from the need to counteract the low efficiency and functionality of transport systems as well as to reduce external costs in the form of pollution, accidents and noise [19,21,22,23,24,25,26,27]. Innovative solutions and tools not only have been changing the way people consume transport and mobility services [28,29], but also are regarded as one of the main sources of competitive advantage in the market [30].
Supporting innovation is an obvious direction of the development of the EU [17,31,32]. The Europe 2020 Strategy published in 2010 [33] is the basis for innovation growth programs within the EU. The strategy indicated the need to develop a knowledge and innovation-based economy, to support a more resource-efficient, more environmentally-friendly and more competitive economy, and to support a high-employment economy that ensures social and territorial cohesion [33]. To implement innovations in the transport market, the European Commission funds different research programs and initiatives [7,17], for example, in the sector of transport and energy, research for SMEs (small- and medium-sized enterprises), and technological or application-oriented programs. Political decisions made by the European Commission towards the environmental and climate protection also form a basis for such calls for proposals. At the same time, the European Transport Policy has a significant impact on the shape and direction of the national transport policy [2], subject to the rules set by the EU. The national transport policy is the influence that the state and public authorities, organizations and institutions, acting on its behalf, have on the transport process and its efficient operation as well as the development of transport in order to achieve all the planned goals [34].
Of note, with the beginning of 2019 the €120bn, the Horizon Europe, a new EU Framework Program for Research and Innovation, passed the initial stage at the EU Parliament (it was approved by the Parliament’s Industry, Research and Energy Committee), and if this program is approved by the EU Parliament and the governments of European member states it will constitute a new basis for the innovation projects growth within the EU [35]. The main aims of the program are to strengthen EU science and technology, to foster industrial competitiveness, and to implement the sustainable development goals. The program would have some new features, such as the European Innovation Council (a new platform supporting high-risk, market-creating innovation projects), EU-wide missions to promote research and innovation outcomes (e.g., for clean transport), and new forms of partnerships, open to all types of stakeholders.
At the same time, it is important to remember that in the near future the EU and the member states will have to face the great challenge of Brexit. It is to be expected that the UK’s exit from the EU will not be without an impact on strategic sectors of the economy and it will also affect the transport industry [36]. Kerridge [37], referring to various future scenarios of Brexit, says: ‘In each case new agreements will be needed to avoid serious disruption in the event of a “no-deal” Brexit that removes the UK from the single market and customs union, with the UK then being regarded as a third country for trade and transport links’ [37]. It will also pose a serious changes for the policy measures and innovations, mentioned in this document, since Britain has been a leader in developing the EU policies of openness, competition, and the single market [37]. On the other hand, as Lyons and Davidson claim [38], who in their paper wanted to examine transport planning and policymaking in the face of an uncertain future, uncertainty is a big challenge, but can also become ‘an opportunity for decision-makers with the realization that they are shaping the future rather than (only) responding to a predicted future’ [38].
Undoubtedly, transport policy is a dynamic field that requires new solutions, programs and legal regulations that will enable it to meet the challenges and achieve the planned goals [2]. In this context, it is, on the one hand important to analyze the effectiveness of the current EU innovation policy and national policies, and on the other hand, to create recommendations for the future policy actions that help to stimulate the development processes and bring innovative technologies, services, solutions and know-how that support sustainable transport development to the market [19].
The subject of stimulating the innovation policy in transport has been taken up in the EU project entitled ‘POlicy measures for innovation in TRANSport sector with special focus on Small- and Medium sized Enterprises-factors and recommendations for success and sustainability’ (acronym: POSMETRANS (see Supplementary Materials)), implemented in 2010–2011, under the 7th EU Framework Program [39]. The POSMETRANS project explored the efficiency of the European and national policy measures for innovation in the surface transport sector. Particular emphasis was placed on the analysis of the impact of these policies on small and medium enterprises. The project focused on innovative processes in two areas: (1) public transport and (2) freight transport and logistics. In each of these areas, the analysis of innovative solutions for the means and infrastructure of road, rail and water transport were carried out. Innovations were included in the following five thematic areas: green technologies, new materials, information and communication technologies, safety and security and co-modality. Research on the extension of transport innovations throughout the market was also conducted. Trends which foster the innovation process and key players in innovation were identified and analyzed. The conducted research and analyses enabled a comprehensive assessment of the tools being used by the EU to support innovation in transport, and elaborate recommendations for the future European policy in order to accelerate the market take-up of innovative technologies and processes in surface transport related to SMEs [40].
This article presents a method developed on the basis of the authors’ own experience from the POSMETRANS project, where the main tool was the multiple criteria decision aid (MCDA) used for the assessment of the EU and national policy measures in surface transport in terms of their influence on the market take-up of innovation technologies and processes. As the final result of the assessment, rankings of policy measures from best to worst were obtained (rankings indicating the measures that can stimulate innovation in the greatest and in the smallest extent). Information on the MCDA method, that was used to assess policy measures, is presented in Section 2, while the procedure of the assessment, along with the selected final rankings of policy measures—in Section 3.

2. Method

This section provides general information about MCDA and presents one of its methods, i.e., the simple additive weighting (SAW) method, which was used to assess policy measures in terms of their influence on the market take-up of innovations.

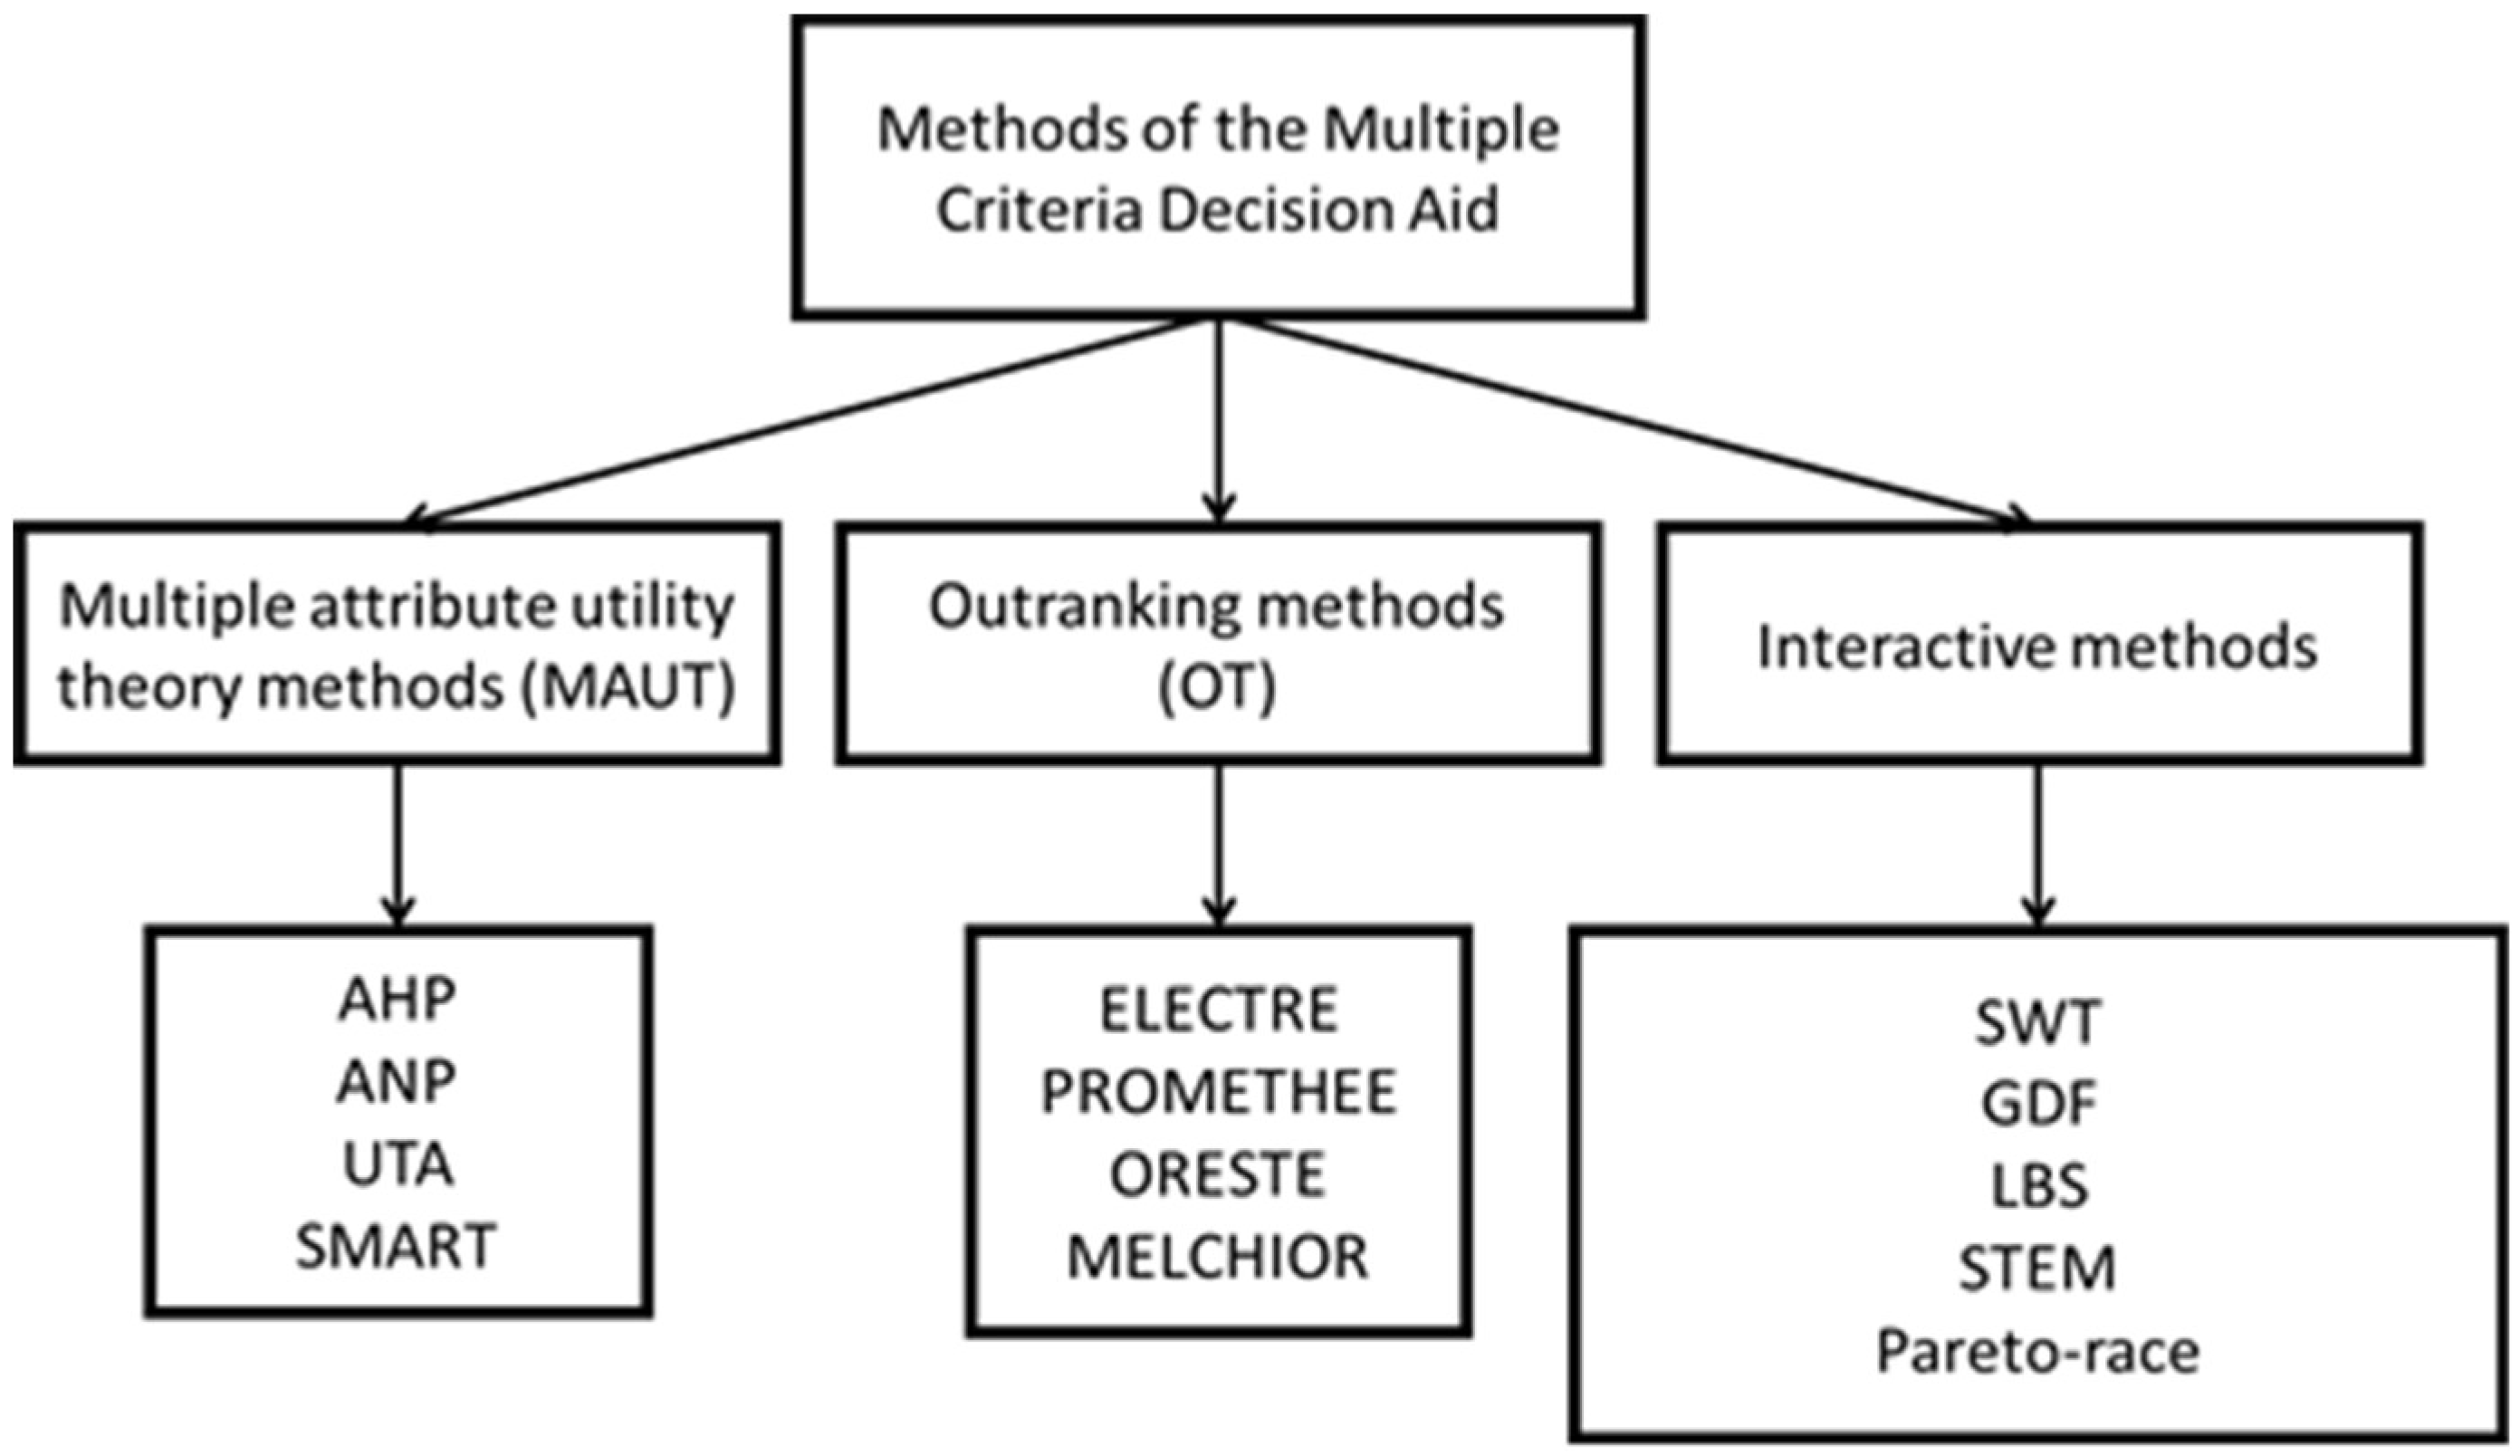
2.1. General Information about the Multiple Criteria Decision Aid (MCDA)

MCDA is a methodology derived from operational research, alternatively called multiple criteria analysis or multiple criteria decision aid process [41,42,43]. In the study of Zeleny [43], MCDA is defined as making decisions in the presence of many criteria/objectives, whereas in the work of Vincke [42], as solving complex decision problems where many, often opposing points of view, must be considered. MCDA is a methodology that has been dynamically developing in recent years [44,45].
According to Roy, the basic attributes of MCDA problems are [46]: a set A of solutions and a coherent family F of assessment criteria. The set A of solutions is a set of decision objects, variants, actions or activities to be analyzed and assessed during the decision-making process. The set A of solutions may be defined: directly by listing all its elements (a sufficiently small set, a definite number of objects) and indirectly, by defining properties that characterize all the elements of set A or conditions limiting set A. The set A may be defined in advance and not subject to changes during the decision-making process or evolving (varying), i.e., subject to modifications during the decision-making process.
A cohesive family F of criteria [46] is a set of criteria that meet the following requirements: exhaustiveness of the assessment (contemplating all possible aspects of the problem under consideration), consistency of assessment (based on proper determination of global decision preferences by the criterion) and the uniqueness of the criteria ranges. Each criterion present in the set F is a function f defined on the set A to assess the set A and representing the preferences of the decision maker in relation to a particular decision problem.
A multi-criteria decision problem is a situation in which, having a defined set A of solutions (actions, variants) and a coherent family F of criteria, the decision maker (DM) seeks to [24]:
  • determine the subset of solutions (actions, variants) considered to be the best for the family of criteria under consideration (choice problem);
  • divide the set of solutions (actions, variants) into subsets according to certain standards (problem of classification or sorting);
  • rank the set of solutions (actions, variants) from best to worst (problem of positioning or ranking).
The MCDA methodology identifies the main participants in the decision-making process, i.e., the decision maker, analyst and other entities interested in solving a given decision problem. The decision maker (individual or collective) determines the objectives of the decision-making process, expresses preferences and ultimately assesses the solutions obtained. The analyst is an external entity in relation to the considered decision problem. S/he is responsible for supporting the decision aid process (including the construction of a decision model, selection of methods and tools to solve the problem, etc.). S/he explains the consequences of making a given decision to the decision-maker and ultimately recommends a solution. As Zmuda-Trzebiatowski claims, those who intervene in the decision-making process are, for example, principals-clients, local community, employees, etc. [47].
In the available literature there are many classifications of MCDA methods. The most popular is the classification presented by Vincke [42], who divided the methods of multi-criteria decision aid into three groups: methods of multi-attribute usability theory, methods based on surpassing relations, interactive methods (Figure 1).
Methods of multi-attribute usability theory or synthesis to a single criterion derive from the so-called American school and consist in aggregation of different criteria (points of view) to a single optimized, additive usability function. As a result, the multi-criteria function of the goal is reduced to one global criterion, i.e., the usability function. The most popular methods that belong to this group include: the Analytic Hierarchy Process (AHP) [48], Analytic Network Process (ANP) [49], UTility Additive (UTA) [50] and many others.
Surpassing methods belong to the so-called European school. In these methods, the preference of the decision-maker is aggregated by means of a surpassing relation, which allows for incomparability between the considered options (solutions, actions), i.e., a situation in which the decision-maker is not able to identify a better one with two options, the decision-maker does not see discrepancies and fundamental differences between the options [46]. Therefore, they are neither able to consider them equivalent nor to identify the better of the two options. In this group, the most popular methods are: ELimination and Choice Expressing REality (Electre) [47], Preference Ranking Organization METHod for Enrichment of Evaluations (Promethee) [51,52] and Organization, Rangement Et Synthese De Donnes Relationnelles (Oreste) [53].
Interactive (dialogue) methods are a group of methods in which preferences are set in dialogue mode. The interweaving of the computing phase and the decision-making phase are specific, i.e., the dialogue with the decision-maker. In the first stage, the decision-maker obtains a set of compromise solutions. In the second stage, it evaluates the set, introducing additional preferential information. In this group of methods, the most popular methods are Surrogate Worth Trade–Off (SWT) [54] Geoffrion-Dyer-Feinberg (GDF) [55], Light Beam Search (LBS) [56], Step Method (STEM) [57], Pareto-Race [58]. The majority of the interactive methods are used in multi-criteria mathematical programming. Moreover, it is worth mentioning that interactive (dialog) methods can be classified as follows [59]:
  • search-oriented methods, i.e., methods building a local approximation of the usability function with an indirect or direct formula of its construction, e.g., the GDF method [55] and methods narrowing the reviewed area of the non-dominated set, where the decision-maker limits the reviewed area by selecting the best variant from a representative sample or defining additional limitations. This group includes, e.g., methods by Steuer [41], Choo and Atkins [60].
  • learning-oriented methods, e.g., reference point method, reference direction method (Wierzbicki [61], Pareto-Race [58]).
Due to the nature of the decision-making problem (more precisely the purpose of the decision-making process), the method of multi-criteria decision aid can be divided into [59]:
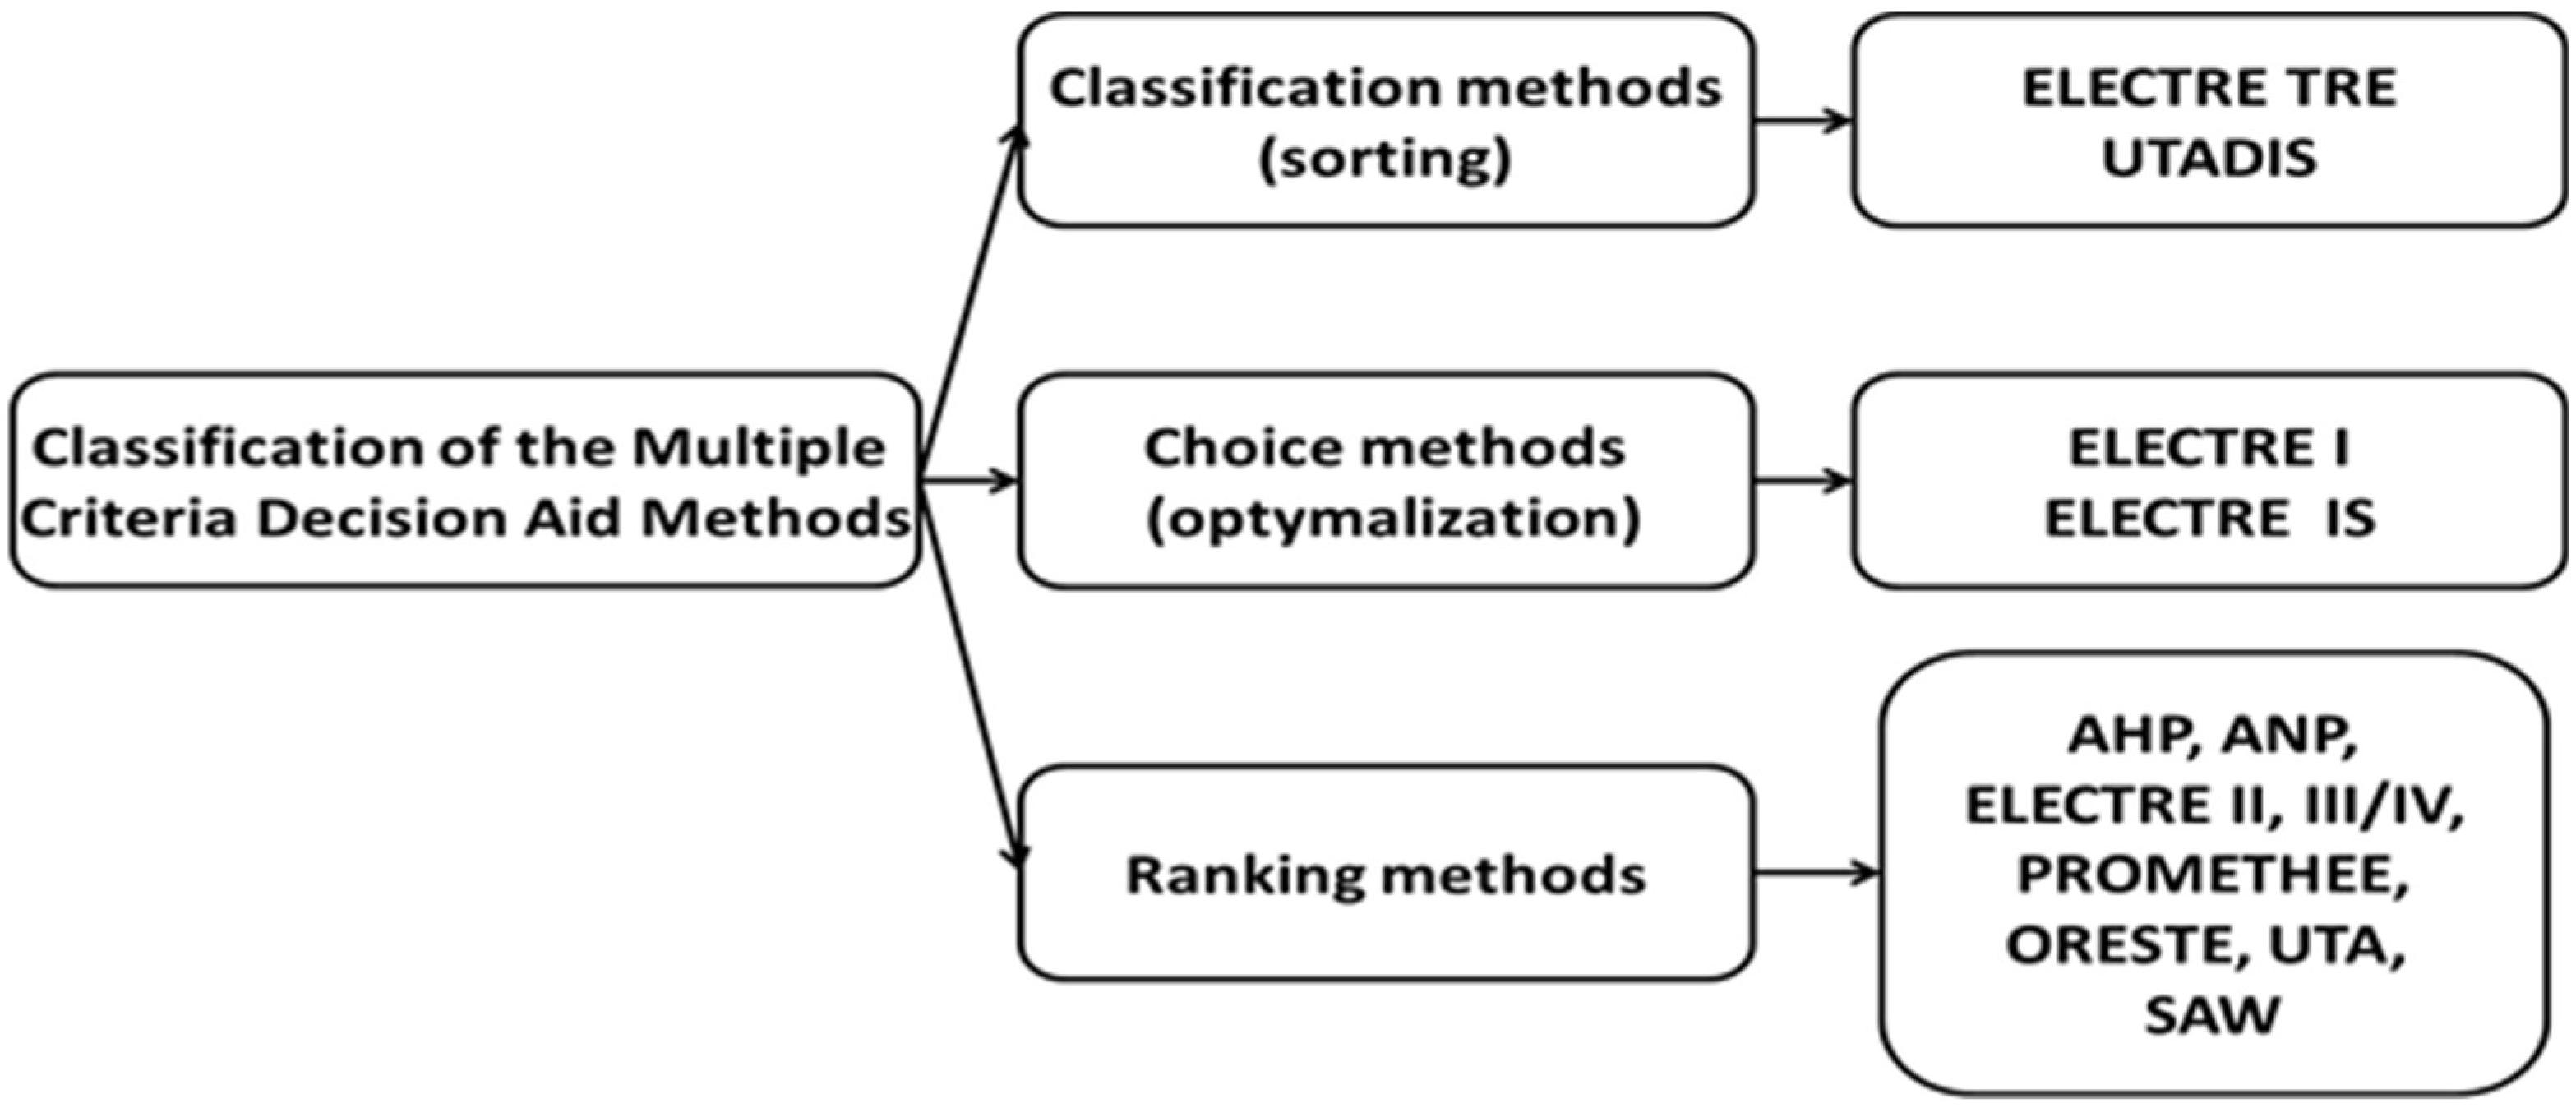
  • multi-criteria selection (optimization) methods;
  • multi-criteria ordering methods (ranking, ranking);
  • multi-criteria grading (sorting) methods.
Of note, this division corresponds to the general categorization of multi-criteria decision-making problems (described above in the article). The above division of methods together with exemplary methods that belong to particular groups is presented in Figure 2.
The most popular include methods for positioning solutions (actions, variants), such as: AHP [48], ANP [49], UTA [50], SAW [62], Electre [29], Promethee [51,52] and Oreste [53]. Of note, speaking of the above MCDA methods, some of them belong to the group of methods based on the principle of multiple attribute utility theory (MAUT) called synthesis methods for a single criterion, that do not contemplate the incomparability between the considered solutions (actions, variants) (methods: UTA, AHP, ANP, SAW), and some of them are methods based on the exceedance relation (OT), called methods of synthesis outweighing the incomparability between the considered solutions (actions, variants) (Electre, Promethee, Oreste). There are also methods that are a combination of the two previous MAUT and OT approaches, e.g., the Mappac method (multicriterion analysis of preferences by means of pairwise action and criterion comparisons) [63]. The above-mentioned methods are often used to solve complex decision problems in various areas of life, including transport problems. For example, Kijewska et al. applied the AHP for choosing and analyzing the measures for the distribution of goods [64]), while Hemalatha et al. to evaluate the service quality and obtain the ranking of container terminal operators [65]. Lon et al. as well as Al-Atawi et al. used the same method for the evaluation of the public transport policy design [66] and sustainable transport strategies [67], while Lopez-Iglesias et al. used it to access mobility innovations for sustainability and cohesion of rural areas [68]. In research conducted by de Luca [69] and Chowdhury et al. [70] the AHP was used in order to understand and quantify public preferences in a process of transportation planning. Nosal and Solecka applied the AHP to assess different variants of integration of urban public transport in Krakow [71]. Taleai and Yameqani [72] not only used the AHP method but also integrated it with a geographic information system (GIS) and remote sensing tools in order to search for the healthy walking paths. The results show that the simultaneous use of the above-mentioned methods can help provide both, urban planners and the public with the data and tools needed to take into account different criteria, when choosing to travel within a city. Kiciński et al. [73] presented the example of the application of ELECTRE III in choosing the variant of travel made by public and private transport modes, while Popiolek and Thais [74] implemented the same method to select the best policies in favor of solar mobility in France. These and other types of MCDA, such as ANP and PROMETHEE, were presented in Solecka’s research in the multiple criteria assessment of variants of the integrated urban transport system [75]. Nassereddine and Eskandari applied the PROMETHEE method to evaluate public transportation systems in Tehran [76]. Rudnicki recommends the SAW method for the comparison of solutions related to the quality of public transport service [77]. Ivanović et al. presented the multicriteria analysis model to analyze three alternatives of street reconstruction into a pedestrian area [78]. The results of the review made by Mardani et al. who analyzed 89 cases of the MCDA application in transportation system problems, showed that AHP and fuzzy-AHP methods in the individual methods and hybrid MCDM and fuzzy MCDM in the integrated methods were ranked as the first and second methods in use, respectively [79]. Macharis and Bernardini, [80] in their paper, giving an overview of the use of the MCDA for transport project appraisal, highlighted the importance of integrating stakeholders in the decision process, which is not yet very common in the transport projects. The multi-actor multi-criteria analysis (MAMCA) approach suggested by them allows the stakeholders to be involved explicitly in the decision-making process.

2.2. Simple Additive Weighting (SAW) Method

The SAW method [62] expresses the principle of ‘something for something’. Failing at meeting one criterion can be compensated by a higher fulfilment of another criterion. The method includes the following elements of the assessment procedure:
  • formulation of a list of criteria in a one-stage or multi-stage system;
  • determination of the weights of the criteria;
  • determination of threshold criteria;
  • assessment of the degree of fulfilment of individual criteria by the solutions in question and the determination of the required minimum fulfilment for the threshold criteria;
  • elimination of solutions that do not meet the threshold criteria;
  • aggregation of partial assessments, obtaining a global assessment;
  • ordering solutions by values due to the global rating indicator.
The global assessment Sj of the j-solution is determined by the following formula:
S j = i = 1 n w i · s i j
where:
  • s i j —degree of fulfilment of the i-criterion in the j-solution (in percent on a scale from 0%–100%, where 0% means no compliance with the criterion, and 100% means complete compliance with the criterion or on a 10-point scale, where 1 means that the criterion is not met and 10 means complete fulfillment of the criterion),
  • n—the number of criteria considered,
  • w i —weight of the i-criterion (non-rendered number, normalized), w i > 0 .
i = 1 n w i = 1
To determine the weights of the criteria and the degree of fulfillment of a given criterion, data from expert opinions are usually used. Based on the formula (1), the values of Sj are obtained on a scale of 1 to 10 points. The calculated values of Sj for particular considered solutions allow their global (aggregated) quality to be assessed. The higher the Sj value, the solution (action, variant) is considered to be better.

3. Application and Results of the SAW Method in Assessing Policy Measures Focusing on Innovation

In the analyses presented in this article, the SAW method was used to assess policy measures focusing on innovation. The analyzed decision problem was defined as a multi-criteria problem of categorizing the EU/regional and national policy measures. For the purposes of the calculation, 62 policy measures were adopted, and they were divided into the following six categories for structuring the analysis:
  • EU/regional level measures: funding program (14 measures), law/regulation (42 measures), action plan/guidelines (32 measures);
  • national level measures: funding program (25 measures), law/regulation (17 measures), action plan/ guidelines (32 measures).
    The policy measures adopted for the analysis were provided by 10 experts (in an expert survey) working in the following areas: research institutions, industry and technology transfer and SME intermediaries. They represented 5 European countries and the following units:
  • Steinbeis-Europa-Zentrum (DE), responsible for the support of the European research projects and trans-national co-operation in Europe;
  • ACCIONA (ES)—a Spanish conglomerate with leadership in, among others, energy, logistic and transport, water and urban services;
  • EGE University Scientific and Technology Centre (TR), providing an institutional structure for the industry–academia partnerships and acting as a regional contact point for universities, research centers, SMEs, industrial associations, regional authorities and non-governmental organizations (NGOs);
  • Institut fur Verkehrs und Tourismus Forschung (DE), specializing in research and consultancy in the field of mobility, transport, traffic and tourism;
  • Cracow University of Technology (PL), represented by the Technology Transfer Center (the unit responsible for technology transfer, facilitating contacts between academia, industry and regional stakeholders and the promotion of entrepreneurship) and the Institute of Road and Railway Engineering operating, among others, in the field of transport planning and transport policy;
  • the Unioncamere Piemonte (IT), supporting the Piedmont Chambers of Commerce with regards to innovation and technology transfer matters and services.
The choice of policy measures was dictated by consultations with experts, the availability of full versions of the materials and the possibility of proper interpretation of documents, taking their sectorial importance into account. The consultations with experts familiar with the local conditions having a strong impact on the shape and scope of the analyzed documents and played a very important role. As a result, a consistent set of input data was obtained, ensuring the representativeness of the thematic areas and issues. This article focuses on the method itself, indicating its flexibility and ease of use, while the analyzed collection of documents constitutes only the background of the deliberations.

3.1. Definition of the Criteria

Considering the requirements of defining a cohesive set of criteria (exhaustiveness of assessment, consistency of the assessment and uniqueness of the criteria ranges of meaning [46]) to assess the analyzed policy measures in terms of their impact on the development of innovation, the criteria for the following four groups were proposed by experts: functional, economic, social and environmental. Initially, a total of 15 criteria were adopted, and then—to reduce their number—weights from 1 to 5 were assigned to each criterion, where 1 meant the lowest weight (unimportant criterion), and 5 meant the highest weight (very important criterion). The weights were assigned by experts. In the further assessment procedure, only those criteria that obtained the highest average weight values were taken into consideration, according to the following rules:
  • criteria with the weight: ≤5,4≥ are accepted;
  • criteria with the weight: <4,3≥ are in question;
  • criteria with the weight: <3,0≥are rejected.
In the case of criteria in question, only one criterion, concerning the environmental aspect, was adopted (in order to include this aspect as well). The rest of them were rejected. One of the criteria which obtained the highest values—the “Total allocated budget” criterion, related to the height of the total allocated budget—was rejected, since it was only applicable to the funding programs. Finally, 7 criteria assigned to 4 groups were taken for the analysis. The adopted criteria are summarized in Table 1.

3.2. Calculation Experiment and Final Rankings of the Policy Measures

In the next stage, a multiple criteria assessment of the adopted policy measures was conducted. For this purpose, weights for each group of criteria (functional, economic, social and environmental) were determined, and then for individual criteria in these groups. Weights on a scale from 1 to 5 were assigned, where 1 meant the lowest weight (unimportant criterion) and 5—the highest weight (very important criterion). The weights assigned by experts have been averaged and normalized in accordance with the SAW method procedure (Table 2).
Subsequently, the degree sij of meeting the criteria by each policy measures was determined. The assessments of the fulfilment level of criteria by the policy measures are of a subjective nature and were provided by the experts. The global assessment value Sj of the j-policy measure is calculated as the sum of the products of the weights wi of the criterion in the full collection and the assessments sij of the fulfilment degrees of the criterion by the policy measure (according to Equation (1)). After calculating the global values for individual measures, their final ranking (from the best to the worst policy measure according to the considered assessment criteria, i.e., from the measure, that stimulates innovation to the greatest extent, to the measure that influences this development to the smallest extent) was carried out. The rankings were created for all six categories of policy measures under consideration, i.e., the EU funding program, law/regulation and action plan/guidelines as well as national funding program, law/regulation and action plan/guidelines. Table 3 presents an example of the results obtained from the computational experiments for the policy measures at the EU/regional level in terms of the action plan/guidelines. The table lists only the first positions in the ranking, i.e., measures, which achieved the global assessment value Sj above 60%. In the presented ranking the EU/regional action plans/guidelines, which largely stimulate innovation are the ‘Alpine convention: Transport and Mobility on the Alps’, ‘Cooperation on Alpine Railway Corridors’ and ‘EU Strategy for Bio fuels’. They obtained the highest global assessment values Sj. The global assessment value Sj for ‘Transport and Mobility on the Alps’ equals 86.77%, for ‘Cooperation on Alpine Railway Corridors’ equals 78.32% and for ‘EU Strategy for Bio fuels’—74.41%. The first score in the policy measure ranking exceeds the remaining two policy measures by 8.45 and 12.36 percentage points, respectively. The difference between the second and third in the policy measure ranking is small and amounts to 3.91 percentage points. The policy measure, which is the first in the ranking, is the only one to meet 100% four of the seven adopted criteria (C2, C4, C6 and C7), including criteria characterized by high weights (C4, C6, C7), and belonging to the group of criteria of the highest importance (C6—economic criterion), which has an impact on such a high position in the ranking. When compared to other policy measures, it also has a fairly high degree of compliance with criteria C1 and C3. A policy measure ranked second in the ranking meets three out of seven criteria (C4, C6 and C7) in 100% and two out of seven criteria (C4 and C7) in third place. Although there are several other policy measures in the ranking with 100% compliance with the highest weighting criteria, i.e., C4 and C7, the relatively high compliance with criterion C6 provides a third policy measure in the ranking with an advantage over them.

3.3. Sensitivity Analysis

An important aspect in the presented approach of the multiple criterion assessment of the policy measures is the sensitivity analysis of the results. It consists in determining the impact of changing the meaning of individual elements on the results obtained (on the final ranking of the policy measures) and shows the stability of the rankings obtained as a result of the changes introduced. The sensitivity analysis was conducted in two ways:
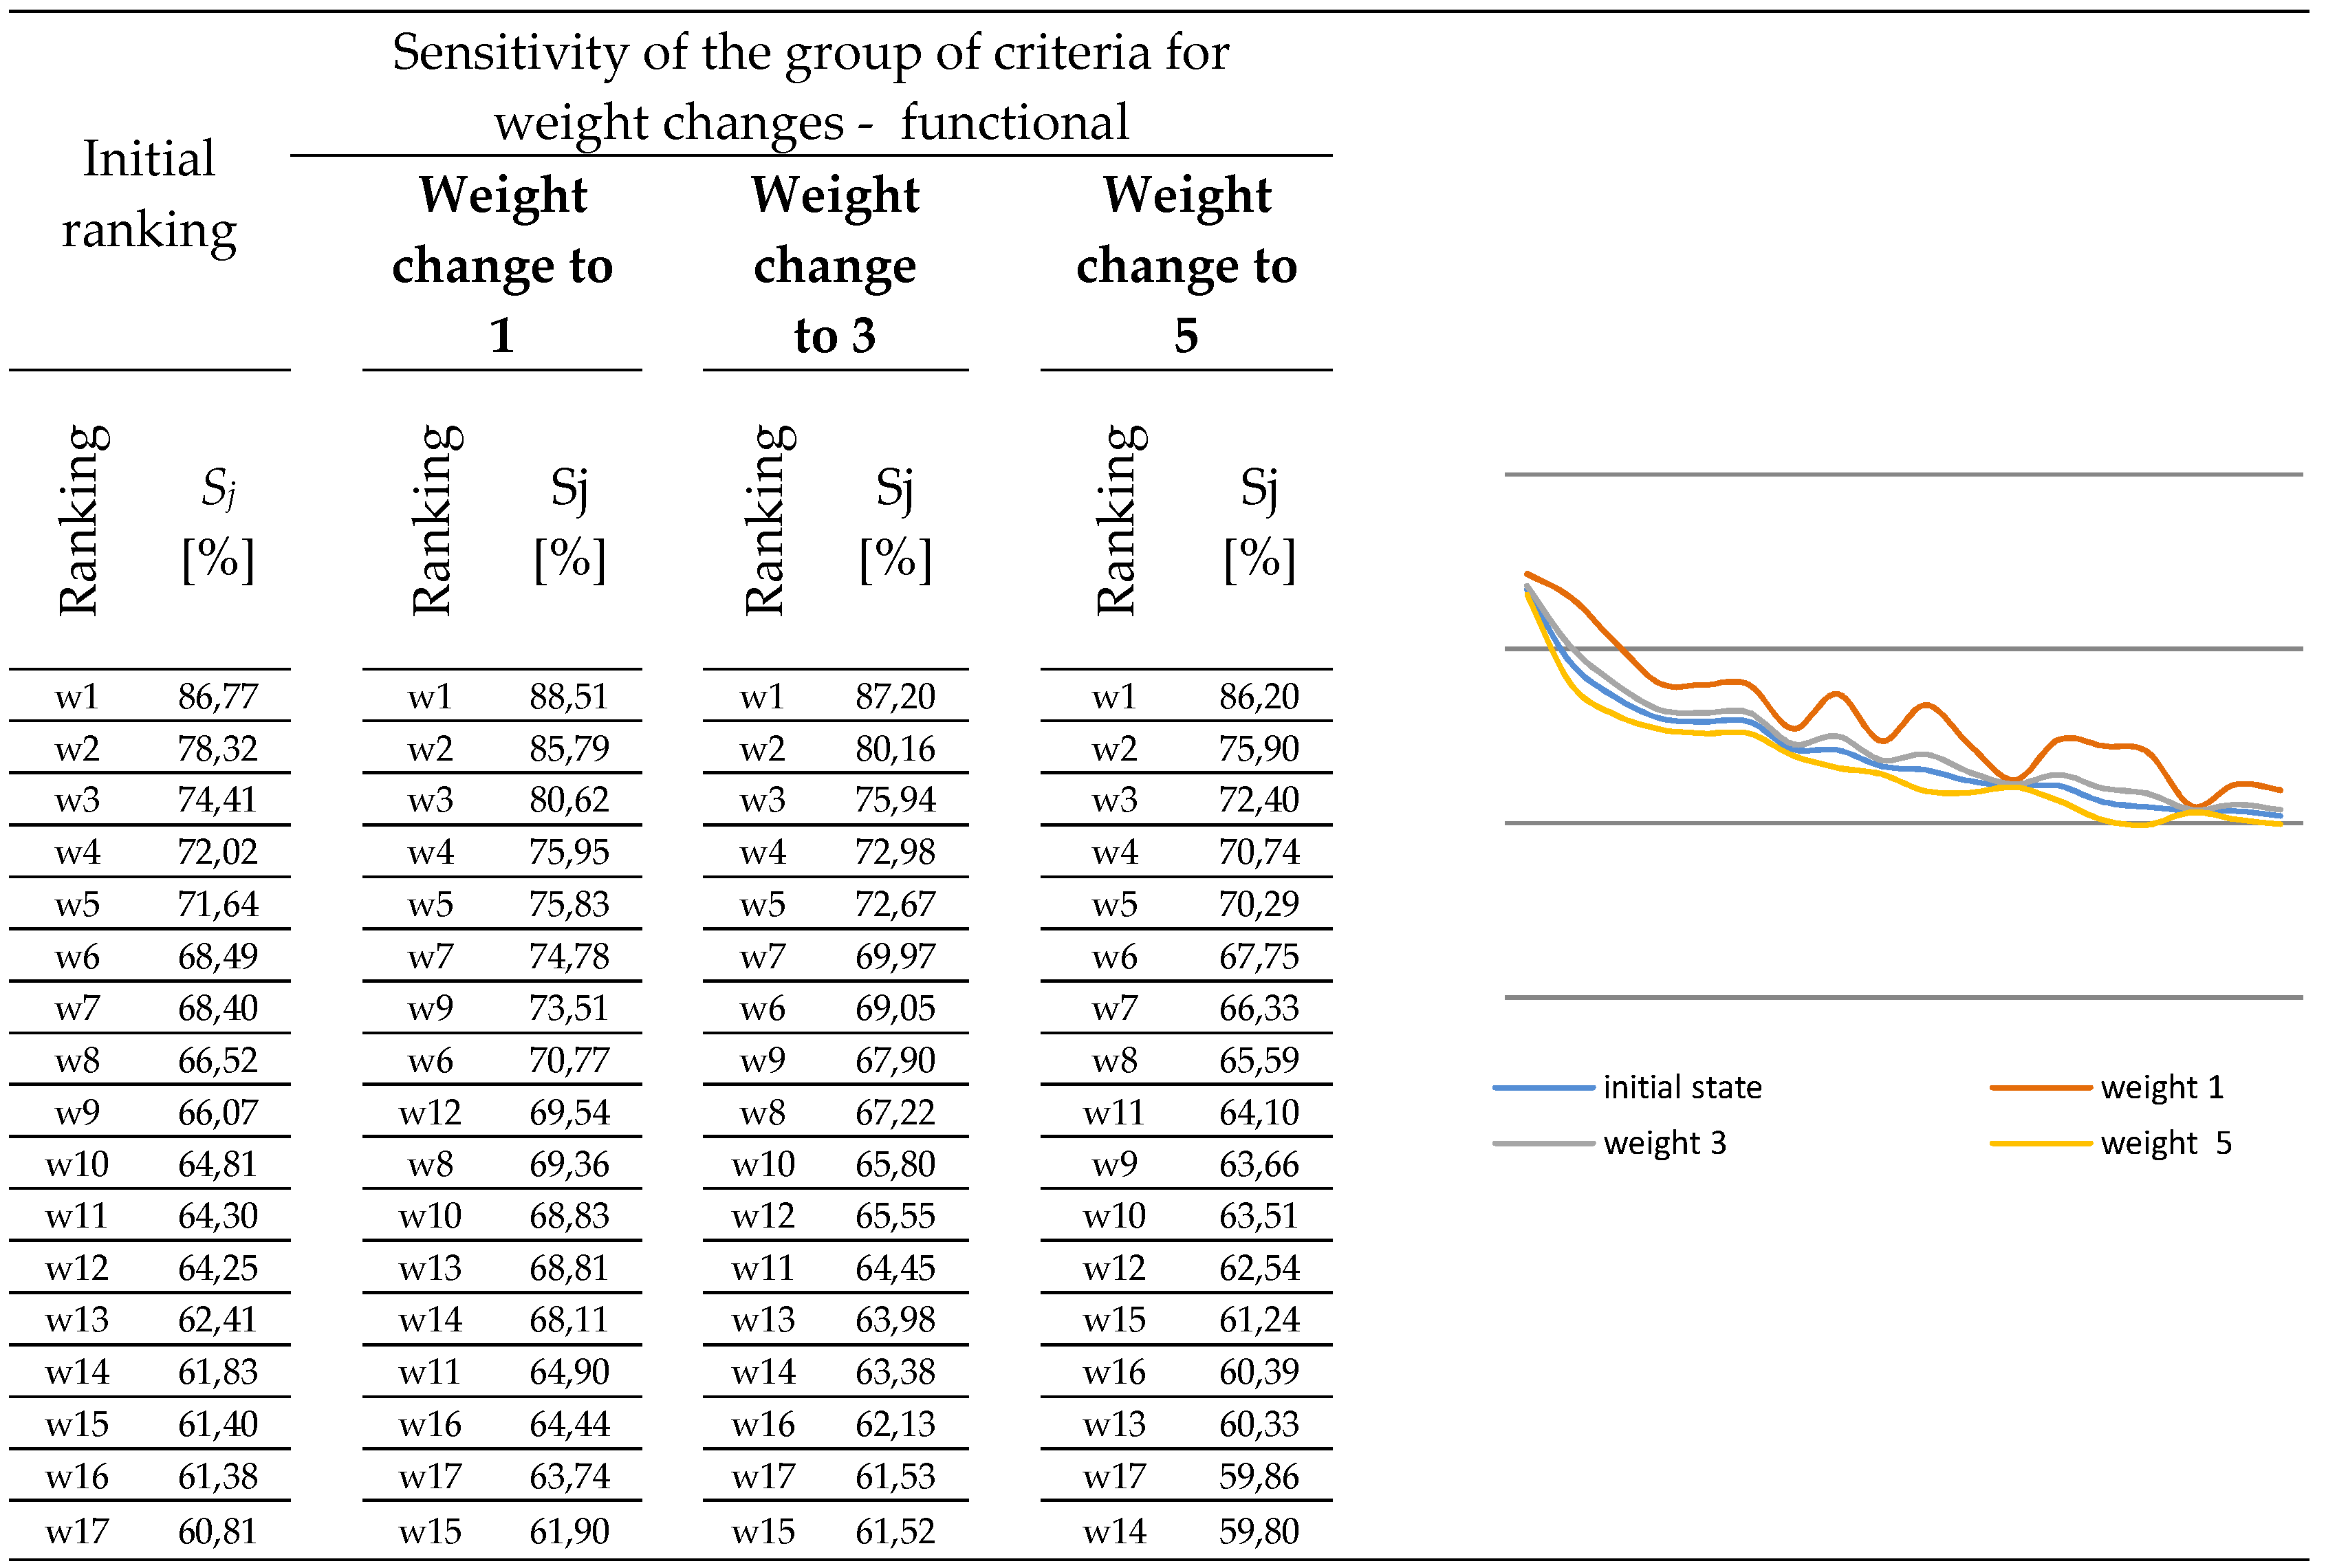
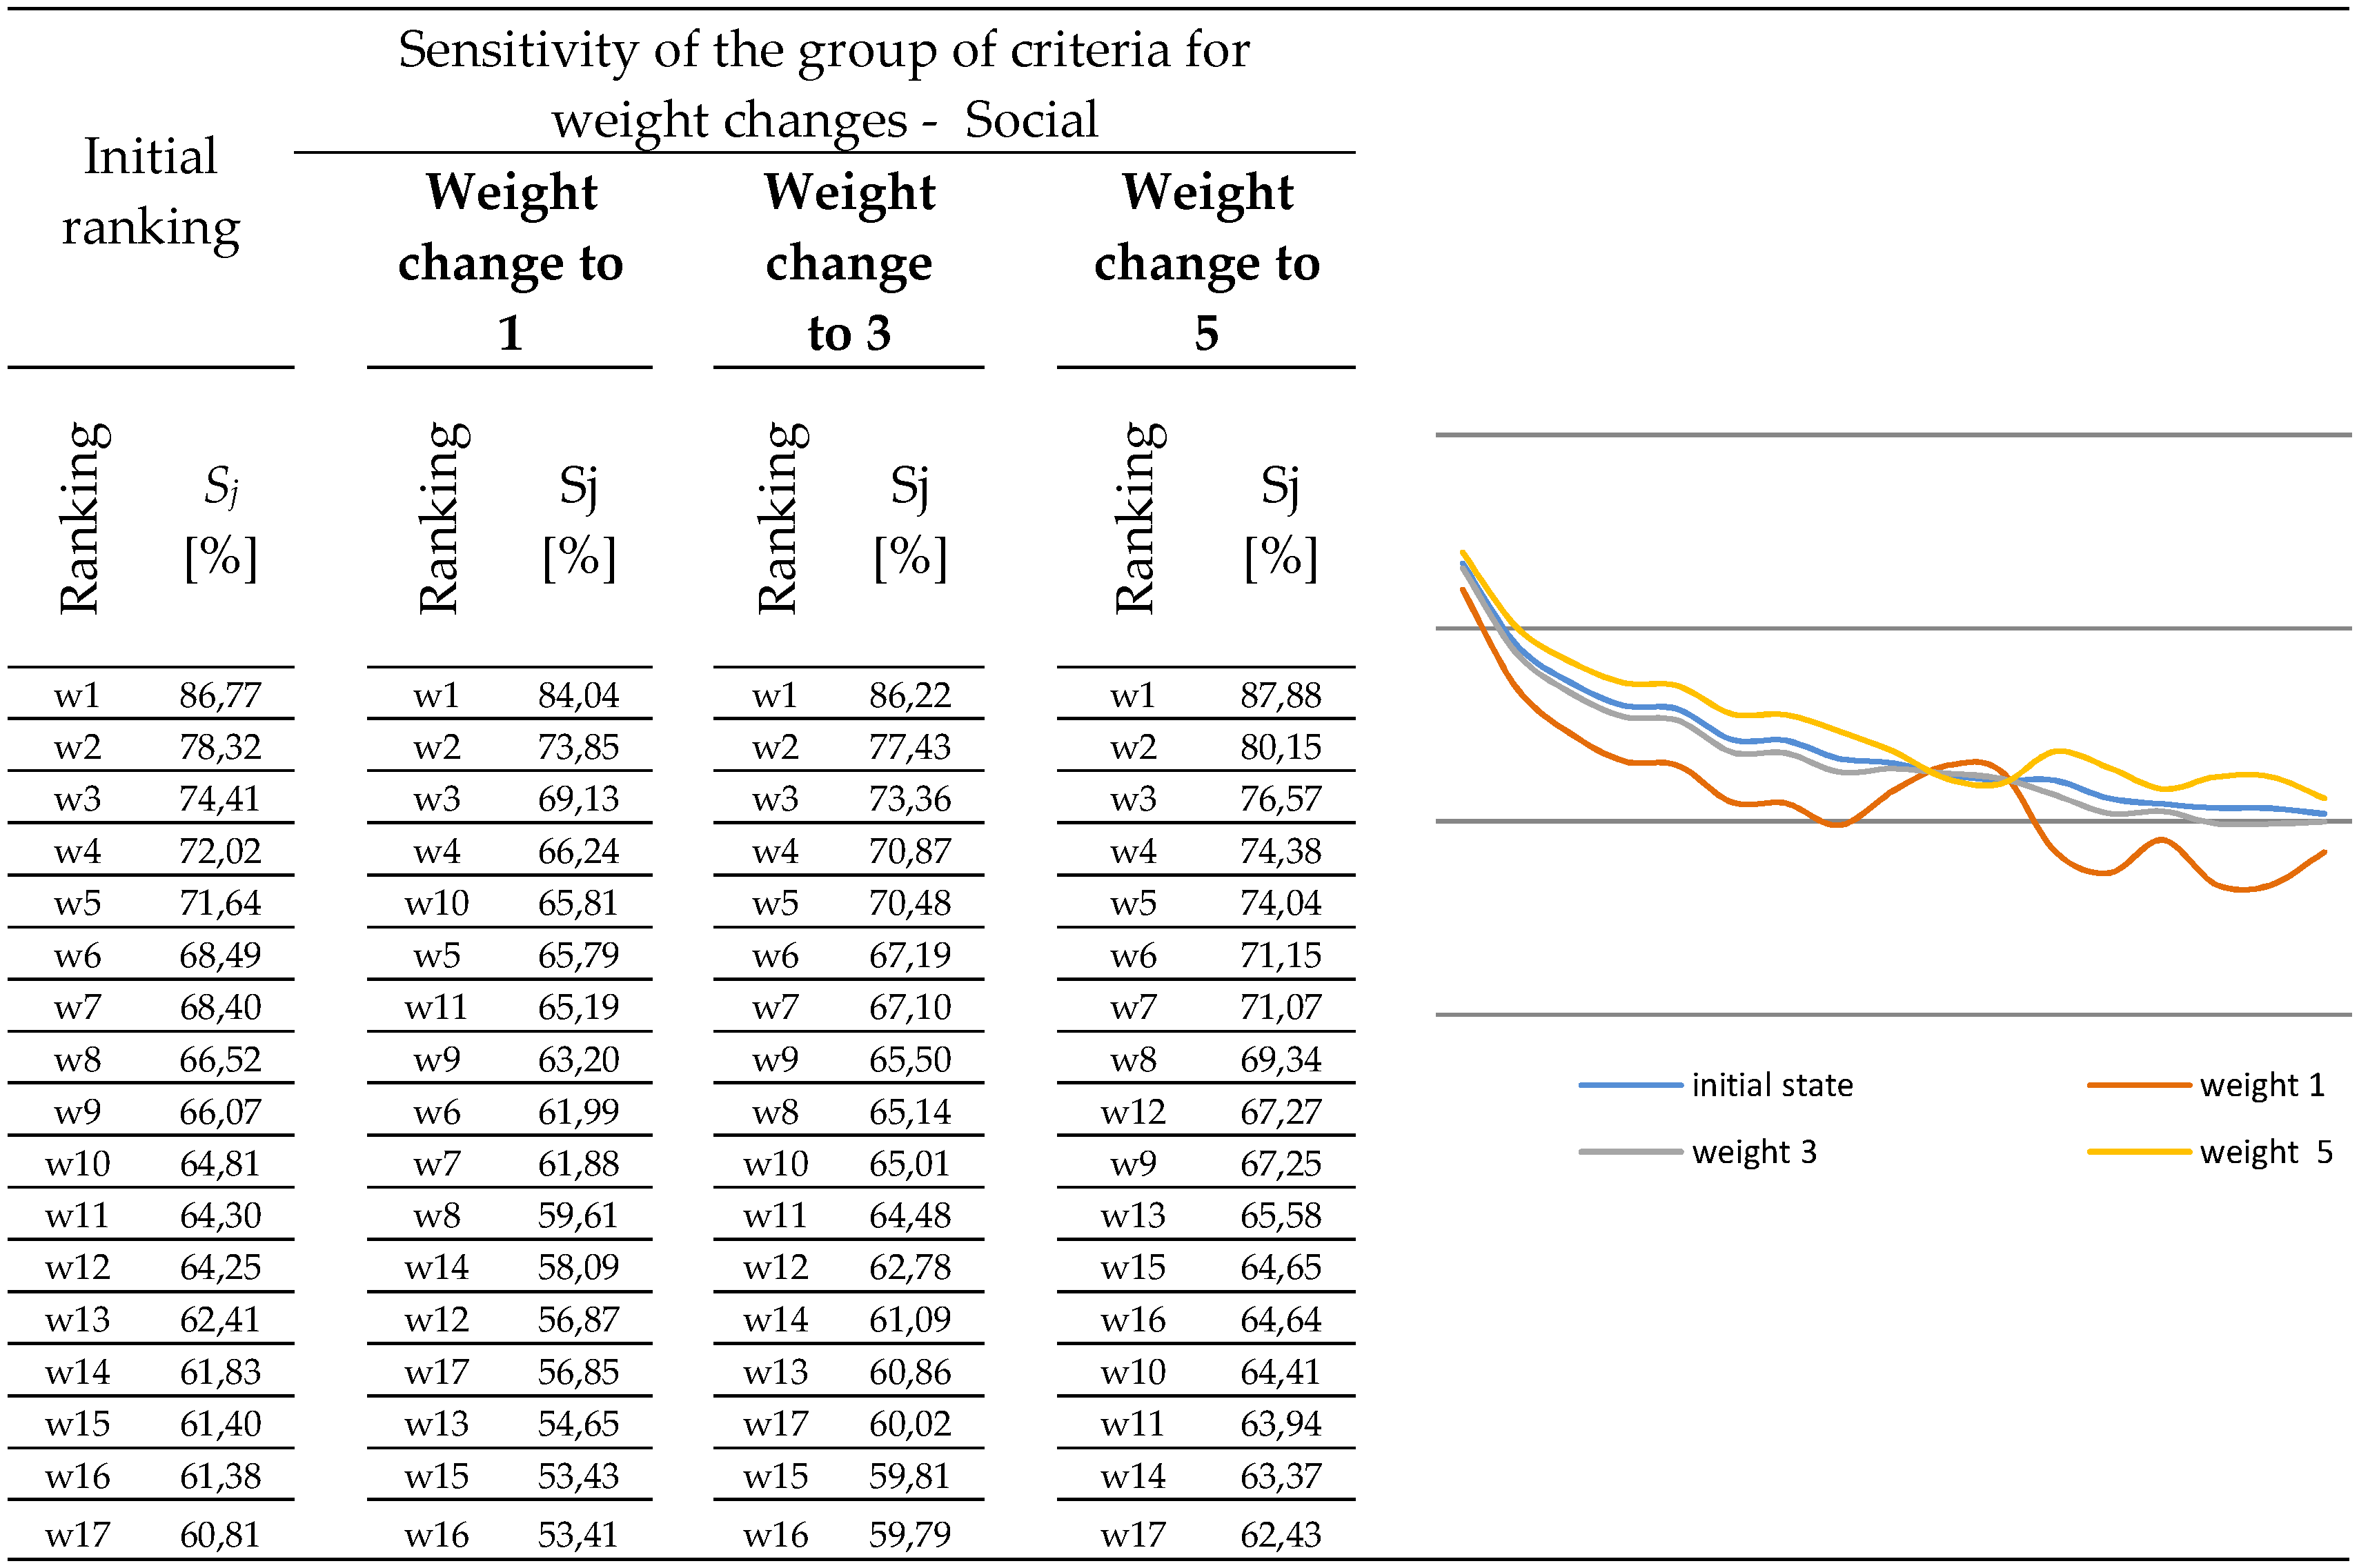
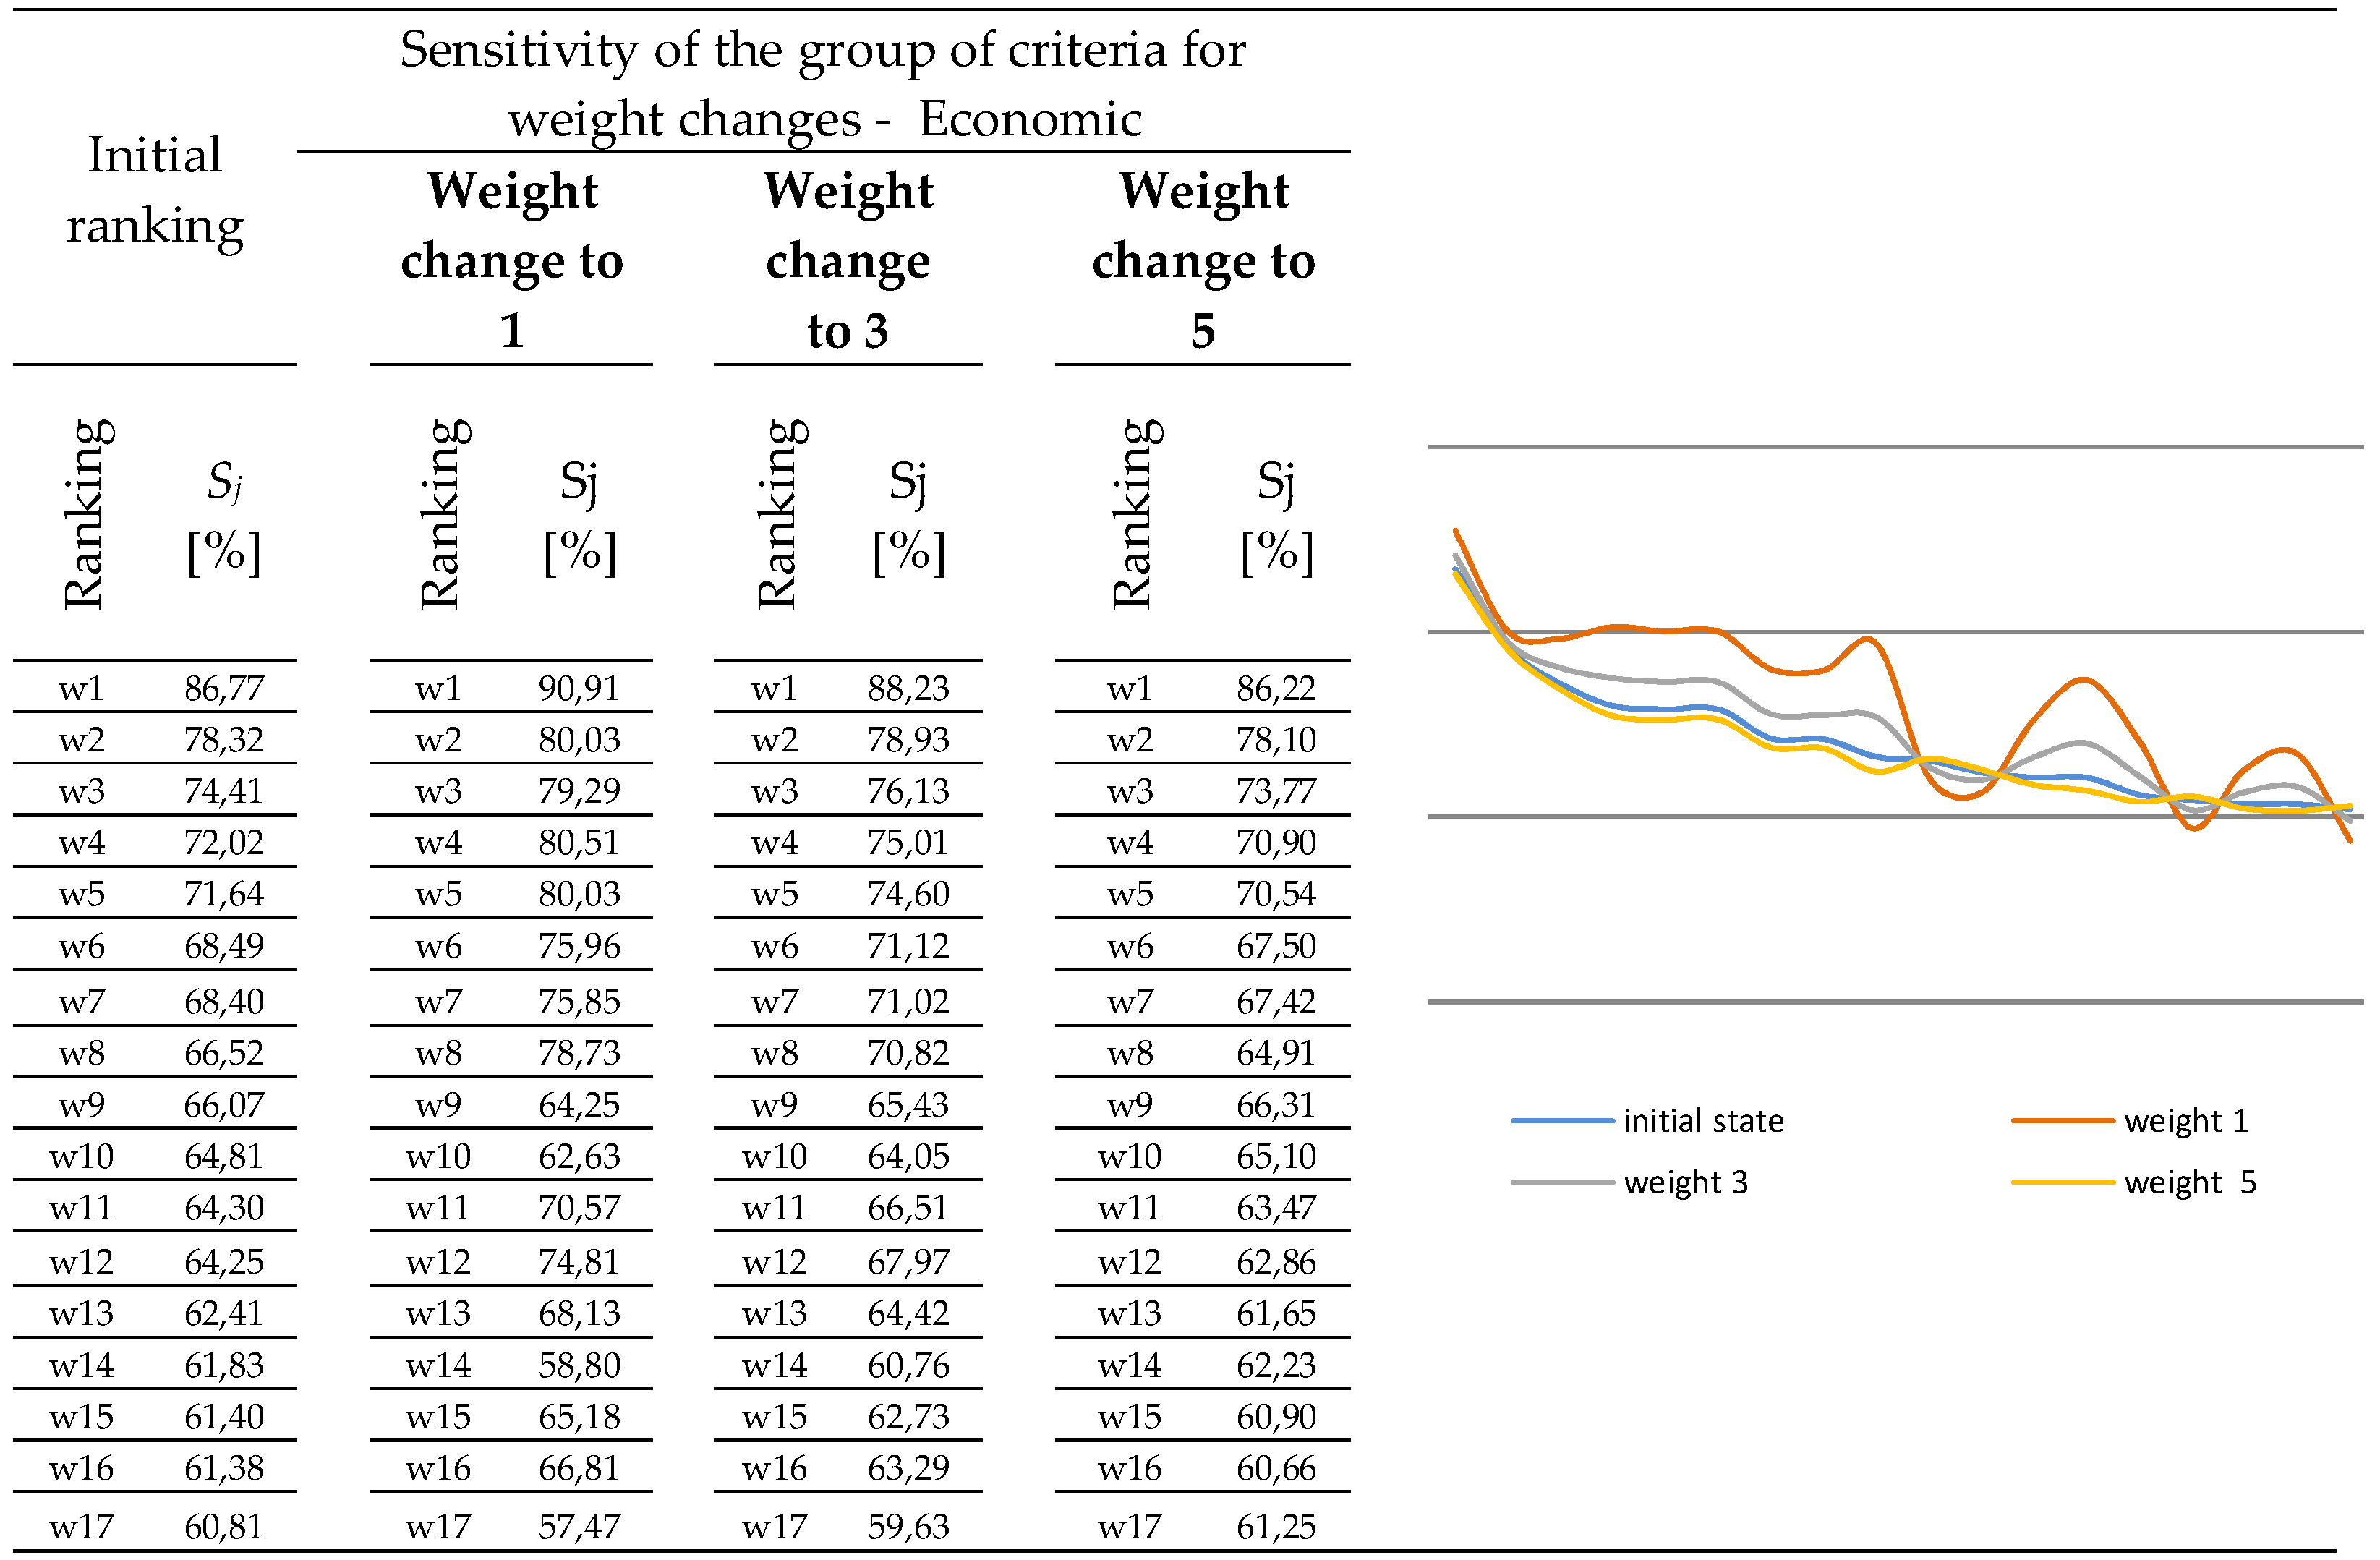
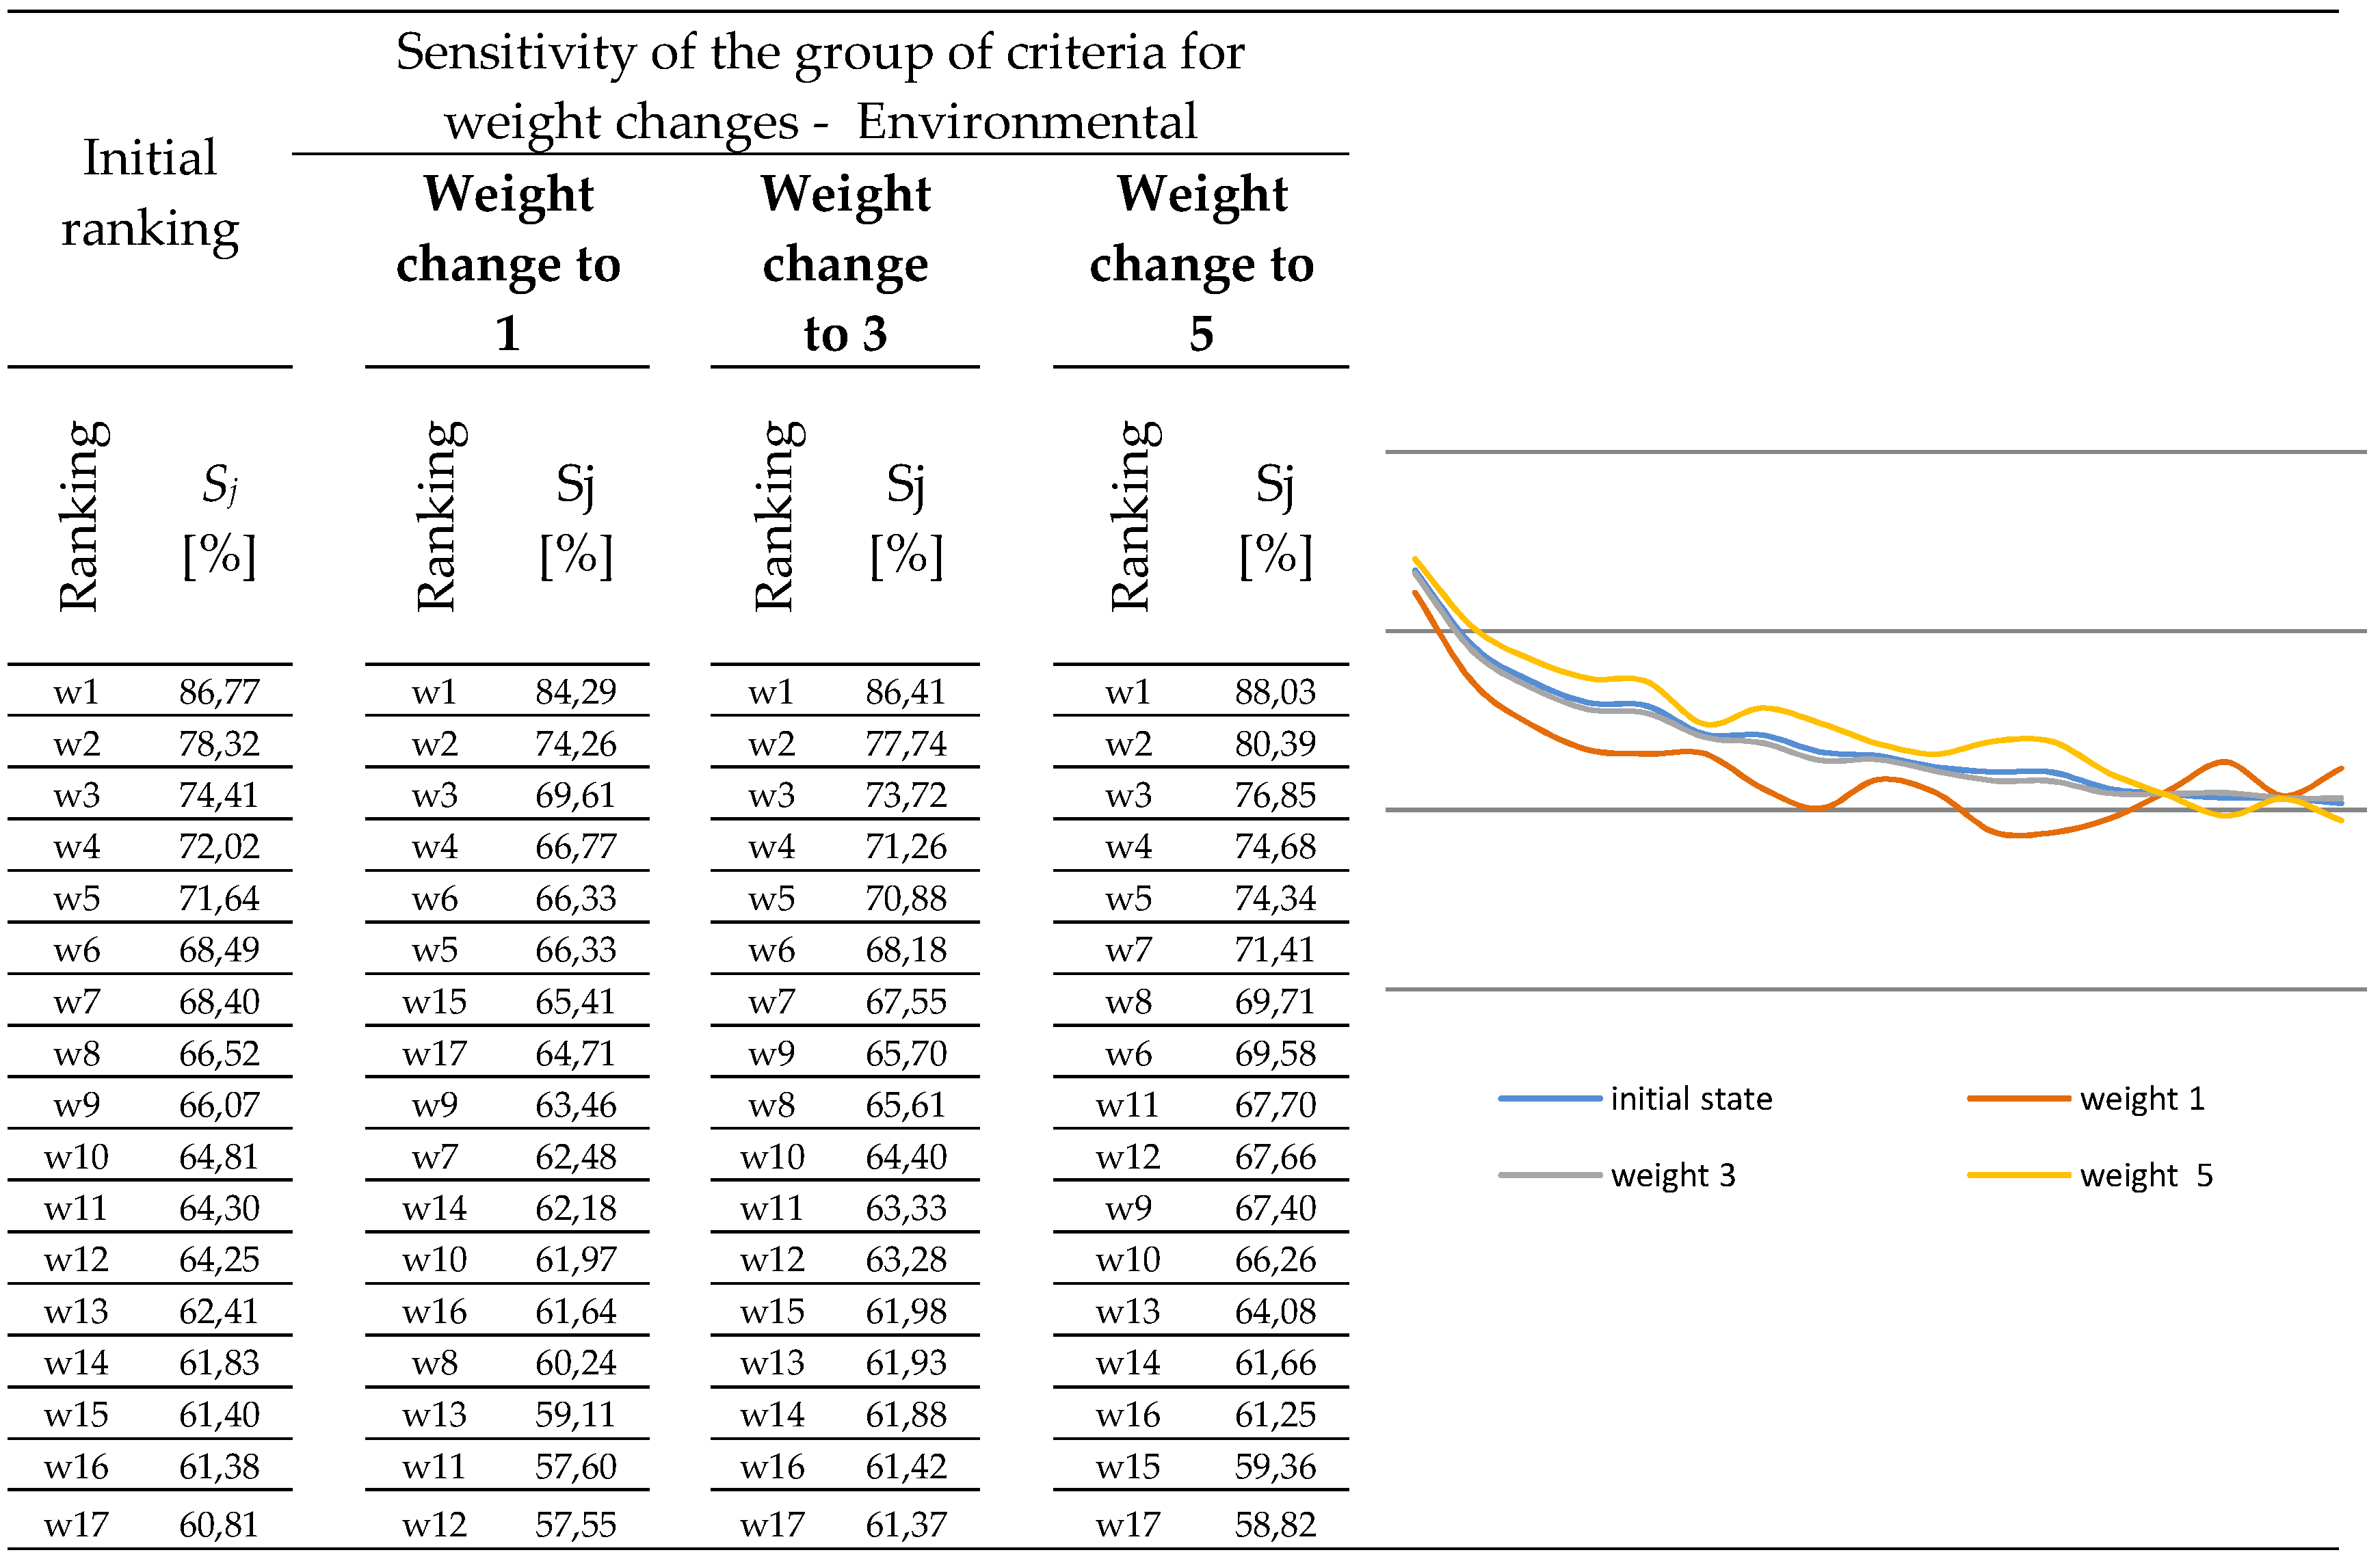
  • by changing the weight values of the main groups of criteria (functional, social, economic, environmental). The starting point was to change the weight values of the main groups of criteria and observe how it affected other groups of criteria, and thus the final result. When conducting the sensitivity analysis, the values of individual weights of the main criteria groups were subsequently changed to the following thresholds: 1, 3, 5. The obtained results are presented in Figure 3, Figure 4, Figure 5 and Figure 6. When analyzing the results from the figures, it can be noticed that the final ranking is clearly marked by w1 and w2 (‘Alpine convention Transport and Mobility on the Alps’; ‘Cooperation on Alpine Railway Corridors’). In the majority of rankings, positions 1 to 4 are immutable except for the economic criteria (when changing the weight to 1). For all groups of criteria, the largest differences in global assessment values result in a change in weights up to 1 (Figure 3, Figure 4, Figure 5 and Figure 6). This is particularly noticeable in the group of economic criteria (Figure 5), for which the global assessment values for most policy measures increase with this change. This is particularly noticeable for policy measures v4 and v5, whose global scores, with a change in weighting to 1, increased by nearly 10 percentage points, placing them 3rd and 4th in the ranking (Figure 5), thus placing the policy measure w3 in position 5. In the group of functional criteria, the changes in the final ranking (Figure 3) in the case of a change in weights are visible from position 6, where the policy measure w6 decreases to position 8 when the weight changes to 1, while the policy measure w8 moves to position 7 when the weight changes to 3. In this case also, the policy measure w8 moves to a further position, i.e., tenth in the final ranking. The policy measure w11 also falls to item 14. When weights are changed to 5 for a group of functional criteria, the policy measure w14 loses most of its position, occupying the last place in the ranking, i.e., position 17. On the other hand, the policy measure w15 is moved up two places. In the case of the social criterion group (Figure 4), when the weights of the criterion change, the changes are already noticeable on the 5th position in the ranking. Changing the weight to 1 results in a significant strengthening of the policy measure w10, which moves to position 5 in the final ranking. The policy measure w11, which moves to position 7 in the final ranking, is also strengthened. In the case of the environmental criterion group, changes in ranking positions are observed in position 5 in the case of a change in weighting to 1 (Figure 6). The policy measure w15 and w17 significantly strengthen their positions, occupying positions 7 and 8 respectively in the final ranking. The position of the policy measure w8, which ranks 14th in the ranking, is significantly weakened.
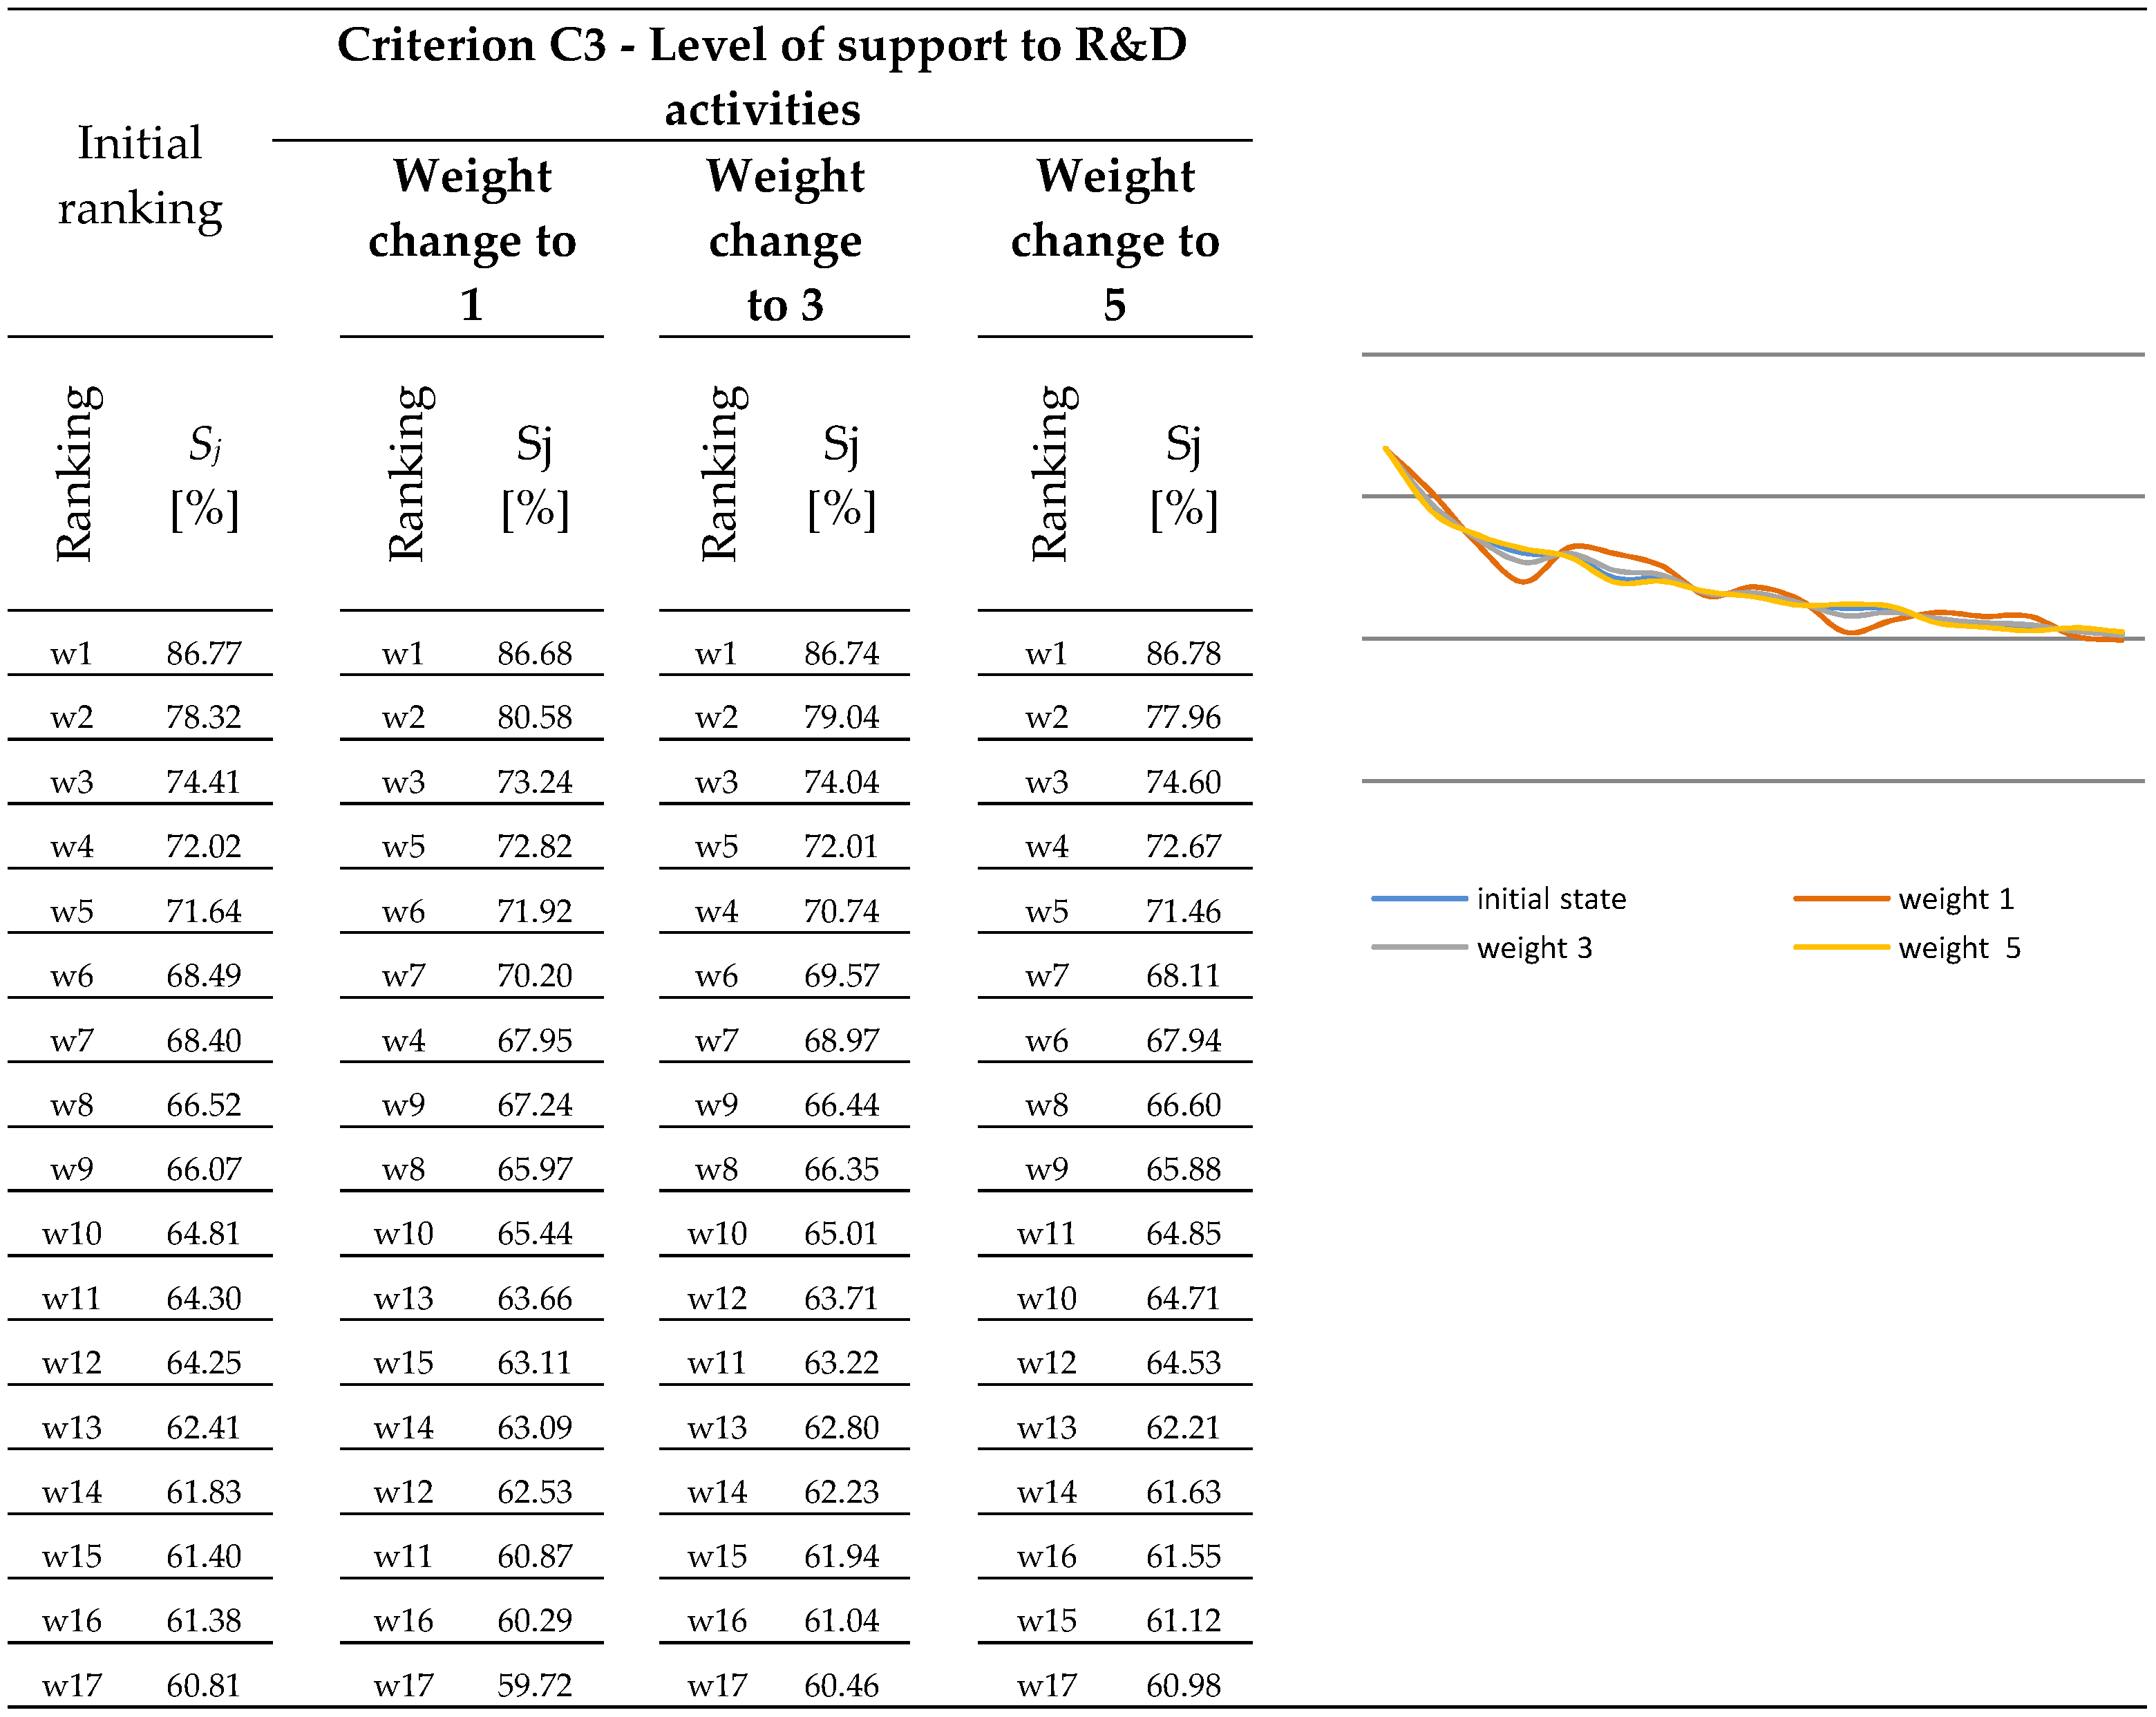
  • by changing the weight values of criteria (C1…C7). The starting point was to change the value of the criteria weights and observe how it affected other criteria, and thus the final result. When conducting the sensitivity analysis, the values of individual criteria weights were subsequently changed to the following thresholds: 1, 3, 5. The analysis results showed that the most sensitive criteria for changing the weights are C2—Mandatory level and C3—Level of support to R&D activities. The selected results of this analysis for criterion C3 are presented in Figure 7. When analyzing the results presented in Figure 7 it can be noticed that the final ranking is clearly marked by: w1, w2, w3 so, respectively, ‘Alpine convention Transport and Mobility on the Alps’, ‘Cooperation on Alpine Railway Corridors’, ‘EU Strategy for Bio Fuels’.

4. Discussion

A comparison of transport policies or strategic documents seems to be an impossible task. It is prone to a very high subjectivity and strong characterization of the individual structure of relatively narrow and hermetic issues. When attempting to create a ranking of this type of documents, one can always fall into a schematic approach, taking one feature into account and the comparison of documents will refer to this feature, leaving other threads and issues aside. The whole difficulty of the comparative analysis is intensified by a highly qualitative approach to the issues, which hinders, or, in principle, prevents the separation of numerical features that could be ranked. Therefore, it seems that it is advisable to use the multiple criteria method supported by an expert approach. In this case, the assessment of the documents is reliable (guaranteed by the evaluator’s experience), enhanced by the introduction of a uniform group of criteria used by each member of the expert team. The division into groups of criteria, together with the attribution of appropriate weights, results in a great tool, unified in its structure and creating a coherent and transparent form.
The presented method was applied to the process of identification of the level of innovation in transport and, as a result, to emphasize the importance of policy measures for its development with respect to both infrastructure and means of transport as well as the organization of transport processes. The article presents selected research results in the field of the assessment of the EU and national policy measures. It illustrates the possibility of applying one of the MCDA methods, i.e., the SAW method.
The use of this method allows to contemplate the analysed decision problems in terms of various criteria, including technical, economic, social or environmental, and to develop—on this basis—the final rankings of the examined measures, and comparison of obtained results. In the SAW method, in accordance with the principle ‘something for something’, a failure to meet one criterion can be compensated for by a high degree of fulfilment of another. The use of this method allowed a comprehensive and exhaustive assessment of the policies under consideration to be conducted and the identification of those that best meet the adopted assessment criteria, and thus those that could contribute the most to the stimulation of innovation in surface transport.
The presented example of the results obtained from computational experiments for the policy measures at the EU/regional level for the action plans/guidelines, shows that policy measures largely stimulating innovation are those that are characterized by the highest level of fulfilment of many criteria, including the criteria of greatest significance from the point of view of the entities interested in the final results of the research, proving that the policy measure directly intends to improve the consumer well-being and has the highest degree of commitment with environmental sustainability.
Both the change in the value of the weights for the main groups of criteria as well as for individual criteria in the group in the sensitivity analysis mainly impacted the order in the ranking of solutions placed in the further positions, i.e., from position 4—the first three measures remained in the rankings at the same positions. The various positions of solutions in the rankings means that the results are not stable.
The considered problem of the prioritization of EU/regional and national policy measures under consideration can also be solved by the other methods mentioned in point 2 for solving ranking problems, but it is important to remember that some methods have certain limitations. These limitations may relate to the number of variants/solutions/actions (size of the set), the type of information (i.e., what type of information is allowed by the method: whether the criteria are expressed in quantitative, qualitative or mixed form), the nature of the information (some methods allow deterministic information and others non-deterministic information—stochastic, fuzzy), the distance between variants measured quantitatively (some of the methods give the possibility of reading the distance between variants, which allows to determine precisely, if the option is better than the other option under consideration) etc. It is intuitively convincing and transparent, allowing for splitting the global assessment into a number of partial assessments taking into account factors of different significance and co-creating the synthetic assessment. This method makes allows to determine the distance between variants, which makes it possible to determine the difference between them.
Analyses such as those referred to in this, may constitute one of the elements of the research enabling conclusions about the impact of actions taken by the EU and by the governments of individual member states on the development of transport innovation, which give rise to the development of innovative technologies and processes.

Supplementary Materials

The following are available online at https://www.mdpi.com/2071-1050/11/5/1472/s1, Document S1: POSMETRANS list of policy measures, Document S2: POSMETRANS methodology for analysis.

Author Contributions

The research was designed and theoretically framed by all researchers. The data was gathered and analysed by K.S. and K.N.H, under the supervision of A.S., K.S. and K.N.H. prepared the original draft of the paper, and A.S. undertook the review. All researchers contributed to the final version of the manuscript with results and concluding remarks.

Funding

The study was conducted under POSMETRANS (POlicy measures for innovation in TRANSport sector with special focus on Small- and Medium sized Enterprises—factors and recommendations for success and sustainability)—a European project implemented between 2010–2011, funded from the 7th Framework Program of the European Commission. No funding was obtained in the project to cover the costs of Open Access publication.

Conflicts of Interest

The authors declare no conflict of interest.

References

  1. Limani, Y. Applied Relationship between Transport and Economy. IFAC-PapersOnLine 2016, 49, 123–128. [Google Scholar] [CrossRef]
  2. Sidor, J. Realizacja Polityki Transportowej na Szczeblu Międzynarodowym, Krajowym i Lokalnym (Implementation of Transport Policy at International, National and Local Level). Eksploat. Niezawodn. 2006, 4, 61–66. [Google Scholar]
  3. Kempa, E. Wybrane Problemy Polityki Transportowej w Przewozach Ładunków (Selected Problems of Transport Policy in Freight Transportation). Autobusy Technika, Eksploatacja Systemy Transportowe (Buses Technol. Oper. Transp. Syst.) 2018, 6, 1059–1062. [Google Scholar] [CrossRef]
  4. Purwanto, A.J.; Heyndrickx, C.; Kiel, J.; Betancor, O.; Socorro, M.P.; Hernandez, A.; Eugenio-Martin, J.L.; Pawlowska, B.; Borkowski, P.; Fiedler, R. Impact of Transport Infrastructure on International Competitiveness of Europe. Transp. Res. Proc. 2017, 25, 2877–2888. [Google Scholar] [CrossRef]
  5. The Council of the European Union. Renewed EU Sustainable Development Strategy; The Council of the European Union: Brussels, Belgium, 2006. [Google Scholar]
  6. Kadłubek, M. Examples of Sustainable Development in the Area of Transport. Proc. Econ. Financ. 2015, 27, 494–500. [Google Scholar] [CrossRef] [Green Version]
  7. Schwedes, O.; Riedel, V.; Dziekan, K. Project Planning vs. Strategic Planning: Promoting a Different Perspective for Sustainable Transport policy in European R&D Projects. Case Stud. Transp. Policy 2017, 5, 31–37. [Google Scholar]
  8. ECMT. Assessment and Decision Making for Sustainable Transport; OECD Publishing: Paris, France, 2004. [Google Scholar]
  9. Noy, K.; Givoni, M. Is ‘Smart Mobility’ Sustainable? Examining the Views and Beliefs of Transport’s Technological Entrepreneurs. Sustainability 2018, 10, 422. [Google Scholar] [CrossRef]
  10. Gorka, M. Wybrane poglądy na temat innowacji jako czynnika konkurencyjności podmiotów gospodarczych (Selected views on innovation as a factor in the competitiveness of economic operators). In Efektywność Zarządzania Zasobami Organizacyjnymi. Prace Naukowo-Dydaktyczne (Efficiency in the Management of Organizational Resources. Scientific and Didactic Works); Lenik, P., Ed.; Państwowa Wyższa Szkoła Zawodowa w Krośnie (Higher Vocational School): Krosno, Poland, 2015. [Google Scholar]
  11. Twiss, B.; Goodridge, M. Managing Technology for Competitive Advantage: Integrating Technological and Organisational Development: From Strategy to Action; Trans-Atlantic Pubns: Philadelphia, PA, USA, 1989. [Google Scholar]
  12. Rogers, M. Diffusion of Innovations, 4th ed.; The Free Press: New York, NY, USA, 1995. [Google Scholar]
  13. Chlad, M.; Strzelczyk, M. Innowacyjne Rozwiązania w Transporcie (Innovative Transport Solutions). Problemy Transportu i Logistyki (Transp. Logist. Probl.) 2017, 3, 9–18. [Google Scholar]
  14. Schumpeter, J.A. Teoria Rozwoju Gospodarczego (Theory of Economic Development); Wydawnictwo PWE: Warszawa, Poland, 1960. [Google Scholar]
  15. Centrum Analiz Transportowych i Infrastrukturalnych (Centre for Transport and Infrastructure Analyses). Innowacyjność w Transporcie do 2020 roku—Podstawowe Pojęcia i Tezy (Innovation in Transport by 2020—Basic Concepts and Theses); CATI: Warszawa, Poland, 2012. [Google Scholar]
  16. Sierpinski, G. Model of Incentives for Changes of the Modal Split of Traffic Towards Electric Personal Cars. In Transport Systems Telematics 2014. Telematics—Support for Transport, CCIS; Mikulski, J., Ed.; Springer: Heidelberg, Germany, 2014; pp. 450–460. [Google Scholar]
  17. Wiesenthal, T.; Condeço-Melhorado, A.; Leduc, G. Innovation in the European Transport Sector: A Review. Transp. Policy 2015, 42, 86–93. [Google Scholar] [CrossRef]
  18. Holden, E.; Gilpin, G. Biofuels and Sustainable Transport: A Conceptual Discussion. Sustainability 2013, 5, 3129–3149. [Google Scholar] [CrossRef] [Green Version]
  19. Thorpe, N.; Namdeo, A. Innovations in Technologies for Sustainable Transport. Res. Transp. Bus. Manag. 2016, 18, 1–3. [Google Scholar] [CrossRef]
  20. Noel, L.; de Rubens, G.Z.; Sovacool, B.K. Optimizing innovation, carbon and health in transport: Assessing socially optimal electric mobility and vehicle-to-grid pathways in Denmark. Energy 2018, 153, 628–637. [Google Scholar] [CrossRef]
  21. Wu, S.; Wee, H.M.; Lee, S.B. Technical innovation vs. sustainability—A case study from the Taiwanese automobile industry. Transp. Res. Part D Transp. Environ. 2016, 48, 20–30. [Google Scholar] [CrossRef]
  22. Skeete, J.P. Level 5 autonomy: The new face of disruption in road transport. Technol. Forecast. Soc. 2018, 134, 22–34. [Google Scholar] [CrossRef]
  23. Bak, M.; Pawlowska, B.; Borkowski, P. Cases Studies in Improving Interconnectivity between Passenger Transport Modes-the Context of the EU Transport Policy Objectives. Procedia Soc. Behv. 2012, 48, 2738–2747. [Google Scholar] [CrossRef] [Green Version]
  24. Andrés, L.; Padilla, E. Driving factors of GHG emissions in the EU transport activity. Transp. Policy 2018, 61, 60–74. [Google Scholar] [CrossRef]
  25. Stephenson, J.; Spector, S.; Hopkins, D.; McCarthy, A. Deep Interventions for a Sustainable Transport Future. Transport. Res. Part D Transp. Environ. 2017, 61, 356–372. [Google Scholar] [CrossRef]
  26. Lah, O. Continuity and Change: Dealing with Political Volatility to Advance Climate Change Mitigation Strategies—Examples from the Transport Sector. Sustainability 2017, 9, 959. [Google Scholar] [CrossRef]
  27. Gossling, S. Police Perspectives on Road Safety and Transport Politics in Germany. Sustainability 2017, 9, 1771. [Google Scholar] [CrossRef]
  28. Tsafarakis, S.; Gkorezis, P.; Nalmpantis, D.; Genitsaris, E.; Andronikidis, A. Investigating the preferences of individuals on public transport innovations using the Maximum Difference Scaling method. Eur. Transp. Res. Rev. 2019, 11, 3. [Google Scholar] [CrossRef]
  29. Abella, A.; Ortiz-de-Urbina-Criado, M.; De-Pablos-Heredero, C. A model for the analysis of data-driven innovation and value generation in smart cities’ ecosystems. Cities 2017, 64, 47–53. [Google Scholar] [CrossRef]
  30. Przybylska, E. The Role of Clusters in The Development of Innovation in the TSL Industry. Res. Logist. Prod. 2018, 8, 103–111. [Google Scholar] [CrossRef]
  31. Hyard, A. Non-technological Innovations for Sustainable Transport. Technol. Forecast. Soc. 2013, 80, 1375–1386. [Google Scholar] [CrossRef]
  32. Goldman, T.; Gorhamb, R. Sustainable urban transport: Four innovative directions. Technol. Soc. 2006, 28, 261–273. [Google Scholar] [CrossRef]
  33. European Commission. EUROPE 2020. A Strategy for Smart, Sustainable and Inclusive Growth; European Commission: Brussels, Belgium, 2010. [Google Scholar]
  34. Hull, A. Policy Integration: What Will it Take to Achieve More Sustainable Transport Solutions in Cities? Transp. Policy 2008, 15, 94–103. [Google Scholar] [CrossRef]
  35. European Parliament. Horizon Europe—Specific Programme: Implementing the Framework Programme. Available online: http://www.europarl.europa.eu/RegData/etudes/BRIE/2018/628297/EPRS_BRI(2018)628297_EN.pdf (accessed on 22 February 2019).
  36. Gelhausen, M.C.; Berster, P.; Wilken, D. A new direct demand model of long-term forecasting air passengers and air transport movements at German airports. J. Air Transp. Manag. 2018, 71, 140–152. [Google Scholar] [CrossRef]
  37. Kerridge, M. The Impact of Brexit on the Transport Industry. Logist. Transp. 2018, 40, 35–42. [Google Scholar]
  38. Lyons, G.; Davidson, C. Guidance for transport planning and policymaking in the face of an uncertain future. Transp. Res. A-Pol. 2016, 88, 104–116. [Google Scholar] [CrossRef] [Green Version]
  39. POSMETRANS. Available online: http://www.posmetrans.eu/ (accessed on 9 January 2019).
  40. Gohla, R.; Roth, J.J. POSMETRANS. Policy Measures for Innovation in TRANSport Sector with Special Focus on Small and Medium Sized Enterprises—Factors and Recommendations for Success and Sustainability; Steinbeis-Edition: Stuttgart, Germany, 2012; Available online: http://www.posmetrans.eu/downloads/POSMETRANS_Handbook_final.pdf (accessed on 9 January 2019).
  41. Steuer, R. Multiple Criteria Optimization: Theory, Computation and Application; John Wiley: New York, NY, USA, 1986. [Google Scholar]
  42. Vincke, P. Multicriteria Decision-Aid; John Wiley & Sons: Chichester, UK, 1992. [Google Scholar]
  43. Zeleny, M. Multiple Criteria Decision Making; McGraw Hill: New York, NY, USA, 1982. [Google Scholar]
  44. Salo, A.; Hämäläinen, R.P. Multicriteria Decision Analysis in Group Decision Processes. In Handbook of Group Decision and Negotiation; Kilgour, D.M., Eden, C., Eds.; Springer: Dordrecht, The Netherlands, 2012; pp. 269–284. [Google Scholar]
  45. Koksalan, M.; Wallenius, J.; Zionts, S. Multiple Criteria Decision Making. From Early History to the 21st Century; World Scientific Publishing Co. Ltd.: Singapore, 2011. [Google Scholar]
  46. Roy, B. Multiple Criteria Decision Aid; Wydawnictwo Naukowo—Techniczne: Warszawa, Poland, 1990. [Google Scholar]
  47. Zmuda-Trzebiatowski, P. Partycypacyjna Ocena Miejskich Projektów Transportowych (Participatory Evaluation of Urban Transport Projects); Poznan University of Technology Publishing House: Poznań, Poland, 2016. [Google Scholar]
  48. Saaty, T. The Analytic Hierarchy Process: Planning, Priority Setting, Resource Allocation; McGraw-Hill: New York, NY, USA, 1980. [Google Scholar]
  49. Saaty, T. Decision Making—The Analytic Hierarchy and Network Processes (AHP/ANP). J. Syst. Sci. Syst. Eng. 2004, 13, 1–34. [Google Scholar] [CrossRef]
  50. Jacquet-Lagreze, E.; Siskos, J. Assessing a Set of Additive Utility Functions for Multicriteria Decision Making: The UTA Method. Eur. J. Oper. Res. 1982, 10, 151–164. [Google Scholar] [CrossRef]
  51. Brans, J.P.; Mareschal, B.; Vincke, P. PROMETHEE: A new Family of Outranking Methods in MCDM. Oper. Res.-Ger. 1984, 3, 477–490. [Google Scholar]
  52. Greco, S.; Ehrgott, M.; Figueira, J. (Eds.) Multiple Criteria Decision Analysis: State of the Art Surveys; Springer: New York, NY, USA, 2016. [Google Scholar]
  53. Roubens, M. Preference Relations on Actions and Criteria in Multiple Decision Making. Eur. J. Oper. Res. 1982, 10, 51–55. [Google Scholar] [CrossRef]
  54. Shimizu, K.; Kawabe, H.; Aiyoshi, E. A Theory for Interactive P-reference Optimization and its Algorithm-Generalized SWT method. Trans. Inst. Electron. Commun. Eng. Jpn. 1978, 61, 1075–1082. [Google Scholar]
  55. Geoffrion, A.; Dyer, J.; Feinberg, A. An Interactive Approach for Multi-Criterion Optimization, with an Application to the Operation of an Academic Department. Manag. Sci. 1972, 19, 357–368. [Google Scholar] [CrossRef]
  56. Jaszkiewicz, A.; Słowiński, R. The Light Beam Search Approach—An Overview of Methodology and Applications. Eur. J. Oper. Res. 1999, 113, 300–314. [Google Scholar] [CrossRef]
  57. Benayoun, R.; De Montgolfier, J.; Tergny, J. Linear Programming with Multiple Objective Functions: Step Method (Stem). Math. Program. 1971, 1, 366–375. [Google Scholar] [CrossRef]
  58. Korhonen, P.; Wallenius, J. A Modification of the Zionts-Wallenius Multiple Criteria Methods for Nonlinear Utility Functions; Helsinki School of Economics Press: Helsinki, Finland, 1985. [Google Scholar]
  59. Żak, J. Multiple Criteria Decision Aiding in Road Transportation. Habilitation Thesis, Poznan University of Technology Publishing House, Poznań, Poland, 2005. [Google Scholar]
  60. Choo, E.U.; Atkins, D.R. An Interactive Algorithm for Multicriteria Programming. Comput. Oper. Res. 1980, 7, 81–87. [Google Scholar] [CrossRef]
  61. Wierzbicki, A. The Use of Reference Objectives in Multi-objective Optimization. In MCDM Theory and Application; Fandel, G., Gal, T., Eds.; Springer: Berlin, Germany, 1980; pp. 468–486. [Google Scholar]
  62. MacCrimon, K.R. Decision Making among Multiple Attribute Alternatives: A Survey and Consolidated Approach; The Rand Corporation: Santa Monica, CA, USA, 1968. [Google Scholar]
  63. Matarazzo, B. Mappac as a Compromise Between Outranking Methods and MAUT. Eur. J. Oper. Res. 1991, 54, 48–65. [Google Scholar] [CrossRef]
  64. Kijewska, K.; Torbacki, W.; Iwan, S. Application of AHP and DEMATEL Methods in Choosing and Analysing the Measures for the Distribution of Goods in Szczecin Region. Sustainability 2018, 10, 2365. [Google Scholar] [CrossRef]
  65. Hemalatha, S.; Dumpala, L.; Balakrishna, B. Service quality evaluation and ranking of container terminal operators through hybrid multi-criteria decision-making methods. Asian J. Ship. Logist. 2018, 34, 137–144. [Google Scholar] [CrossRef]
  66. Lon, V.; Higashi, O.; Pheng, P. Analytic Hierarchy Process for Evaluation of Public Transport Policy Design in Phnom Penh City. Proceedings of the Eastern Asia Society for Transportation Studies 2013. Volume 9. Available online: https://www.researchgate.net/publication/301771384_Analytic_Hierarchy_Process_for_Evaluation_of_Public_Transport_Policy_Design_in_Phnom_Penh_City (accessed on 4 September 2018).
  67. Al-Atawi, A.M.; Kumar, R.; Saleh, W. Transportation Sustainability Index for Tabuk City in Saudi Arabia: An Analytic Hierarchy Process. Transport 2016, 31, 47–55. [Google Scholar] [CrossRef]
  68. López-Iglesias, E.; Peón, D.; Rodríguez-Álvarez, J. Mobility innovations for sustainability and cohesion of rural areas: A transport model and public investment analysis for Valdeorras (Galicia, Spain). J. Clean. Prod. 2018, 172, 3520–3534. [Google Scholar] [CrossRef]
  69. De Luca, S. Public Engagement in Strategic Transportation Planning: An Analytic Hierarchy Process Based Approach. Transp. Policy 2014, 33, 110–124. [Google Scholar] [CrossRef]
  70. Chowdhury, S.; Hadas, Y.; Gonzalez, V.A.; Schot, B. Public Transport Users’ and Policy Makers’ Perceptions of Integrated Public Transport Systems. Transp. Policy 2018, 61, 75–83. [Google Scholar] [CrossRef]
  71. Nosal, K.; Solecka, K. Application of AHP Method for Multi-criteria Evaluation of Variants of the Integration of Urban Public Transport. Transp. Res. Proc. 2014, 3, 269–278. [Google Scholar] [CrossRef] [Green Version]
  72. Taleai, M.; Yameqani, A.S. Integration of GIS, Remote Sensing and Multi-Criteria Evaluation Tools in the Search for Healthy Walking Paths. KSCE J. Civ. Eng. 2018, 22, 279–291. [Google Scholar] [CrossRef]
  73. Kiciński, M.; Judt, W.; Kłosowiak, R. Wielokryterialna Ocena Wariantów Dojazdu Mieszkańców Aglomeracji Poznańskiej do Poznania. (Multiple criteria Assessment of Access Options for the Poznań Agglomeration residents). Autobusy-Technika, Eksploatacja, Systemy Transportowe (Buses Technol. Oper. Transp. Syst.) 2017, 12, 560–563. [Google Scholar]
  74. Popiolek, N.; Thais, F. Multi-criteria analysis of innovation policies in favor of solar mobility in France by 2030. Energy Policy 2016, 97, 202–219. [Google Scholar] [CrossRef]
  75. Solecka, K. Wielokryterialna Ocena Wariantów Zintegrowanego Miejskiego Transportu Publicznego w Krakowie (Multi-Criteria Assessment of the Options within the Integrated Urban Public Transport in Krakow). Ph.D. Thesis, Cracow University of Technology, Krakow, Poland, 2013. [Google Scholar]
  76. Nassereddine, M.; Eskandari, H. An integrated MCDM approach to evaluate public transportation systems in Tehran. Transp. Res. A-Pol. 2017, 106, 427–439. [Google Scholar] [CrossRef]
  77. Rudnicki, A. Jakość Komunikacji Miejskiej (Quality of urban transport); Stowarzyszenie Inżynierów i Techników Komunikacji (Association of Engineers and Technicians of Communication, Cracow): Krakow, Poland, 1999. [Google Scholar]
  78. Ivanović, I.; Grujičić, D.; Macura, D.; Jović, J.; Bojović, N. One Approach for Road Transport Project Selection. Transp. Policy 2013, 25, 22–29. [Google Scholar] [CrossRef]
  79. Mardani, A.; Zavadskas, E.K.; Khalifah, Z.; Jusoh, A.; Nor, K. Multiple Criteria Decision-Making Techniques in Transportation Systems: A Systematic Review of the State of the Art Literature. Transport 2016, 31, 359–385. [Google Scholar] [CrossRef]
  80. Macharis, C.; Bernardini, A. Reviewing the use of Multi-Criteria Decision Analysis for the Evaluation of Transport Projects: Time for a Multi-Actor Approach. Transp. Policy 2015, 37, 177–186. [Google Scholar] [CrossRef]
Figure 1. Classification of multi-criteria decision aid (MCDA) methods according to P. Vincke [42].
Sustainability 11 01472 g001
Figure 2. Classification of methods according to the purpose of the decision-making process.
Sustainability 11 01472 g002
Figure 3. The sensitivity analysis—the change in the weight values of the functional groups of criteria (symbols w1…w17 correspond to the policy measures in Table 3, the numbers are in line with the obtained ranking in Table 3).
Sustainability 11 01472 g003
Figure 4. The sensitivity analysis—the change in the weight values of the social groups of criteria (symbols w1…w17 correspond to the policy measures in Table 3, the numbers are in line with the ranking obtained in Table 3).
Sustainability 11 01472 g004
Figure 5. The sensitivity analysis—the change in the weight values of the economic groups of criteria (symbols w1…w17 correspond to the policy measures in Table 3, the numbers are in line with the ranking obtained in Table 3).
Sustainability 11 01472 g005
Figure 6. The sensitivity analysis—the change in the weight values of the environmental groups of criteria (symbols w1…w17 correspond to the policy measures in Table 3, the numbers are in line with the ranking obtained in Table 3).
Sustainability 11 01472 g006
Figure 7. The sensitivity analysis—the change in the weight value of criterion C3 (w1–w17 refers to the policy measures presented in Table 3).
Sustainability 11 01472 g007
Table 1. Criteria adopted to the assessment of the policy measures on the European Union (EU) and at national level.
No.Group of CriteriaName of CriterionDefinition of Criterion
C1FunctionalEase of enforcement/bureaucracy burdenThis criterion indicates the level of complexity in implementing a policy measure/accessing a funding program. It answers the questions if the process is easy to understand and follow, transparent, time-consuming or not, requires taking many non-technical aspects such as social and environmental aspects into account, requires specifically trained personnel.
C2Mandatory levelLevel of the mandatory nature of the policy measures. For example: recommendations, opinions, communications are low level; regulations, decisions or directives are high level.
C3Level of support to research and development (R&D) activitiesThe criterion means the policy measure (both the EU funding programs and regulations) supports R&D activities (the largest forms of support are, for example, grants allocated to R&D activities, the higher the rank is) in different ways.
C4SocialConsumer orientedThis criterion indicates to which extent the interest of consumers/end-users of a technology is taken into account (high policy directly intended at improving consumer well-being; low: consumer well-being not considered or only indirectly).
C5EconomicSmall- and medium-sized enterprises (SME) participationPercentage of funding allocated to SME partners
C6Incentive taxes systemThis criterion indicates if the use of tax incentives is planned either to penalize those who do not follow a policy measure (e.g., CO2 tax) or to help/simplify/encourage investments/the implementation of policy measures.
C7EnvironmentalEnvironmental commitmentThis criterion indicates the degree of commitment with the environmental sustainability of the policy measure.
Table 2. Weights of the criteria.
No.Group of CriteriaWeight of Group of CriteriaNormalized Weight of Group of CriteriaCriteriaWeight of Criterion Normalized Weight of CriterionWeight of Criterion in Full Collection
1Functional3.80.25C1Ease of enforcement/bureaucracy burden4.30.350.09
C2Mandatory level3.80.300.07
C3Level of support to R&D activities4.30.350.09
total-10.25
2Social3.60.24C4Consumer oriented3.710.24
total-10.24
3Economic4.40.29C5SME participation4.80.550.16
C6Taxes incentives system3.90.450.13
total-10.29
4Environmental3.40.22C7Environmental commitment410.22
total-10.22
total 1 --1
Table 3. The final ranking for the policy measures at the EU/regional level—action plan/guidelines (chosen results).
Positioning the RankLevelName of the Policy MeasureAssessment of the Degree of Fulfillment [%]Global Assessment Sj (%)
C1C2C3C4C5C6C7
1Other (Regional)Alpine Convention on Transport and Mobility on the Alps (Alpine Countries)60100801005010010086.77
Global assessment for each criterion5.277.606.8923.687.9912.9622.37
2Other (Regional)Cooperation on Alpine Railway Corridors (Alpine Countries)4080201005010010078.32
Global assessment for each criterion3.516.081.7223.687.9912.9622.37
3EUEU Strategy for Bio fuels404060100506710074.41
Global assessment for each criterion3.513.045.1723.687.998.6422.37
4EUAssessment and Management of Report from the EC to the EP and the Council concerning sources of environmental noise—COM (2004) 1604020100100503310072.02
Global assessment for each criterion3.511.528.6123.687.994.3222.37
5EUTowards a European Road Safety Area: Policy Orientations on Road Safety 2011-2020606040100503310071.64
Global assessment for each criterion5.274.563.4523.687.994.3222.37
EUEuropean Strategy on Clean and Energy Efficient Vehicles606040100503310071.64
Global assessment for each criterion5.274.563.4523.687.994.3222.37
6Other (Regional)Abkommen zwischen der Schweizerischen Eidgenossenschaftund der Europäischen Gemeinschaft über denGüter- und Personenverkehr auf Schiene und Strasse (Switzerland/EU)601002010050338068.49
Global assessment for each criterion5.277.601.7223.687.994.3217.89
7EUThematic Strategy on Air Pollution—COM (2005) 446604020100503310068.40
Global assessment for each criterion5.273.041.7223.687.994.3222.37
8EUA Sustainable Future for Transport: Towards an Integrated, Technology-Led and User-Friendly System604060100173310066.52
Global assessment for each criterion5.273.045.1723.682.664.3222.37
9EUCommission recommendation on the development of a legal and business framework for participation of the private sector in deploying telematics-based traffic and travel information services in Europe40402080501008066.07
Global assessment for each criterion3.513.041.7218.957.9912.9617.89
10EUProgram for the Promotion of Short Sea Shipping, COM (2003) 15560404060501008064.81
Global assessment for each criterion5.273.043.4514.217.9912.9617.89
11EUTrans-European Networks: Toward an Integrated Approach, COM (2007) 135602010060503310064.30
Global assessment for each criterion5.271.528.6114.217.994.3222.37
12EUBiomass Action Plan—COM (2005) 62840206010050010064.25
Global assessment for each criterion3.511.525.1723.687.990.0022.37
13EUPosition Paper on the European Strategies and Priorities for Railway Noise Abatement 60202010050338062.41
Global assessment for each criterion5.271.521.7223.687.994.3217.89
14EUCOM (2007) 96. Brussels, 15 March 2007. Radio Frequency Identification (RFID) in Europe: Steps Towards a Policy Framework60202080501006061.83
Global assessment for each criterion5.271.521.7218.957.9912.9613.42
15EUGREEN PAPER. TEN-T: A policy review. COM(2009) 4460804010033674061.40
Global assessment for each criterion5.276.083.4523.685.338.648.95
16EURail Noise Abatement Measures Addressing the Existing Fleet—COM (2008) 43260202080501006061.38
Global assessment for each criterion5.271.521.7218.957.9912.9613.42
17EUCOM (2003) 123 final, Brussels, 19 March 2003. Integration of the EGNOS Program in the Galileo Program60206080501004060.81
Global assessment for each criterion5.271.525.1718.957.9912.968.95

