Article

Objective Gait Analysis Using a Single-Point Wearable Sensor to Assess Lumbar Spine Patients Pre- and Postoperatively

by
R Dineth Fonseka
1,2,3,
Pragadesh Natarajan
1,2,3,
Monish Movin Maharaj
1,2,3,4,5,
Lianne Koinis
2,*,
Luke Sy
2 and
Ralph Jasper Mobbs
1,2,3,4,5,*
1
Faculty of Medicine, University of New South Wales, Sydney 2052, Australia
2
Wearables and Gait Analysis Research Group (WAGAR), Sydney 2031, Australia
3
NeuroSpine Surgery Research Group (NSURG), Sydney 2031, Australia
4
NeuroSpine Clinic, Prince of Wales Private Hospital, Sydney 2031, Australia
5
Department of Neurosurgery, Prince of Wales Hospital, Sydney 2052, Australia
*
Authors to whom correspondence should be addressed.
Surg. Tech. Dev. 2024, 13(1), 58-75; https://doi.org/10.3390/std13010004
Submission received: 4 September 2023 / Revised: 24 January 2024 / Accepted: 5 February 2024 / Published: 14 February 2024

Abstract

:
Background: Outcome measurement in lumbar surgery is traditionally performed using patient questionnaires that may be limited by subjectivity. Objective gait analysis may supplement patient assessment but must be clinically viable. We assessed gait metrics in lumbar spine patients pre- and postoperatively using a small and lightweight wearable sensor. Methods: This was a prospective observational study with intervention including 12 patients undergoing lumbar spine surgery and 24 healthy controls matched based on age and sex. All the subjects underwent gait analysis using the single-point wearable MetaMotionC sensor. The lumbar spine patients also completed traditional patient questionnaires including the Oswestry Disability Index (ODI). Results: The ODI score significantly improved in the patients from the baseline to six weeks postoperatively (42.4 to 22.8; p = 0.01). Simultaneously, the patients demonstrated significant improvements in gait asymmetry (asymmetry in step length, swing time, single support time, and double support time, by 17.4–60.3%; p ≤ 0.039) and variability (variability in gait velocity, step time, step length, stance time, swing time, single support time, and double support time, by 21.0–65.8%; p ≤ 0.023). After surgery, changes in most spatiotemporal (gait velocity, step length, stance time, swing time, and single limb support time) and asymmetry (asymmetry in step time, stance time, swing time, and single limb support time) metrics correlated strongly (magnitude of r = 0.581–0.914) and significantly (p ≤ 0.037) with changes in the ODI. Conclusions: Gait analysis using a single-point wearable sensor can demonstrate objective evidence of recovery in lumbar spine patients after surgery. This may be used as a routine pre- and postoperative assessment during scheduled visits to the clinic.

1. Introduction

Low back pain (LBP) is the leading cause of years lost to disability globally, accounting for 60.1 million disability-adjusted life years in 2015 [1]. Patients with LBP may require lumbar spine surgery, traditionally evaluated using patient-reported outcome measures (PROMs) [2,3]. However, PROMs may be subjective, limiting comparisons across patients [4,5]. Walking (gait) metrics offer objective outcomes that can be used in addition to PROMs to synergistically provide a more comprehensive surgical evaluation [6,7]. Single-point wearable sensors likely represent the method of gait analysis with the most clinical utility, being small, lightweight, and wearable during everyday activities [8].

1.1. Low Back Pain Is Commonly Caused by Lumbar Spine Pathologies

LBP commonly manifests secondary to spinal pathologies occurring in and around the intraspinal lumbar canal, such as lumbar spinal stenosis (LSS) [9], lumbar disc herniation (LDH) [10], and discogenic or mechanical low back pain (MLBP) [11,12]. These are summarised in Figure 1. LSS refers to the narrowing of the intraspinal lumbar canal, typically due to the intrusion of adjacent structures such as a hypertrophied ligamentum flavum [9,13]. This may cause irritation or ischemia of the entrapped nerve roots, resulting in neurogenic claudication, a clinical syndrome of back or leg pain, weakness, and paraesthesia which fluctuates with physical activity [9]. In a similar manner, LDH may also cause the compression of neural tissue within the intraspinal lumbar canal but is instead due to the extrusion of central nuclear disc material through the peripheral annulus fibrosus [10]. Unlike classical neurogenic claudication, symptoms tend to be unilateral and of a greater intensity. Discogenic MLBP is caused by pain originating from the intervertebral discs, and can be due to mechanical torsion injury, or degenerative changes [14], whilst facetogenic MLBP originates from the lumbar zygapophyseal joint and can be caused by osteoarthritis [11]. These pathologies may require surgical intervention [9,12].

1.2. Patient-Reported Outcome Measures Have Drawbacks

Lumbar spine surgery is costly, with lumbar fusion alone averaging over $50,000 USD per hospital admission in the United States over 2004–2015 [15]. Hence, surgical outcome assessment is crucial for cost justification and surgical decision making.
Pre- and postoperative outcome assessment in lumbar surgery traditionally relies on PROMs focused on the measurement of pain and functional disability [2,3]. PROMs have the benefit of capturing the patient’s own perspective of their disease [16]. Commonly used PROMs for lumbar spine surgery are the Oswestry Disability Index (ODI) [2]—the gold-standard, a ten-item questionnaire—and the Visual Analogue Scale (VAS) [3], a pain rating scale. However, scores are influenced by an individual’s perception, which restricts their comparability between patients [4,5]. Even the effectiveness of PROMs in tracking a single patient’s progress over time and through various interventions becomes complex due to patients potentially altering their responses to identical questions as they adapt to their new health state [17,18].
Moreover, PROMs are only collected at discrete timepoints, typically when patients present to a clinic, and do not capture day-to-day fluctuations in health status that occur between visits [16]. These limitations have directed research interest towards objective outcome assessments.

1.3. Gait Analysis Can Objectively Assess Lumbar Spine Patients

Human gait, influenced by neurological and musculoskeletal systems [19], is often altered in patients with lumbar spine pathologies as they adjust their torso, pelvis, and leg positions to mitigate pain or compensate for weakness [20]. Routine gait analysis typically involves clinician observation sometimes integrated with clinical tests such as the Timed Up and Go Test [21]. However, these semi-subjective approaches lead to considerable interobserver variability and fail to provide a detailed understanding of gait kinematics [22].
Technological advancements have facilitated the development of two objective techniques of gait analysis: optoelectronic stereophotogrammetry [23] and wearable devices containing accelerometers, sometimes integrated with gyroscopes and magnetometers in an inertial measurement unit (IMU) [19]. Both methods break down gait into measurable elements, such as distance- and time-related (spatiotemporal) metrics (including gait velocity, step time, and step length). Gait asymmetry can be calculated as the left versus right discrepancy in the spatiotemporal metrics and gait variability as the standard deviation (SD) [24] or coefficient of variation (CoV) [7,25] of the spatiotemporal metrics across a walking bout.

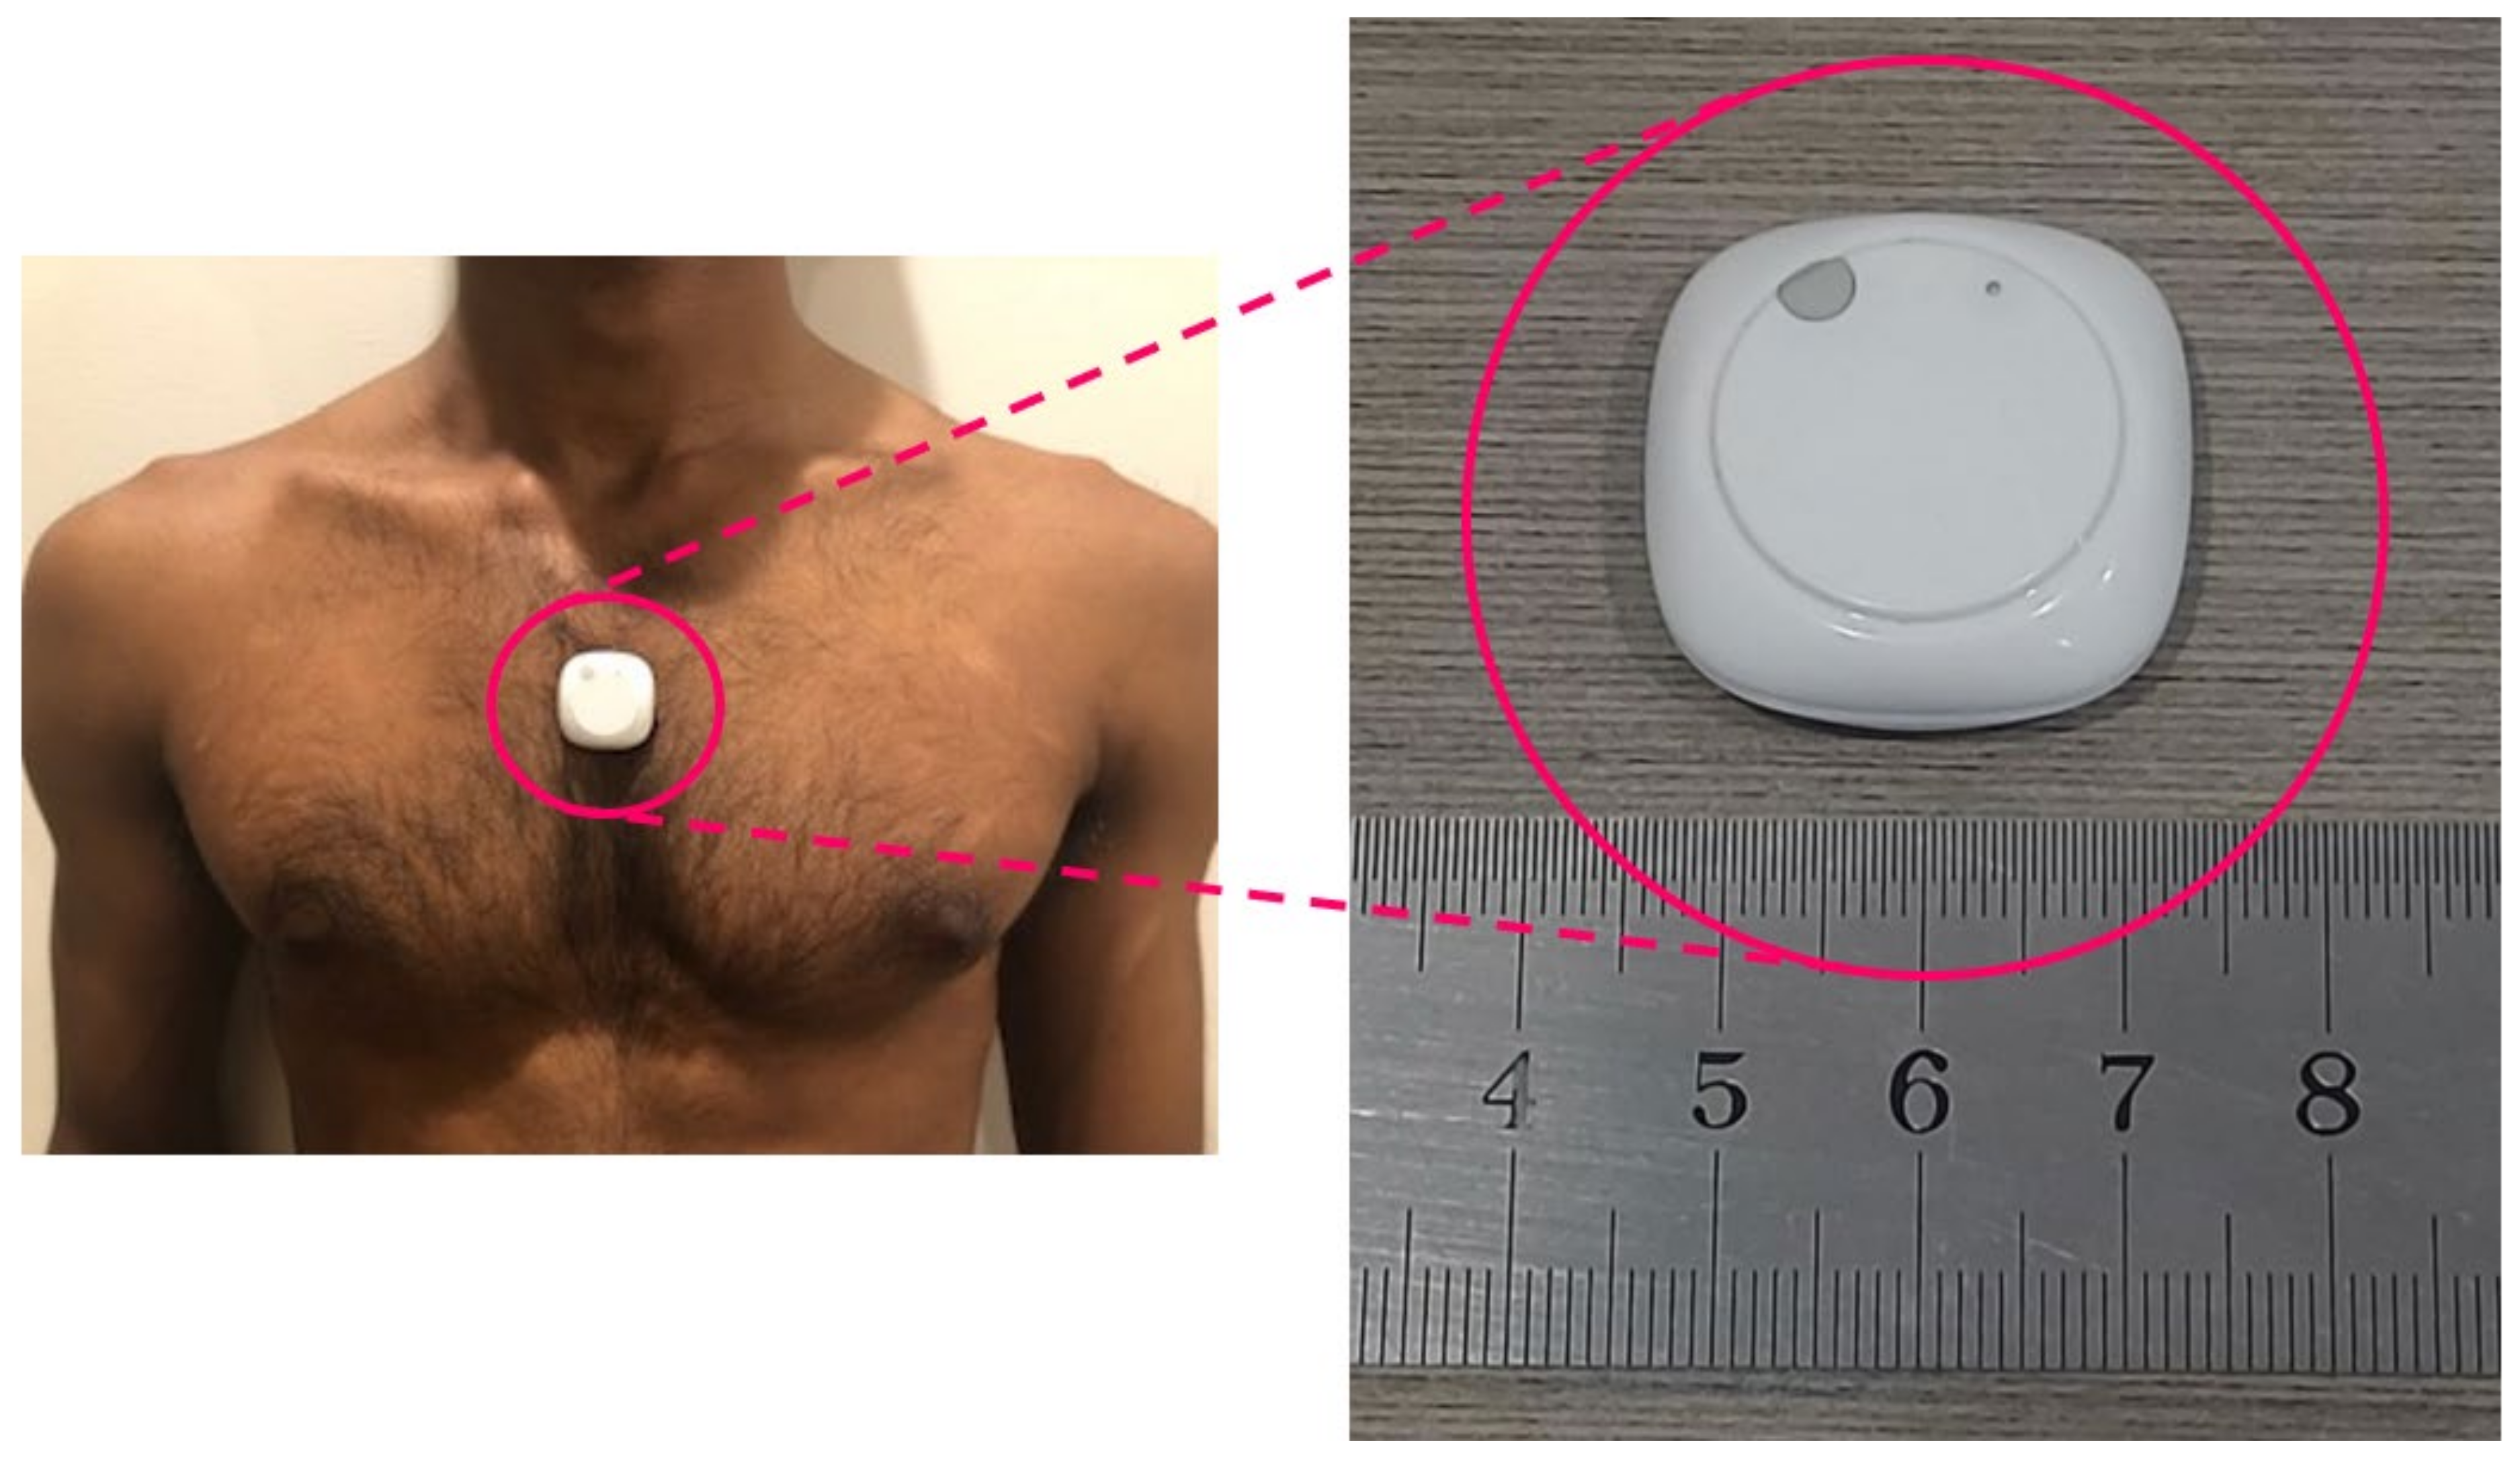
1.4. Single-Point Wearable Sensors Are the Most Clinically Viable Form of Objective Gait Analysis

Optoelectronic stereophotogrammetry, despite being a standard, is limited by cost and practicality [26]. Wearable devices containing IMUs offer a feasible alternative, being cheap, small, and accurate for long-term use [19] whilst also maintaining comparable accuracy to optoelectronic stereophotogrammetry systems (r > 0.83) [27,28,29,30]. Single-point IMU systems, like in smartphones, are likely to be widely adopted in clinical settings.

1.5. Research Problem

Lumbar spine patients have demonstrated altered gait metrics compared to healthy controls. This includes spatiotemporal metrics such as gait velocity [7,31,32,33,34,35,36] (slower), step time [7,31,34,37] (longer), step length [7,31,32,33,34,35] (shorter), and asymmetry (increased) [7,31], though findings surrounding gait variability have been inconsistent [7,24,38,39]. However, only four studies have examined these metrics post lumbar surgery [31,32,33,38]. No study has investigated a collection of spatiotemporal, asymmetry, and variability metrics together. Furthermore, two studies used basic equipment for gait analysis (stopwatch and pedometer) [32,33], limiting their accuracy, while others had either a bulky [38] or multi-point IMU system [31], limiting their clinical viability. Importantly, no study has used a small and lightweight single-point IMU system, precluding the clinical uptake of IMUs in the assessment of surgical lumbar spine patients.
Our goal was to use a single-point wearable IMU system to measure a complete range of gait metrics—spatiotemporal, asymmetry, and variability metrics—in lumbar spine patients, both pre- and post surgery, compared to healthy controls. We also aimed to assess changes in these metrics post surgery and correlate them with changes in the ODI.
We hypothesize that, pre surgery, gait metrics will differ significantly from those of the healthy controls, but not post surgery, and that these changes will moderately correlate with ODI changes.

2. Methodology

The present study was approved by the South Eastern Sydney Local Health District Ethics Committee with reference code 17/184 (approved on 25 July 2017).
This was a prospective observational study with intervention.

2.1. Study Population

The lumbar spine patients were 12 attendees to a neurosurgery clinic (NeuroSpine Clinic, Suite 7, Level 7, Prince of Wales Private Hospital) from March 2021 to June 2021 who were scheduled to undergo lumbar spine surgery. The eligibility criteria for this cohort of patients are summarised in Table 1.
The healthy controls with no gait-altering disease were 24 members from the community recruited using verbal outreach and matched based on age and sex.

2.2. Wearable Device

The wearable IMU used in this study was the MetaMotionC device developed by Mbientlab Inc., San Jose, CA 95124, USA. This device contains a 100 Hz accelerometer for the measurement of linear acceleration, a 100 Hz gyroscope for the measurement of angular acceleration, and a 25 Hz magnetometer to assess the orientation of the sensor relative to the Earth’s magnetic field. It is also small (2.6 cm × 2.6 cm × 2.6 cm) and lightweight (5 g), as shown in Figure 2. The data captured by the MMC were transmitted via BluetoothTM to an Android smartphone running the “IMUGait” application developed for this study. A modified version of the GaitPY Python package [40] developed by Czech and Patel—the “IMUGaitPY” program—was used to convert the data into interpretable gait metrics. This process is expanded upon in Appendix A. The GaitPY program was modified to account for our placement of the MMC at the sternum, instead of the pelvis, to enhance patient comfort [41,42] and, hence, clinical viability. The captured gait metrics included spatiotemporal metrics, from which asymmetry and variability metrics were derived, as in Table 2. The IMUGait application setup instructions and further information surrounding the derivation of asymmetry and variability metrics are provided in Appendix B.

2.3. Procedure

After providing informed written consent, demographic data were obtained from the participants during a structured interview. The lumbar spine patients also completed PROMs (ODI and VAS). As depicted in Figure 2, the MMC device was then attached to the skin overlying the sternal angle using double-sided medical-grade adhesive tape and connected via Bluetooth to the IMUGait application. After a three-second pause to calibrate the device, the participants walked at a self-selected pace along an unobstructed and straight corridor over a self-selected distance of at least 15 m and, at most, 120 m. The self-selected nature of the walk was intended to capture the subject’s natural walking pattern whilst accommodating for the patients who were incapable of walking continuously for 120 m. Gait analysis of the lumbar spine patients was performed preoperatively, at most two weeks before their scheduled surgery, and again at their scheduled six-week follow-up visit. Gait analysis of the healthy controls was performed once, at the time of recruitment.

2.4. Statistical Analysis

All the variables (demographic and gait-related) were assessed for normality using the Shapiro–Wilk test and the visual inspection of histograms. Continuous demographic variables were compared between the groups using the Student’s t test for the normal data and the Mann–Whitney U test for the non-normal data. Categorical demographic variables were compared between the groups using the Chi-Square test of independence. Gait metrics between our three groups of data (pre- and postoperative lumbar spine patient data and healthy control data) were compared using linear mixed models with the fixed effects group, age, and gender and a random effect accounting for each triplet (patient and their two matched controls). The correlation between the change in gait metrics and the change in the ODI after surgery was assessed using the Pearson’s correlation coefficient for the normal data and the Spearman’s rank correlation coefficient for the non-normal data. The level of statistical significance was set to p = 0.05. We did not calculate the minimum sample size required to detect a statistically significant change in gait metrics after surgery due to the paucity of available data in the field. All the statistical analyses were performed using IBM SPSS Statistics Version 26.0 (IBM, New York, NY, USA).

3. Results

Forty-seven patients were eligible for this study (Figure 3). Of these, 12 patients completed baseline and follow-up assessments. Two patients declined participation; one was unable to walk independently; one trial was discarded due to an IMUGaitPY program bug; two patients were pain-free after surgery and did not present to the follow-up; and 29 patients did not present in-person to the follow-up due to the COVID-19 pandemic. Of the 12 patients with complete preoperative and postoperative data, six had LSS and underwent simple decompression, four had LDH and underwent microdiscectomy, and two had combinations of discogenic and facetogenic MLBP, with one undergoing anterior lumbar interbody fusion with total disc arthroplasty and the other undergoing anterior lumbar interbody fusion with posterior fixation. The mean follow-up time was 40.2 days. The patients had a mean age of 61.0 years, a mean body mass index of 27.9 kg/m2, and 58.3% of them were female (seven out of twelve). No statistically significant differences in the baseline demographic characteristics were found between the patients and the healthy controls, with the healthy controls having a mean age of 60.7 years, a mean body mass index of 26.7 kg/m2, and 58.3% of them were female (14 out of 24). Additional demographic characteristics are described in Table 3.

3.1. Comparison of Outcome Measures between Groups

Table 4 and Table 5 show the outcome measures in the lumbar spine patients and the healthy controls. The patient-reported outcome measures improved significantly in the lumbar spine patients after surgery. The ODI decreased by 19.8% (p = 0.01) and the VAS by 55% (p = 0.001).

3.1.1. Lumbar Spine Patients Had Altered Gait Metrics Preoperatively

Before surgery, the lumbar spine patients had altered (9.91–20.2%) spatiotemporal metrics compared to the healthy controls, reaching statistical significance in all the metrics except for step length: gait velocity (p = 0.008), step time (p = 0.006), stance time (p = 0.003), swing time (p = 0.002), single support time (p = 0.001), and double limb support time (p = 0.027). The patients also had increased gait asymmetry (4.56–108%), reaching significance in most metrics: stance time asymmetry (p = 0.037), swing time asymmetry (p = 0.036), single support time asymmetry (p = 0.009), and double support time asymmetry (p = 0.017). Similarly, the patients had increased gait variability (5.88–95.6%), reaching significance in some metrics: step length variability (p = 0.019), single support time variability (p = 0.009), and double support time variability (p = 0.048). These differences are summarised in Figure 4.

3.1.2. Lumbar Spine Patients Demonstrated Reduced Gait Asymmetry and Variability after Surgery

Changes in gait metrics after surgery relative to the healthy controls are represented in Figure 4. No spatiotemporal metrics improved significantly, with percentage changes all under 10%. Consequently, most spatiotemporal metrics were still significantly different to the controls after surgery: step time (p = 0.001), stance time (p = 0.005), swing time (p = 0.026), single support time (p = 0.044), and double support time (p = 0.002). However, the patients demonstrated improved gait asymmetry (17.4–60.4%), with significant reductions in most metrics: step length asymmetry (p = 0.016), swing time asymmetry (p = 0.039), single support time asymmetry (p = 0.012), and double support time asymmetry (p = 0.027). Accordingly, no asymmetry metrics were significantly different compared to the controls postoperatively. Similarly, the patients demonstrated improved gait variability (21.0–65.8%), reaching significance in all the metrics: gait velocity variability (p = 0.011), step time variability (p = 0.001), step length variability (p = 0.011), stance time variability (p = 0.023), swing time variability (p = 0.004), single support time variability (p = 0.001), and double support time variability (p = 0.014). No variability metrics were significantly different to the controls postoperatively.

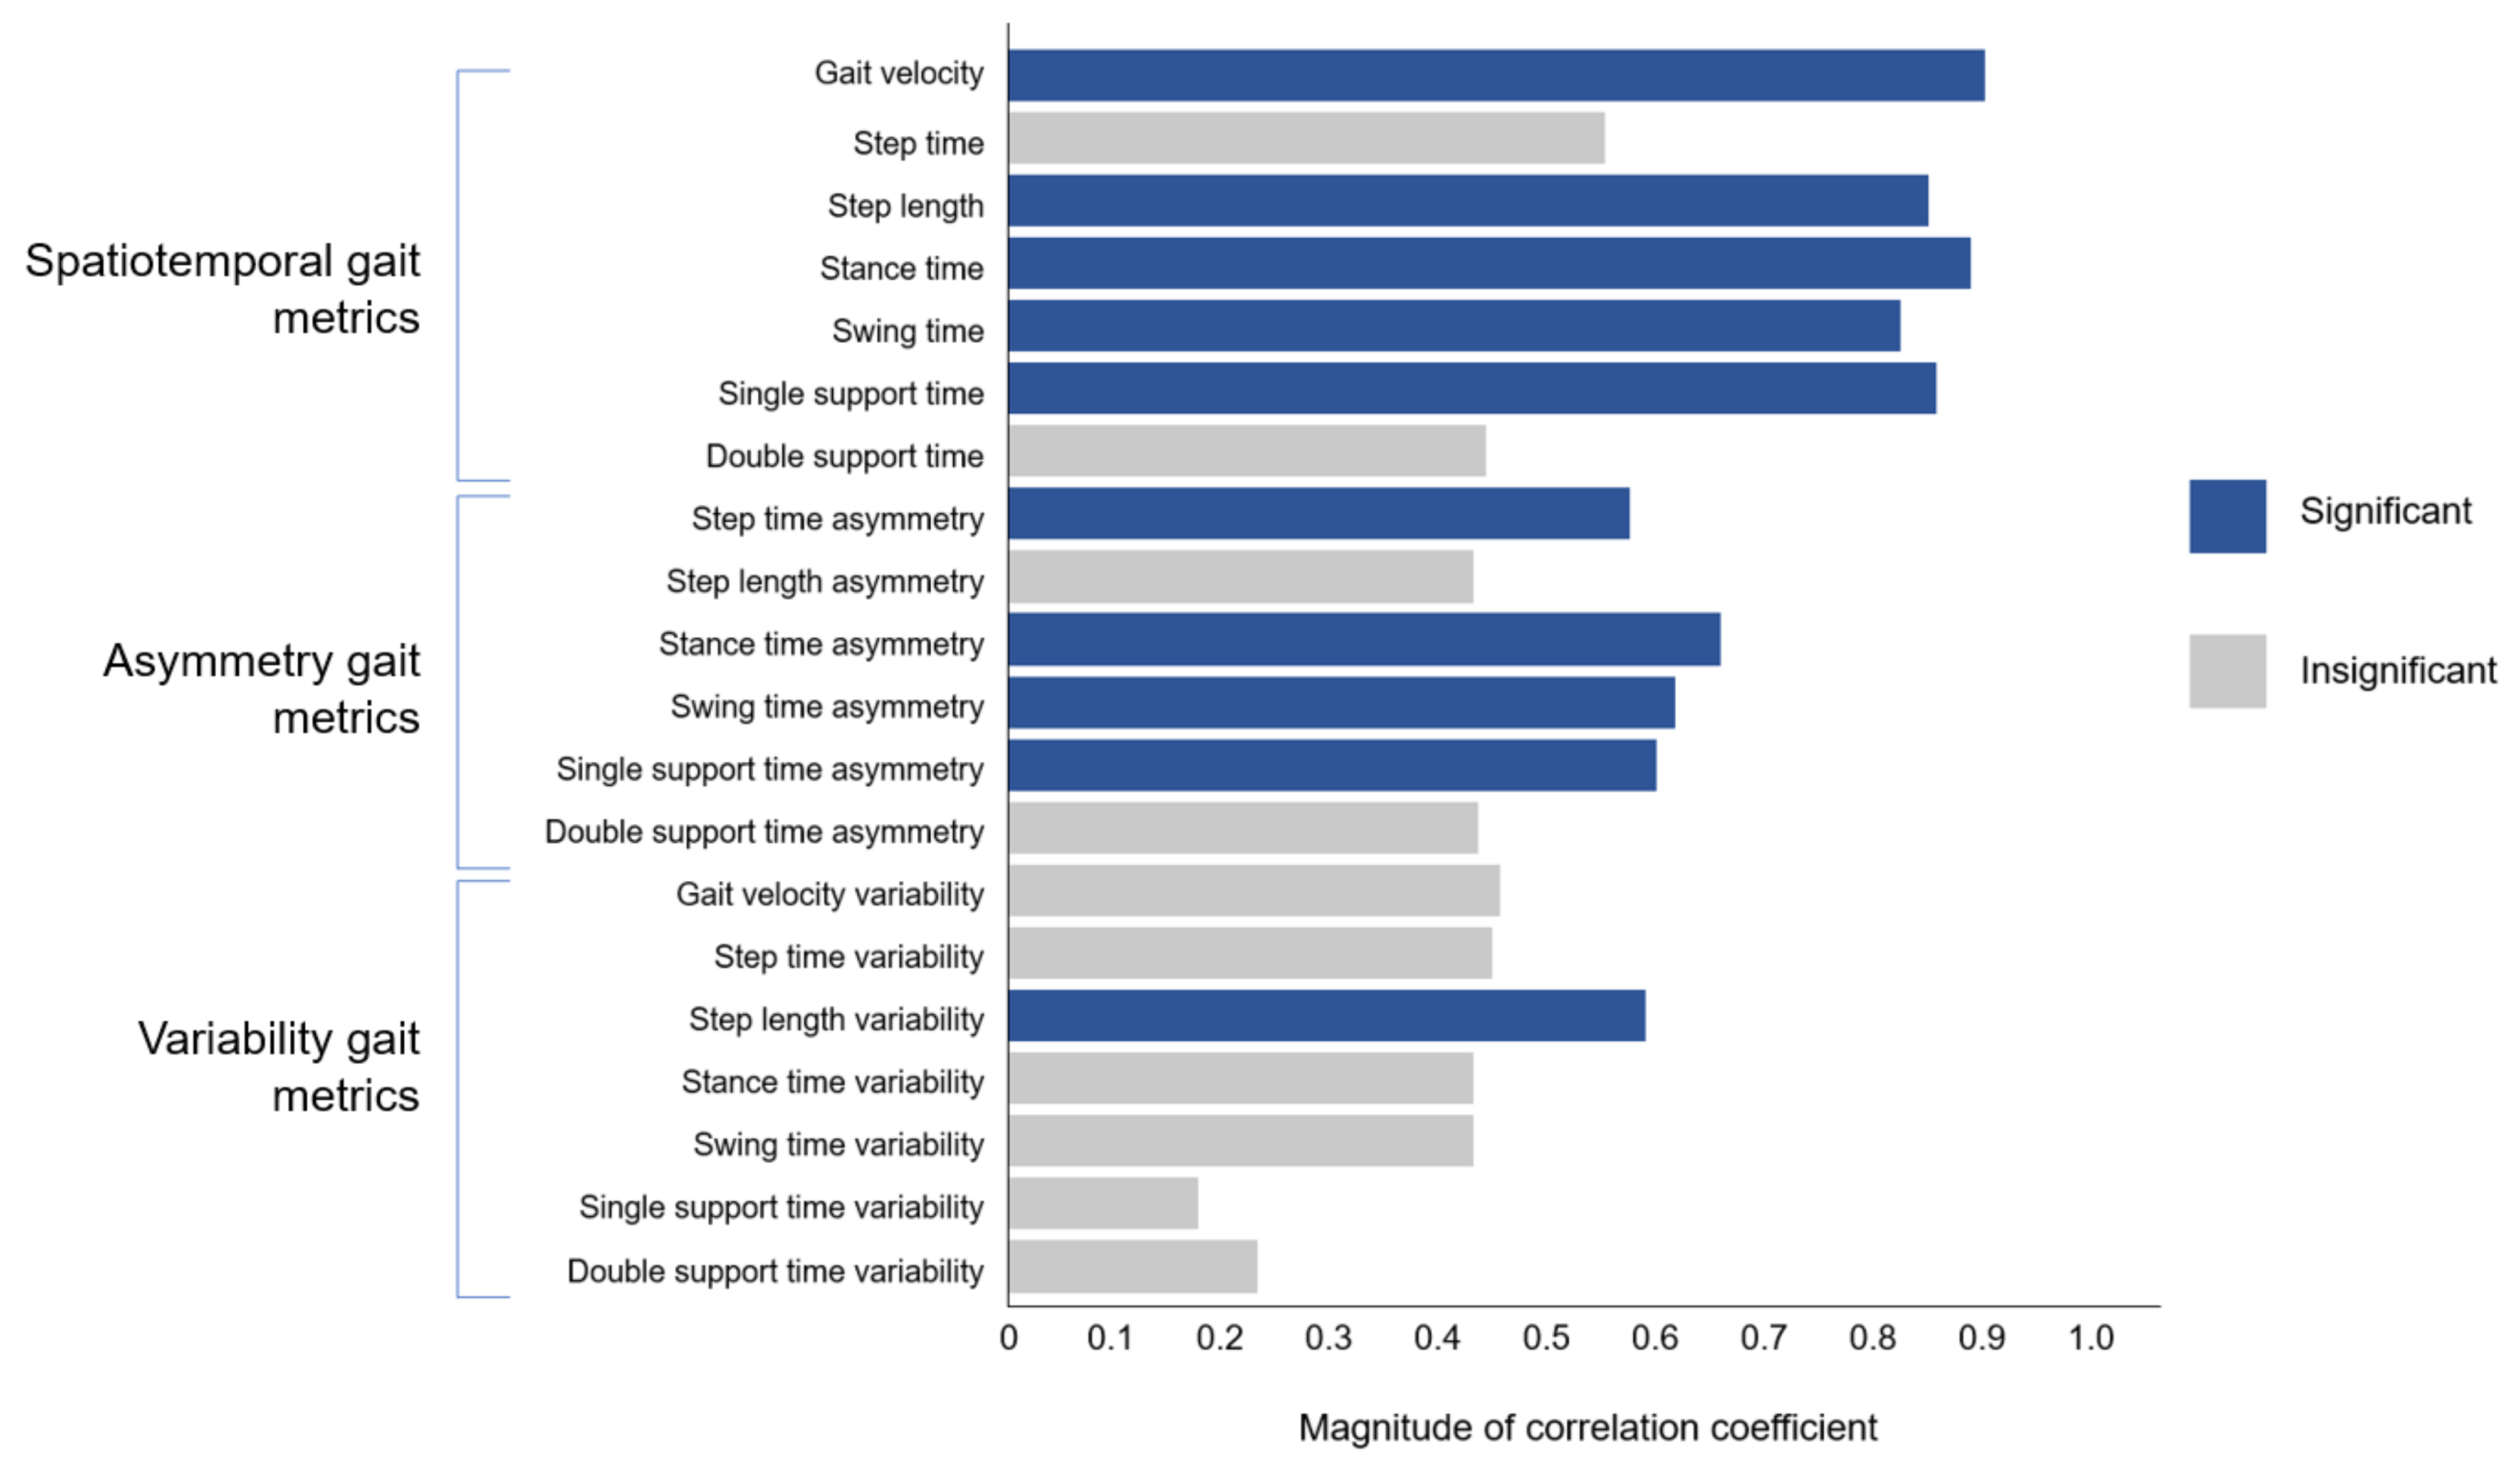
3.2. Changes in Spatiotemporal and Asymmetry Metrics Correlate Well with Changes in the ODI after Surgery

Changes in most spatiotemporal metrics correlated strongly and significantly with changes in the ODI: gait velocity (r = −0.914, p < 0.001), step length (r = −0.862, p < 0.001), stance time (r = 0.902, p < 0.001), swing time (r = 0.835, p = 0.001), and single support time (r = 0.869, p < 0.001). Changes in most asymmetry metrics correlated strongly and significantly with changes in the ODI: step time asymmetry (r = 0.581, p = 0.047), stance time asymmetry (r = 0.666, p = 0.018), swing time asymmetry (r = 0.623, p = 0.030), and single support time asymmetry (r = 0.606, p = 0.037). Changers in variability metrics correlated predominantly insignificantly with changes in the ODI, with only step length variability reaching significance (r = 0.596, p = 0.041). This is summarised in Table 6 and summarised in Figure 5.

4. Discussion

Gait metrics, objectively assessed with single-point wearable sensors, enhance lumbar spine patient evaluations when combined with PROMs scores. This study is the first to assess pre- and postoperative gait metrics using such sensors. Post surgery, the patients in our study showed improved gait asymmetry and variability, supporting the clinical use of single-point IMU systems for routine assessments in lumbar spine surgery.

4.1. Preoperative Assessment of Lumbar Spine Patients Compared with Healthy Controls

Before surgery, the lumbar spine patients exhibited severe functional disability (mean ODI score: 42.4) and moderate pain (median VAS: 7.00), with significantly altered gait metrics compared to the healthy controls, including increased gait asymmetry and variability.

4.1.1. Spatiotemporal Gait Metrics

In the present study, all the spatiotemporal metrics, except for step length, were significantly altered in the lumbar spine patients compared to the healthy controls, with an 11% mean reduction in step length. Other studies [24,31,34,35,43] with larger sample sizes found reductions of similar magnitudes (12–26%) to be significant, suggesting that our study lacked the statistical power to detect a significant difference.
The patients in our study walked 20% slower and presented an 11% increase in step time, consistent with other research works showing 13–24% decreases in gait velocity [7,24,31,36] and 8–16% increases in step time [7,31,37]. We also noted significant increases in double limb support time (11%), single limb support time (14%), stance time (15%), and swing time (15%). Besides our study, only Kang et al. [37] have investigated these metrics in lumbar spine patients (LDH specifically) relative to healthy controls. They found no significant changes in these metrics, potentially due to the older age of their control group. Overall, our findings underscore the altered spatiotemporal metrics (lower spatial and higher temporal metrics) in lumbar spine patients, highlighting their importance in patient assessment.

4.1.2. Asymmetry and Variability Gait Metrics

In our study, the lumbar spine patients showed significantly increased asymmetry and variability in gait metrics compared to the healthy controls. The patients had a significantly increased asymmetry in stance time (95%), swing time (108%), single support time (88%), and double support time (16%). Although limited, existing research predominantly supports these findings. Loske et al. [31] similarly reported significantly increased asymmetry in stance time (131%), swing time (170%), single support time (131%), and double support time (24%). Betteridge et al. [7] did not investigate these asymmetry metrics but instead found significantly increased asymmetry in step time (153%) and step length (68%). This contrasts our study, which did not find significant differences in these asymmetry metrics. This may be attributed to differing study populations, with our study including LSS, LDH, and MLBP patients and Betteridge et al.’s study only investigating LSS patients. Nonetheless, our study and the wider literature together show that lumbar spine patients have an overall asymmetrical gait.
Furthermore, the lumbar spine patients in our study demonstrated significantly increased variability in step length (33%), single support time (96%), and double support time (75%). Previous studies analysing gait variability in lumbar spine patients have mixed results. Papadakis et al. [39] found significantly increased variability in LSS patients compared to controls (0.811 versus −0.216 nats; p < 0.001), contrasting with Betteridge et al. [7] who found no significant differences. Lamoth et al. [24] reported less variable stride length (48%) in MLBP patients over a short walkway, suggesting that pain may lead to a more rigid gait. However, studies involving longer walking distances reflect a deterioration in gait metrics due to fatigue and discomfort. This highlights the importance of assessing gait variability in lumbar spine patients over extended walking periods for a comprehensive evaluation.

4.2. Changes in Outcome Measures after Surgery and Comparisons with Healthy Controls

Post surgery, the patients demonstrated objective evidence of recovery with reductions in gait asymmetry and gait variability. The patients’ ODI improvements (from 42.4 to 22.8; p = 0.01) correlated well with changes in spatiotemporal and asymmetry metrics but poorly with variability metrics.

4.2.1. Spatiotemporal Gait Metrics

The present study found no significant post-surgery improvements in spatiotemporal metrics, which remained significantly different to the controls (step time, stance time, swing time, single support time, and double support time). In contrast, Ghent et al. [32] (investigating LDH patients) and Mobbs et al. [33] (investigating LSS patients) observed significant improvements in gait velocity and step length in their longer follow-up studies (nine weeks and three months, respectively). However, Loske et al. [31] did not report improvements, even after a 12-month follow-up period. These discrepant findings suggest that recovery patterns in spatiotemporal metrics may depend on follow-up duration and postoperative care, indicating a need for tailored rehabilitation programs.

4.2.2. Asymmetry and Variability Gait Metrics

Post surgery, significant improvements were observed in the asymmetry and variability metrics. The patients demonstrated significant reductions in the asymmetry in step length (17%), swing time (60%), single support time (50%), and double support time (29%), along with improvements in the variability in gait velocity (21%), step time (54%), step length (34%), stance time (29%), swing time (59%), single support time (62%), and double support time (66%). These changes brought patients to normal levels of gait asymmetry and variability after surgery. Supporting these findings, Loske et al. [31] and Papadakis et al. [38] also reported significant post-surgical improvements in these metrics, with Loske et al. finding all asymmetry metrics to reach normal values and Papadakis et al. observing a 54% improvement in gait variability. Overall, this evidence suggests that gait asymmetry and variability are reliable indicators of recovery following lumbar surgery.

4.2.3. Correlation between Changes in Gait Metrics and Changes in the Oswestry Disability Index

Changes in the ODI correlated strongly with most spatiotemporal metrics (gait velocity, step length, stance time, swing time, and single limb support time; r = 0.835–0.914, p ≤ 0.001) and asymmetry metrics (step time asymmetry, stance asymmetry, swing asymmetry, and single limb support time asymmetry; magnitude of r = 0.581–0.666, p ≤ 0.047). Supporting this, Ghent et al. [32] and Mobbs et al. [33] found similar significant strong correlations between changes in the Gait Posture index (a composite score which includes the spatiotemporal metrics gait velocity and step length) and the ODI (Pearson’s correlation coefficient, r = 0.56 and 0.682, respectively (p < 0.01). Loske et al. [31] also identified strong correlations between specific spatiotemporal metrics and the ODI. These findings suggest that patients perceive compromised spatiotemporal and asymmetry gait metrics as functional limitations, reinforcing the importance of monitoring patient recovery in these metrics.
The present study, possibly the first of its kind, found an insignificant correlation between variability metrics and the ODI, with only step length variability showing significance (r = 0.596, p = 0.041). This should be interpreted with caution given our small sample size but suggests that gait variability might represent an aspect of functional status not fully captured by the ODI, offering a more comprehensive assessment of surgical lumbar spine patients.

4.3. Justification of Study Techniques

The present study replicated Betteridge et al.’s methodology [7], using a chest-based MMC sensor for gait metrics’ measurement. This sensor demonstrated over 92% agreement with a reference standard (videography), showing high accuracy (ICC > 0.86, p < 0.001) in both lumbar spine patients and healthy controls. The chest placement, unlike conventional IMU placements on the lower back [38,44,45,46,47], ankle [46,48], wrist [49], or thigh [47], offers easy, repeatable attachment and minimal daily activity interference, enhancing clinical utility [41,50]. Additionally, we chose to report step-by-step data as recommended by Galna et al. [51], rather than stride-by-stride data, due to its higher within-person reliability (ICC = 0.598–0.819) in continuous walking, providing a more consistent measurement of gait metrics. Considering future applications, exploring the efficacy of IMU-based gait parameters in other patient populations could further validate and expand the utility of this technology. Additionally, investigating alternative sensor placements might optimize gait metric accuracy across varied conditions and patient groups.

4.4. Strengths and Limitations

The present study’s strengths include a comprehensive gait analysis using spatiotemporal, asymmetry, and variability metrics in lumbar spine patients, providing greater depth compared to similar studies [31,32,33,38]. The use of a small, unobtrusive wearable sensor for natural-setting measurements enhanced internal validity and mitigated the white-coat effect common in laboratory settings [24,34,37].
An additional advantage is our inclusion of a healthy control cohort matched by age and sex. This enabled us to compare the post-surgery gait metrics with normal values and account for age- and sex-related gait changes [52]. This is important because age and sex can affect gait metrics, as evidenced by a meta-analysis showing that gait velocity decreases by 0.07–0.10 m/s with each decade after age 50 [52]. The same study showed that women walk 0.02–0.15 m/s slower than men in each corresponding ten-year age group [52].
However, our study has some limitations. Our small sample size of 12 lumbar spine patients restricted our ability to perform regression analyses on subcategories or surgical details. Additionally, this study was conducted by a single surgeon at one hospital, limiting the findings’ generalizability. We also had a relatively short follow-up time of six weeks, leaving uncertainty about the long-term recovery of spatiotemporal metrics.
While the single-point MMC sensor allowed for more natural environment measurements, this did not replicate a person’s most natural everyday environment, and the white-coat effect may still have influenced the results [53,54]. Its limited data storage capacity restricted the analysis to specific timepoints, preventing the observation of gait pattern fluctuations over time.

4.5. Future Directions

Future studies are needed to leverage the potential for a single-point wearable sensor to monitor the gait patterns of lumbar spine patients during everyday activities. This may now be possible using the new MetaMotionS sensor that has a two-day continuous gait recording capacity [55]. Software engineering techniques could extend this data capture window further, up to two weeks; for instance, the device can be programmed to sample five seconds of gait data per minute that the user is walking. This would reduce the white-coat effect [19] and allow remote tracking of day-to-day gait fluctuations for the early detection of postoperative complications.
Additionally, future studies should aim for larger sample sizes (30+ patients per subcategory) and perform regression analyses to account for spinal pathology occurring at different anatomical levels. Participants should also be recruited from multiple hospitals across various surgeons to ensure external validity and explore optimal sensor placements for accurate gait measurement. Finally, extended follow-up periods of at least two months are also recommended to evaluate long-term gait recovery trends post surgery.

5. Conclusions

This study is the first to use a single-point wearable IMU to objectively demonstrate recovery in patients post lumbar spine surgery. Post surgery, the patients showed significant improvements in gait asymmetry and variability, aligning with normal values. The observed correlation between changes in spatiotemporal and asymmetry metrics with the Oswestry Disability Index (ODI) indicates that patients perceive these gait aspects to be closely related to their functional and pain status. However, the mostly insignificant correlation between the variability metrics and the ODI suggests that, while objective gait analysis may not replace subjective patient assessments like PROMs, it adds a valuable dimension for a more thorough evaluation of patients’ health status. These results support the use of clinically practical single-point IMUs in lumbar spine patient assessments. Future research should focus on utilizing advanced sensor technologies to monitor daily gait patterns of lumbar spine patients in real-life settings.

Author Contributions

Conception and design: R.D.F., R.J.M. and M.M.M.; administrative support: L.K.; provision of study materials or patients: R.D.F. and R.J.M.; collection and assembly of data: R.D.F., R.J.M. and P.N.; data analysis and interpretation: R.D.F., R.J.M. and P.N.; software engineering: L.S.; manuscript writing: all authors. All authors have read and agreed to the published version of the manuscript.

Funding

This research received no external funding.

Institutional Review Board Statement

The present study was approved by the South Eastern Sydney Local Health District Ethics Committee with reference code 17/184 (approved on 25 July 2017).

Informed Consent Statement

Written consent was obtained from the included participants prior to their participation in this study.

Data Availability Statement

The datasets used and/or analysed during the current study are available from the corresponding author upon reasonable request.

Conflicts of Interest

The authors declare that they have no competing interests.

Abbreviations

CoVCoefficient of variation
COVID-19Novel coronavirus disease
ICCIntraclass correlation coefficient
IMUInertial measurement unit
LBPLow back pain
LDHLumbar disc herniation
LSSLumbar spinal stenosis
MMCMetaMotionC
MLBPMechanical low back pain
ODIOswestry Disability Index
pProbability value
PROMPatient-reported outcome measure
rPearson’s correlation coefficient
SDStandard deviation
VASVisual Analogue Scale

Appendix A. Data Processing Workflow

Figure A1. Flowchart of data processing workflow. While worn by the subject, the MetaMotionC detects raw acceleration signals. A python script—the IMUGaitPY program—is used to detect gait cycle events and extract spatiotemporal gait metrics from the raw data. Asymmetry and variability metrics are also mathematically derived from the spatiotemporal metrics. The collection of spatiotemporal, asymmetry, and variability metrics is uploaded as a csv file for interpretation.
Std 13 00004 g0a1

Appendix B. Additional Information Regarding the IMUGaitPY Program

Additional information regarding the IMUGaitPY program is contained within the following link created by LWS accessed on 6 July 2022: https://lsy3.gitlab.io/IMUGaitPy/index.html.

References

  1. Vos, T.; Allen, C.; Arora, M.; Barber, R.M.; Bhutta, Z.A.; Brown, A.; Carter, A.; Casey, D.C.; Charlson, F.J.; Chen, A.Z.; et al. Global, regional, and national incidence, prevalence, and years lived with disability for 310 diseases and injuries, 1990–2015: A systematic analysis for the Global Burden of Disease Study 2015. Lancet 2016, 388, 1545–1602. [Google Scholar] [CrossRef]
  2. Fairbank, J.C.; Pynsent, P.B. The Oswestry Disability Index. Spine 2000, 25, 2940–2952. [Google Scholar] [CrossRef]
  3. Mannion, A.F.; Balagué, F.; Pellisé, F.; Cedraschi, C. Pain measurement in patients with low back pain. Nat. Clin. Pract. Rheumatol. 2007, 3, 610–618. [Google Scholar] [CrossRef]
  4. Stienen, M.N.; Smoll, N.R.; Joswig, H.; Snagowski, J.; Corniola, M.V.; Schaller, K.; Hildebrandt, G.; Gautschi, O.P. Influence of the mental health status on a new measure of objective functional impairment in lumbar degenerative disc disease. Spine J. 2017, 17, 807–813. [Google Scholar] [CrossRef]
  5. Merrill, R.K.; Zebala, L.P.; Peters, C.; Qureshi, S.A.; McAnany, S.J. Impact of depression on patient-reported outcome measures after lumbar spine decompression. Spine 2018, 43, 434–439. [Google Scholar] [CrossRef] [PubMed]
  6. Haddas, R.; Ju, K.L.; Belanger, T.; Lieberman, I.H. The use of gait analysis in the assessment of patients afflicted with spinal disorders. Eur. Spine J. 2018, 27, 1712–1723. [Google Scholar] [CrossRef] [PubMed]
  7. Betteridge, C.; Mobbs, R.J.; Fonseka, R.D.; Natarajan, P.; Ho, D.; Choy, W.J.; Sy, L.W.; Pell, N. Objectifying clinical gait assessment: Using a single-point wearable sensor to quantify the spatiotemporal gait metrics of people with lumbar spinal stenosis. J. Spine Surg. 2021, 7, 254–268. [Google Scholar] [CrossRef] [PubMed]
  8. Muro-de-la-Herran, A.; Garcia-Zapirain, B.; Mendez-Zorrilla, A. Gait analysis methods: An overview of wearable and non-wearable systems, highlighting clinical applications. Sensors 2014, 14, 3362–3394. [Google Scholar] [CrossRef] [PubMed]
  9. Siebert, E.; Prüss, H.; Klingebiel, R.; Failli, V.; Einhäupl, K.M.; Schwab, J.M. Lumbar spinal stenosis: Syndrome, diagnostics and treatment. Nat. Rev. Neurol. 2009, 5, 392–403. [Google Scholar] [CrossRef]
  10. Raj, P.P. Intervertebral disc: Anatomy-physiology-pathophysiology-treatment. Pain Pract. 2008, 8, 18–44. [Google Scholar] [CrossRef] [PubMed]
  11. van Kleef, M.; Vanelderen, P.; Cohen, S.P.; Lataster, A.; Van Zundert, J.; Mekhail, N. Pain originating from the lumbar facet joints. Pain Pract. 2010, 10, 459–469. [Google Scholar] [CrossRef]
  12. Borenstein, D. Mechanical low back pain—A rheumatologist’s view. Nat. Rev. Rheumatol. 2013, 9, 643–653. [Google Scholar] [CrossRef] [PubMed]
  13. Lee, B.H.; Moon, S.-H.; Suk, K.-S.; Kim, H.-S.; Yang, J.-H.; Lee, H.-M. Lumbar spinal stenosis: Pathophysiology and treatment principle: A narrative review. Asian Spine J. 2020, 14, 682–693. [Google Scholar] [CrossRef] [PubMed]
  14. Vlaeyen, J.W.S.; Maher, C.G.; Wiech, K.; Van Zundert, J.; Meloto, C.B.; Diatchenko, L.; Battié, M.C.; Goossens, M.; Koes, B.; Linton, S.J. Low back pain. Nat. Rev. Dis. Primers 2018, 4, 52. [Google Scholar] [CrossRef] [PubMed]
  15. Martin, B.I.; Mirza, S.K.; Spina, N.; Spiker, W.R.; Lawrence, B.; Brodke, D.S. Trends in lumbar fusion procedure rates and associated hospital costs for degenerative spinal diseases in the United States, 2004 to 2015. Spine 2019, 44, 369–376. [Google Scholar] [CrossRef] [PubMed]
  16. McCormick, J.D.; Werner, B.C.; Shimer, A.L. Patient-reported outcome measures in spine surgery. J. Am. Acad. Orthop. Surg. 2013, 21, 99–107. [Google Scholar] [CrossRef] [PubMed]
  17. Schwartz, C.E.; Bode, R.; Repucci, N.; Becker, J.; Sprangers, M.A.G.; Fayers, P.M. The clinical significance of adaptation to changing health: A meta-analysis of response shift. Qual. Life Res. 2006, 15, 1533–1550. [Google Scholar] [CrossRef] [PubMed]
  18. Oort, F.J.; Visser, M.R.; Sprangers, M.A. An application of structural equation modeling to detect response shifts and true change in quality of life data from cancer patients undergoing invasive surgery. Qual. Life Res. 2005, 14, 599–609. [Google Scholar] [CrossRef] [PubMed]
  19. Chen, S.; Lach, J.; Lo, B.; Yang, G.Z. Toward pervasive gait analysis with wearable sensors: A systematic review. IEEE J. Biomed. Health Inform. 2016, 20, 1521–1537. [Google Scholar] [CrossRef]
  20. DeFroda, S.F.; Daniels, A.H.; Deren, M.E. Differentiating radiculopathy from lower extremity arthropathy. Am. J. Med. 2016, 129, 1124.e1–1124.e7. [Google Scholar] [CrossRef]
  21. Stienen, M.N.; Maldaner, N.; Joswig, H.; Corniola, M.V.; Bellut, D.; Prömmel, P.; Regli, L.; Weyerbrock, A.; Schaller, K.; Gautschi, O.P. Objective functional assessment using the “Timed Up and Go” test in patients with lumbar spinal stenosis. Neurosurg. Focus 2019, 46, e4. [Google Scholar] [CrossRef]
  22. Saleh, M.; Murdoch, G. In defence of gait analysis. Observation and measurement in gait assessment. J. Bone Jt. Surg. 1985, 67, 237–241. [Google Scholar] [CrossRef] [PubMed]
  23. Cappozzo, A.; Della Croce, U.; Leardini, A.; Chiari, L. Human movement analysis using stereophotogrammetry. Part 1: Theoretical background. Gait Posture 2005, 21, 186–196. [Google Scholar] [PubMed]
  24. Lamoth, C.J.C.; Stins, J.F.; Pont, M.; Kerckhoff, F.; Beek, P.J. Effects of attention on the control of locomotion in individuals with chronic low back pain. J. Neuroeng. Rehabil. 2008, 5, 23–40. [Google Scholar] [CrossRef] [PubMed]
  25. Gaßner, H.; Jensen, D.; Marxreiter, F.; Kletsch, A.; Bohlen, S.; Schubert, R.; Muratori, L.M.; Eskofier, B.; Klucken, J.; Winkler, J.; et al. Gait variability as digital biomarker of disease severity in Huntington’s disease. J. Neurol. 2020, 267, 1594–1601. [Google Scholar] [CrossRef] [PubMed]
  26. Shahar, R.T.; Agmon, M. Gait analysis using accelerometry data from a single smartphone: Agreement and consistency between a smartphone application and gold-standard gait analysis system. Sensors 2021, 21, 7497. [Google Scholar] [CrossRef]
  27. Washabaugh, E.P.; Kalyanaraman, T.; Adamczyk, P.G.; Claflin, E.S.; Krishnan, C. Validity and repeatability of inertial measurement units for measuring gait parameters. Gait Posture 2017, 55, 87–93. [Google Scholar] [CrossRef]
  28. Kluge, F.; Gaßner, H.; Hannink, J.; Pasluosta, C.; Klucken, J.; Eskofier, B.M. Towards mobile gait analysis: Concurrent validity and test-retest reliability of an inertial measurement system for the assessment of spatio-temporal gait parameters. Sensors 2017, 17, 1522. [Google Scholar] [CrossRef] [PubMed]
  29. Rantalainen, T.; Pirkola, H.; Karavirta, L.; Rantanen, T.; Linnamo, V. Reliability and concurrent validity of spatiotemporal stride characteristics measured with an ankle-worn sensor among older individuals. Gait Posture 2019, 74, 33–39. [Google Scholar] [CrossRef]
  30. Phan, K.; Mobbs, R.J. Long-term objective physical activity measurements using a wireless accelerometer following minimally invasive transforaminal interbody fusion surgery. Asian Spine J. 2016, 10, 366–369. [Google Scholar] [CrossRef]
  31. Loske, S.; Nüesch, C.; Byrnes, K.S.; Fiebig, O.; Schären, S.; Mündermann, A.; Netzer, C. Decompression surgery improves gait quality in patients with symptomatic lumbar spinal stenosis. Spine J. 2018, 18, 2195–2204. [Google Scholar] [CrossRef]
  32. Ghent, F.; Mobbs, R.J.; Mobbs, R.R.; Sy, L.; Betteridge, C.; Choy, W.J. Assessment and post-intervention recovery after surgery for lumbar disk herniation based on objective gait metrics from wearable devices using the Gait Posture Index. World Neurosurg. 2020, 142, e111–e116. [Google Scholar] [CrossRef]
  33. Mobbs, R.J.; Mobbs, R.R.; Choy, W.J. Proposed objective scoring algorithm for assessment and intervention recovery following surgery for lumbar spinal stenosis based on relevant gait metrics from wearable devices: The Gait Posture index (GPi). J. Spine Surg. 2019, 5, 300–309. [Google Scholar] [CrossRef] [PubMed]
  34. Suda, Y.; Saitou, M.; Shibasaki, K.; Yamazaki, N.; Chiba, K.; Toyama, Y. Gait analysis of patients with neurogenic intermittent claudication. Spine 2002, 27, 2509–2513. [Google Scholar] [CrossRef] [PubMed]
  35. Perring, J.; Mobbs, R.; Betteridge, C. Analysis of patterns of gait deterioration in patients with lumbar spinal stenosis. World Neurosurg. 2020, 141, e55–e59. [Google Scholar] [CrossRef] [PubMed]
  36. Lee, C.E.; Simmonds, M.J.; Etnyre, B.R.; Morris, G.S. Influence of pain distribution on gait characteristics in patients with low back pain: Part 1: Vertical ground reaction force. Spine 2007, 32, 1329–1336. [Google Scholar] [CrossRef]
  37. Kang, X.; Li, K.; Li, J.; Wei, N.; Yue, S. Abnormal gait and neuromuscular dysfunction analysis in patients with lumbar disc herniation. IFAC-PapersOnLine 2020, 53, 244–249. [Google Scholar] [CrossRef]
  38. Papadakis, N.C.; Christakis, D.G.; Tzagarakis, G.N.; Chlouverakis, G.I.; Kampanis, N.A.; Stergiopoulos, K.N.; Katonis, P.G. Gait variability measurements in lumbar spinal stenosis patients: Part B. Preoperative versus postoperative gait variability. Physiol. Meas. 2009, 30, 1187–1195. [Google Scholar] [CrossRef]
  39. Papadakis, N.C.; Christakis, D.G.; Tzagarakis, G.N.; Chlouverakis, G.I.; Kampanis, N.A.; Stergiopoulos, K.N.; Katonis, P.G. Gait variability measurements in lumbar spinal stenosis patients: Part A. Comparison with healthy subjects. Physiol. Meas. 2009, 30, 1171–1186. [Google Scholar] [CrossRef]
  40. Czech, M.; Patel, S. GaitPy: An open-source python package for gait analysis using an accelerometer on the lower back. J. Open Source Softw. 2019, 4, 1778. [Google Scholar] [CrossRef]
  41. Nazarahari, M.; Rouhani, H. Detection of daily postures and walking modalities using a single chest-mounted tri-axial accelerometer. Med. Eng. Phys. 2018, 57, 75–81. [Google Scholar] [CrossRef] [PubMed]
  42. Di Tocco, J.; Raiano, L.; Sabbadini, R.; Massaroni, C.; Formica, D.; Schena, E. A wearable system with embedded conductive textiles and an IMU for unobtrusive cardio-respiratory monitoring. Sensors 2021, 21, 3018. [Google Scholar] [CrossRef] [PubMed]
  43. Betteridge, C.; Mobbs, R.J.; Ho, D. Proposed objective scoring algorithm for walking performance, based on relevant gait metrics: The Simplified Mobility Score (SMoS™)-observational study. J. Orthop. Surg. Res. 2021, 16, 419. [Google Scholar] [CrossRef]
  44. Romijnders, R.; Warmerdam, E.; Hansen, C.; Welzel, J.; Schmidt, G.; Maetzler, W. Validation of IMU-based gait event detection during curved walking and turning in older adults and Parkinson’s Disease patients. J. Neuroeng. Rehabil. 2021, 18, 28. [Google Scholar] [CrossRef] [PubMed]
  45. Mancini, M.; Chiari, L.; Holmstrom, L.; Salarian, A.; Horak, F.B. Validity and reliability of an IMU-based method to detect APAs prior to gait initiation. Gait Posture 2016, 43, 125–131. [Google Scholar] [CrossRef] [PubMed]
  46. Hansen, C.; Beckbauer, M.; Romijnders, R.; Warmerdam, E.; Welzel, J.; Geritz, J.; Emmert, K.; Maetzler, W. Reliability of IMU-derived static balance parameters in neurological diseases. Int. J. Environ. Res. Public Health 2021, 18, 3644. [Google Scholar] [CrossRef] [PubMed]
  47. Hsu, W.-C.; Sugiarto, T.; Lin, Y.-J.; Yang, F.-C.; Lin, Z.-Y.; Sun, C.-T.; Hsu, C.-L.; Chou, K.-N. Multiple-wearable-sensor-based gait classification and analysis in patients with neurological disorders. Sensors 2018, 18, 3397. [Google Scholar] [CrossRef]
  48. Baghdadi, A.; Cavuoto, L.A.; Crassidis, J.L. Hip and trunk kinematics estimation in gait through kalman filter using IMU data at the ankle. IEEE Sens. J. 2018, 18, 4253–4260. [Google Scholar] [CrossRef]
  49. Tripuraneni, K.R.; Foran, J.R.H.; Munson, N.R.; Racca, N.E.; Carothers, J.T. A smartwatch paired with a mobile application provides postoperative self-directed rehabilitation without compromising total knee arthroplasty outcomes: A randomized controlled trial. J. Arthroplast. 2021, 36, 3888–3893. [Google Scholar] [CrossRef]
  50. Heydari, F.; Ebrahim, M.P.; Redoute, J.-M.; Joe, K.; Walker, K.; Yuce, M.R. A chest-based continuous cuffless blood pressure method: Estimation and evaluation using multiple body sensors. Inf. Fusion 2020, 54, 119–127. [Google Scholar] [CrossRef]
  51. Galna, B.; Lord, S.; Rochester, L. Is gait variability reliable in older adults and Parkinson’s disease? Towards an optimal testing protocol. Gait Posture 2013, 37, 580–585. [Google Scholar] [CrossRef] [PubMed]
  52. Bohannon, R.W.; Williams Andrews, A. Normal walking speed: A descriptive meta-analysis. Physiotherapy 2011, 97, 182–189. [Google Scholar] [CrossRef] [PubMed]
  53. Ardestani, M.M.; Hornby, T.G. Effect of investigator observation on gait parameters in individuals with stroke. J. Biomech. 2020, 100, 109602. [Google Scholar] [CrossRef] [PubMed]
  54. Robles-García, V.; Corral-Bergantiños, Y.; Espinosa, N.; Jácome, M.A.; García-Sancho, C.; Cudeiro, J.; Arias, P. Spatiotemporal gait patterns during overt and covert evaluation in patients with Parkinson’s disease and healthy subjects: Is there a Hawthorne effect? J. Appl. Biomech. 2015, 31, 189–194. [Google Scholar] [CrossRef]
  55. Mbientlab. MetaMotionS. 2021. Available online: https://mbientlab.com/metamotions/?gclid=Cj0KCQiA47GNBhDrARIsAKfZ2rCXRMpZxFutmRVfwEbY0yH4sVZiro9DIW0J0Gn3i63A7uqQtxVnj_8aAuljEALw_wcB (accessed on 9 December 2021).
Figure 1. Typical and pathological morphology of the intraspinal lumbar canal and its surrounding structures. (a) Coronal view showing typical lumbar spine morphology with cauda equina. (b) Posterior view of two adjacent lumbar vertebrae showing typical bony morphology. (c) Coronal view of lumbar spinal stenosis. In this instance, a hypertrophied ligamentum flavum causes narrowing of the intraspinal lumbar canal and compresses neural tissue within the cauda equina. (d) Coronal view of lumbar disc herniation. Nuclear material herniates, typically posterolaterally, and compresses spinal nerves within the cauda equina. (e) Posterior view of two adjacent lumbar vertebrae affected by osteoarthritis. An osteophyte has formed at the zygapophyseal joint, one of the causes of facetogenic mechanical low back pain. Additionally, the intervertebral disc has lost height as in intervertebral disc degeneration, one of the causes of discogenic mechanical low back pain.
Std 13 00004 g001
Figure 2. The wearable MetaMotionC sensor used in the present study. The sensor is positioned on the skin overlying the sternal angle. The sensor measures approximately 2.6 cm × 2.6 cm × 0.5 cm and is shown next to a ruler (with numbers depicted in centimetres) for size comparison. The sensor weighs 5 g.
Std 13 00004 g002
Figure 3. Cohort flowchart of lumbar spine patients. ODI, Oswestry Disability Index; VAS, Visual Analogue Scale; MMC, MetaMotionC device; n, number of participants.
Std 13 00004 g003
Figure 4. Radar plot representing the change in gait metrics after surgery relative to healthy controls. The red line plots the gait metrics of lumbar spine patients preoperatively. The green line plots the gait metrics of lumbar spine patients postoperatively. The grey line plots the gait metrics of healthy controls. Percentage values represent the magnitude of the difference between the gait metrics of lumbar spine patients (preoperatively and postoperatively) and healthy controls. The deviation of the red and green lines is only shown for metrics that are statistically significantly different between lumbar spine patients and healthy controls. After surgery, all gait asymmetry and variability metrics reached normal values.
Std 13 00004 g004
Figure 5. Strength of correlation between change in gait metrics and change in Oswestry Disability Index. Blue bars represent statistically significant correlations and grey bars represent correlations that did not reach statistical significance. Changes in most spatiotemporal and asymmetry metrics correlated strongly and significantly with changes in the ODI. Changes in variability metrics correlated predominantly insignificantly with changes in the ODI.
Std 13 00004 g005
Table 1. Eligibility criteria for our cohort of lumbar spine patients.
Inclusion Criteria
Clinical diagnosis of either lumbar spinal stenosis, lumbar disc herniation, or mechanical low back pain
Be medically suitable for lumbar spine surgery
Have not improved with non-surgical treatment
Age greater than 18 years
Exclusion criteria
Inability to walk independently
Women who are pregnant
Concurrent serious spinal pathology such as cancer, cauda equina syndrome, spinal fracture, and inflammatory arthritis
Present with active Paget’s disease of the spine
Presence of significant lumbar scoliosis (Cobb angle ≥ 25°) or other spinal deformities
Meyerding classification grade 2 or greater spondylolisthesis
Symptomatic hip disease with symptoms reproduced with external or internal rotation of the hip joint
Cognitive impairment of inadequate English language skills that interfere with the patient’s ability to give fully informed consent or complete baseline or follow-up assessments
Table 2. Definition of each gait metric used in this study.
Base a MetricDefinition (Units)Type bDerivative Metrics cDefinition (Units)Type b
Gait velocityDistance travelled per second (m/s)Combined spatiotemporalGait velocity variability dStep-to-step variability in gait velocity (sm−1)Variability
Step timeTime between two consecutive contacts of any foot with the ground (s)TemporalStep time asymmetryAverage of difference in time between successive steps on the left and right foot (s)Asymmetry
Step time variability dStep-to-step variability in step time (s−1)Variability
Step lengthDistance between two consecutive contacts of any foot with the ground (m)SpatialStep length asymmetryAverage difference in length between successive steps on the left and right foot (m)Asymmetry
Step length variability dStep-to-step variability in step length (m−1)Variability
Stance timeFor each foot the time between the first point of contact with the ground to the last point of contact (s)TemporalStance time asymmetryAverage difference in stance time between successive steps on the left and right foot (s)Asymmetry
Stance time variability dStep-to-step variability in stance time (s−1)Variability
Swing timeFor each foot the time between the last point of contact with the ground to the first point of contact (s)TemporalSwing time asymmetryAverage difference in swing time between successive steps on the left and right foot (s)Asymmetry
Swing time variability dStep-to-step variability in swing time (s−1)Variability
Single support timeTime where only one foot is in contact with the ground (s)TemporalSingle support time asymmetryAverage difference in single support time between successive steps on the left and right foot (s)Asymmetry
Single support time variability dStep-to-step variability in single support time (s−1)Variability
Double support timeTime where both feet are in contact with the ground (s)TemporalDouble support time asymmetryAverage difference in double support time between successive steps (s)Asymmetry
Double support time variability dStep-to-step variability in double support time (s−1)Variability
a Base metrics are directly calculated by the MetaMotionC sensor. b Spatial metrics are related to distance; temporal metrics are related to time; gait velocity is the only combined spatiotemporal metric; asymmetry metrics are related to differences between the left and right feet; and variability metrics are related to differences between steps over the course of the walking bout. c Derivative metrics are mathematically derived from the base metrics and not directly measured by the MetaMotionC sensor. d All variability metrics are defined as the coefficient of variation (standard deviation divided by the mean) of the set of values taken from each step of the walking bout.
Table 3. Demographic features of the lumbar spine patient and healthy control cohorts, and pathological features of the lumbar spine patient cohort.
Demographic VariablesLumbar Spine Patients (n = 12)Healthy Controls (n = 24)
Continuous mean {[range, (SD)]}
Age (years)61.0 [41–86 (16.8)]60.7 [42–91 (13.6)]
BMI (kg/m2)27.9 [19.5–36.4 (5.45)]26.7 [21.1–39.9 (4.59)]
Height (m)1.70 [1.50–1.88 (0.115)]1.65 [1.50–1.79 (0.0892)]
Categorical [n, (percentage of total)]
Gender
Male5 (41.7)10 (41.7)
Female7 (58.3)14 (58.3)
Daily smoker0 (0)1 (4.17)
Diabetic0 (0)1 (4.17)
Fall in previous year2 (16.7)2 (8.33)
Pathology [n, (percentage of total)]
Lumbar spinal stenosis6 (50.0)-
Lumbar disc herniation4 (33.3)-
Discogenic and/or facetogenic mechanical Low back pain2 (16.7)-
BMI, body mass index; n, number of data entries. Every-day smoker was defined as a person who has smoked at least 100 cigarettes in their lifetime and who now smokes every day.
Table 4. Outcome measure in lumbar spine patients and healthy controls.
MetricPreoperativePostoperativeHealthy Controls
ODI42.4 (19.0)22.8 (18.3)-
VAS7.00 (5.50–8.00)1.50 (0–4.50)-
Spatiotemporal
Gait velocity (ms−1)1.03 (0.308)1.13 (0.358)1.29 (0.197)
Step time (ms)573 (537–616)573 (556–673)514 (38.9)
Step length (mm)591 (120)637 (153)656 (97.6)
Stance (ms)741 (124)736 (130)642 (49.8)
Swing (ms)464 (112)440 (78.7)389 (27.9)
Double support time (ms)284 (31.2)296 (52.8)257 (21.4)
Single support time (ms)446 (413–545)448 (82.6)390 (28.8)
Asymmetry
Step time (ms)43.2 (9.08–77.4)27.1 (19.8–73.5)37.1 (26.6–60.8)
Step length (mm)59.6 (43.9–114)49.2 (41.2–69.5)57.0 (44.6–75.2)
Stance time (ms)63.1 (22.7–89.5)25.0 (20.7–90.6)32.4 (25.3–49.5)
Swing (ms)61.7 (23.8–95.3)24.5 (19.1–90.4)29.6 (25.7–57.8)
Single support time (ms)65.6 (35.5–144)32.8 (22.4–90.2)34.9 (28.1–63.7)
Double support time (ms)15.0 (11.6–28.4)10.6 (7.26–22.7)12.9 (8.18–16.8)
Variability
Gait velocity (sm−1)10.8 (2.38)8.53 (1.97)10.2 (3.49)
Step time (s−1)13.2 (9.69–17.5)6.03 (3.73–8.88)11.8 (6.00)
Step length (m−1)12.5 (8.13–20.5)8.31 (7.92–13. 9)9.40 (7.61–11.2)
Stance time (s−1)9.49 (6.30–12.1)6.72 (5.30–9.31)8.67 (4.17)
Swing time (s−1)20.0 (11.6)8.26 (6.14–14.7)13.4 (7.05–21.4)
Single support time
(s−1)
44.2 (24.1)16.8 (12.1–36.0)22.6 (10.4–35.1)
Double support time
(s−1)
17.9 (7.67–28.1)6.12 (4.63–19.0)10.2 (5.71–16.6)
ODI, Oswestry Disability Index; VAS, Visual Analogue Scale. Normally distributed variables are given as the mean (standard deviation) and otherwise as the median (interquartile range).
Table 5. Percentage differences in outcome measures between groups.
Within PatientsPatients–Controls
MetricPostoperative–PreoperativePreoperativePostoperative
ODI−46.2 (0.01)--
VAS−78.6 (0.001)--
Spatiotemporal
Gait velocity9.71 (0.195)−20.2 (0.008)−12.4 (0.095)
Step time−0.000103 (0.468)10.3 (0.006)11.5 (0.001)
Step length7.78 (0.123)−9.91 (0.121)−2.90 (0.643)
Stance time−0.67 (0.828)15.4 (0.003)14.6 (0.005)
Swing time5.17 (0.193)19.3 (0.002)13.1 (0.026)
Single support time0.448 (0.065)14.4 (0.001)14.9 (0.044)
Double support time4.23 (0.255)10.5 (0.027)15.2 (0.002)
Asymmetry
Step time−37.3 (0.066)16.4 (0.063)−27.0 (0.983)
Step length−17.4 (0.016)4.56 (0.097)−13.7 (0.904)
Stance time−60.4 (0.053)94.8 (0.037)−22.8 (0.594)
Swing time−60.3 (0.039)108 (0.036)−17.2 (0.699)
Single limb support−50.0 (0.012)88.0 (0.009)−6.02 (0.650)
Double limb support−29.3 (0.027)16.3 (0.017)−17.8 (0.845)
Variability
Gait velocity−21.0 (0.011)5.88 (0.564)−16.4 (0.134)
Step time−54.3 (0.001)11.9 (0.110)−48.9 (0.094)
Step length−33.5 (0.011)33.0 (0.019)−11.6 (0.929)
Stance−29.2 (0.023)9.46 (0.171)−22.5 (0.550)
Swing−58.7 (0.004)49.3 (0.182)−38.4 (0.265)
Single limb support−62.0 (0.001)95.6 (0.009)−25.7 (0.751)
Double limb support−65.8 (0.014)75.5 (0.048)−40.0 (0.675)
ODI, Oswestry Disability Index. VAS, Visual Analogue Scale. Values are reported as percentage differences with p-values from linear mixed model analysis in brackets. Bolded p-values indicate statistically significant results. Metric units are not provided because values are percentages.
Table 6. Correlation between changes in each gait metric and the ODI after surgery.
Gait MetricCorrelation Coefficientp-Value
Spatiotemporal
Gait velocity−0.914<0.001
Step time0.5570.060
Step length−0.862<0.001
Stance0.902<0.001
Swing0.8350.001
Single limb support0.869<0.001
Double support *0.4450.147
Asymmetry
Step time *0.5810.047
Step length *0.4340.158
Stance *0.6660.018
Swing *0.6230.030
Single limb support *0.6060.037
Double limb support *0.4380.155
Variability
Gait velocity *0.4590.134
Step time *0.4520.140
Step length variability0.5960.041
Stance *0.4340.158
Swing *0.4340.158
Single limb support *0.1750.586
Double limb support *0.2310.470
Changes in metrics with an asterisk (*) formed a non-normal distribution, and, hence, a correlation analysis was performed using Spearman’s rank correlation coefficient. Otherwise, Pearson’s correlation coefficient was used. Bold indicates significant findings.
Disclaimer/Publisher’s Note: The statements, opinions and data contained in all publications are solely those of the individual author(s) and contributor(s) and not of MDPI and/or the editor(s). MDPI and/or the editor(s) disclaim responsibility for any injury to people or property resulting from any ideas, methods, instructions or products referred to in the content.

