
A Current Approach to Non-Alcoholic Steatohepatitis in Type 2 Diabetes Mellitus Patients
 , and
, and
Abstract
:1. Introduction
2. Materials and Methods
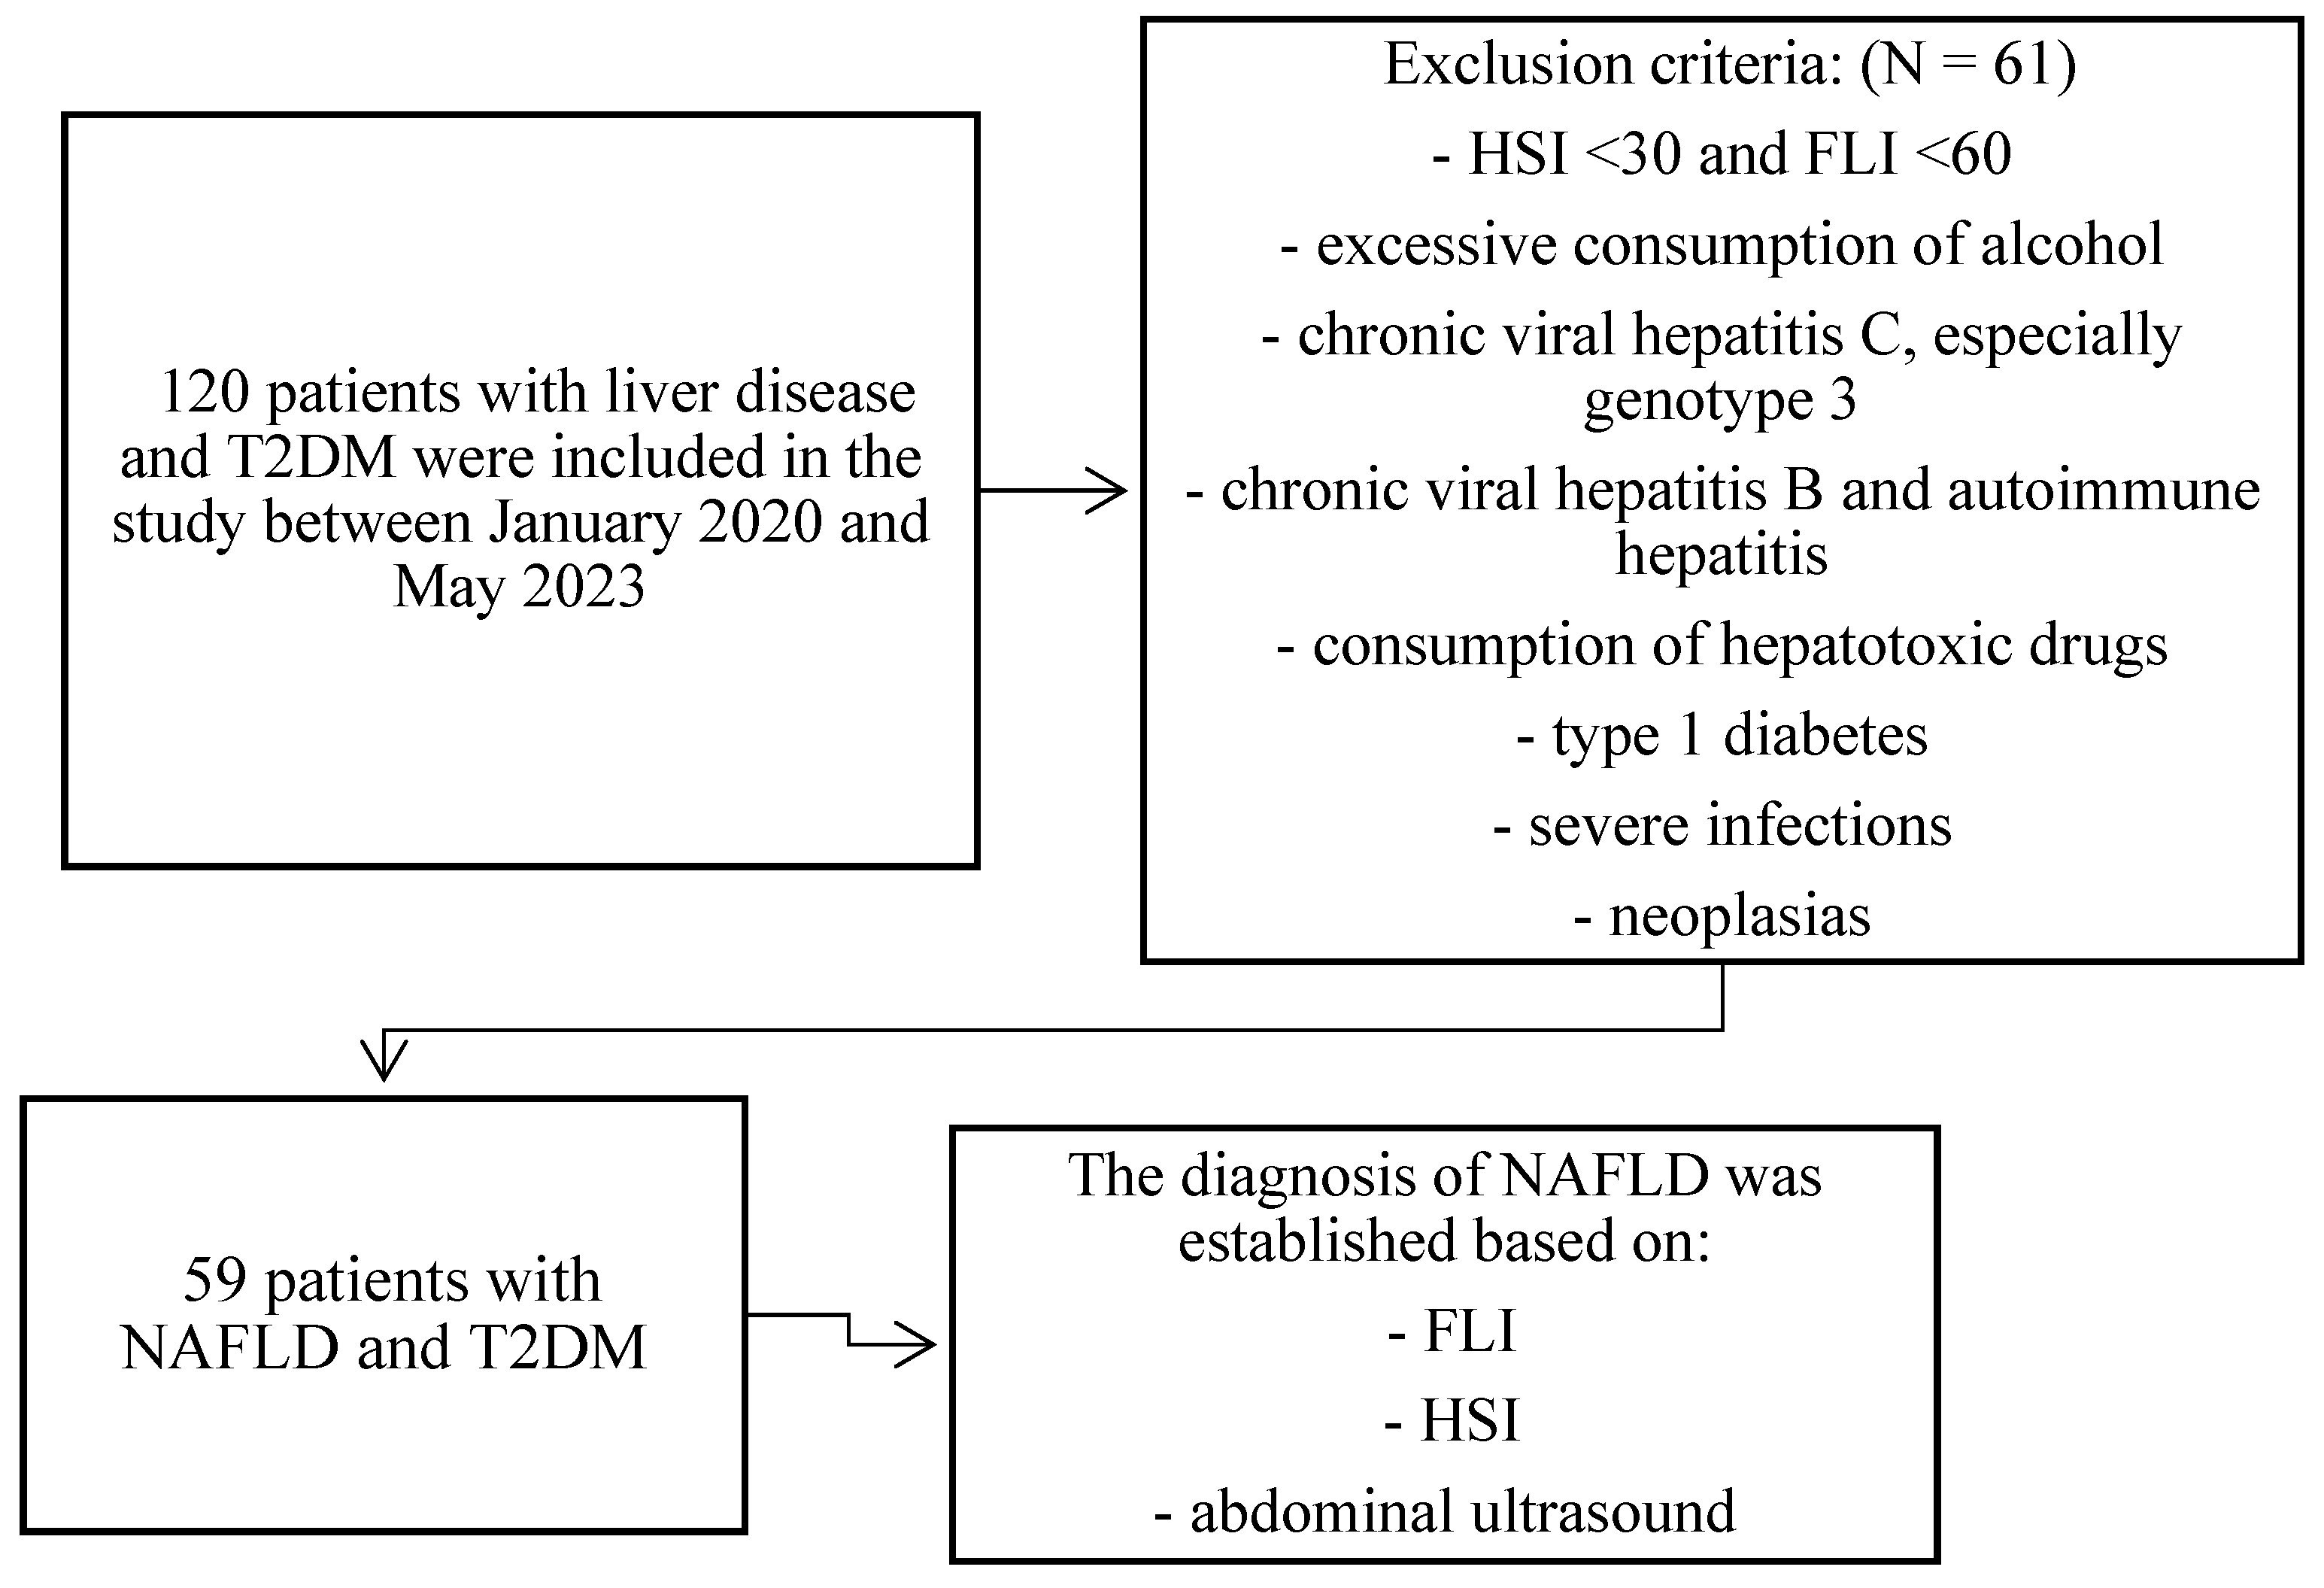
2.1. Selection of Patients
2.2. Characterization of the Studied Variables
2.2.1. Clinical Parameters
2.2.2. Laboratory Parameters
2.3. Statistical Analysis
2.4. Ethical Considerations
3. Results
3.1. Descriptive Analysis of Anthropometric, Clinical, and Ultrasonographic Parameters
3.2. Descriptive Analysis of the Biochemical Parameters
3.3. Descriptive Analysis of the Hematological Parameters
3.4. Descriptive Analysis of the Inflammatory Parameters
4. Discussion
5. Limitations
6. Conclusions
Author Contributions
Funding
Institutional Review Board Statement
Informed Consent Statement
Data Availability Statement
Acknowledgments
Conflicts of Interest
References
- Kosmalski, M.; Ziółkowska, S.; Czarny, P.; Szemraj, J.; Pietras, T. The Coexistence of Nonalcoholic Fatty Liver Disease and Type 2 Diabetes Mellitus. J. Clin. Med. 2022, 11, 1375. [Google Scholar] [CrossRef]
- Spiers, J.; Brindley, J.H.; Li, W.; Alazawi, Q. What’s new in non-alcoholic fatty liver disease? Frontline Gastroenterol. 2022, 13, e102–e108. [Google Scholar] [CrossRef]
- Estes, C.; Anstee, Q.M.; Arias-Loste, M.T.; Bantel, H.; Bellentani, S.; Caballeria, J.; Colombo, M.; Craxi, A.; Crespo, J.; Day, C.P.; et al. Modeling NAFLD disease burden in China, France, Germany, Italy, Japan, Spain, the United Kingdom, and the United States for the period 2016–2030. J. Hepatol. 2018, 69, 896–904. [Google Scholar] [CrossRef]
- Chalasani, N.; Younossi, Z.; Lavine, J.E.; Charlton, M.; Cusi, K.; Rinella, M.; Harrison, S.A.; Brunt, E.M.; Sanyal, A.J. The diagnosis and management of nonalcoholic fatty liver disease: Practice guidance from the American Association for the Study of Liver Diseases. Hepatology 2017, 67, 328–357. [Google Scholar] [CrossRef]
- Loomba, R.; Wong, R.; Fraysse, J.; Shreay, S.; Li, S.; Harrison, S.; Gordon, S.C. Nonalcoholic fatty liver disease progression rates to cirrhosis and progression of cirrhosis to decompensation and mortality: A real-world analysis of Medicare data. Aliment. Pharmacol. Ther. 2020, 51, 1149–1159. [Google Scholar] [CrossRef]
- Long, M.T.; Zhang, X.; Xu, H.; Liu, C.; Corey, K.E.; Chung, R.T.; Loomba, R.; Benjamin, E.J. Hepatic Fibrosis Associates With Multiple Cardiometabolic Disease Risk Factors: The Framingham Heart Study. Hepatology 2021, 73, 548–559. [Google Scholar] [CrossRef] [PubMed]
- Watt, G.P.; De La Cerda, I.; Pan, J.; Fallon, M.B.; Beretta, L.; Loomba, R.; Lee, M.; McCormick, J.B.; Fisher-Hoch, S.P. Elevated Glycated Hemoglobin Is Associated With Liver Fibrosis, as Assessed by Elastography, in a Population-Based Study of Mexican Americans. Hepatol. Commun. 2020, 4, 1793–1801. [Google Scholar] [CrossRef]
- Caussy, C.; Aubin, A.; Loomba, R. The Relationship Between Type 2 Diabetes, NAFLD, and Cardiovascular Risk. Curr. Diabetes Rep. 2021, 21, 15. [Google Scholar] [CrossRef] [PubMed]
- Zarghamravanbakhsh, P.; Frenkel, M.; Poretsky, L. Metabolic causes and consequences of nonalcoholic fatty liver disease (NAFLD). Metab. Open 2021, 12, 100149. [Google Scholar] [CrossRef] [PubMed]
- Caussy, C.; Soni, M.; Cui, J.; Bettencourt, R.; Schork, N.; Chen, C.-H.; Al Ikhwan, M.; Bassirian, S.; Cepin, S.; Gonzalez, M.P.; et al. Nonalcoholic fatty liver disease with cirrhosis increases the familial risk for advanced fibrosis. J. Clin. Investig. 2017, 127, 2697–2704. [Google Scholar] [CrossRef]
- Papatheodoridi, M.; Cholongitas, E. Diagnosis of Non-alcoholic Fatty Liver Disease (NAFLD): Current Concepts. Curr. Pharm. Des. 2019, 24, 4574–4586. [Google Scholar] [CrossRef] [PubMed]
- Manousou, P.; Kalambokis, G.; Grillo, F.; Watkins, J.; Xirouchakis, E.; Pleguezuelo, M.; Leandro, G.; Arvaniti, V.; Germani, G.; Patch, D.; et al. Serum ferritin is a discriminant marker for both fibrosis and inflammation in histologically proven non-alcoholic fatty liver disease patients. Liver Int. 2011, 31, 730–739. [Google Scholar] [CrossRef]
- Bedogni, G.; Miglioli, L.; Masutti, F.; Castiglione, A.; Crocè, L.S.; Tiribelli, C.; Bellentani, S. Incidence and natural course of fatty liver in the general population: The Dionysos study. Hepatology 2007, 46, 1387–1391. [Google Scholar] [CrossRef] [PubMed]
- Wieckowska, A.; McCullough, A.J.; Feldstein, A.E. Noninvasive diagnosis and monitoring of nonalcoholic steatohepatitis: Present and future. Hepatology 2007, 46, 582–589. [Google Scholar] [CrossRef] [PubMed]
- Eslam, M.; George, J. Reply to: Correspondence regarding “A new definition for metabolic dysfunction-associated fatty liver disease: An international expert consensus statement”. J. Hepatol. 2020, 73, 1575. [Google Scholar] [CrossRef] [PubMed]
- Kanwal, F.; Shubrook, J.H.; Adams, L.A.; Pfotenhauer, K.; Wai-Sun Wong, V.; Wright, E.; Abdelmalek, M.F.; Harrison, S.A.; Loomba, R.; Mantzoros, C.S.; et al. Clinical Care Pathway for the Risk Stratification and Management of Patients With Nonalcoholic Fatty Liver Disease. Gastroenterology 2021, 161, 1657–1669. [Google Scholar] [CrossRef]
- Martinou, E.; Pericleous, M.; Stefanova, I.; Kaur, V.; Angelidi, A.M. Diagnostic Modalities of Non-Alcoholic Fatty Liver Disease: From Biochemical Biomarkers to Multi-Omics Non-Invasive Approaches. Diagnostics 2022, 12, 407. [Google Scholar] [CrossRef]
- Schuster, S.; Cabrera, D.; Arrese, M.; Feldstein, A.E. Triggering and resolution of inflammation in NASH. Nat. Rev. Gastroenterol. Hepatol. 2018, 15, 349–364. [Google Scholar] [CrossRef]
- Milovanovic Alempijevic, T.; Stojkovic Lalosevic, M.; Dumic, I.; Jocic, N.; Pavlovic Markovic, A.; Dragasevic, S.; Jovicic, I.; Lukic, S.; Popovic, D.; Milosavljevic, T. Diagnostic Accuracy of Platelet Count and Platelet Indices in Noninvasive Assessment of Fibrosis in Nonalcoholic Fatty Liver Disease Patients. Can. J. Gastroenterol. Hepatol. 2017, 2017, 6070135. [Google Scholar] [CrossRef]
- Liu, C.F.; Chien, L.W. Predictive Role of Neutrophil-Percentage-to-Albumin Ratio (NPAR) in Nonalcoholic Fatty Liver Disease and Advanced Liver Fibrosis in Nondiabetic US Adults: Evidence from NHANES 2017–2018. Nutrients 2023, 15, 1892. [Google Scholar] [CrossRef]
- Zhu, C.; Huang, D.; Ma, H.; Qian, C.; You, H.; Bu, L.; Qu, S. High-Sensitive CRP Correlates With the Severity of Liver Steatosis and Fibrosis in Obese Patients With Metabolic Dysfunction Associated Fatty Liver Disease. Front. Endocrinol. 2022, 13, 848937. [Google Scholar] [CrossRef] [PubMed]
- Sung, K.-T.; Kuo, R.; Sun, J.-Y.; Hung, T.-C.; Chang, S.-C.; Liu, C.-C.; Yun, C.-H.; Wu, T.-H.; Hung, C.-L.; Yeh, H.-I.; et al. Associations between CT-determined visceral fat burden, hepatic steatosis, circulating white blood cell counts and neutrophil-to-lymphocyte ratio. PLoS ONE 2018, 13, e0207284. [Google Scholar] [CrossRef]
- Zhao, Y.; Xia, J.; He, H.; Liang, S.; Zhang, H.; Gan, W. Diagnostic performance of novel inflammatory biomarkers based on ratios of laboratory indicators for nonalcoholic fatty liver disease. Front. Endocrinol. 2022, 13, 981196. [Google Scholar] [CrossRef]
- Moris, W.; Verhaegh, P.; Jonkers, D.; Deursen, C.V.; Koek, G. Hyperferritinemia in nonalcoholic fatty liver disease: Iron accumulation or inflammation? Semin. Liver Dis. 2019, 39, 476–482. [Google Scholar] [CrossRef]
- Wong, V.W.S.; Adams, L.A.; de Lédinghen, V.; Wong, G.L.H.; Sookoian, S. Noninvasive biomarkers in NAFLD and NASH—Current progress and future promise. Nat. Rev. Gastroenterol. Hepatol. 2018, 15, 461–478. [Google Scholar] [CrossRef] [PubMed]
- Wang, H.; Sun, R.; Yang, S.; Ma, X.; Yu, C. Association between serum ferritin level and the various stages of non-alcoholic fatty liver disease: A systematic review. Front. Med. 2022, 9, 934989. [Google Scholar] [CrossRef]
- Yan, J.X.; Pan, B.J.; Zhao, P.P.; Wang, L.T.; Liu, J.F.; Fu, S.B. Serum ferritin is correlated with non-alcoholic fatty liver disease in middle-aged and older patients with type 2 diabetes. Endocr. Connect. 2021, 10, 1560–1569. [Google Scholar] [CrossRef] [PubMed]
- Zhang, J.Z.; Cai, J.J.; Yu, Y.; She, Z.G.; Li, H. Nonalcoholic Fatty Liver Disease: An Update on the Diagnosis. Gene Expr. 2019, 19, 187–198. [Google Scholar] [CrossRef]
- European Association for the Study of the Liver. EASL Clinical Practice Guidelines on non-invasive tests for evaluation of liver disease severity and prognosis—2021 update. J. Hepatol. 2021, 75, 659–689. [Google Scholar] [CrossRef]
- Zhou, J.H.; Cai, J.J.; She, Z.G.; Li, H.L. Noninvasive evaluation of nonalcoholic fatty liver disease: Current evidence and practice. World J. Gastroenterol. 2019, 25, 1307–1326. [Google Scholar] [CrossRef]
- Fatty Liver Index (FLI) MD App. Available online: https://www.mdcalc.com/calc/10001/fatty-liver-index#next-steps (accessed on 22 June 2023).
- Bedogni, G.; Bellentani, S.; Miglioli, L.; Masutti, F.; Passalacqua, M.; Castiglione, A.; Tiribelli, C. The Fatty Liver Index: A simple and accurate predictor of hepatic steatosis in the general population. BMC Gastroenterol. 2006, 6, 33. [Google Scholar] [CrossRef]
- Hepatic Steatosis Index (HSI) MD App. Available online: https://www.mdapp.co/hepatic-steatosis-index-hsi-calculator-357 (accessed on 23 June 2023).
- Lee, J.H.; Kim, D.; Kim, H.J.; Lee, C.H.; Yang, J.I.; Kim, W.; Kim, Y.J.; Yoon, J.H.; Cho, S.H.; Sung, M.W.; et al. Hepatic steatosis index: A simple screening tool reflecting nonalcoholic fatty liver disease. Dig. Liver Dis. 2010, 42, 503–508. [Google Scholar] [CrossRef]
- Dai, C.Y.; Fang, T.J.; Hung, W.W.; Tsai, H.J.; Tsai, Y.C. The Determinants of Liver Fibrosis in Patients with Nonalcoholic Fatty Liver Disease and Type 2 Diabetes Mellitus. Biomedicines 2022, 10, 1487. [Google Scholar] [CrossRef] [PubMed]
- Lomonaco, R.; Bril, F.; Portillo-Sanchez, P.; Ortiz-Lopez, C.; Orsak, B.; Biernacki, D.; Lo, M.; Suman, A.; Weber, M.; Cusi, K. Metabolic Impact of Nonalcoholic Steatohepatitis in Obese Patients With Type 2 Diabetes. Diabetes Care 2016, 39, 632–638. [Google Scholar] [CrossRef]
- Yu, Y.; Yu, Y.; Wang, Y.; Chen, Y.; Wang, N.; Wang, B.; Lu, Y. Nonalcoholic fatty liver disease and type 2 diabetes: An observational and Mendelian randomization study. Front. Endocrinol. 2023, 14, 1156381. [Google Scholar] [CrossRef] [PubMed]
- Bazick, J.; Donithan, M.; Neuschwander-Tetri, B.A.; Kleiner, D.; Brunt, E.M.; Wilson, L.; Doo, E.; Lavine, J.; Tonascia, J.; Loomba, R. Clinical Model for NASH and Advanced Fibrosis in Adult Patients With Diabetes and NAFLD: Guidelines for Referral in NAFLD. Diabetes Care 2015, 38, 1347–1355. [Google Scholar] [CrossRef] [PubMed]
- Chen, K.; Sng, W.K.; Quah, J.H.-M.; Liu, J.; Chong, B.Y.; Lee, H.K.; Wang, X.F.; Tan, N.C.; Chang, P.-E.; Tan, H.C.; et al. Clinical spectrum of non-alcoholic fatty liver disease in patients with diabetes mellitus. PLoS ONE 2020, 15, e0236977. [Google Scholar] [CrossRef]
- Julián, M.T.; Pera, G.; Soldevila, B.; Caballería, L.; Julve, J.; Puig-Jové, C.; Morillas, R.; Torán, P.; Expósito, C.; Puig-Domingo, M.; et al. Atherogenic dyslipidemia, but not hyperglycemia, is an independent factor associated with liver fibrosis in subjects with type 2 diabetes and NAFLD: A population-based study. Eur. J. Endocrinol. 2021, 184, 587–596. [Google Scholar] [CrossRef]
- Martin, A.; Lang, S.; Goeser, T.; Demir, M.; Steffen, H.M.; Kasper, F. Management of Dyslipidemia in Patients with Non-Alcoholic Fatty Liver Disease. Curr. Atheroscler. Rep. 2022, 24, 533–546. [Google Scholar] [CrossRef]
- Prashanth, M.; Ganesh, H.K.; Vima, M.V.; John, M.; Bandgar, T.; Joshi, S.R.; Shah, S.R.; Rathi, P.M.; Joshi, A.S.; Thakkar, H.; et al. Prevalence of Nonalcoholic fatty Liver Disease in Patients with Type 2 Diabetes Mellitus. JAPI 2009, 57, 205–210. [Google Scholar]
- Friedman, A.N.; Fadem, S.Z. Reassessment of albumin as a nutritional marker in kidney disease. J. Am. Soc. Nephrol. 2010, 21, 223–230. [Google Scholar] [CrossRef]
- Mofrad, P.; Contos, M.J.; Haque, M.; Sargeant, C.; Fisher, R.A.; Luketic, V.A.; Sterling, R.K.; Shiffman, M.L.; Stravitz, R.T.; Sanyal, A.J. Clinical and histologic spectrum of nonalcoholic fatty liver disease associated with normal ALT values. Hepatolog 2003, 37, 1286–1292. [Google Scholar] [CrossRef]
- Mandal, A.; Bhattarai, B.; Kafle, P.; Khalid, M.; Jonnadula, S.K.; Lamicchane, J.; Kanth, R.; Gayam, V. Elevated Liver Enzymes in Patients with Type 2 Diabetes Mellitus and Non-alcoholic Fatty Liver Disease. Cureus 2018, 10, e3626. [Google Scholar] [CrossRef]
- Harris, H.E. Elevated Liver Function Tests in Type 2 Diabetes. Clin. Diabetes 2005, 23, 115–119. [Google Scholar] [CrossRef]
- Shrestha, N.; Bhatt, N.P.; Neopane, P.; Dahal, S.; Regmi, P.; Khanal, M.; Shrestha, R. Hepatic involvement with elevated liver enzymes in Nepalese subjects with type 2 diabetes mellitus. Int. J. Biochem. Res. Rev. 2017, 16, 1–8. [Google Scholar] [CrossRef]
- Dominici, S.; Paolicchi, A.; Corti, A.; Maellaro, E.; Pompella, A. Prooxidant reactions promoted by soluble and cell-bound g-glutamyltransferase activity. Methods Enzym. 2005, 401, 484–501. [Google Scholar] [CrossRef]
- Kunutsor, S.K. Gamma-glutamyltransferase-friend or foe within? Liver Int. 2016, 36, 1723–1734. [Google Scholar] [CrossRef]
- Chen, L.W.; Huang, M.S.; Shyu, Y.C.; Chien, R.N. Gamma-glutamyl transpeptidase elevation is associated with metabolic syndrome, hepatic steatosis, and fibrosis in patients with nonalcoholic fatty liver disease: A community-based cross-sectional study. Kaohsiung J. Med. Sci. 2021, 37, 819–827. [Google Scholar] [CrossRef]
- Jung, C.H.; Lee, B.; Choi, D.H.; Jung, S.H.; Kim, B.Y.; Kim, C.H.; Kang, S.K.; Mok, J.O. Association of grade of non-alcoholic fatty liver disease and glycated albumin to glycated hemoglobin ratio in patients with type 2 diabetes mellitus. Diabetes Res. Clin. Pract. 2017, 125, 53–61. [Google Scholar] [CrossRef]
- Kahraman, N.K.; Kahraman, C.; Kocak, F.E.; Cosgun, S.; Sanal, B.; Korkmaz, M.; Bayham, Z.; Zeren, S. Predictive value of neutrophiltolymphocyte ratio in the severity of non-alcoholic fatty liver disease among type 2 diabetes patients. Acta Gastroenterol. Belg. 2016, 79, 295–300. [Google Scholar]
- Kapici, O.B.; Abus, S.; Ayhan, S.; Karaagac, M.; Sirik, M. Investigation of hemogram and biochemistry parameters in non-alcoholic fatty liver disease. Med. Sci. Int. Med. J. 2023, 12, 63. [Google Scholar] [CrossRef]
- Luo, Y.; Wang, C.; Zhang, T.; He, X.; Hao, J.; Shen, A.; Zhao, H.; Chen, S.; Ren, L. Factors Associated with Liver Fibrosis in Chinese Patients with Type 2 Diabetes Mellitus and Non-Alcoholic Fatty Liver Disease. Int. J. Gen. Med. 2023, 16, 293–302. [Google Scholar] [CrossRef]
- Tingle, S.J.; Ma, G.R.S.; Goodfellow, M.; Moir, J.A.; White, S.A. NARCA: A novel prognostic scoring system using neutrophil albumin ratio and Ca19-9 to predict overall survival in palliative pancreatic cancer. J. Surg. Oncol. 2018, 118, 680–686. [Google Scholar] [CrossRef]
- Wang, B.; Li, D.; Cheng, B.; Ying, B.; Gong, Y. The Neutrophil Percentage-to-Albumin Ratio Is Associated with All-Cause Mortality in Critically Ill Patients with Acute Kidney Injury. Biomed. Res. Int. 2020, 18, 2020–5687672. [Google Scholar] [CrossRef]
- Gong, Y.; Li, D.; Cheng, B.; Ying, B.; Wang, B. Increased neutrophil percentage-to-albumin ratio is associated with all-cause mortality in patients with severe sepsis or septic shock. Epidemiol. Infect. 2020, 148, e87. [Google Scholar] [CrossRef]
- Marjot, T.; Moolla, A.; Cobbold, J.F.; Hodson, L.; Tomlinson, J.W. Nonalcoholic Fatty Liver Disease in Adults: Current Concepts in Etiology, Outcomes, and Management. Endocr. Rev. 2020, 41, 66–117. [Google Scholar] [CrossRef]
- Loosen, S.H.; Demir, M.; Kunstein, A.; Jördens, M.; Qvarskhava, N.; Luedde, M.; Luedde, T.; Roderburg, C.; Kostev, K. Variables associated with increased incidence of non-alcoholic fatty liver disease (NAFLD) in patients with type 2 diabetes. BMJ Open Diabetes Res. Care 2021, 9, e002243. [Google Scholar] [CrossRef]
- Okdahl, T.; Wegeberg, A.M.; Pociot, F.; Brock, B.; Størling, J.; Brock, C. Low-grade inflammation in type 2 diabetes: A crosssectional study from a Danish diabetes outpatient clinic. BMJ Open 2022, 12, e062188. [Google Scholar] [CrossRef]
- Cucoranu, D.C.; Pop, M.; Niculescu, R.; Kosovski, I.B.; Toganel, R.O.; Licu, R.A.; Bacârea, A. The Association of Nonalcoholic Fatty Liver Disease With Neutrophil-to-Lymphocyte Ratio and Neutrophil-Percentage-to-Albumin Ratio. Cureus 2023, 15, e41197. [Google Scholar] [CrossRef]
- You, G.; Ding, J.; Shen, J.; Wang, Y.; Sun, Y. Association between serum ferritin and non-alcoholic fatty liver disease among middle-aged and elderly Chinese with normal weight. Asia Pac. J. Clin. Nutr. 2019, 28, 747–753. [Google Scholar]
- Kunutsor, S.K.; Apekey, T.A.; Walley, J.; Kain, K. Ferritin levels and risk of type 2 diabetes mellitus: An updated systematic review and meta-analysis of prospective evidence. Diabetes/Metab. Res. Rev. 2013, 29, 308–318. [Google Scholar] [CrossRef] [PubMed]
- Amin, R.F.; El Bendary, A.S.; Ezzat, S.E.; Mohamed, W.S. Serum ferritin level, microalbuminuria and non-alcoholic fatty liver disease in type 2diabetic patients. Diabetes Metab. Syndr. 2019, 13, 2226–2229. [Google Scholar] [CrossRef]
- Lombardi, R.; Pisano, G.; Fargion, S. Role of serum uric acid and ferritin in the development and progression of NAFLD. Int. J. Mol. Sci. 2016, 17, 548. [Google Scholar] [CrossRef]
- Sachinidis, A.; Doumas, M.; Imprialos, K.; Stavropoulos, K.; Katsimardou, A.; Athyros, V.G. Dysmetabolic iron overload in metabolic syndrome. Curr. Pharm. Des. 2020, 26, 1019–1024. [Google Scholar] [CrossRef]
- Lee, H.J.; Choi, J.S.; Lee, H.J.; Kim, W.H.; Park, S.I.; Song, J. Effect of excess iron on oxidative stress and gluconeogenesis through hepcidin during mitochondrial dysfunction. J. Nutr. Biochem. 2015, 26, 1414–1423. [Google Scholar] [CrossRef] [PubMed]
- Park, S.H.; Kim, B.I.; Yun, J.W.; Kim, J.W.; Park, D.I.; Cho, Y.K.; Sung, I.K.; Park, C.Y.; Sohn, C.I.; Jeon, W.K.; et al. Insulin resistance and C-reactive protein as independent risk factors for non-alcoholic fatty liver disease in non-obese Asian men. J. Gastroenterol. Hepatol. 2004, 19, 694–698. [Google Scholar] [CrossRef] [PubMed]
- Wong, V.W.; Hui, A.Y.; Tsang, S.W.; Chan, J.L.; Tse, A.M.; Chan, K.F.; So, W.Y.; Cheng, A.Y.; Ng, W.F.; Wong, G.L.; et al. Metabolic and adipokine profile of Chinese patients with nonalcoholic fatty liver disease. Clin. Gastroenterol. Hepatol. 2006, 4, 1154–1161. [Google Scholar] [CrossRef]
- Mayneris-Perxachs, J.; Cardellini, M.; Hoyles, L.; Latorre, J.; Davato, F.; Moreno-Navarrete, J.M.; Arnoriaga-Rodríguez, M.; Serino, M.; Abbott, J.; Barton, R.H.; et al. Iron status influences non-alcoholic fatty liver disease in obesity through the gut microbiome. Microbiome 2021, 9, 104. [Google Scholar] [CrossRef]
- Ryan, J.D.; Armitage, A.E.; Cobbold, J.F.; Banerjee, R.; Borsani, O.; Dongiovanni, P.; Neubauer, S.; Morovat, R.; Wang, L.M.; Pasricha, S.; et al. Hepatic iron is the major determinant of serum ferritin in NAFLD patients. Liver Int. 2018, 38, 164–173. [Google Scholar] [CrossRef] [PubMed]
- Mitrovic, B.; Samardzic, V.; Gluvic, Z.; Tomasevic, R.; Obradovic, M.; Sudar-Milovanovic, E.; Isenovic, E.R. Serum ferritin levels correlate with ultrasonography-determined liver steatosis severity in type 2 diabetes patients with NAFLD. Endocr. Abstr. 2021, 73, AEP294. [Google Scholar] [CrossRef]
- Haukeland, J.W.; Damås, J.K.; Konopski, Z.; Løberg, E.M.; Haaland, T.; Goverud, I.; Torjesen, P.A.; Birkeland, K.; Bjøro, K.; Aukrust, P. Systemic inflammation in nonalcoholic fatty liver disease is characterized by elevated levels of CCL2. J. Hepatol. 2006, 44, 1167–1174. [Google Scholar] [CrossRef] [PubMed]
- Yoneda, M.; Mawatari, H.; Fujita, K.; Iida, H.; Yonemitsu, K.; Kato, S.; Takahashi, H.; Kirikoshi, H.; Inamori, M.; Nozaki, Y.; et al. High-sensitivity C-reactive protein is an independent clinical feature of nonalcoholic steatohepatitis (NASH) and also of the severity of fibrosis in NASH. J. Gastroenterol. 2007, 42, 573–582. [Google Scholar] [CrossRef]
- Riquelme, A.; Arrese, M.; Soza, A.; Morales, A.; Baudrand, R.; Pérez-Ayuso, R.M.; González, R.; Alvarez, M.; Hernández, V.; García-Zattera, M.J.; et al. Non-alcoholic fatty liver disease and its association with obesity, insulin resistance and increased serum levels of C-reactive protein in Hispanics. Liver Int. 2009, 29, 82–88. [Google Scholar] [CrossRef]
- Kao, P.C.; Shiesh, S.C.; Wu, T.J. Serum C-reactive protein as a marker for wellness assessment. Ann. Clin. Lab. Sci. 2006, 36, 163–169. [Google Scholar]
- Oruc, N.; Ozutemiz, O.; Yuce, G.; Akarca, U.S.; Ersoz, G.; Gunsar, F.; Batur, Y. Serum procalcitonin and CRP levels in non-alcoholic fatty liver disease: A case control study. BMC Gastroenterol. 2009, 9, 16. [Google Scholar] [CrossRef] [PubMed]
- Ndumele, C.E.; Nasir, K.; Conceiçao, R.D.; Carvalho, J.A.; Blumenthal, R.S.; Santos, R.D. Hepatic steatosis, obesity, and the metabolic syndrome are independently and additively associated with increased systemic inflammation. Arterioscler. Thromb. Vasc. Biol. 2011, 31, 1927–1932. [Google Scholar] [CrossRef]
- Viallon, A.; Zeni, F.; Pouzet, V.; Lambert, C.; Quenet, S.; Aubert, G.; Guyomarch, S.; Tardy, B.; Bertrand, J.C. Serum and ascitic procalcitonin levels in cirrhotic patients with spontaneous bacterial peritonitis: Diagnostic value and relationship to pro-inflammatory cytokines. Intensive Care Med. 2000, 26, 1082–1088. [Google Scholar] [CrossRef] [PubMed]
- Dandona, P.; Nix, D.; Wilson, M.F.; Aljada, A.; Love, J.; Assicot, M.; Bohuon, C. Procalcitonin increase after endotoxin injection in normal subjects. J. Clin. Endocrinol. Metab. 1994, 79, 1605–1608. [Google Scholar]


| Parameter | Incidence and Mean Value in Patients with NAFLD and T2DM (59 pts.) | Incidence and Mean Value in Patients with HS and T2DM (44 pts.) | Incidence and mean Value in Patients with NASH and T2DM (15 pts.) | * Statistical Significance p-Value |
|---|---|---|---|---|
| Women (number) | 25/59 (42.37%) | 21/44 (47.27%) | 4/15 (26.66%) | 0.07 |
| Men (number) | 34/59 (57.62%) | 23/44 (52.27%) | 11/15 (73.33%) | 0.15 |
| Age (years) | 61.52 ± 10.07 | 62.20 ± 0.70 | 59.53 ± 10.06 | 0.38 |
| The urban environment of origin (number) | 36/59 (61.01%) | 25/44 (56.81%) | 11/15 (73.33%) | 0.26 |
| The rural environment of origin (number) | 23/59 (38.89%) | 19/44 (43.18%) | 4/15 (26.66%) | 0.29 |
| T2DM | 59/59 (100%) | 44/44 (100%) | 15/15 (100%) | - |
| Hypertension | 53/59 (89.83%) | 39/44 (88.63%) | 14/15 (93.33%) | 0.61 |
| Obesity | 54/59 (91.52%) | 41/44 (93.18%) | 13/15 (86.66%) | 0.44 |
| Dyslipidemia | 47/59 (79.66%) | 36/44 (81.81%) | 11/15 (73.33%) | 0.48 |
| MS | 56/59 (94.91%) | 42/44 (95.45%) | 14/15 (93.33%) | 0.75 |
| FLI | 77.76 ± 22.42 | 74.40 ± 22.62 | 88.93 ± 10.59 | 0.04 * |
| HSI | 46.58 ± 8.71 | 45.31 ± 7.91 | 50.39 ± 10.17 | 0.05 * |
| US-LLL_diameter (cm) | 7.54 ± 1.14 | 7.38 ± 1.83 | 8 ± 1.37 | 0.07 |
| US-RHL_diamater (cm) | 14.3 ± 1.95 | 14.05 ± 2.03 | 15.02 ± 1.48 | 0.09 |
| US-PV_diameter (cm) | 1.084 ± 0.108 | 1.072 ± 0.07 | 1.12 ± 0.104 | 0.15 |
| US-Spleen_diameter (cm) | 10.35 ± 1.09 | 10.21 ± 1 | 10.7 ± 1.22 | 0.09 |
| Parameter | Incidence and Mean Value in Patients with NAFLD and T2DM (59 pts.) | Incidence and Mean Value in Patients with HS and T2DM (44 pts.) | Incidence and Mean Value in Patients with NASH and T2DM (15 pts.) | * Statistical Significance p-Value |
|---|---|---|---|---|
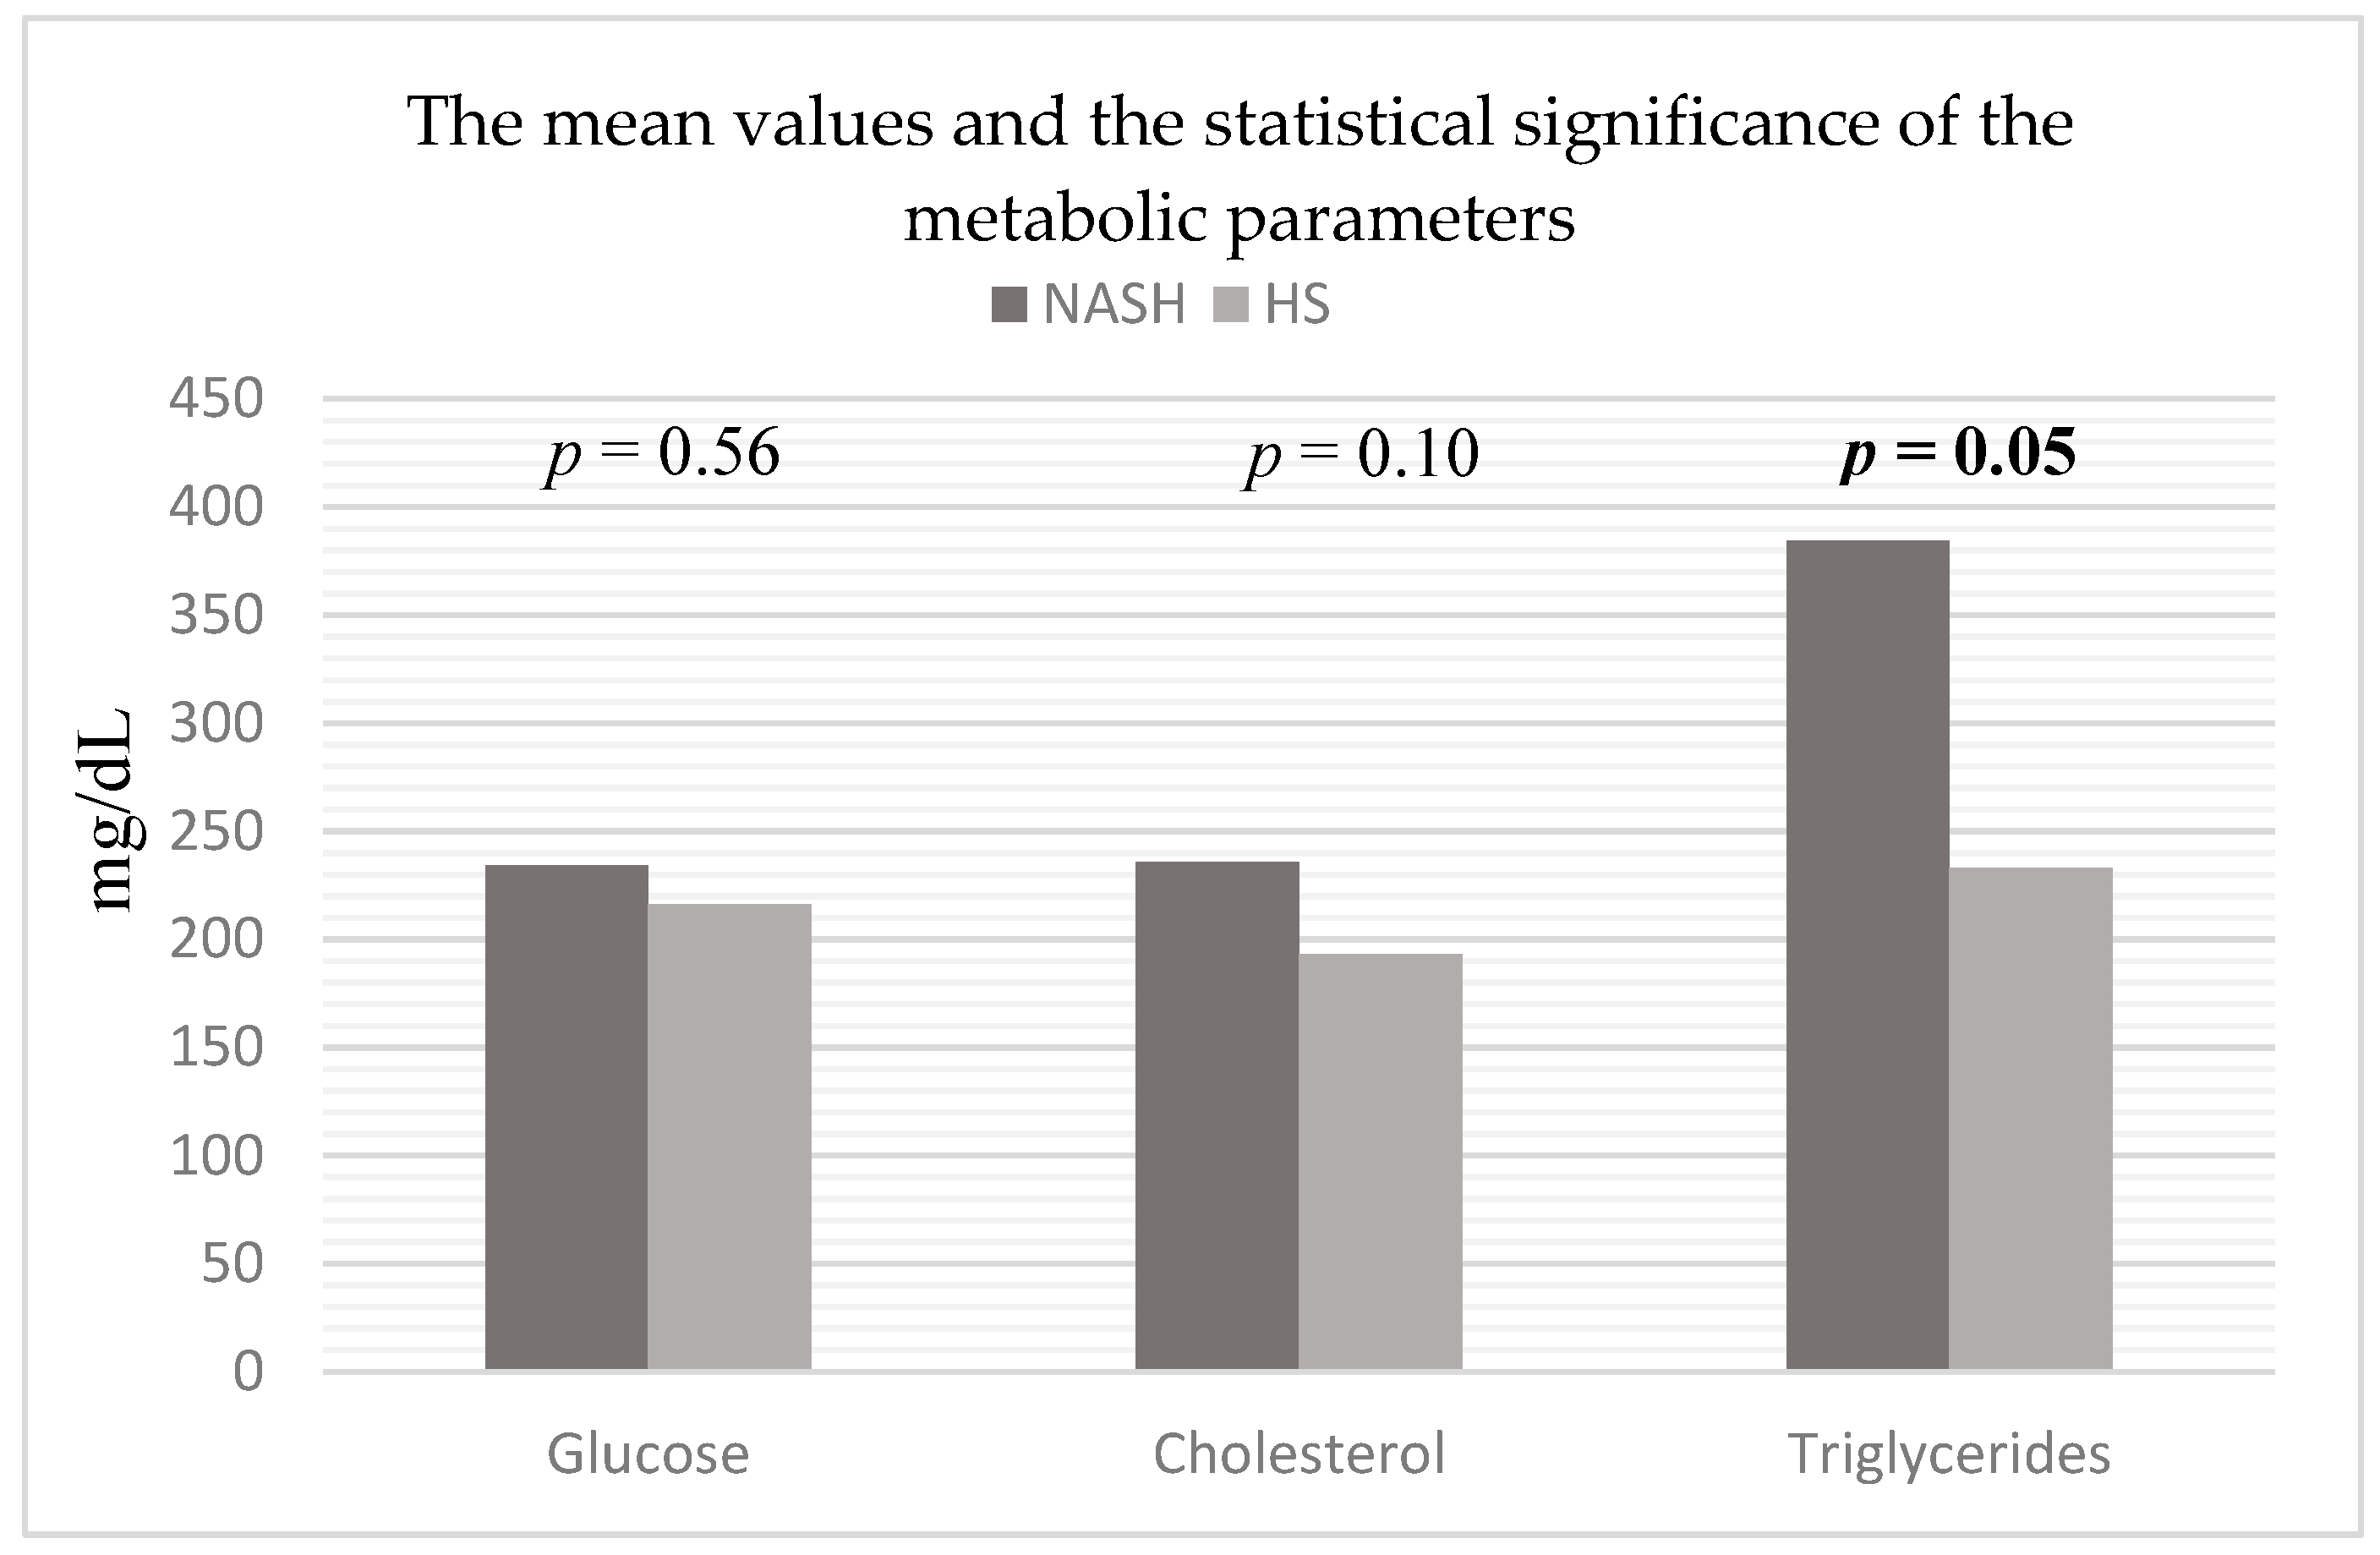
| Glucose (mg/dL) | 220.74 ± 103.61 | 216.11 ± 107.59 | 234.33 ± 89.56 | 0.56 |
| HbA1c (%) | 8.34 ± 1.97 | 8.26 ± 2.74 | 8.57 ± 1.67 | 0.60 |
| Cholesterol (mg/dL) | 204.40 ± 88.62 | 193.59 ± 16.26 | 235.73 ± 145.13 | 0.10 |
| Triglycerides (mg/dL) | 271.30 ± 290.061 | 232.79 ± 14.14 | 384.26 ± 450.90 | 0.05 * |
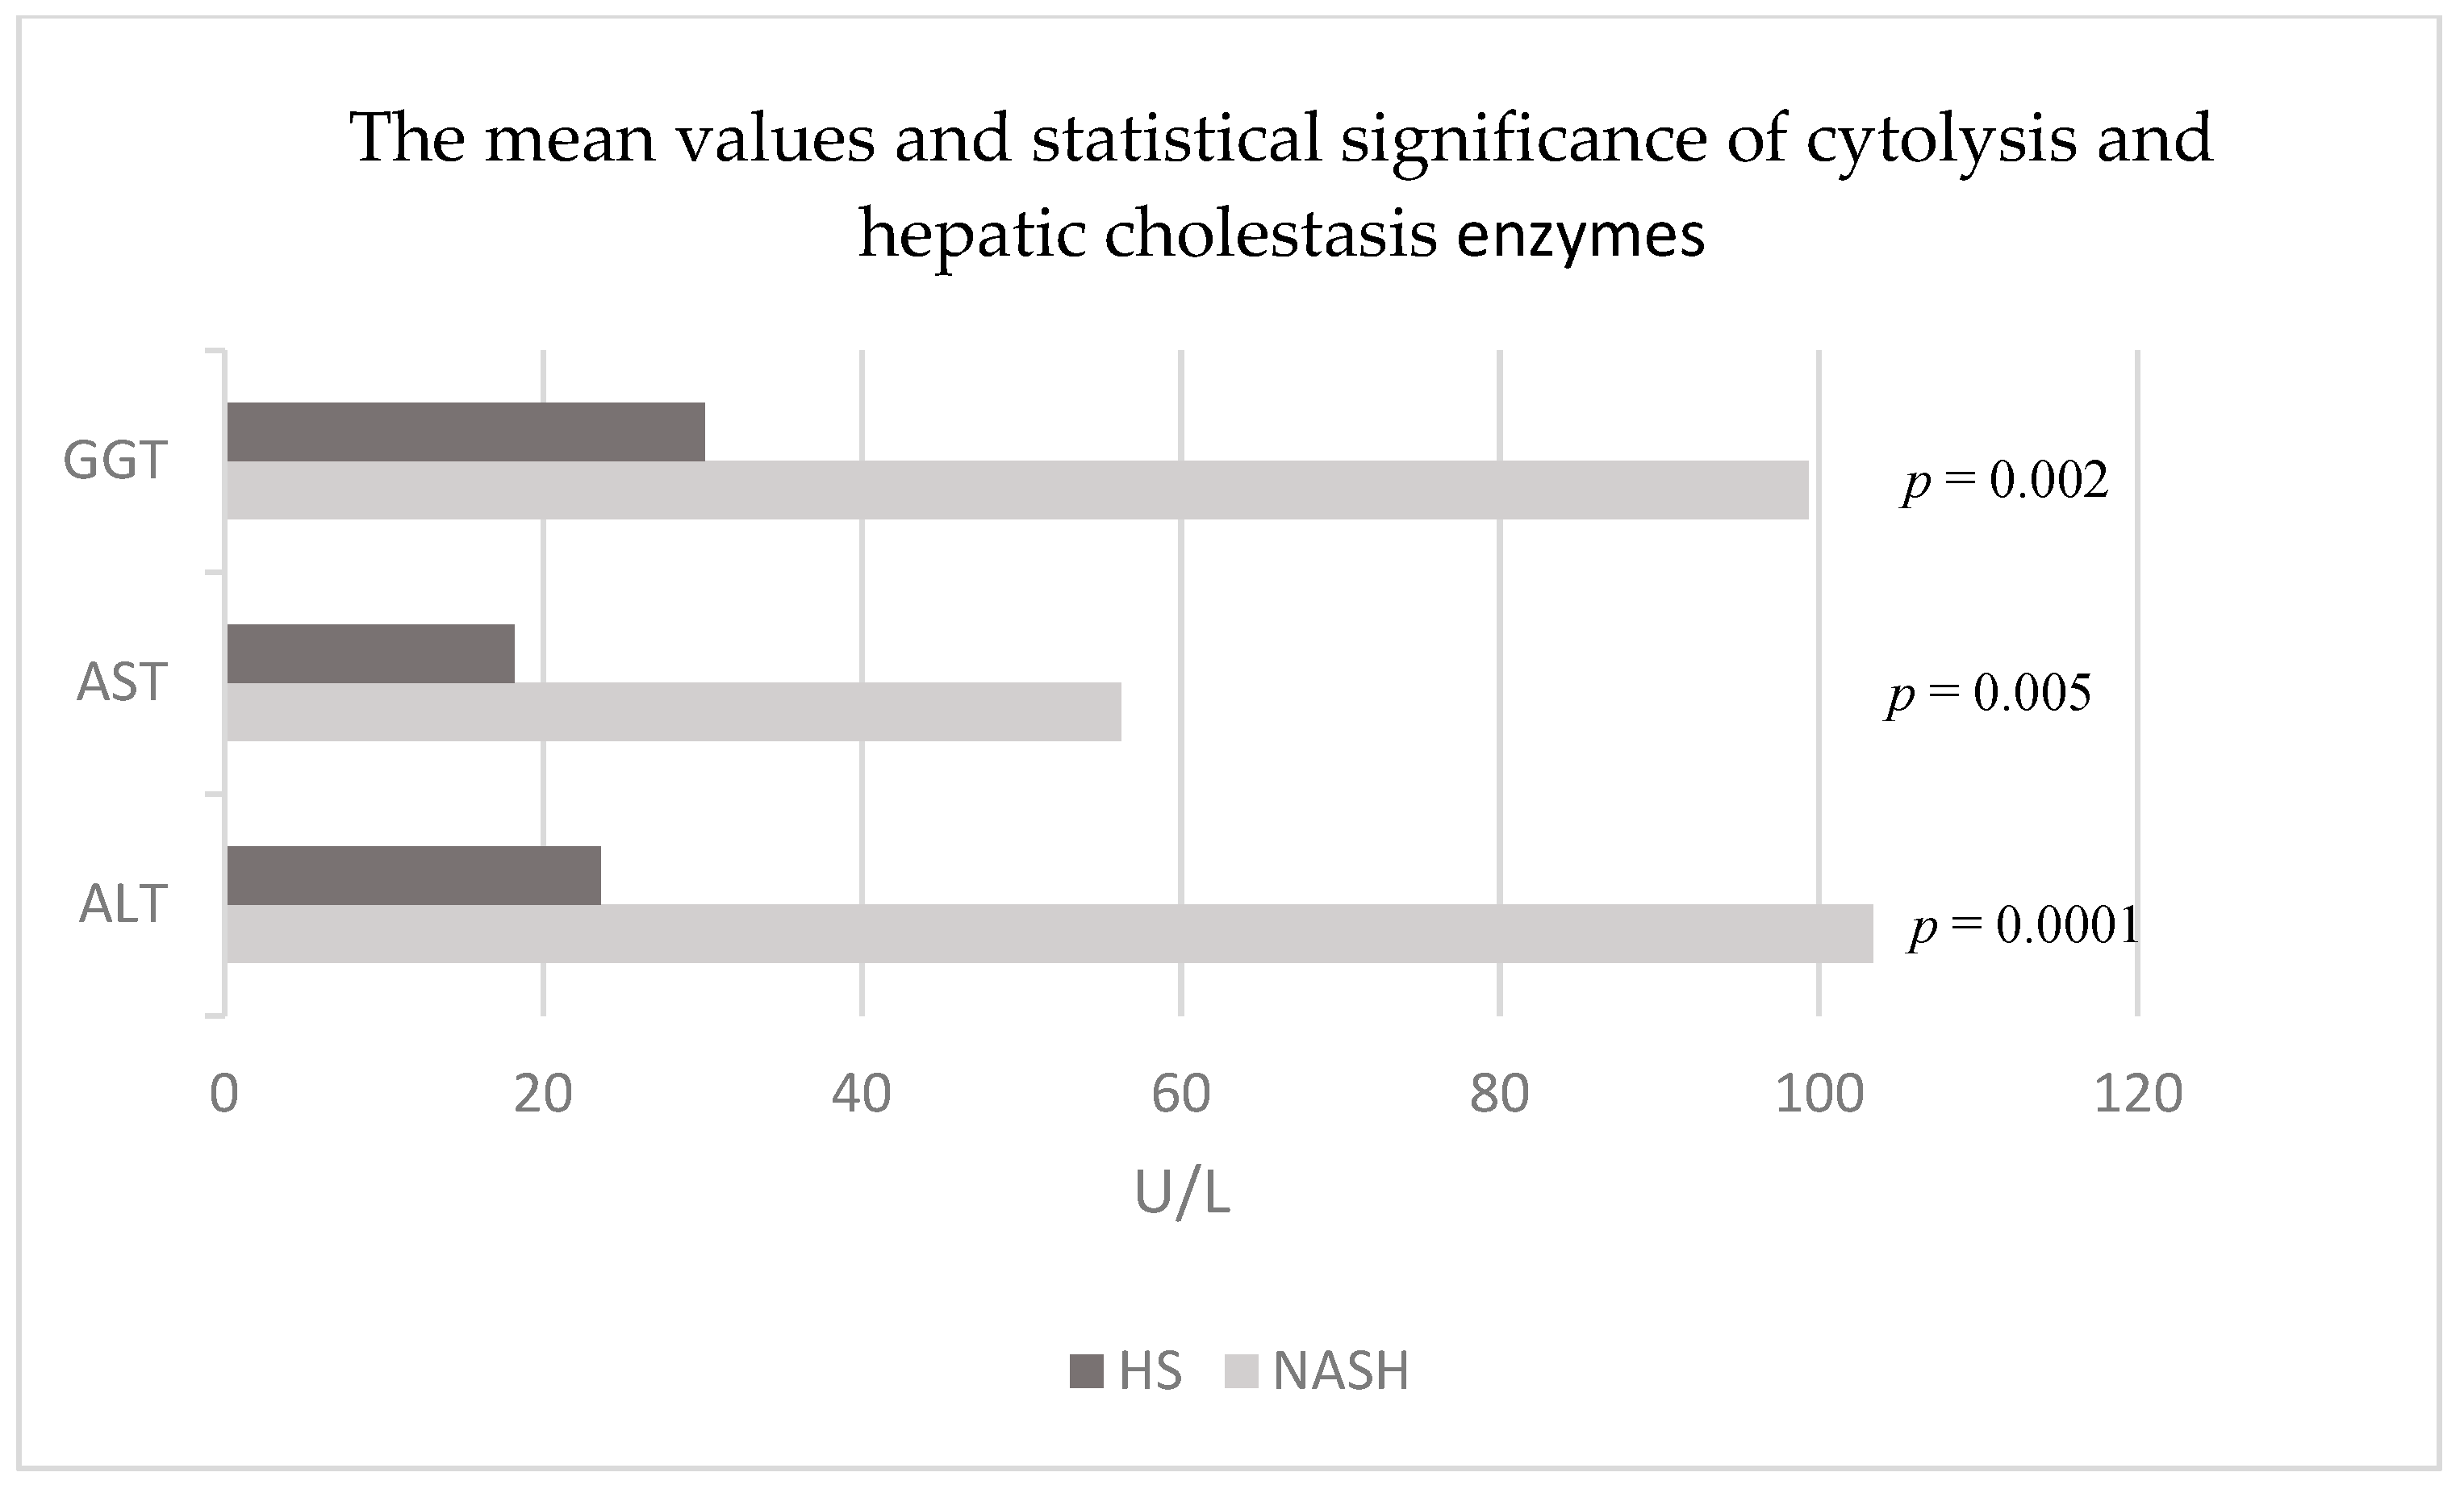
| ALT (U/L) | 43.89 ± 44.39 | 23.61 ± 9.19 | 103.4 ± 54.26 | 0.0001 * |
| AST (U/L) | 28.33 ± 23.64 | 18.18 ± 5.11 | 56.26 ± 32.80 | 0.005 * |
| GGT (U/L) | 47.74 ± 47.58 | 30.15 ± 21.21 | 99.33 ± 70.17 | 0.002 * |
| Albumin (g/dL) | 4.48 ± 0.60 | 4.66 ± 0.44 | 4.42 ± 0.35 | 0.19 |
| Parameter | Incidence and Mean Value in Patients with NAFLD and T2DM (59 pts) | Incidence and Mean Value in Patients with HS and T2DM (44 pts) | Incidence and Mean Value in Patients with NASH and T2DM (15 pts) | * Statistical Significance p-Value |
|---|---|---|---|---|
| Hb (g/dl) | 13.35 ± 1.58 | 13.09 ± 1.64 | 14.1 ± 1.27 | 0.03 * |
| WBC (no/mm3) | 7901 ± 1893 | 8066 ± 1945 | 7415 ± 1635 | 0.25 |
| NP (%) | 59.37 ± 7.88 | 59.67 ± 0.94 | 58.46 ± 6.13 | 0.62 |
| LP (%) | 29.16 ± 8.13 | 28.65 ± 4.10 | 30.65 ± 6.96 | 0.42 |
| Monocytes (%) | 6.17 ± 1.38 | 5.99 ± 1.72 | 6.72 ± 1.47 | 0.07 |
| PLT (no/mm3) | 245,502 ± 62489 | 251,992 ± 91,923 | 226,666 ± 77,524 | 0.45 |
| MLR | 0.22 ± 0.07 | 0.21 ± 0.07 | 0.23 ± 0.07 | 0.62 |
| NLR | 2.37 ± 0.93 | 2.31 ± 0.97 | 2.53 ± 0.80 | 0.45 |
| PDW (%) | 41.19 ± 14.37 | 41.98 ± 12.62 | 38.87 ± 18.36 | 0.47 |
| MPV (fL) | 9.86 ± 1.03 | 9.92 ± 0.92 | 9.68 ± 1.28 | 0.44 |
| Parameter | Incidence and Mean Value in Patients with NAFLD and T2DM (59 pts.) | Incidence and Mean Value in Patients with HS and T2DM (44 pts.) | Incidence and Mean Value in Patients with NASH and T2DM (15 pts.) | * Statistical Significance p-Value |
|---|---|---|---|---|
| ESR (mm/1h) | 38.42 ± 27.08 | 37.54 ± 26.16 | 41 ± 25.29 | 0.67 |
| CRP (mg/dL) | 0.81 ± 1.55 | 0.60 ± 0.21 | 1.44 ± 2.87 | 0.07 |
| Fg (mg/dL) | 361.84 ± 103.65 | 351.76 ± 195.16 | 391.4 ± 111.27 | 0.20 |
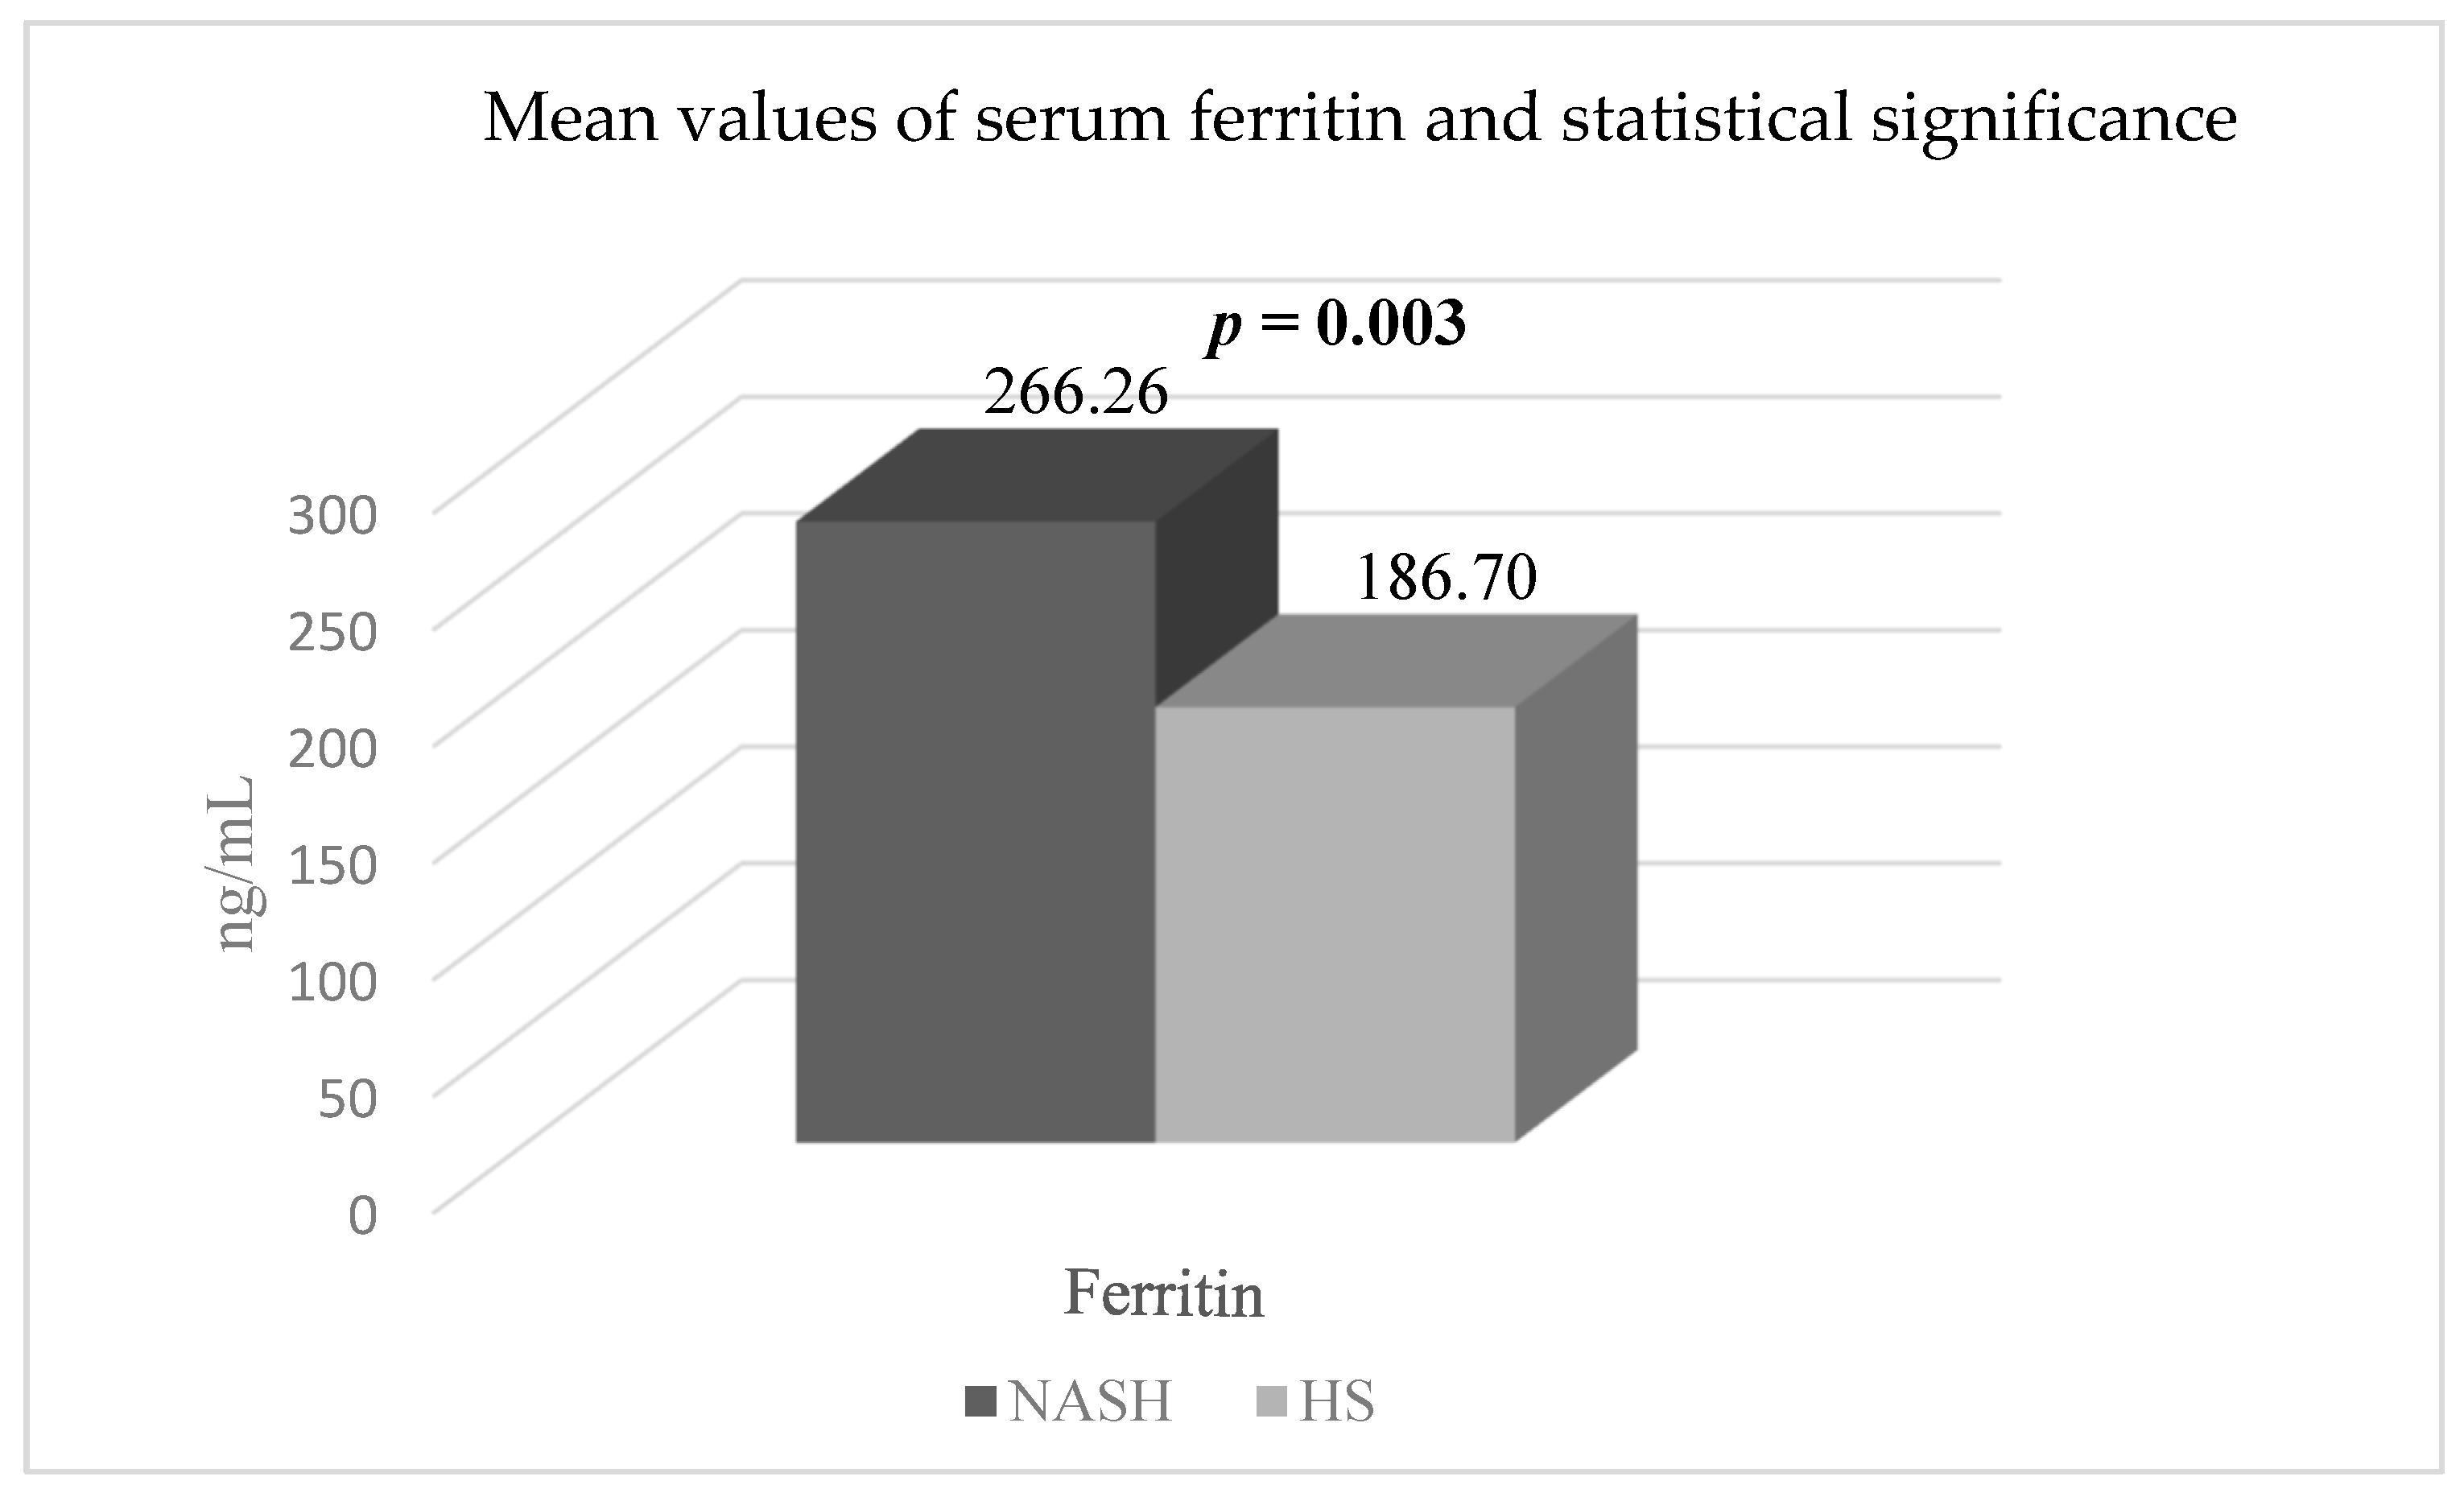
| SF (ng/mL) | 206.93 ± 92.97 | 186.70 ± 86.26 | 266.26 ± 96.74 | 0.003 * |
| SII | 487.59 ± 190.19 | 476.20 ± 36.75 | 520.97 ± 238.10 | 0.43 |
| CAR | 0.39 ± 1.56 | 0.38 ± 1.77 | 0.40 ± 0.67 | 0.97 |
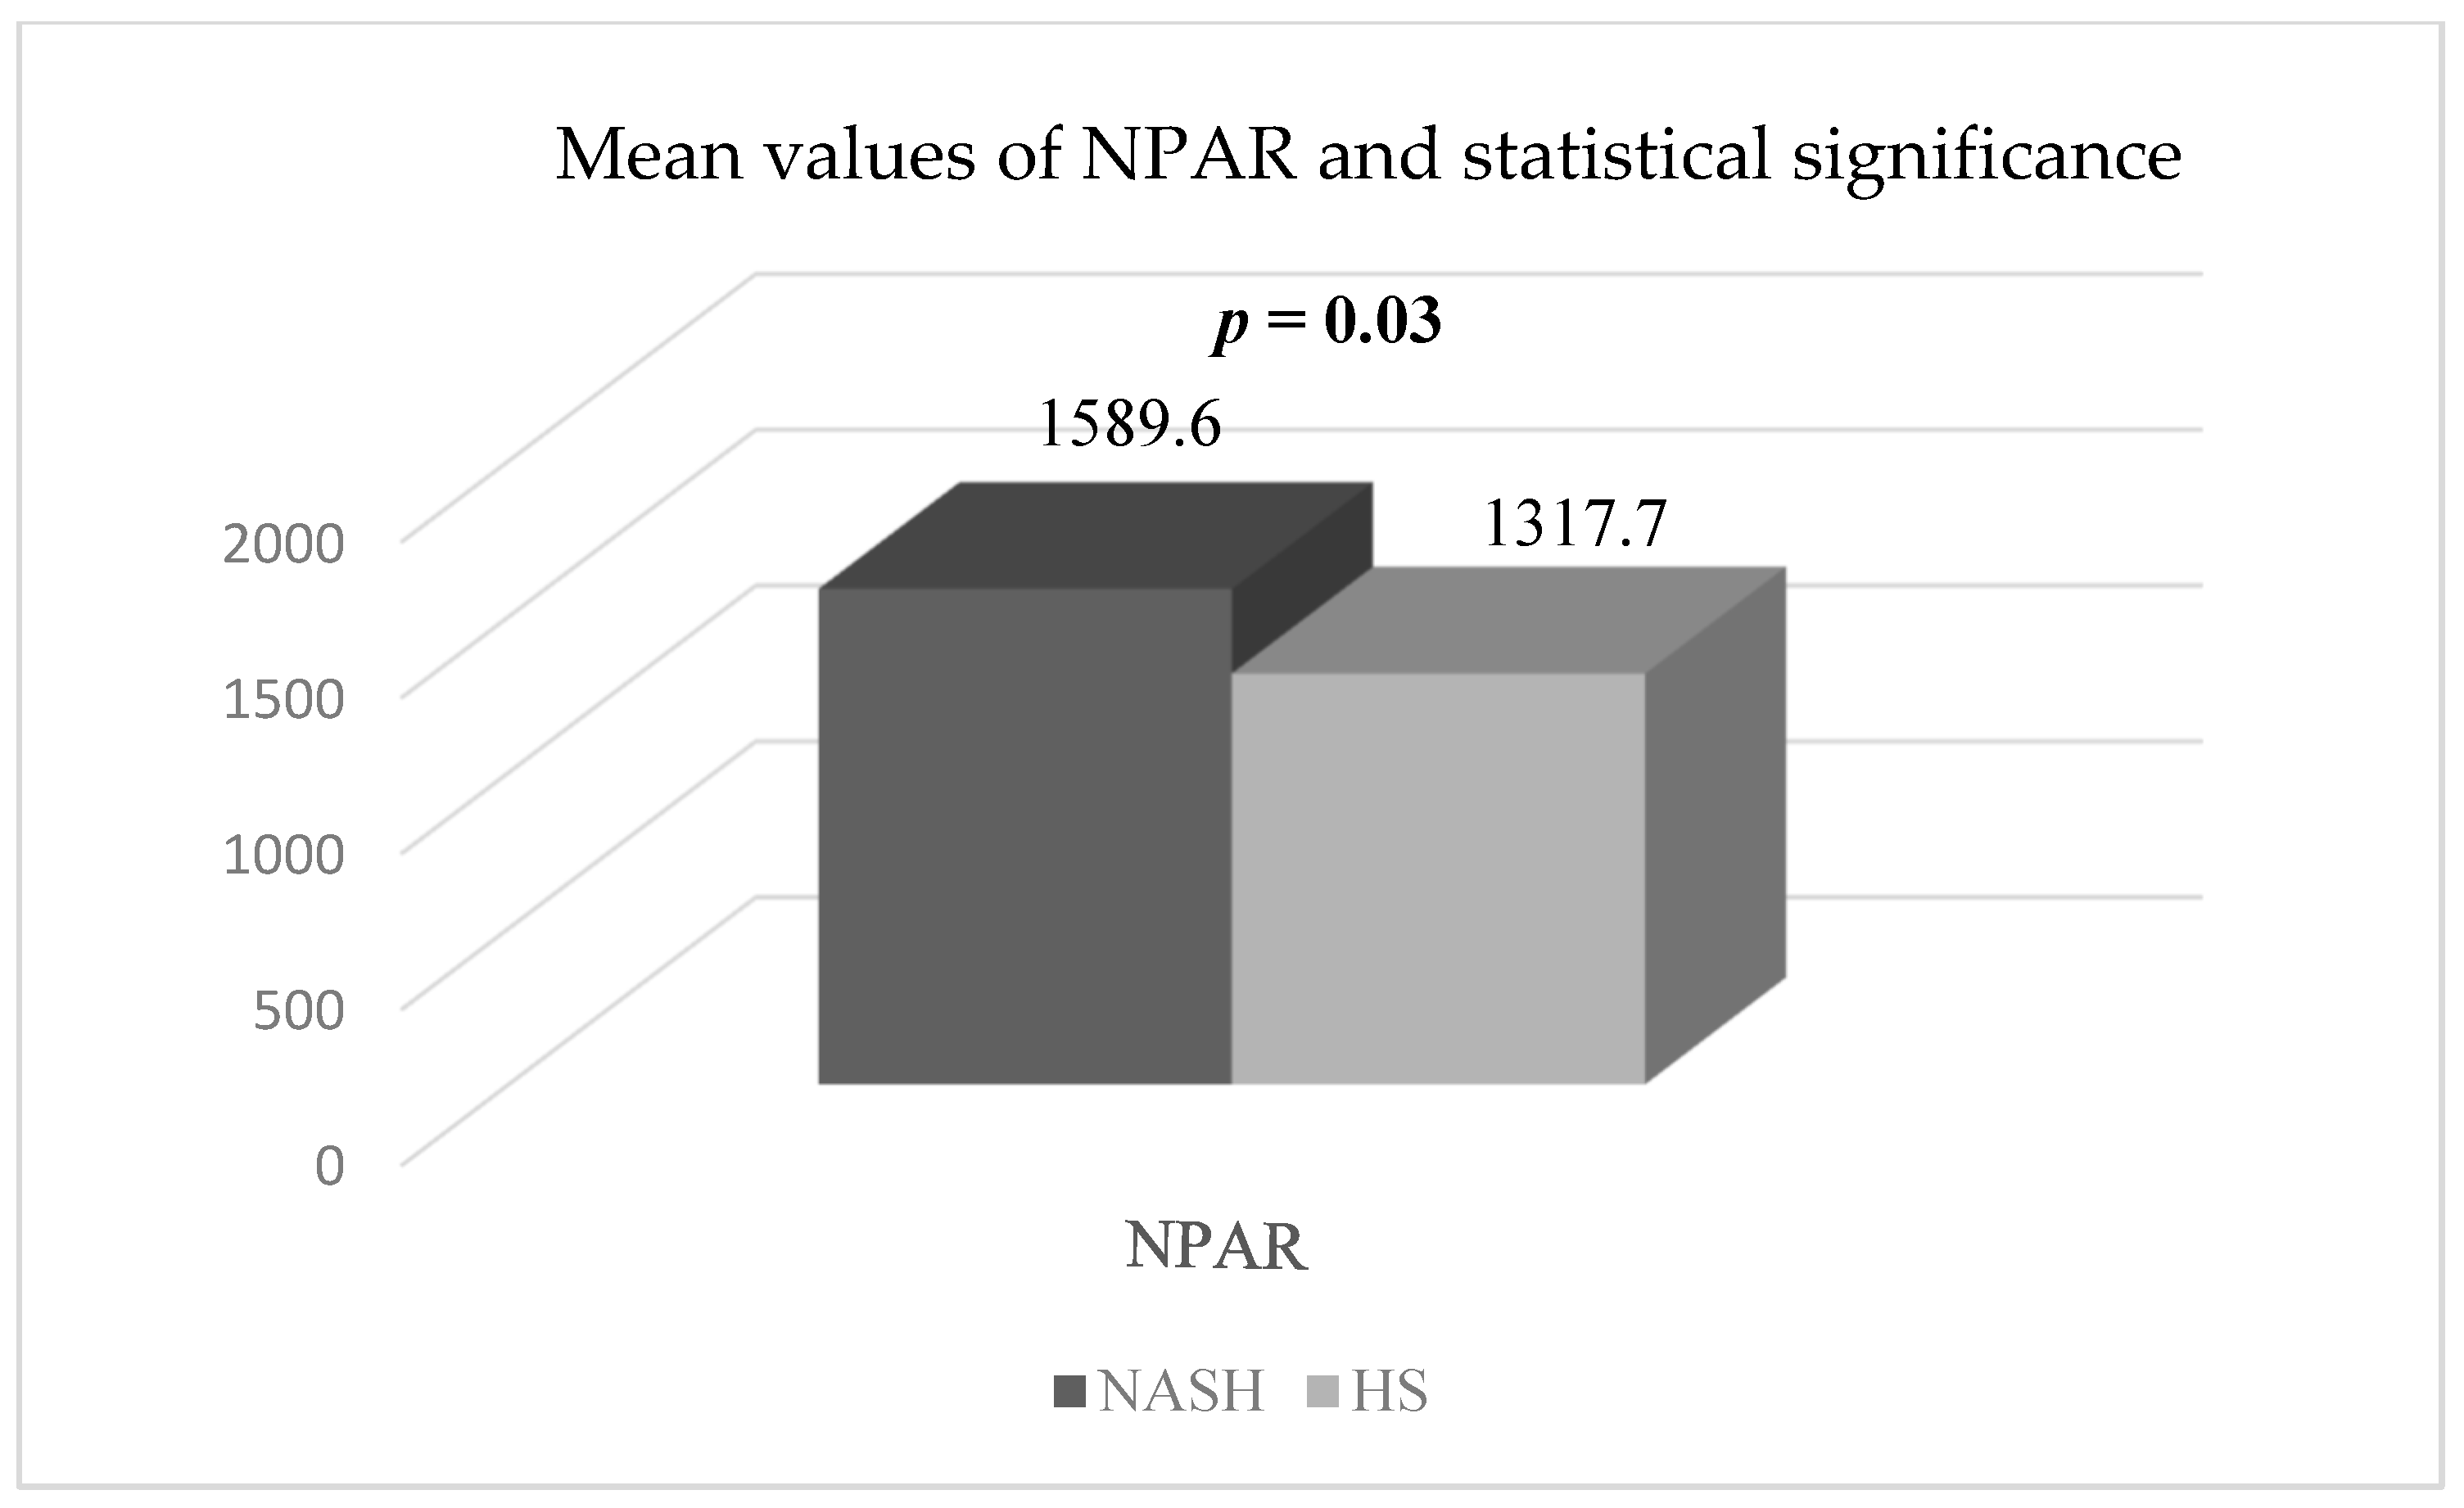
| NPAR | 1386.9 ± 429.88 | 1317.79 ± 235.88 | 1589.6 ± 713.15 | 0.03 * |
Disclaimer/Publisher’s Note: The statements, opinions and data contained in all publications are solely those of the individual author(s) and contributor(s) and not of MDPI and/or the editor(s). MDPI and/or the editor(s) disclaim responsibility for any injury to people or property resulting from any ideas, methods, instructions or products referred to in the content. |
© 2023 by the authors. Licensee MDPI, Basel, Switzerland. This article is an open access article distributed under the terms and conditions of the Creative Commons Attribution (CC BY) license (https://creativecommons.org/licenses/by/4.0/).
Share and Cite
Stan, S.I.; Biciusca, T.; Biciusca, V.; Cioboata, R.; Clenciu, D.; Mitrea, A.; Ghenea, A.E.; Danoiu, S. A Current Approach to Non-Alcoholic Steatohepatitis in Type 2 Diabetes Mellitus Patients. Gastroenterol. Insights 2023, 14, 363-382. https://doi.org/10.3390/gastroent14030027
Stan SI, Biciusca T, Biciusca V, Cioboata R, Clenciu D, Mitrea A, Ghenea AE, Danoiu S. A Current Approach to Non-Alcoholic Steatohepatitis in Type 2 Diabetes Mellitus Patients. Gastroenterology Insights. 2023; 14(3):363-382. https://doi.org/10.3390/gastroent14030027
Chicago/Turabian StyleStan, Sorina I., Teodora Biciusca, Viorel Biciusca, Ramona Cioboata, Diana Clenciu, Adina Mitrea, Alice Elena Ghenea, and Suzana Danoiu. 2023. "A Current Approach to Non-Alcoholic Steatohepatitis in Type 2 Diabetes Mellitus Patients" Gastroenterology Insights 14, no. 3: 363-382. https://doi.org/10.3390/gastroent14030027