1. Introduction
Mitigating climate change is seen as a major challenge for the 21st century. According to the latest report from the Intergovernmental Panel on Climate Change, transport and electricity generation are responsible for 18% and 36% of the global greenhouse gas emissions, respectively [
1]. To reduce this pollution, electrified vehicles and renewable energies are presented as interesting options. For these applications, lithium-ion batteries are key energy storage elements [
1,
2].
In 2021, 340 GWh of batteries have been produced, and these quantities are expected to increase significantly, possibly reaching 3500 GWh per year by 2030 [
3]. In other words, to date, 10.8 kWh of batteries are currently being produced every second. Unfortunately, it is well known that their production is not yet sustainable. This means that none of the lithium-ion batteries produced can be manufactured without using natural resources and significant amounts of energy. Larcher and Tarascon pointed out that it takes over 400 kWh of energy to produce 1 kWh of lithium-ion battery with over 75% of this energy consumed during the material production phase [
4]. In order to achieve sustainable energy production and transport, it is essential to develop solutions to reduce the negative impact of both the batteries already on the market as well as on the future generations of batteries.
The waste management hierarchy shown in
Figure 1 establishes an order of preference for actions to reduce and manage waste [
5]. Reduction, reuse, recycling, recovery and disposal are the actions that should be taken to reduce the environmental impact of a product. Reduction is the preferred action and consists of designing the product in order to limit the waste it will generate at the end of its life. In the context of batteries, reduction consists of minimizing the number of materials used in a battery, in other words, reducing the size of the battery. Electric vehicles powered by smaller batteries would be more economical and more environmentally-friendly [
6,
7].
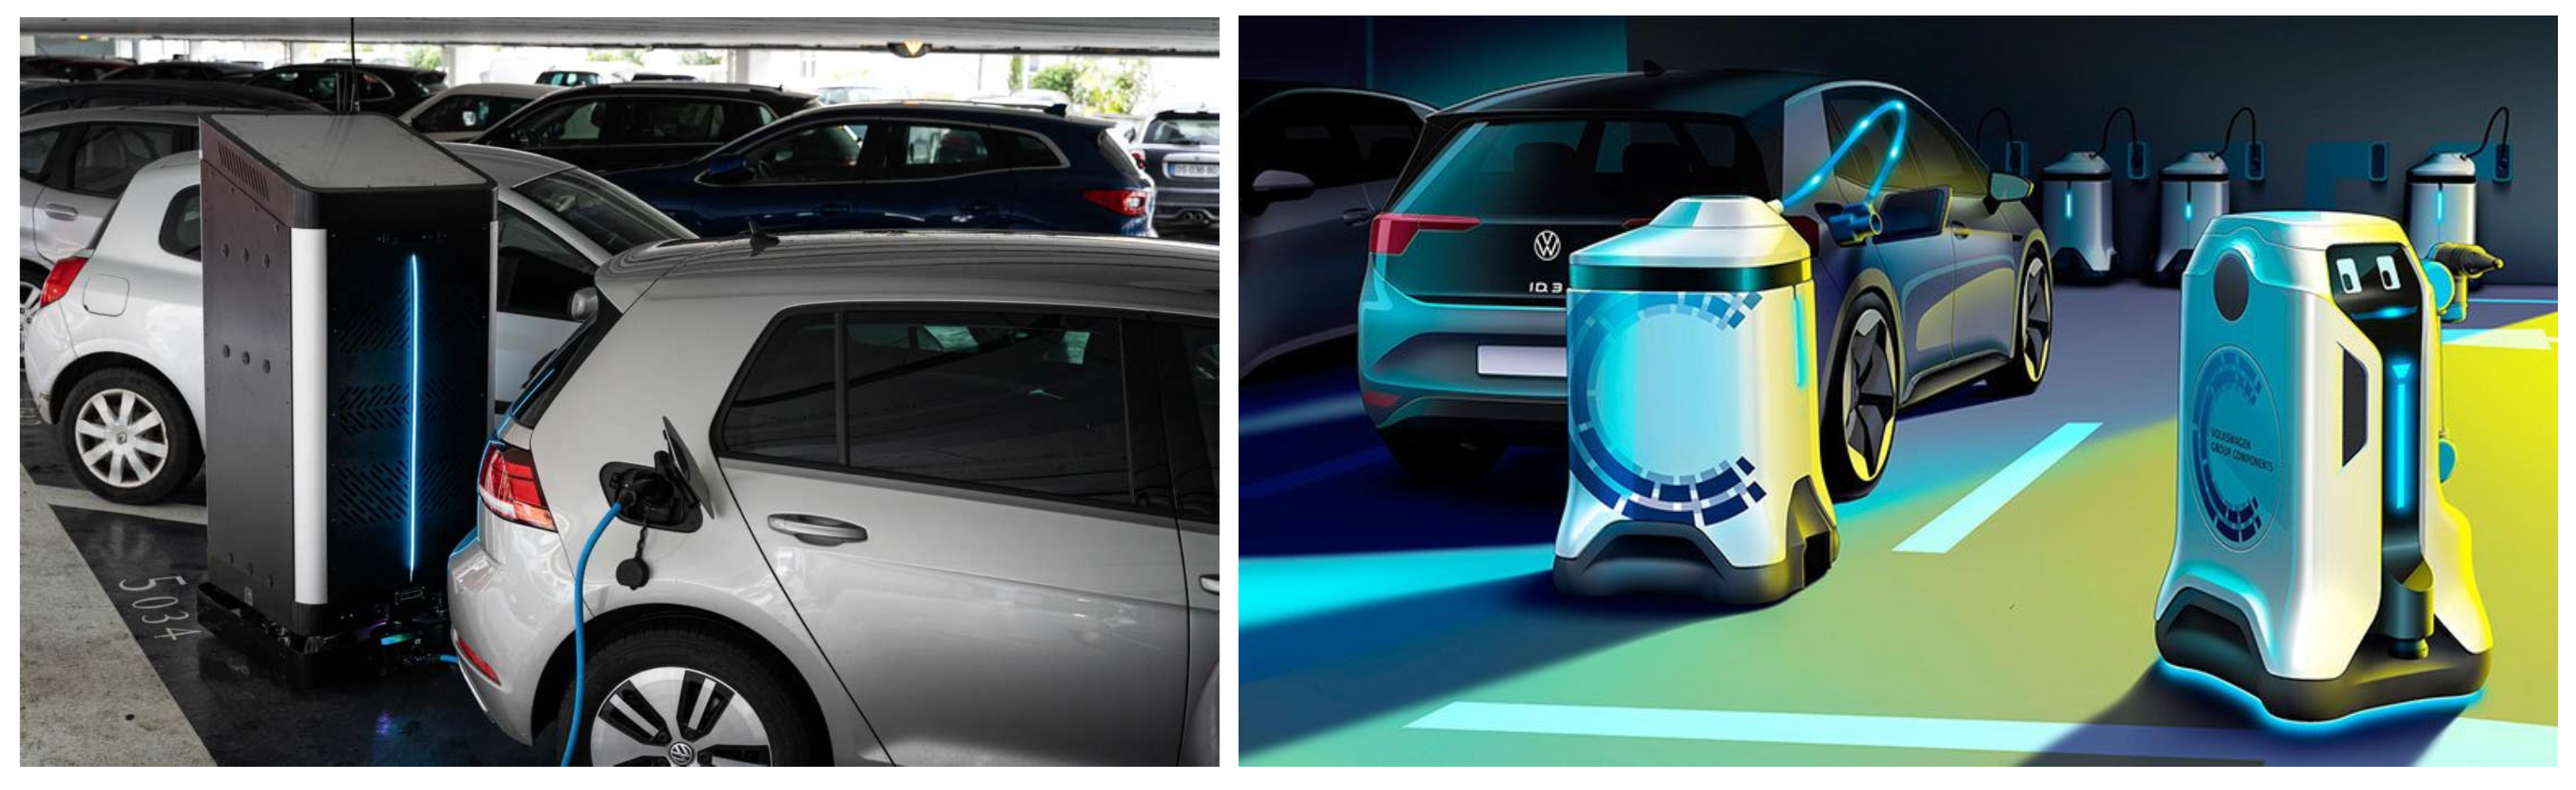
However, such vehicles would have a shorter range and would be more dependent on charging infrastructure. To enable this shift, a reliable charging network needs to be developed. Mobile chargers are a solution to strengthen the existing infrastructure system. A mobile charging station can be defined as a charger capable of delivering energy to vehicles autonomously, i.e., without human assistance and without the need for an external power supply. This technology has the advantage of maximizing the utilization rate of the charging station as these chargers are able to move from one vehicle to another. They also provide a more flexible charging solution, as they are designed to be quickly deployed at any location, with the ability to adapt the energy embedded and the duration of stay to the needs of the drivers [
8,
9].
Figure 2 shows two autonomous mobile charging stations.
As the energy stored by these robot-like chargers is limited, they should be considered as a complementary technology to fixed chargers. To date, existing mobile charging stations can deliver up to 30 kWh at a maximum charging rate of 50 kW [
12]. Powering these mobile charging stations with reused batteries is possible and would be a further step towards a circular economy. Reuse can be defined as the complete or partial reuse of the battery for the original purpose for which it was designed [
13]. In the literature, reused batteries are commonly referred to as “second life batteries”.
While there is a broad consensus in the battery community to recognize the environmental benefits of reuse, the economic interest of second life batteries is still being debated. Finding applications that could accept the constraints of reused batteries is still a challenge. To date, most studies have focused on stationary applications [
14,
15,
16,
17]. Since the volume required for these applications is limited, few authors have presented mobile applications as an interesting alternative [
18,
19,
20]. In addition to the application choice, battery performance evolution needs to be carefully tracked as it has a significant impact on the economic interest of battery reuse [
21,
22].
Although research about second life batteries is gaining interest, two important limitations of the existing studies remain:
First, two definitions of battery reuse coexist in the literature. Most authors define second life batteries in terms of performance level. A threshold of 20 or 30% capacity loss is often considered as the boundary between first and second life [
23,
24,
25,
26]. Studies considering this definition answer the following research question: how does the performance of deeply aged batteries evolve? Other authors define reused batteries as batteries that have undergone a change of application [
27,
28]. This definition raises another research question: what is the effect of an application change on the evolution of battery performance? To date, there is a lack of experimental or modeling studies investigating the performance evolution of a battery that has undergone an application change. This is an important gap since the operating conditions can vary significantly from the first life to the second life.
Secondly, much of the existing research has examined batteries that have been aged in a laboratory. This method has been preferred because of the complexity of acquiring batteries after their electric vehicle life. Laboratory studies also allow control of operating conditions during the whole life of the battery. Nevertheless, in real-world situations users of second life batteries do not have access to the data during first-life use. The battery performance must be assessed to determine the battery’s suitability for a second life. In recent years, few studies have assessed the performance of batteries extracted from electric vehicles [
29,
30,
31]. Nevertheless, these papers are pioneer works focusing on experimental performance assessment. No work has yet been carried out on the electrical modeling of such batteries. Further studies should be conducted to get more insights into battery reuse after the automotive life.
1.1. Contributions
The authors aim to fill the gaps described above by presenting an experimental and modeling study on a battery extracted from an electric vehicle and reused in a mobile application. This article contributes to the existing research on second life batteries in various aspects.
1. Description of a new possible application for second life batteries
In this article, a new possible application for second life batteries is presented: the mobile charging station. To the best of the authors’ knowledge, this is one of the first studies to present in detail a mobile application for reused batteries.
2. Experimental evaluation of second life battery performance
In this study, a characterization test is performed to evaluate the performance and calibrate the electrical models of the second life battery. The capacity of the battery cell is measured at three temperatures and the resistance of the battery cell is characterized at the same three temperatures using current at various charge/discharge rates and depths of discharge. This experimental work contributes to the existing literature on second life batteries as it is one of the first to evaluate the performance of a high-capacity prismatic cell extracted from real second life electric vehicle battery modules.
3. Modeling second life battery performance
This study presents two electrical models that can be used as a reference to evaluate and emulate second life battery performance. The influence of usage profile and temperature on model accuracy is also evaluated. This modeling work is central to estimating the energy stored in the mobile charging station, which is the first step in developing pricing, charging schedules, and energy management strategies. This is one of the first articles to model a second life battery cell extracted from an electric vehicle.
4. Open access publishing of the experimental data and software
Experimental data recorded during the characterization test are published as open-source along with the article. The open software used for data processing has also been shared. To the best of the authors’ knowledge, this is one of the first articles to share experimental data on second life batteries and the software used to analyze these data [
32,
33,
34].
1.2. Layout
The article is organized as follows:
Section 2 presents the experimental evaluation of the second life battery performance. In
Section 3, the electrical models are calibrated thanks to the experimental result and their accuracy is evaluated thanks to a mobile charging station and a WLTC profile in
Section 4. Finally, conclusions are drawn and an outlook for future studies is given.
3. Second-Life Cell Modeling
Accurate estimation of a lithium-ion cell’s voltage behavior over time is paramount in most applications. In fact, the efficiency of thermal management, energy management, and balancing strategies depends heavily on the accuracy of the estimate [
37,
38,
39,
40,
41]. In a large number of industrial applications where real-time control is required, electrical models are preferred over electrochemical [
42]. Their ability to accurately emulate voltage with limited computational cost makes them suitable for embedded applications. In addition, they can be characterized using non-destructive methods [
43,
44,
45].
This section presents the equivalent circuit models used in the study and the procedure used to calibrate and validate them. The work presented can be divided into three parts. First, two equivalent circuit models capable of emulating the voltage response of a lithium-ion cell are presented. Then, the parameters of the models at 0, 25 and 40 °C are identified. Finally, the accuracy of each model has been evaluated thanks to two usage profiles: a Worldwide Harmonized Light Vehicles Test Procedures cycle and a profile representative of a real mobile charging station usage. Data processing and modeling have been carried out thanks to two open software: DATTES and VEHLIB.
DATTES is a free and open-source Matlab/Octave set of tools for processing experimental data on energy storage systems [
33]. This software is capable of processing data from many different battery cyclers and the most common battery techniques, including capacity and impedance measurements or OCV, ICA and EIS analysis. It allows users to process experimental data using a methodology carefully described in the documentation, or to customize the analysis method according to their needs.
VEHLIB is a free and open-source energy management simulation software for electrified vehicles developed in MATLAB/Simulink [
34]. It is based on a block diagram description combined with principles from Bond Graph theory.
3.1. Model Definition
In this article, two equivalent circuit models have been chosen.
The first one is shown in
Figure 6 and will be named “
model”. It consists of an open circuit voltage (
) source in series with two elements: a resistance
which models the ohmic behavior and a Constant Phase Element (
) associated with the other dynamic behavior.
This model emulates the battery voltage response when a current is applied according to Equation (
1).
with
: the voltage response of the cell (V)
: the open circuit voltage (V)
: the ohmic drop (V)
: the voltage dynamic modeled by the constant phase element (V)
The second model is shown in
Figure 7 and will be named “
model”. It consists of a voltage source
in series with resistance
which models the ohmic behavior, a first
circuit for modeling the charge transfer and double layer processes and a second
circuit associated with the diffusion behavior. To maximize the model accuracy during relaxation, adding more
circuits would be necessary [
46]. However, this would also dramatically increase the computational time for more advanced simulations using this model. This model emulates the battery voltage response when a current is applied according to Equation (
2).
with
: the voltage response of the cell (V)
: the open circuit voltage (V)
: the ohmic drop (V)
: the voltage dynamic modeled by i-th RC circuit (V)
For each temperature, the RC and CPE parameters of the models are calibrated in two steps according to the phenomena modeled. The static or thermodynamic behavior is modeled by the open circuit voltage, while the dynamic or polarization behavior is modeled by the parameters R0 + CPE or R0 + R1C1 + R2C2.
3.2. Static Behavior Identification
The static behavior of a battery is usually modeled by an open-circuit voltage source whose behavior evolves with the depth of discharge, temperature and state of health of the battery. The influence of aging is not considered in this study.
In this study, the open circuit voltage (OCV) is determined at C/20 thanks to step 3 of the test shown in
Figure 3. It is calculated by averaging the low rate charge and discharge voltage curves, a technique known as pseudo open circuit voltage. In the datasheet, the open circuit voltage is measured using a galvanostatic intermittent titration technique at 1/3C. This method is slower but more accurate than pseudo-OCV because it is less subject to current polarization [
47]. In this work, pseudo-OCV has been favored for its speed in producing a sufficient number of experimental points to accurately model the dependence of open circuit voltage on the depth of discharge.
Figure 8 shows the influence of temperature and depth of discharge on the open circuit voltage.
In order to model the influence of the depth of discharge on the open circuit voltage, 100 experimental points were considered, ranging from 0% to 100% depth of discharge. Linear interpolation is used between two experimental points for intermediate levels of discharge depth. This method was favored as it maximizes accuracy compared to modeling thanks to an equation.
3.3. Dynamic Behavior Identification
The dynamic behavior of a battery is modeled by the impedance parameters of the model. These parameters are influenced by the depth of discharge, temperature and state of health of the battery. The influence of aging is not considered in this study.
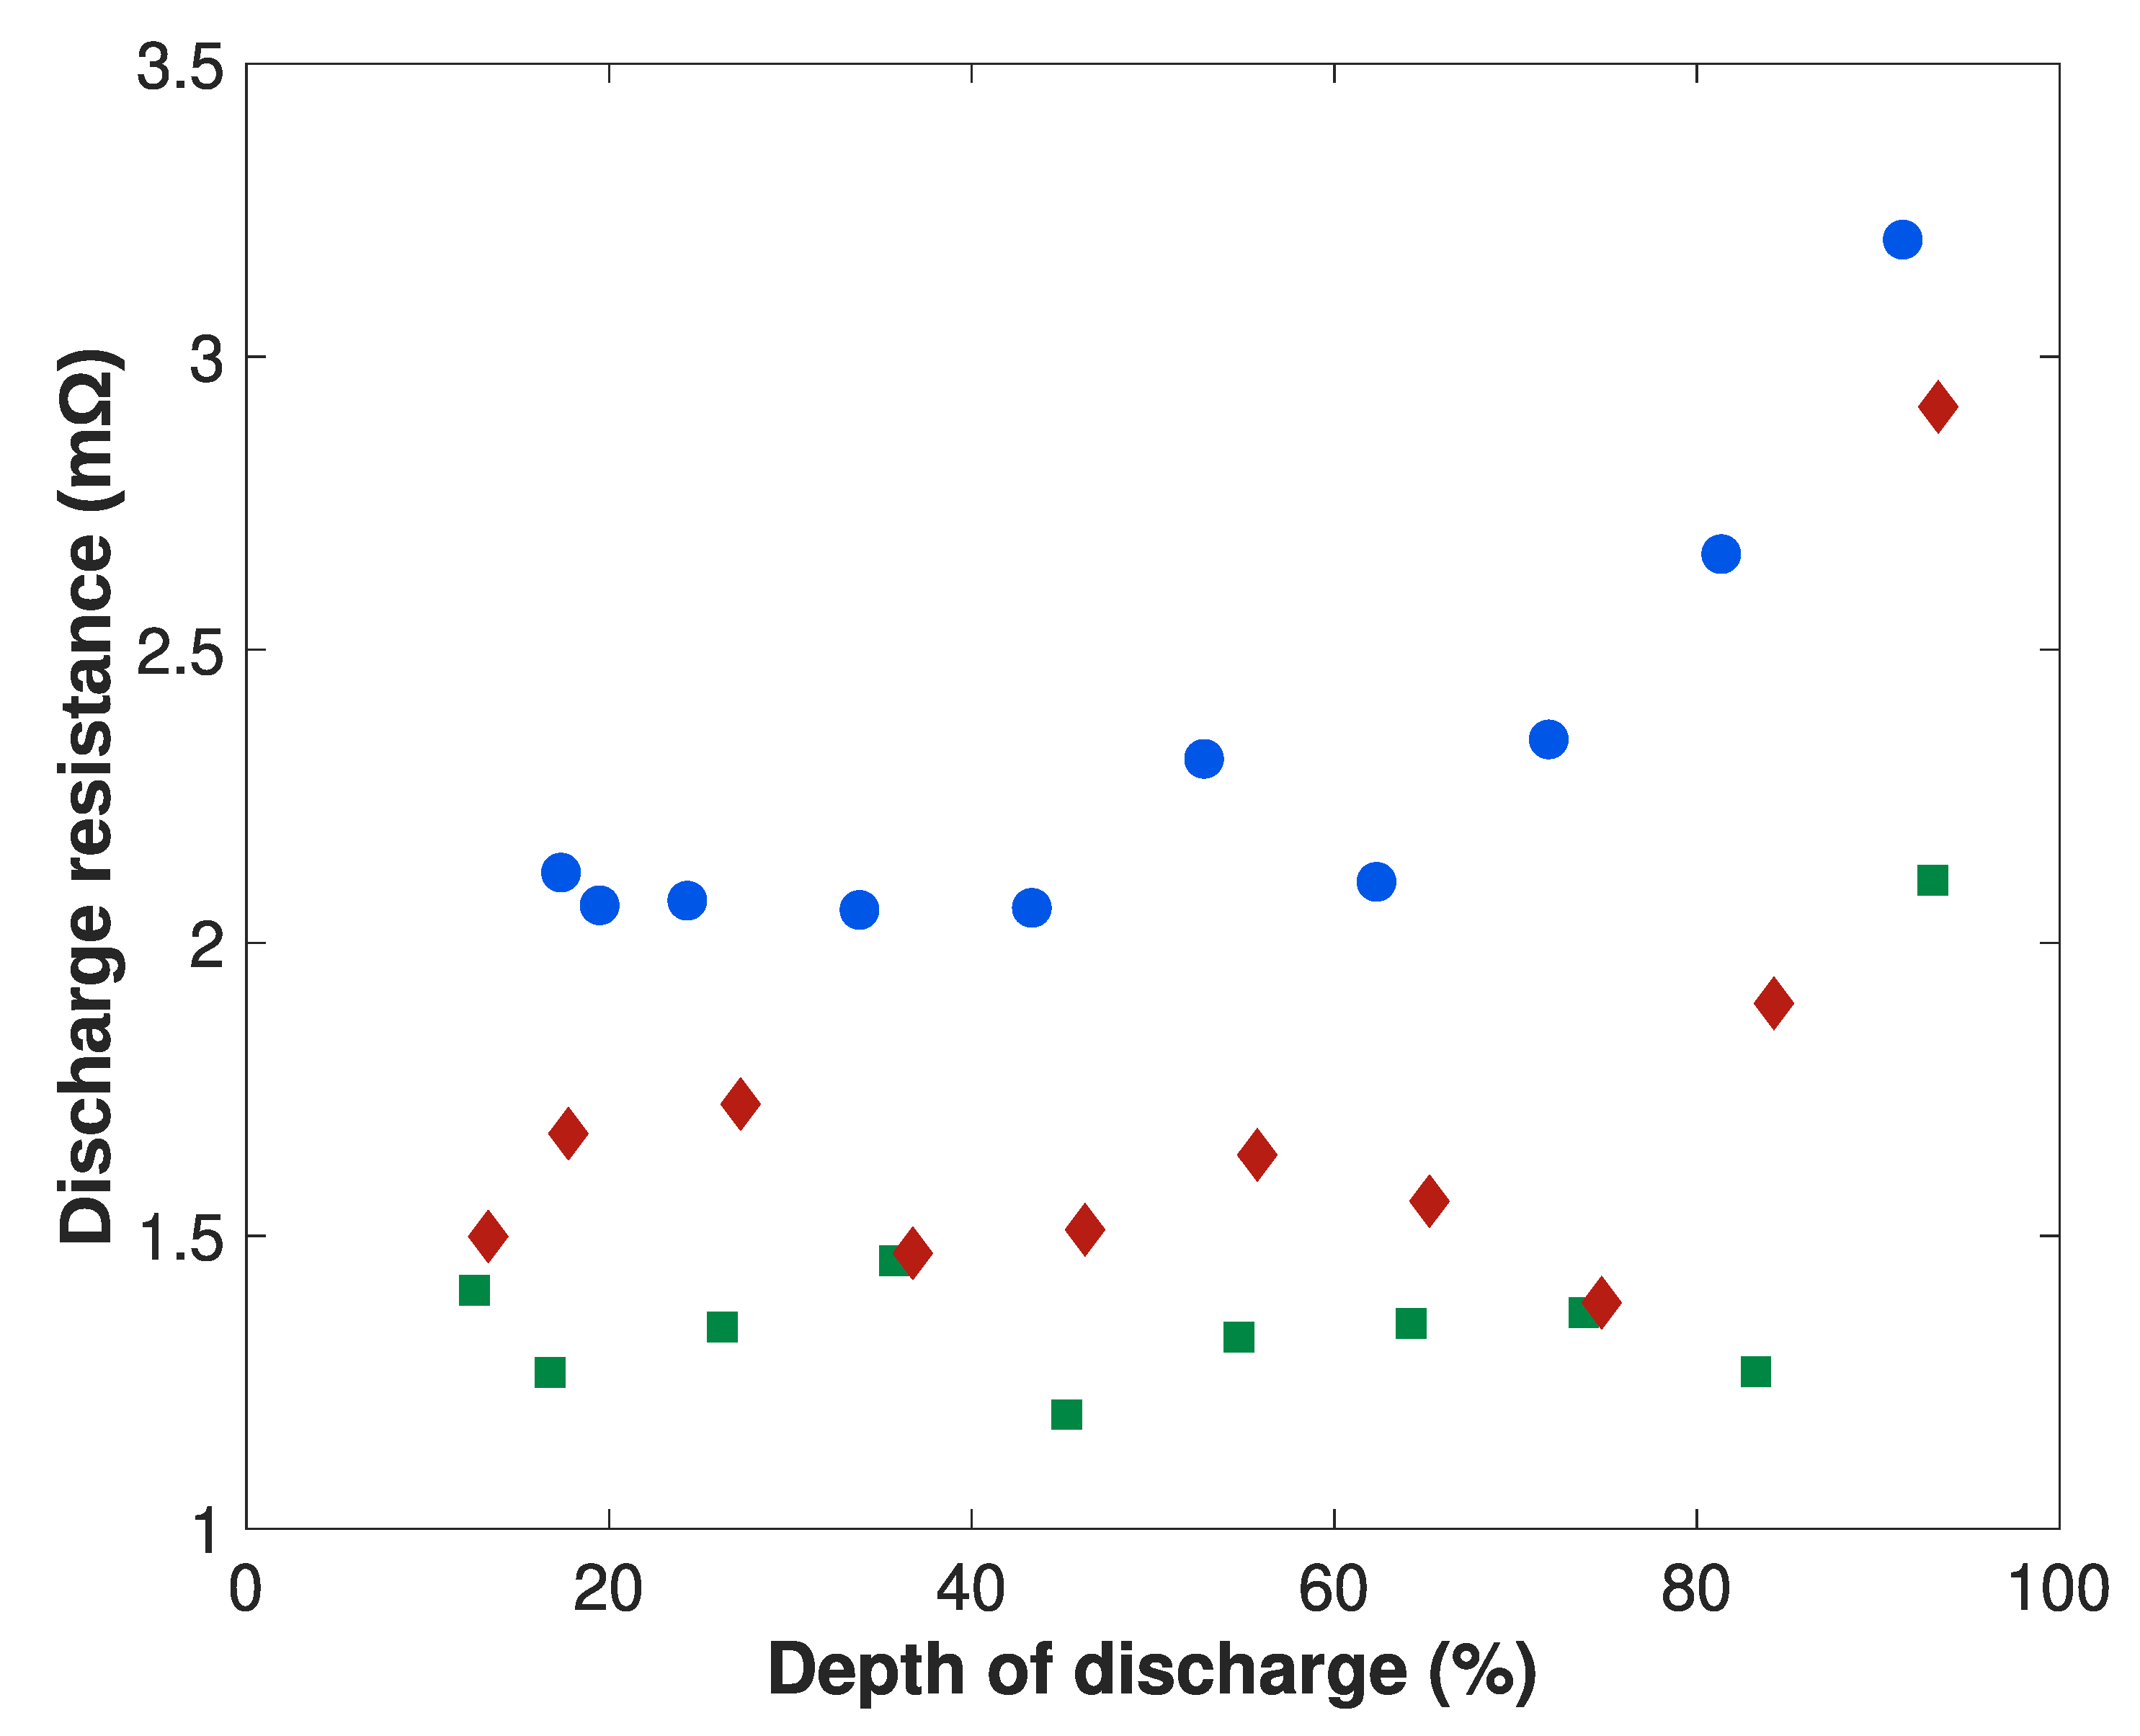
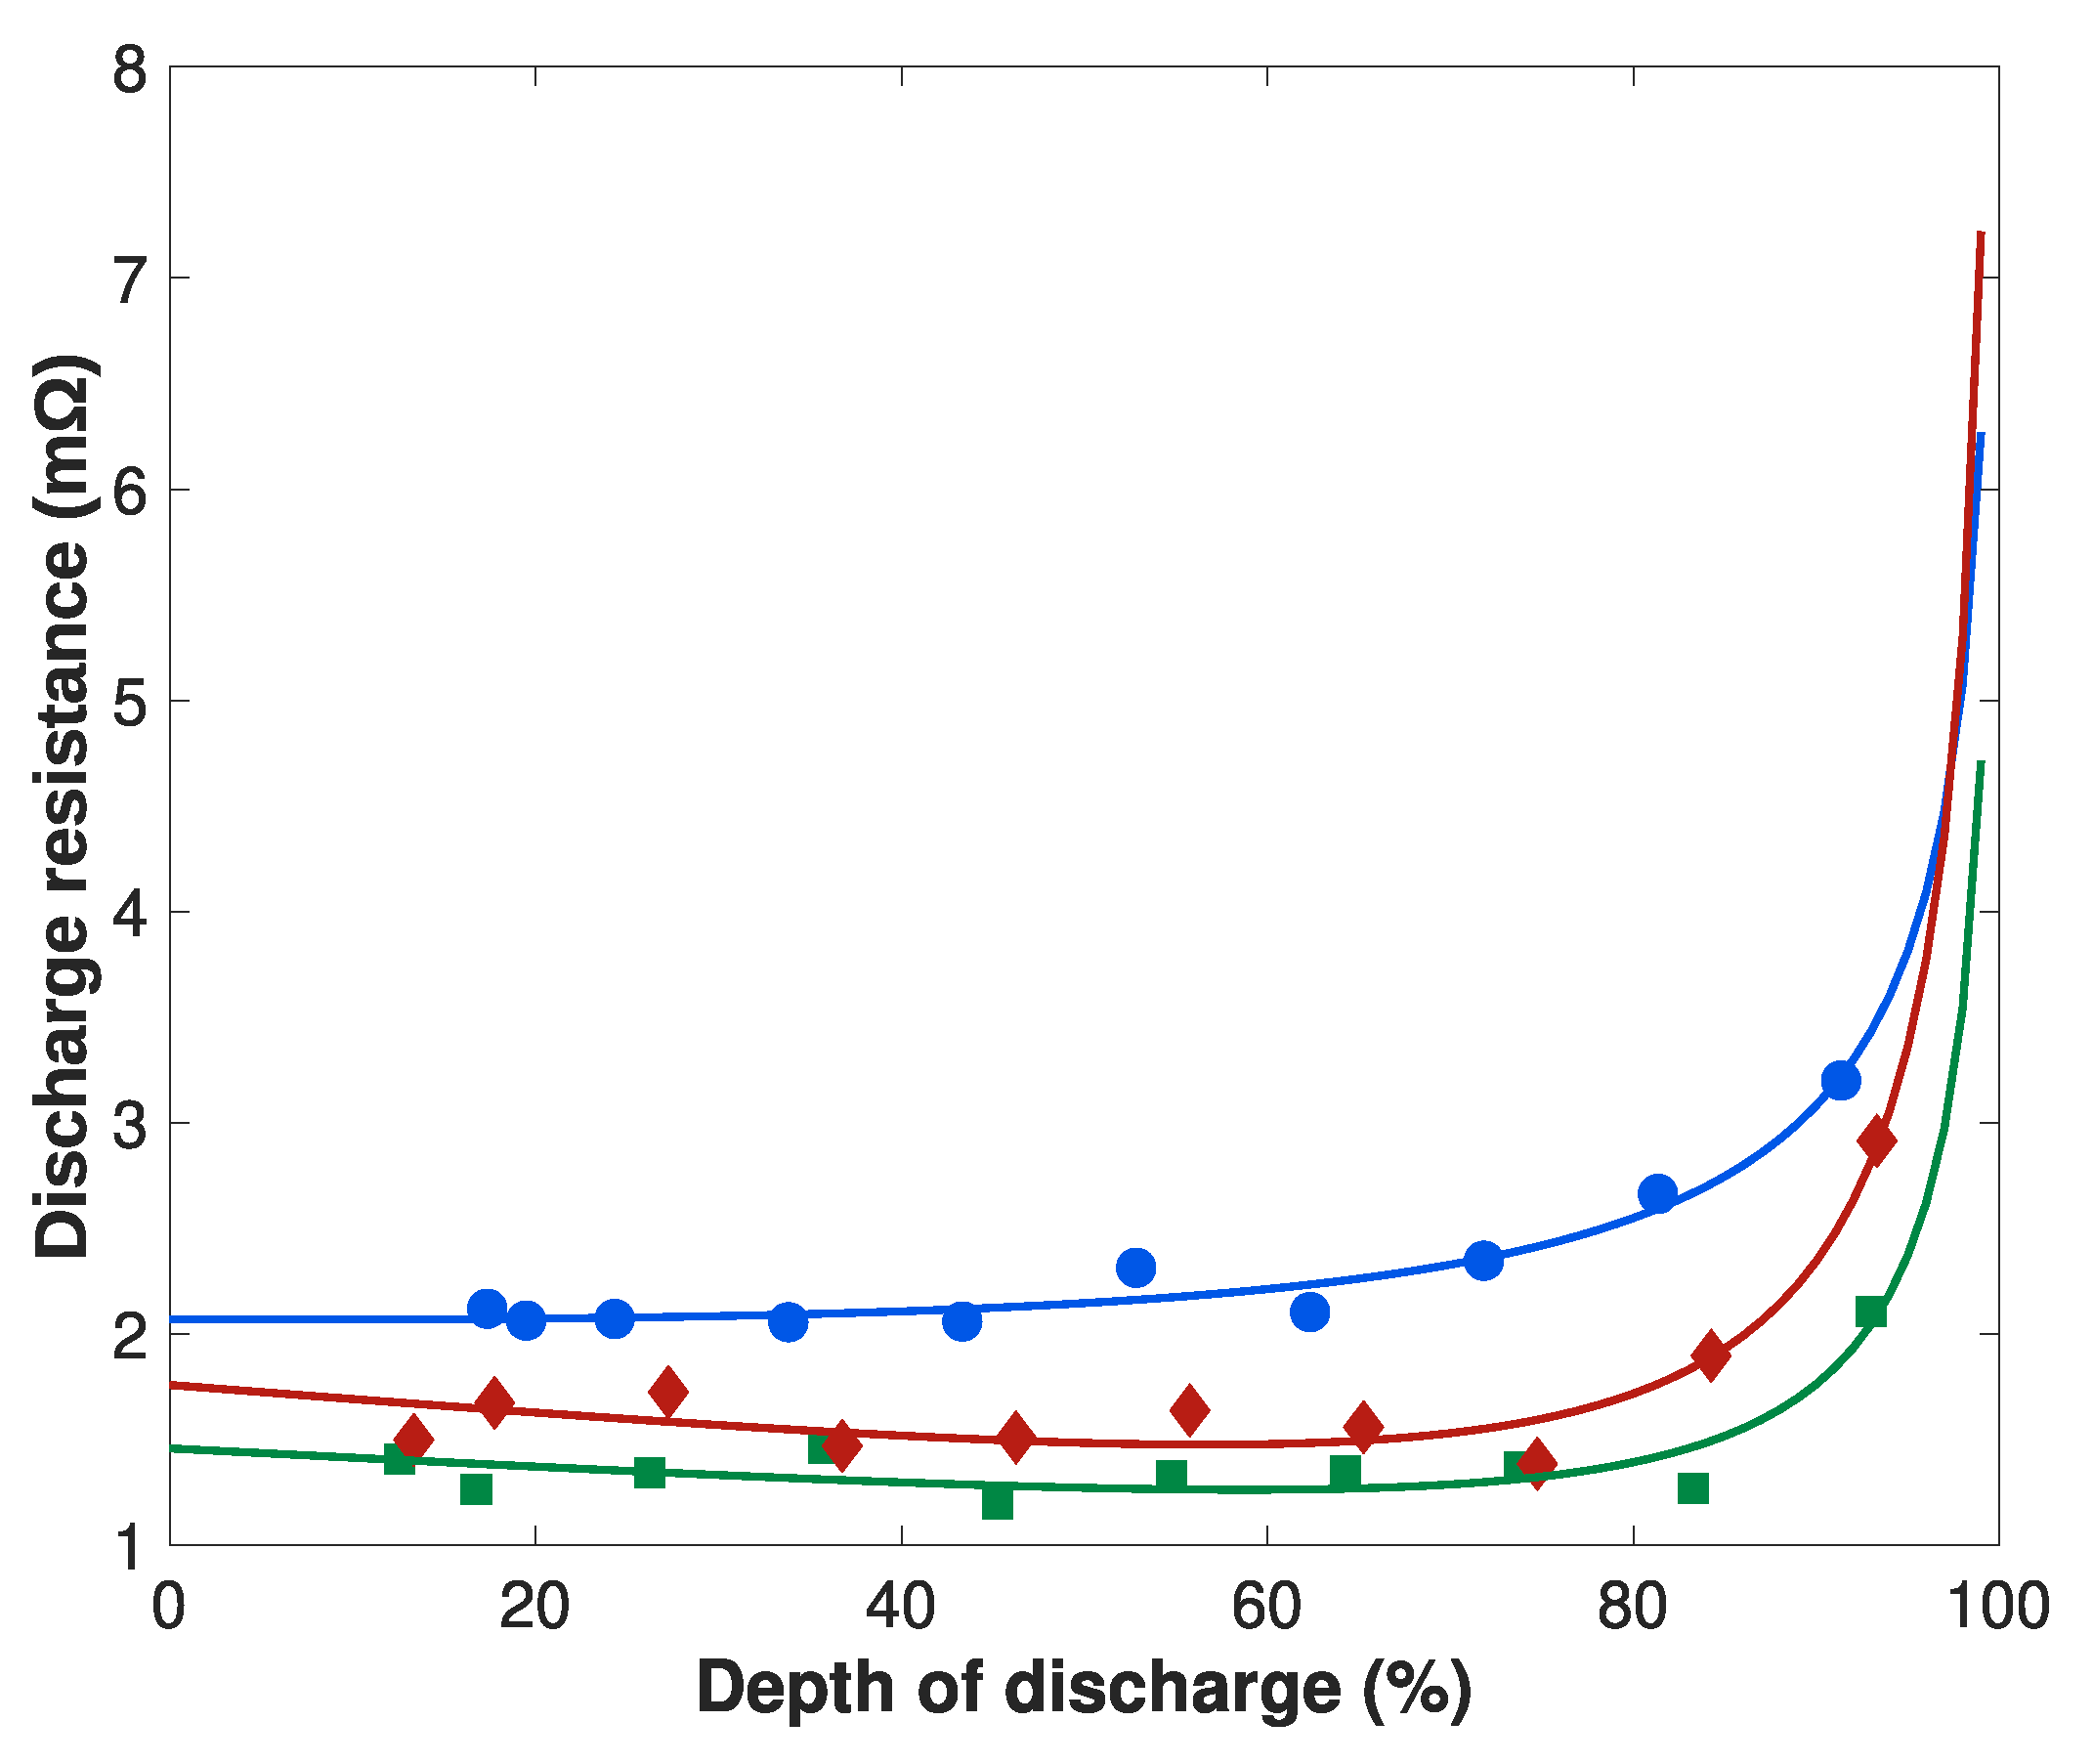
The resistance
models the ohmic drop, it is determined first as it is the shortest dynamic phenomenon that will be modeled in this study. The influence of discharge depth and temperature on the resistance was determined experimentally in step 2 of the characterization test shown in
Figure 3. To model the influence of discharge depth on
, 10 experimental points were considered from discharge depth 10% to 90% and at a current rate of −1C. A logarithmic interpolation is considered between two experimental points for intermediate levels of discharge depth. The influence of the depth of discharge on the 0 s resistance is modeled according to Equation (
A6). The result of the resistance interpolation is shown in
Figure 9.
The parameters
,
,
,
Q and
are intended to emulate the dynamic behavior of a mobile charging station. To model the influence of the depth of discharge on these parameters, 10 experimental points were considered, ranging from a depth of discharge of 10% to 90% and at a current rate of −1C. The equations used to model the influence of the depth of discharge on these parameters are presented in
Appendix A and the values of models parameters are available in
Appendix B.


