Article

Study on the Influence of Air Inlet and Outlet on the Heat Dissipation Performance of Lithium Battery

1
College of Automotive and Transportation Engineering, Guangzhou City Institute of Technology, Guangzhou 510800, China
2
Engineering College Department, South China Agricultural University, Guangzhou 510642, China
*
Author to whom correspondence should be addressed.
World Electr. Veh. J. 2023, 14(4), 113; https://doi.org/10.3390/wevj14040113
Submission received: 22 February 2023 / Revised: 25 March 2023 / Accepted: 10 April 2023 / Published: 18 April 2023
(This article belongs to the Topic Battery Design and Management)

Abstract

:
The heat dissipation characteristics of the lithium-ion battery pack will have an effect on the overall performance of electric vehicles. To investigate the effects of the structural cooling system parameters on the heat dissipation properties, the electrochemical thermal coupling model of the lithium-ion power battery has been established, and the discharge experiment of the single battery has been designed. The voltage and temperature curves with time are similar to those obtained from the numerical model at various discharge rates, and the experimental results are relatively accurate. Based on this model, the height, angle, and number of different air inlets and outlets are designed, and the heat dissipation characteristics of different structural parameters are analyzed. The results show that the maximum temperature decreases by 3.9 K when the angle increases from 0° to 6°, the average temperature decreases by 2 K and the maximum temperature difference decreases by 2.9 K when the height increases from 12 mm to 16 mm, and the more the number of air inlets and outlets there are, the better the heat dissipation effect is. Therefore, the air vent of the battery cooling system has an important impact on the heat dissipation characteristics of the battery, which should be fully considered in the design.

1. Introduction

Lithium-ion batteries are widely used in electric vehicles because of their high power, high energy density, and long life [1,2,3,4]. However, in the process of charging and discharging, lithium-ion batteries will release a lot of heat and cause the temperature of the working environment to rise. A higher temperature will lead to a significant decline in the battery performance, accelerate battery aging, and reduce battery life [5,6].
Effective thermal management of power battery packs is key to ensuring the safe and reliable operation of electric vehicles [7,8,9]. In recent years, the effective heat dissipation methods for the lithium-ion battery pack mainly include air cooling [10,11,12], liquid cooling [13,14], phase change material cooling [15], and heat pipe cooling [16,17]. The advantages of air cooling are its simple structure, low cost, long life, and easy maintenance, which give the air cooling method a good application prospect, and therefore, many scholars have studied it. S. Al Hallaj et al. established a one-dimensional mathematical thermal model of lithium-ion batteries to simulate the temperature distribution of 10 Ah and 100 Ah cylindrical lithium-ion batteries at different cooling rates in order to accurately simulate the thermal response of lithium-ion battery convection cooling during high-speed discharge [18]. Kiziel R. [19] and Sabbah R. [20] compared the heat dissipation effect of forced air cooling and PCM cooling; the results showed that, the cooling method of the PCM helped to reduce the diffusion of uncontrolled battery heat. Watcharakorn I et al. [21] compared the heat dissipation effects of different arrangements (alignment and staggered), and the findings indicated that aligned battery packs provide optimal cooling for the cooling system. Basu S [22] created a liquid-cooled battery thermal management device for 18,650 battery packs. He examined the effects of different operating conditions, such as the coolant flow-rate and discharge current on the temperature of the battery pack, using simulation and experimental techniques, and discovered that resistance had the biggest effect on the thermal performance of the battery. Dylan C [23] analyzed the influence of the battery cell and the geometry of the battery pack on heat dissipation when forced air cooling was adopted; the study found that small variations in the cell size and shape can have significant effects. Additionally, the expense of cooling can easily be doubled or tripled using a cell size or geometry that is not optimal. Xiaoping L et al. [24] designed a battery pack composed of eight square cells, which carried out air cooling and heat dissipation. Using the corresponding curved surface method, the temperature field of the battery pack was optimized, so that the maximum temperature of the battery pack during normal operations was reduced by 2.7 K. Bao Y et al. used a battery pack composed of 32 single cells as the research object and compared the thermal characteristics of the battery pack under different conditions of wind speed and charging rates during rapid charging [25]. The above literature mainly analyzes and studies the cooling mode or battery pack structure of the cooling system of the lithium battery and rarely involves the influence of the structure of the air cooling system on the cooling effect. In fact, the influence of the cooling system structure on battery heat dissipation cannot be ignored [26].
The lithium-ion power battery model includes the electrical characteristics model, thermal model, electrochemical thermodynamic coupling model, and so on. Electrical models, such as equivalent models, black box models [27], and electrochemical mechanism models, are primarily used to simulate the voltage response characteristics of lithium batteries under various loading circumstances. Hu X et al. compared 12 different kinds of equivalent circuit model structures and they found that the first order RC model and the first order RC model with hysteresis were more suitable for LiFePO4 and Li(NiCoMn)O2, respectively [28]. Meng J W et al. introduced a lithium-ion battery-specific nonlinear extension of the MPC charge control structure, which is based on one of the most popular equivalent circuit models (ECMs). The extended Kalman filter (EKF) is used to estimate the battery state. Additionally, the Jacobian matrix from the first-order Taylor estimate in the EKF formulation is utilized in the MPC formulation. It has been verified by practical tests that the electrical constraints of the battery are observed throughout the entire charging process [29]. The electrochemical model creates partial differential equations for electrode and electrolyte dynamics based on the internal reaction mechanism of lithium-ion batteries, which are appropriate for the analysis of thermal management of lithium batteries [30]. Due to the significant quantity of heat produced while power batteries are operating, the electrochemical reaction process and the heat generation process are closely related and have an impact on one another. In this study, an electrochemical thermodynamic coupling model is employed to analyze the thermal properties of power batteries more thoroughly and methodically during charging and discharging.
In this paper, a 18,650 lithium-ion battery was used as the research object, and the electrochemical thermodynamic coupling equation of the lithium-ion power battery was established. After the verification of the cell model, the structure of the air inlet and outlet of the 6 × 5 battery pack is designed. By changing the height, angle, and number of air inlets and outlets, the influence of the related factors to air inlets and outlets on the heat dissipation characteristics of the battery was analyzed. This provides a reference for the optimization design of the cooling system of the lithium-ion power battery pack.

2. Model Development

The simplified charging–discharging model of the 18,650 lithium-ion battery cell used in this study is shown (presented) in Figure 1. The positive active material is lithium manganite (LiMn2O4), the negative active material is graphite (C6), and the materials of the positive current collector, the negative current collector, and the tank are aluminum, copper, and stainless steel, respectively. It is assumed that the spherical particle size of the electrode active material is uniform, the porosity of the electrode is constant, no other chemical side reaction is generated, and no gas phase is generated. So there are three main processes in the model when the battery works: Firstly, there is a diffusion process in the solid phase of lithium-ion in the particles of positive and negative active materials, in which, the speed of lithium-ion diffusion is closely related to the concentration gradient of solid-state lithium-ion. Secondly, there are diffusion and migration processes of lithium-ion in electrolytes, and the diffusion process is related to the concentration gradient and liquid diffusion coefficient, while the migration process of lithium-ion mainly depends on the liquid potential distribution and concentration distribution. Thirdly, the electrochemical reaction process on the surface of positive and negative active material particles.
The electrochemical process on the surface of the positive and negative electrodes can be expressed by the following chemical reaction formula [31,32,33]:
Li m x Mn 2 O 4 + x Li + + x e c h arg e d i s c h arg e Li m Mn 2 O 4
Li n C 6 c h arg e d i s c h arg e Li n x C 6 + x Li + + x e

2.1. Mass Conservation Governing Equation

(1) Conservation of mass in solid phase
The mass conservation of lithium-ion in the intercalation of active materials can be described by Fick’s second law [30]:
C s t + 1 r 2 r r 2 D s C s r = 0
where C s is the solid lithium-ion concentration, t(s) is the time, and r is the radial of spherical particles as shown in Figure 1. D s is the solid-state lithium-ion diffusion coefficient. The lithium-ion concentration on the particle surface is related to the flux and concentration C l of lithium-ion in the electrolyte.
(2) Conservation of mass in the liquid phase
The diffusion and migration process of lithium-ion in the electrolyte can be described by the Nernst–Planck equation. Based on the theory of the concentrated solution, the mass conservation equation of lithium-ion in electrode particles is as follows [22,34]:
ε l C l t + D l e f f C l α v j 0 F ( 1 t + 0 ) = 0
D l e f f = D l ε l γ
D l ( C l , T ) = 10 4 × 10 α
α = 4.43 54 T 229 5 × 0.001 C l 2.2 × 10 4 C l
a v = 3 ε s R
where ε l is the volume fraction of electrolyte, C l is the concentration of lithium-ion in the electrolyte, j 0 is the ion current generated by the electrochemical reaction, that is, the local current density in A/m3, which can be calculated by the electrochemical kinetics control equation, F is the Faraday constant, 96,485 C/mol, t + 0 is the lithium-ion migration number in the electrolyte, and D l is the diffusion coefficient of lithium-ion in the electrolyte. Because the diffusion of electrolytes in a porous electrode is different from that in diaphragm area, the effective diffusion coefficient D l e f f is introduced, which needs to be modified by Formula (5). γ is the Bruggeman index, T is thermodynamic temperature, α v is the specific surface area of activity, which can be calculated according to Formula (8), ε s is the volume fraction of electrode, and R is the radius of active material particles.

2.2. Governing Equations of Electrochemical Kinetics

The local current density j 0 generated in the electrochemical reaction on the particle surface of positive and negative active materials can be described by the Bulter–Volmer equation [35]:
j 0 = i 0 exp α a F η K T exp α c F η K T
i 0 = F k 0 ( C l ) α a ( C s , max C s , s u r f ) α a ( C s , s u r f ) α c
where K is the gas constant coefficient, C s , max is the maximum concentration of lithium-ion in the solid phase, C s , s u r f is the lithium-ion concentration on the surface of the active particle, α a , α c is the transfer coefficient, and k 0 is the reaction rate constant. The exchange current density i 0 is related to the concentration of lithium-ion in the solid phase and the electrolyte.
Over potential η is the driving force of electrochemical reaction, which together with exchange current density i 0 determines the degree of electrochemical reaction. The over potential η can be calculated according to Formula (11):
η = U s U l U e
where U s and U l are solid phase and liquid phase potentials, respectively, and U e is the equilibrium potential, which can be calculated according to Formula (12):
U e = U r e f , i + d U i d T T T r e f
where i = n and p , T r e f is the reference temperature, and U r e f , n is the potential at the reference temperature. According to Reference the following reference potential U e can be obtained [36]:
U r e f , n = 0.6379 + 0.5416 exp b 1 + 0.044 t a n h b 2 0.1978 t a n h b 3
U r e f , p = 3.2482 × 10 6 exp a 1 0.4828 exp a 2 3.2474 × 10 6 exp a 3 + 3.4323
In the formula, each parameter is expressed as follows: b 1 = 305.5309 b , b 2 = ( 0.1958 b ) / 0.1088 , a 1 = 20.2646 ( 1 a ) 3.7995 , b 3 = ( 1.0571 b ) / 0.0854 , a 2 = 80.2493 ( 1 a ) 1.3198 , a 3 = 20.2645 ( 1 a ) 3.8003 , b and a are negative SOC and positive SOC, respectively.

2.3. Charge Conservation Governing Equation

(1) Charge conservation in the solid phase
The conservation of charge in solid phase can be expressed by Formula (15):
( σ s e f f U s ) = α v j 0
σ s e f f = σ s ε s b r u g
where U s is the solid-phase potential, σ s is the solid-phase conductivity. Due to the difference in conductivity between the liquid phase and the solid phase, it needs to be modified. Therefore, the effective conductivity of solid phase σ s e f f is introduced. This parameter is calculated according to Formula (16), and ε s b r u g is the Bruggeman coefficient of the solid phase.
(2) Charge conservation in the liquid phase
The movement of lithium-ion in the electrolyte is determined by Equation (17):
α v j 0 = [ σ l e f f U l + 2 K T σ l e f f F ( 1 + ln f ± ln C l ) 1 t + 0 ( ln C l ) ]
σ l e f f = σ l ε l γ
where f ± is the average molar activity coefficient, and σ l is the conductivity in the electrolyte, which can be calculated according to Formula (19) [22]:
σ l ( C l , T ) = m 0 C l ( m 1 + m 2 T m 3 T 2 + m 4 C l m 5 C l T + m 6 C l T 2 + m 7 C l 2 m 8 C l 2 T ) 2
where the value of each parameter is m 0 = 1.2544 × 10 4 , m 1 = 8.2488 , m 2 = 0.053248 , m 3 = 2.9871 × 10 5 , m 4 = 0.2624 , m 5 = 9.306 × 10 3 , m 6 = 8.069 × 10 6 , m 7 = 0.22002 × 10 4 , and m 8 = 1.765 × 10 4 .

2.4. Governing Equation of Energy Conservation

The mathematical model of the heat generated in the process of battery charging and discharging is established, and the control equation of energy conservation is as follows [35]:
ρ C ρ T t ( k T T ) = Q a c t + Q r e a + Q o h m
where ρ is the density, k T is the thermal conductivity, C ρ is the specific constant pressure heat capacity, and Q a c t , Q r e a , and Q o h m are three heat sources in lithium-ion batteries, namely, polarization heat, reaction heat, and ohmic heat. The reaction heat Q r e a is reversible, and the polarization heat Q a c t and the ohm heat Q o h m are irreversible [31]. The three heat sources can be calculated by Formulas (21)–(23):
Q a c t = a v j 0 η
Q r e a = a v j 0 T U d T
Q o h m = σ s e f f φ s x 2 + σ l e f f φ l x 2 2 σ l e f f R T ( 1 t + 0 ) F 1 + d ln f ± d ln C l φ l x ln C l x
In order to solve the problem of battery heat dissipation, this paper adopts air to cool the battery, ignoring the influence of boundary wall, and assuming that the wind speed of the air passing through each position of the boundary is the same, the heat generated by the battery Q a l l and the heat taken away by the air Q a i r in the cooling process are, respectively:
Q a l l = Q a c t + Q r e a + Q o h m V s p i r a l d t
Q a i r = Q a l l C ρ , j m j T ¯ j T 0
where V s p i r a l is the volume of spiral layer, j is the cell, spiral layer, or battery tank, T ¯ j is the average temperature of battery components at the end of discharge, and T 0 is the initial discharge temperature.

2.5. Boundary and Initial Conditions

As shown in Figure 1, for the above physical model, the boundary is, respectively, located at No. 1–6. The solid electromotive force at the boundary of the negative collector is 0, and the charge flux at the boundary of the positive collector is the average current density.
φ s x = 5 = φ s x = 6 = 0
σ s e f f φ s x x = 3 = σ s e f f φ s x x = 4 = 0
σ s e f f φ s x x = 1 = σ s e f f φ s x x = 2 = i a p p
Since there is no lithium-ion passing through boundary 2 and boundary 5 as only electrons pass through, and the liquid-phase electromotive force is continuous at boundary 2 and 3, the boundary conditions can be listed as follows:
φ l x x = 2 = φ l x x = 5 = 0
On the surface of boundary 2 and boundary 5, the convective boundary conditions are as follows:
k T x x = 2 = k T x x = 5 = h ( T T a m b )

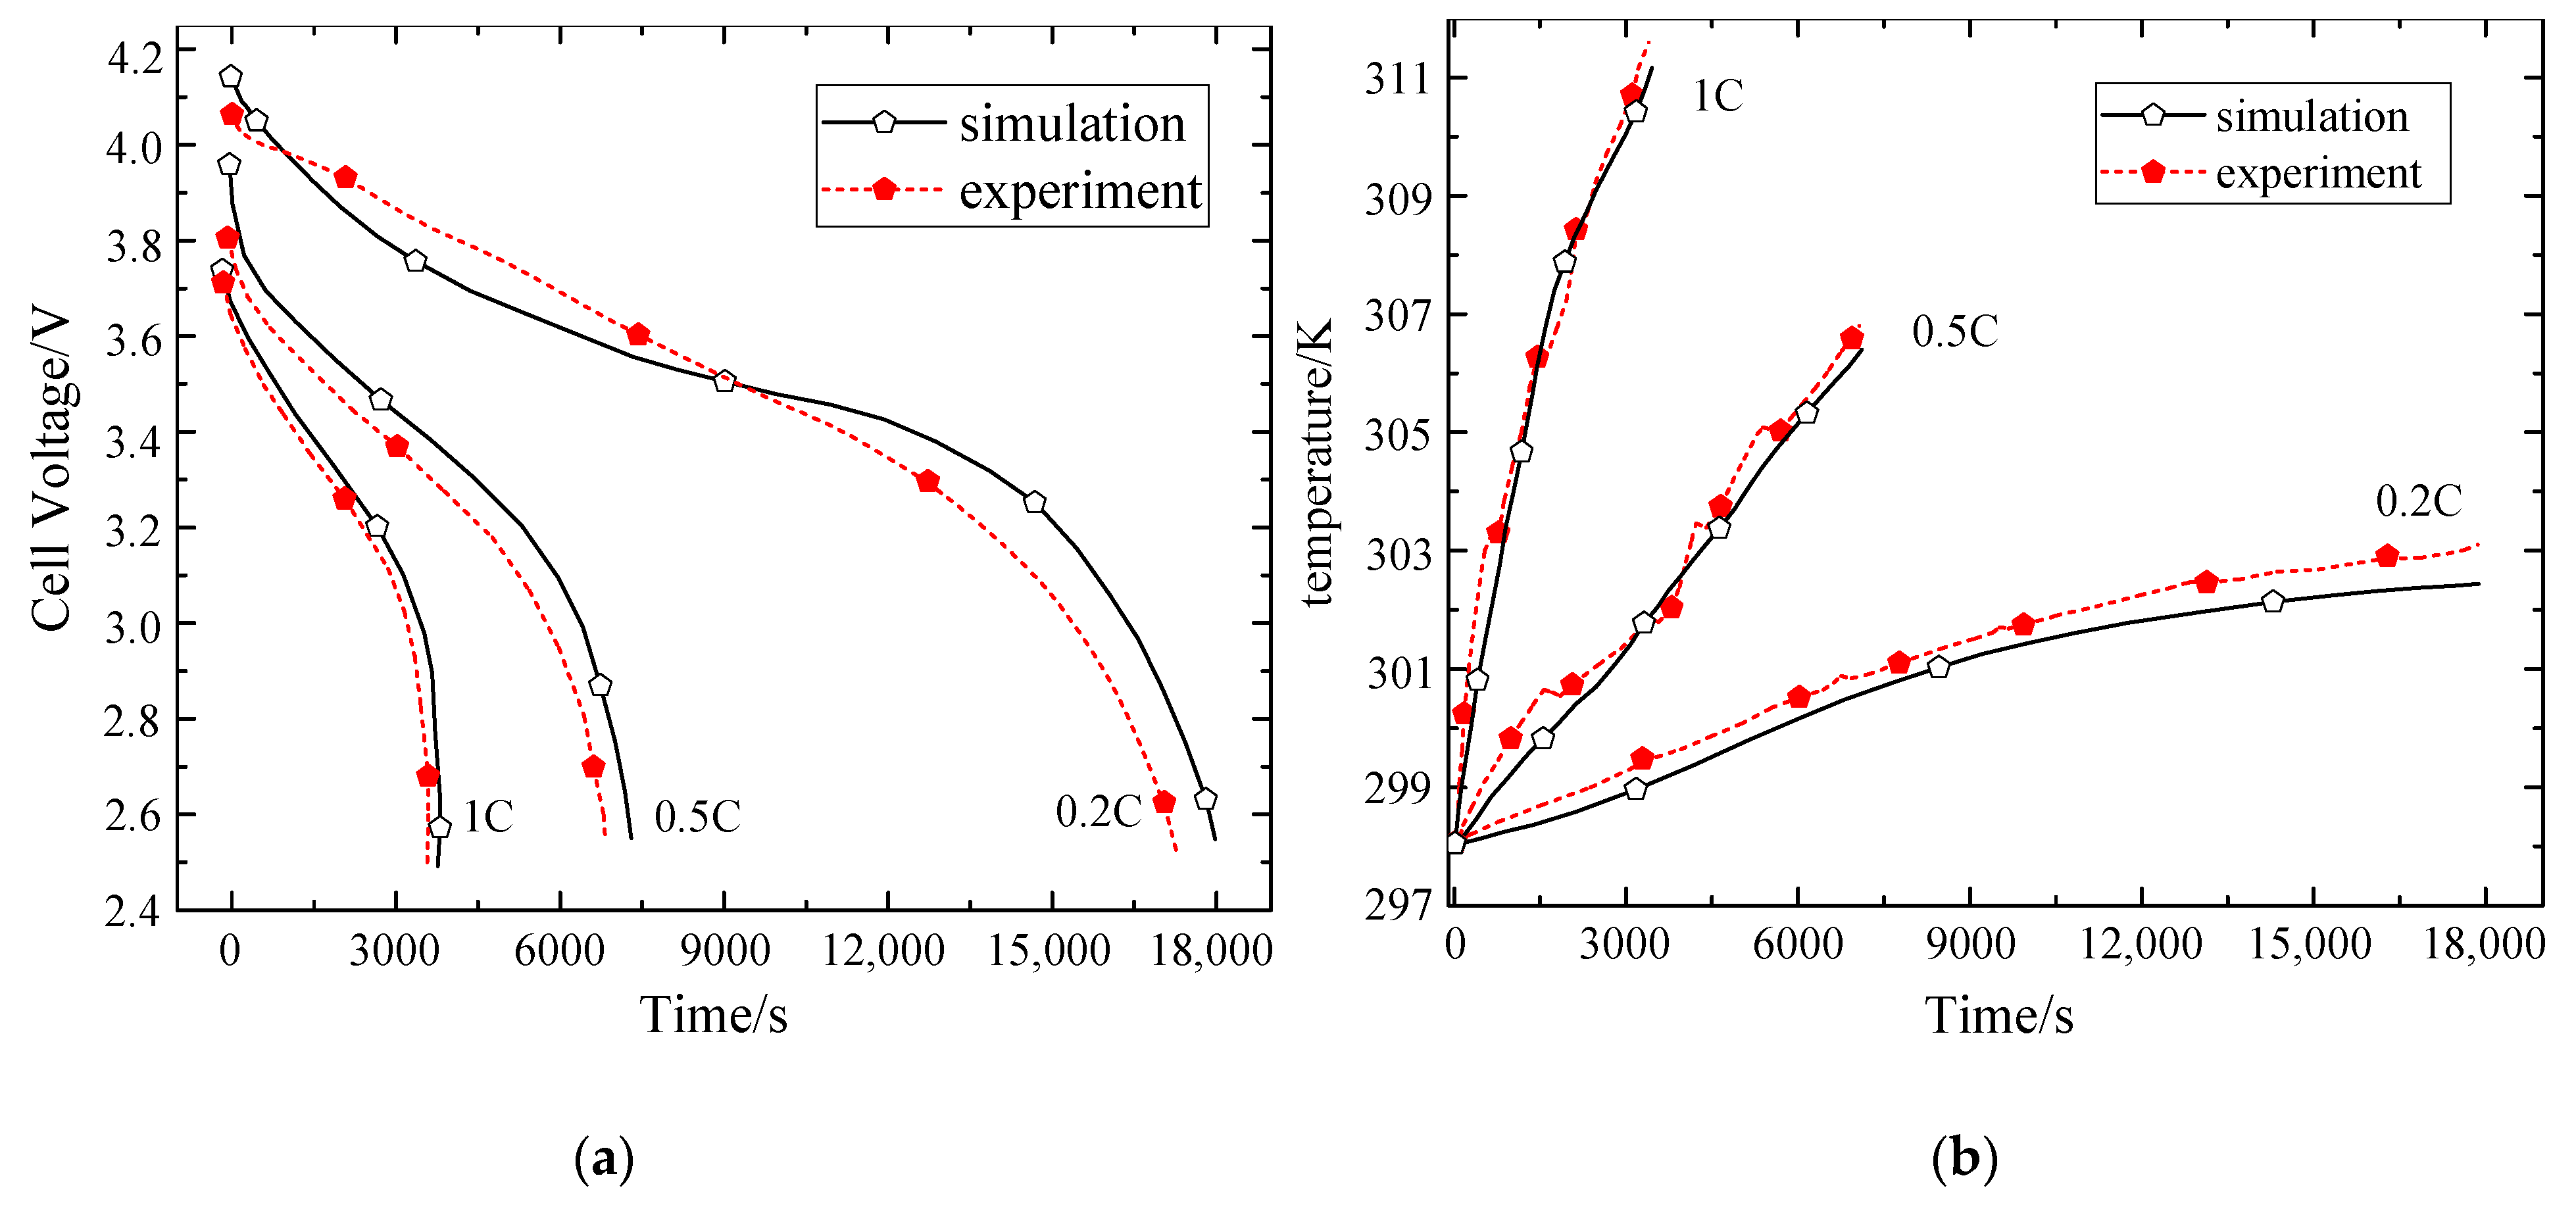
3. Model Parameters and Validation

3.1. Experimental Scheme

In order to verify the accuracy of the electrochemical thermal coupling model, a single-cell experiment scheme was designed. This experiment can measure the voltage curve and surface temperature curve at different discharge rates.
The present experiment considers the 18650-type lithium-ion battery as the research object. The cell radius is 9 mm, the height is 65 mm, the battery connector is copper, the radius is 3 mm, and the height is 3 mm. The nominal voltage is 3.7 V, the maximum cut-off voltage is 4.2 V, and the total capacity is 3350 mAh.
The experimental principle is as shown in Figure 2: according to the final required data of the experiment, the charge–discharge equipment is required to control the constant current charge–discharge ratio of the single battery in the experiment. During the charge–discharge process of the battery, the voltage and current collection devices can be used to transmit the signal to the single-chip microcomputer, while the temperature change in each key point needs an independent channel. The temperature sensor is used to collect the temperature signal and transmit it to the single-chip microcomputer, after the control program calculation transmits the data to the computer through the communication module (the device is connected with the computer) to read and store.
According to the above principle, the battery test equipment is purchased, mainly including the 8-channel battery tester, which is connected with the computer, and the battery tester driver is installed on the computer. There is a special 18650 battery-fixing device in the tester. After the single battery is installed in the corresponding card position, the constant current discharge condition of the battery at different times can be controlled. The real-time voltage and capacity data of the battery during the discharge process can be directly stored and read on the computer. All data in the experiment can be read and stored every second.
During the constant current discharge, the discharge current is set to 0.2C, 0.5C, and 1C, respectively, and the discharge process is cut off when the voltage of the single cell is 2.5 V. During the whole process, the battery tester and temperature test equipment are used to collect the data on voltage, battery surface temperature, and so on.

3.2. Parameters Determination of Electrochemical Thermal Coupling Model

According to relevant references [37,38,39], the values of relevant parameters in the electrochemical thermal coupling model are shown in Table 1. The outer wall of the cell is in contact with the outside air, the outside temperature is 25 °C, and the discharge rate is set to 0.2C, 0.5C, and 1C, respectively. Then, the control equation is solved to obtain the discharge curve and the average surface temperature curve of the battery. Compare the experimental results with the simulation results, as shown in Figure 3. It can be seen from the figure that the experimental curves are basically consistent with the simulation curves. Figure 3a shows the variation curve of the battery voltage with discharge time, and Figure 3b shows the relationship between the battery surface temperature and discharge time. The numerical values of the experimental curve and simulation curve in the two figures are relatively close. Although the experimental discharge time in Figure 3a is slightly shorter than the simulation time, the experimental voltage is also slightly smaller than the simulation voltage at the same time, which is caused by certain loss and capacity reduction in the battery after using for a period of time. The maximum temperature difference in Figure 3b occurs at the end of 0.2C discharge. Where the experimental temperature is 303.1 K, the simulation temperature is 302.4 K, and the difference is 0.7 K, the maximum error between the simulation results and the experimental results is 0.2%, which is within the acceptable range, and the model is reliable.

4. Results and Discussions of the Power Battery Pack Thermal Characteristics

In order to study the influence of the position, number, angle, and size of the air inlet and outlet on the heat dissipation of the battery pack, based on the electrochemical thermodynamic coupling model, the effects of different air inlets and outlets on the thermal characteristics of the battery pack are analyzed.

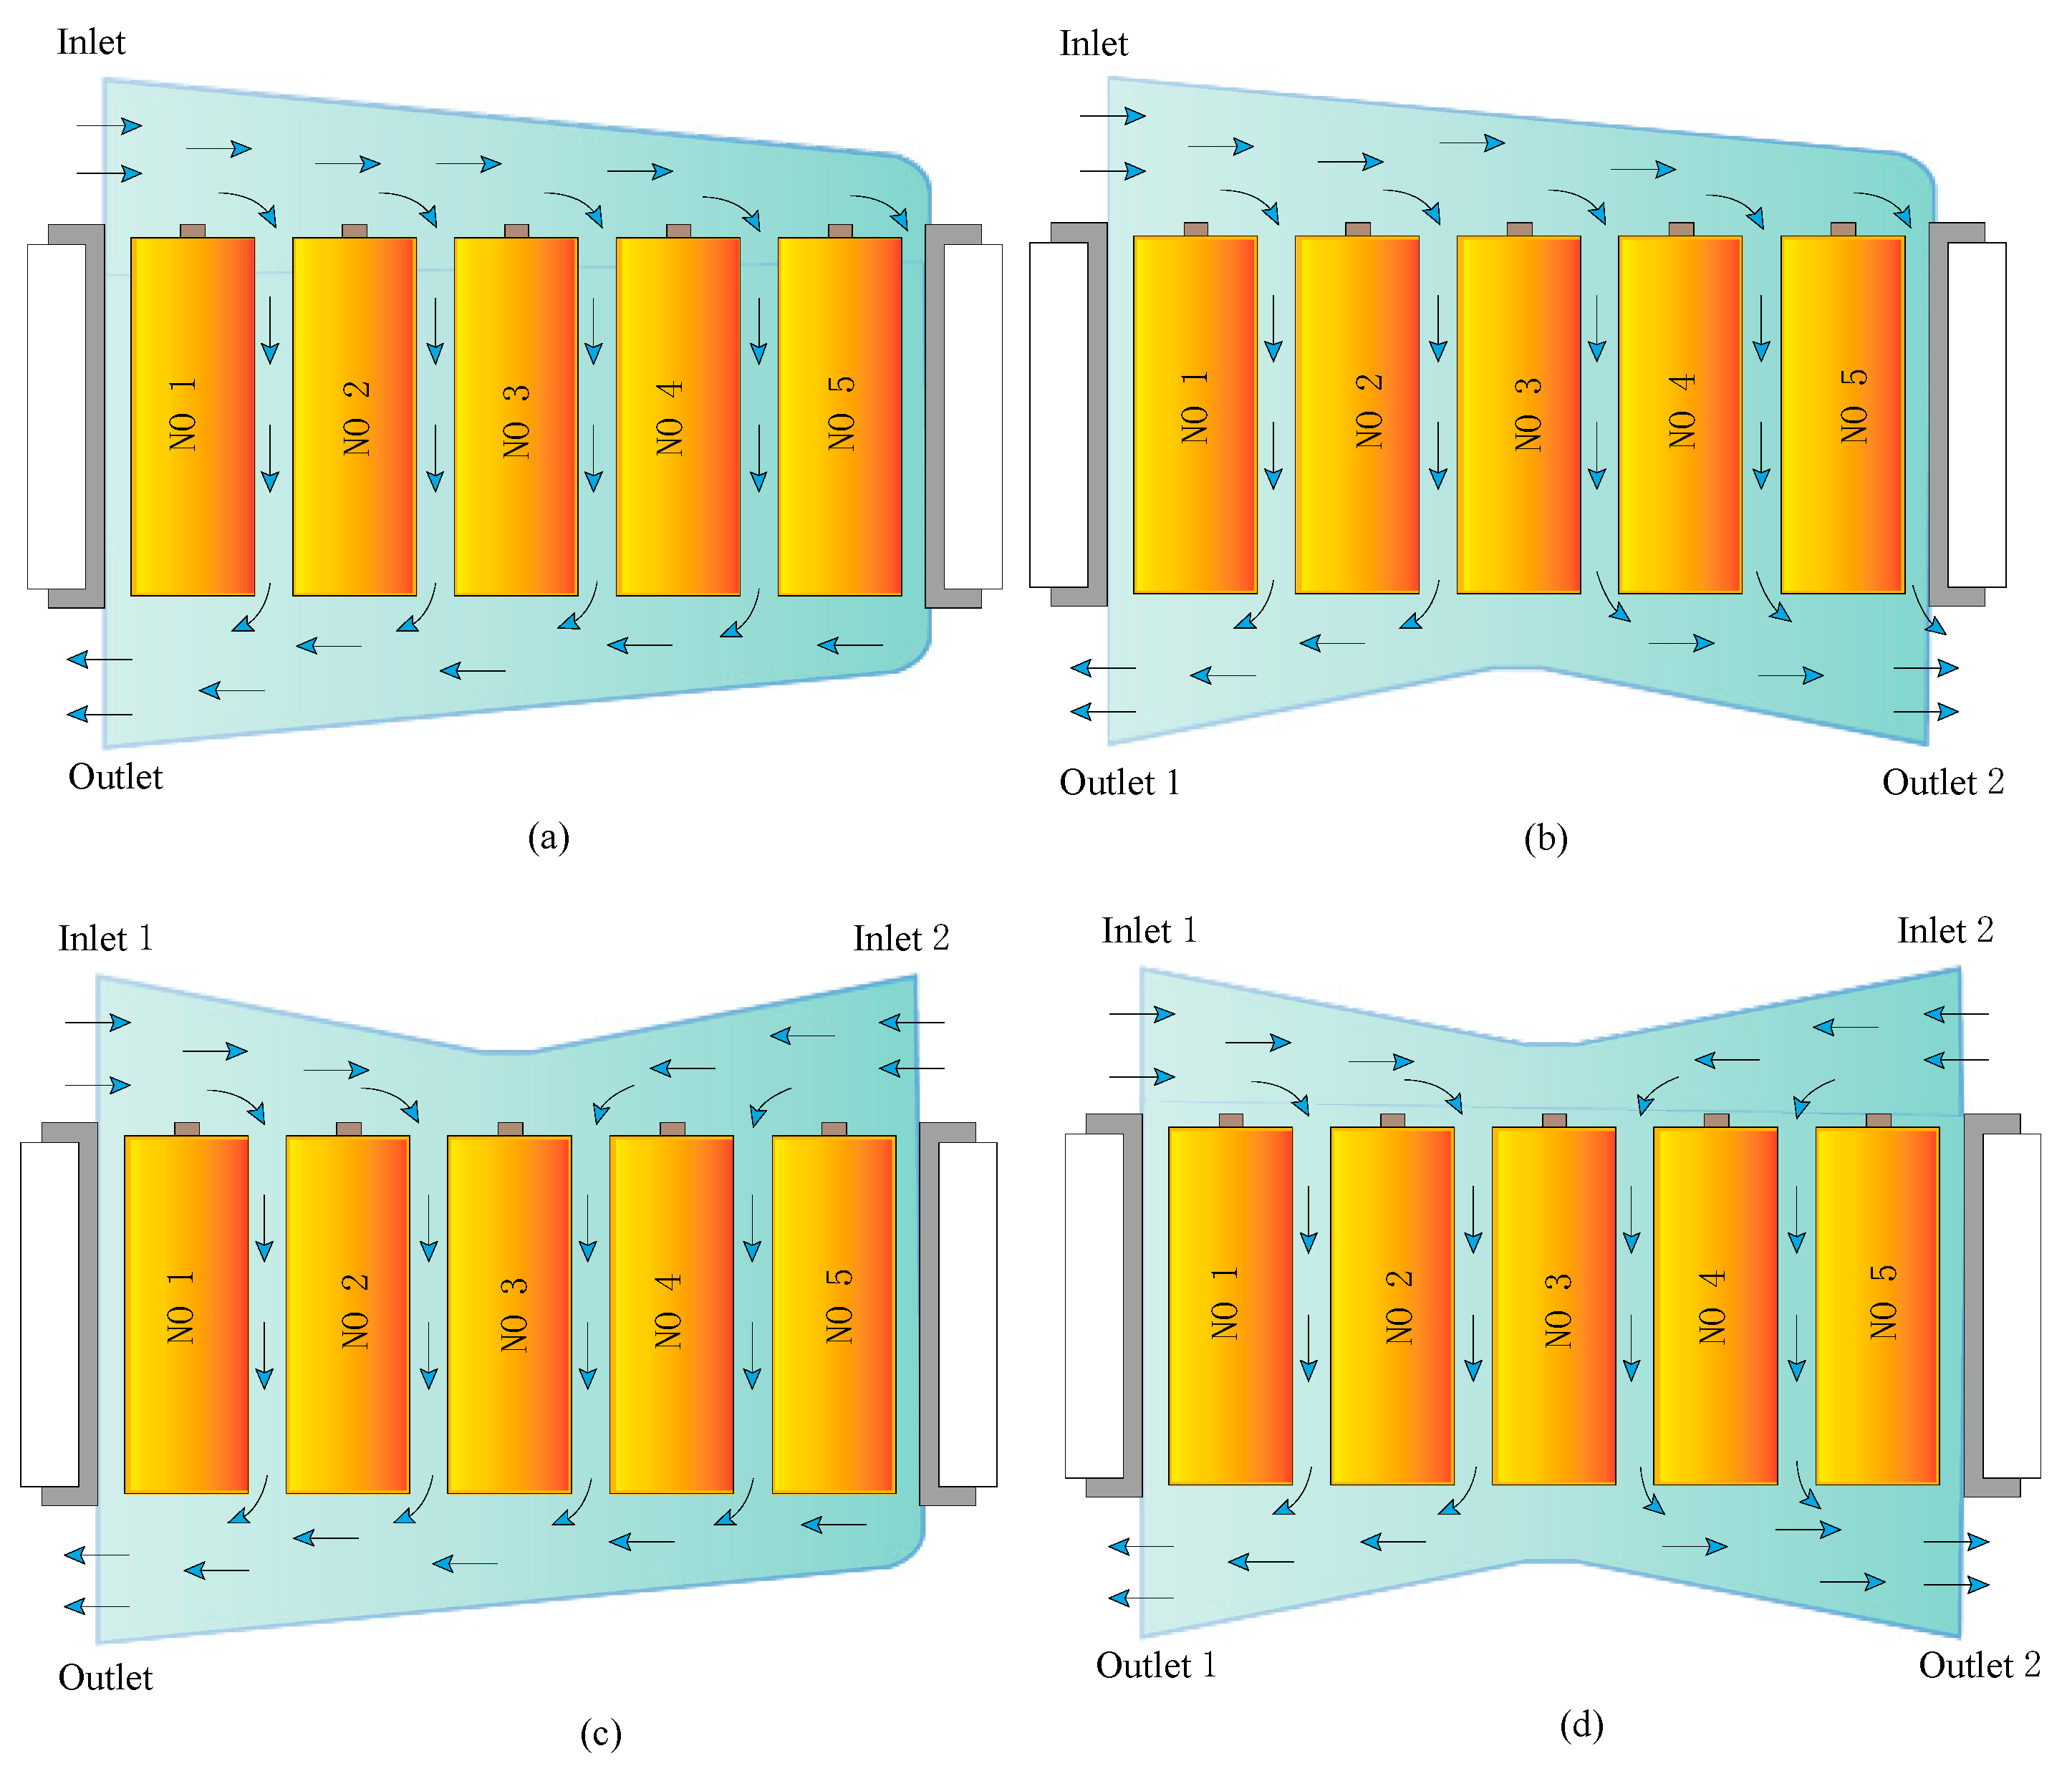
4.1. Structure Scheme of Ventilation and Heat Dissipation for Battery Pack

The structural diagram of the air cooling system of the battery pack is shown in Figure 4. It is composed of thirty single batteries, with six single batteries in each row, and five rows in total. The air inlet is on the left side of the upper end of the battery pack, and the air outlet is on the right side of the lower end. The air enters from the air inlet, flows through the gap between the battery cells of the battery pack, and flows out from the air outlet. |It takes the heat generated by the battery, and dissipates it from the battery pack. The angle between the top and bottom collecting plates of the cooling system and the horizontal plane is α, and the height of the collecting plate at the air inlet and outlet is H.
In order to study the influence of the collector height and tilt angle on the heat dissipation characteristics of the battery pack, five sizes of collector heights and four tilt angles are proposed in this paper, they are H = 12   mm , 13   mm , 14   mm , 15   mm , 16   mm and α = 0 ° , 2 ° , 4 ° , 6 ° . These schemes are analyzed in stages. Firstly, heat dissipation characteristics of the battery pack are analyzed when the height of the collecting plate is 15 mm and the tilt angles are α = 0 ° , 2 ° , 4 ° , 6 ° . The battery charge–discharge ratio is set to 5C, after discharging for 300 s, charging for 300 s, and then cycling for 1500 s to stop charging–discharging. The external environment temperature is 25 °C, and the air inlet flow rate is 0.5 m/s.

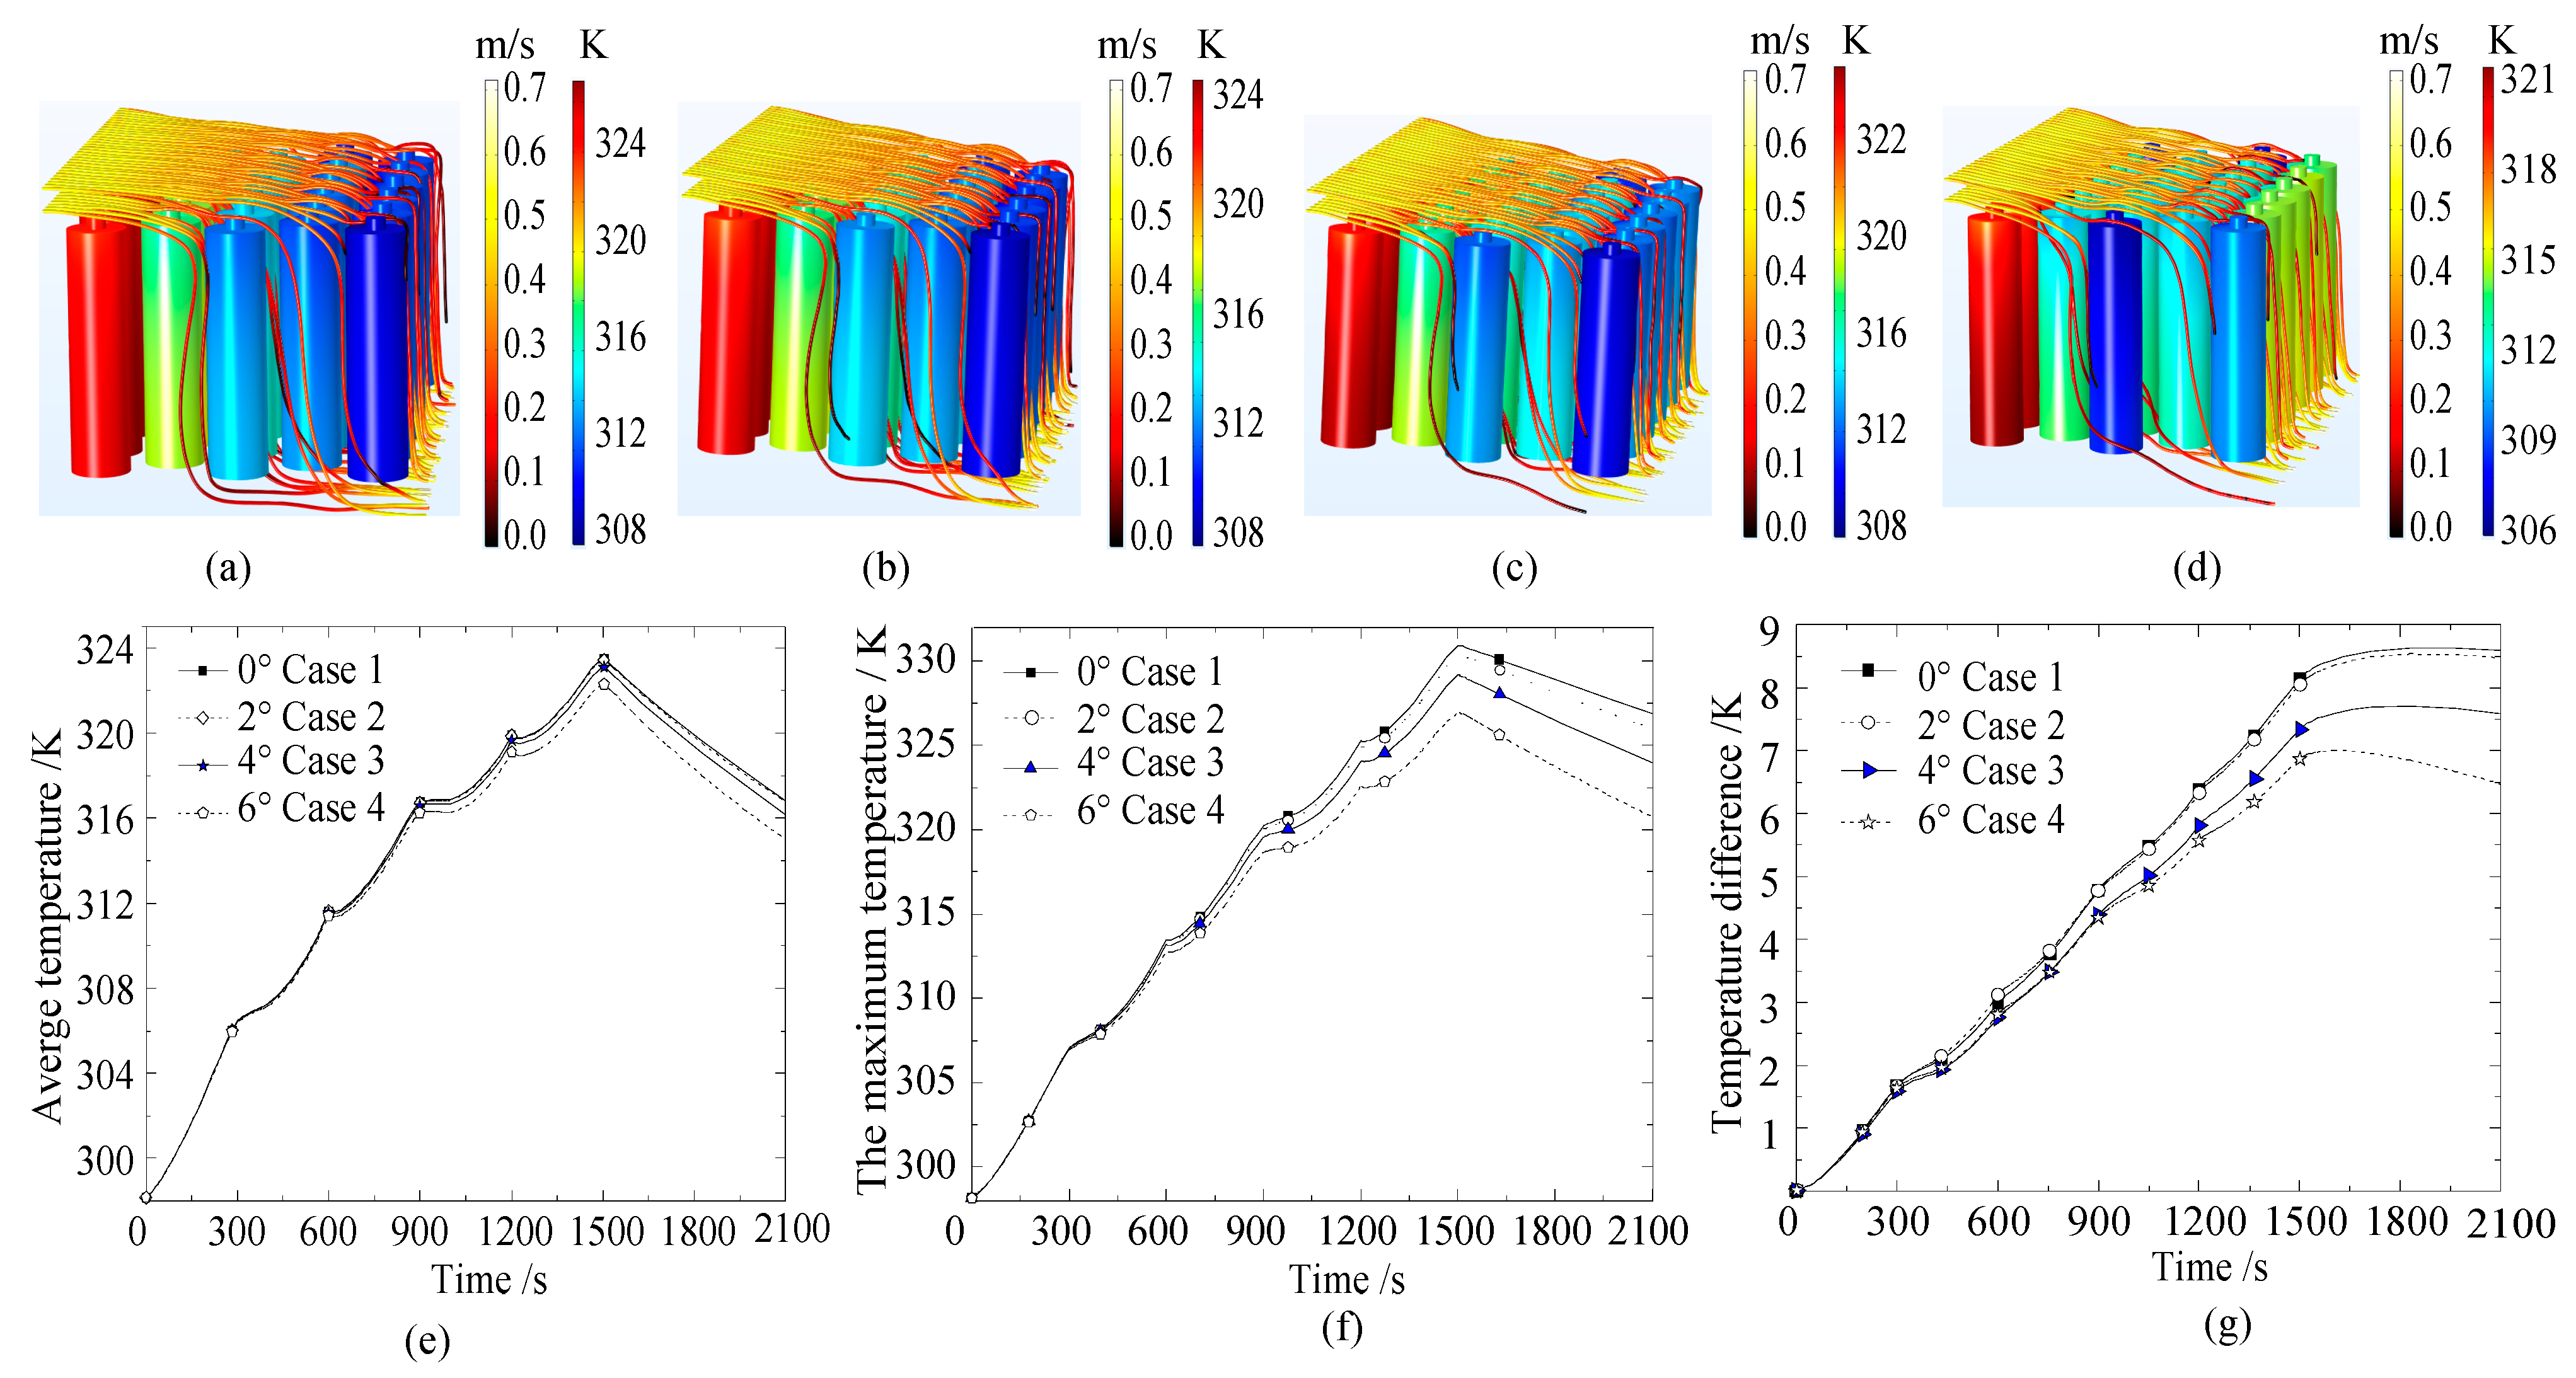
4.2. The Influence of the Angle between the Collecting Plate and the Horizontal Plane on the Heat Dissipation Characteristics

Figure 5a–d is a cloud chart of air streamline change and battery temperature change when the height of the collecting plate is 15 mm and its angle with the horizontal is α = 0 ° , 2 ° , 4 ° , 6 ° respectively. It can be seen from Figure 5a–d that the battery temperature near the air inlet is the highest, from left to right, the battery temperature gradually decreases, and the battery temperature near the air outlet is the lowest.
This phenomenon is mainly caused by the direction of airflow. It can be seen from the airflow line that, due to the inclined arrangement of the collecting plate, the airflow changes the flow direction with the change in the tilt angle, and there is less air flowing vertically downward near the left air inlet, which leads to poor heat dissipation of the battery; while the airflow near the right position flows smoothly into the battery gap, which enables the right battery to achieve better heat dissipation.
In addition, the change in battery temperature is related to the tilt angle of the collector plate. In the four schemes, when the tilt angle is 0°, the maximum temperature exceeds 326 K. With the increase in the tilt angle, the temperature in the battery pack gradually decreases, and the gradient of the battery color change gradually decreases.
Figure 5e–g show the relationship between the average temperature, maximum temperature, and temperature difference of the battery pack with time. It shows that, these three parameters gradually increase with the extension of the charging and discharging time, and by the end of charging and discharging, the average temperature, maximum temperature, and temperature difference have reached their maximum values. It can be seen from Figure 5e that the average temperature of the battery pack is larger when the angle of the collector plate is smaller; the larger the angle, the lower the average temperature, so the average temperature decreases with the increase in the angle of the collector plate. At the same time, according to the curve trend, when the angle is too small ( α 2 ° ), the average temperature difference of the battery pack is not obvious. At 1500 s, when α = 0 ° , the average temperature is 323.52 K; when α = 2 ° , the average temperature is 323.47 K. When α 2 ° , the relationship between the slope angle of the collector plate and the average temperature is obvious. The average temperatures at and were 323.1 K and 321.3 K, respectively.
Figure 5f shows the relationship between the maximum temperature and time under different schemes. The basic trend of change in this figure is similar to Figure 5e, that is, the maximum temperature of the battery pack decreases gradually with the increasing angle of the collector plate. Different from the average temperature change in Figure 5e, when the tilt angle is small, the difference between the maximum temperature of the battery pack and the angle is still obvious. At 1500 s, when α = 0 ° , 2 ° , 4 ° , 6 ° , the maximum temperature of the battery pack is 330.9 K, 330.4 K, 329.1 K, and 327.0 K, respectively, and the maximum difference is 3.9 K.
Figure 5g shows the relationship between the temperature difference and time under different schemes. Consistent with the above, the temperature difference and angle are inverse functions, and the temperature difference in the battery pack decreases with the increasing angle. The temperature is small, especially when α 2 ° , and the temperature difference is not obvious with the angle change; however, when α 2 ° , the change is obvious.
To sum up, when the height of the air inlet of the collector plate is fixed, the larger the angle between the plate and the horizontal plane, the better the heat dissipation effect of the battery pack. Increasing the inclination angle of the collector plate is an effective way to improve the heat dissipation of the battery pack.

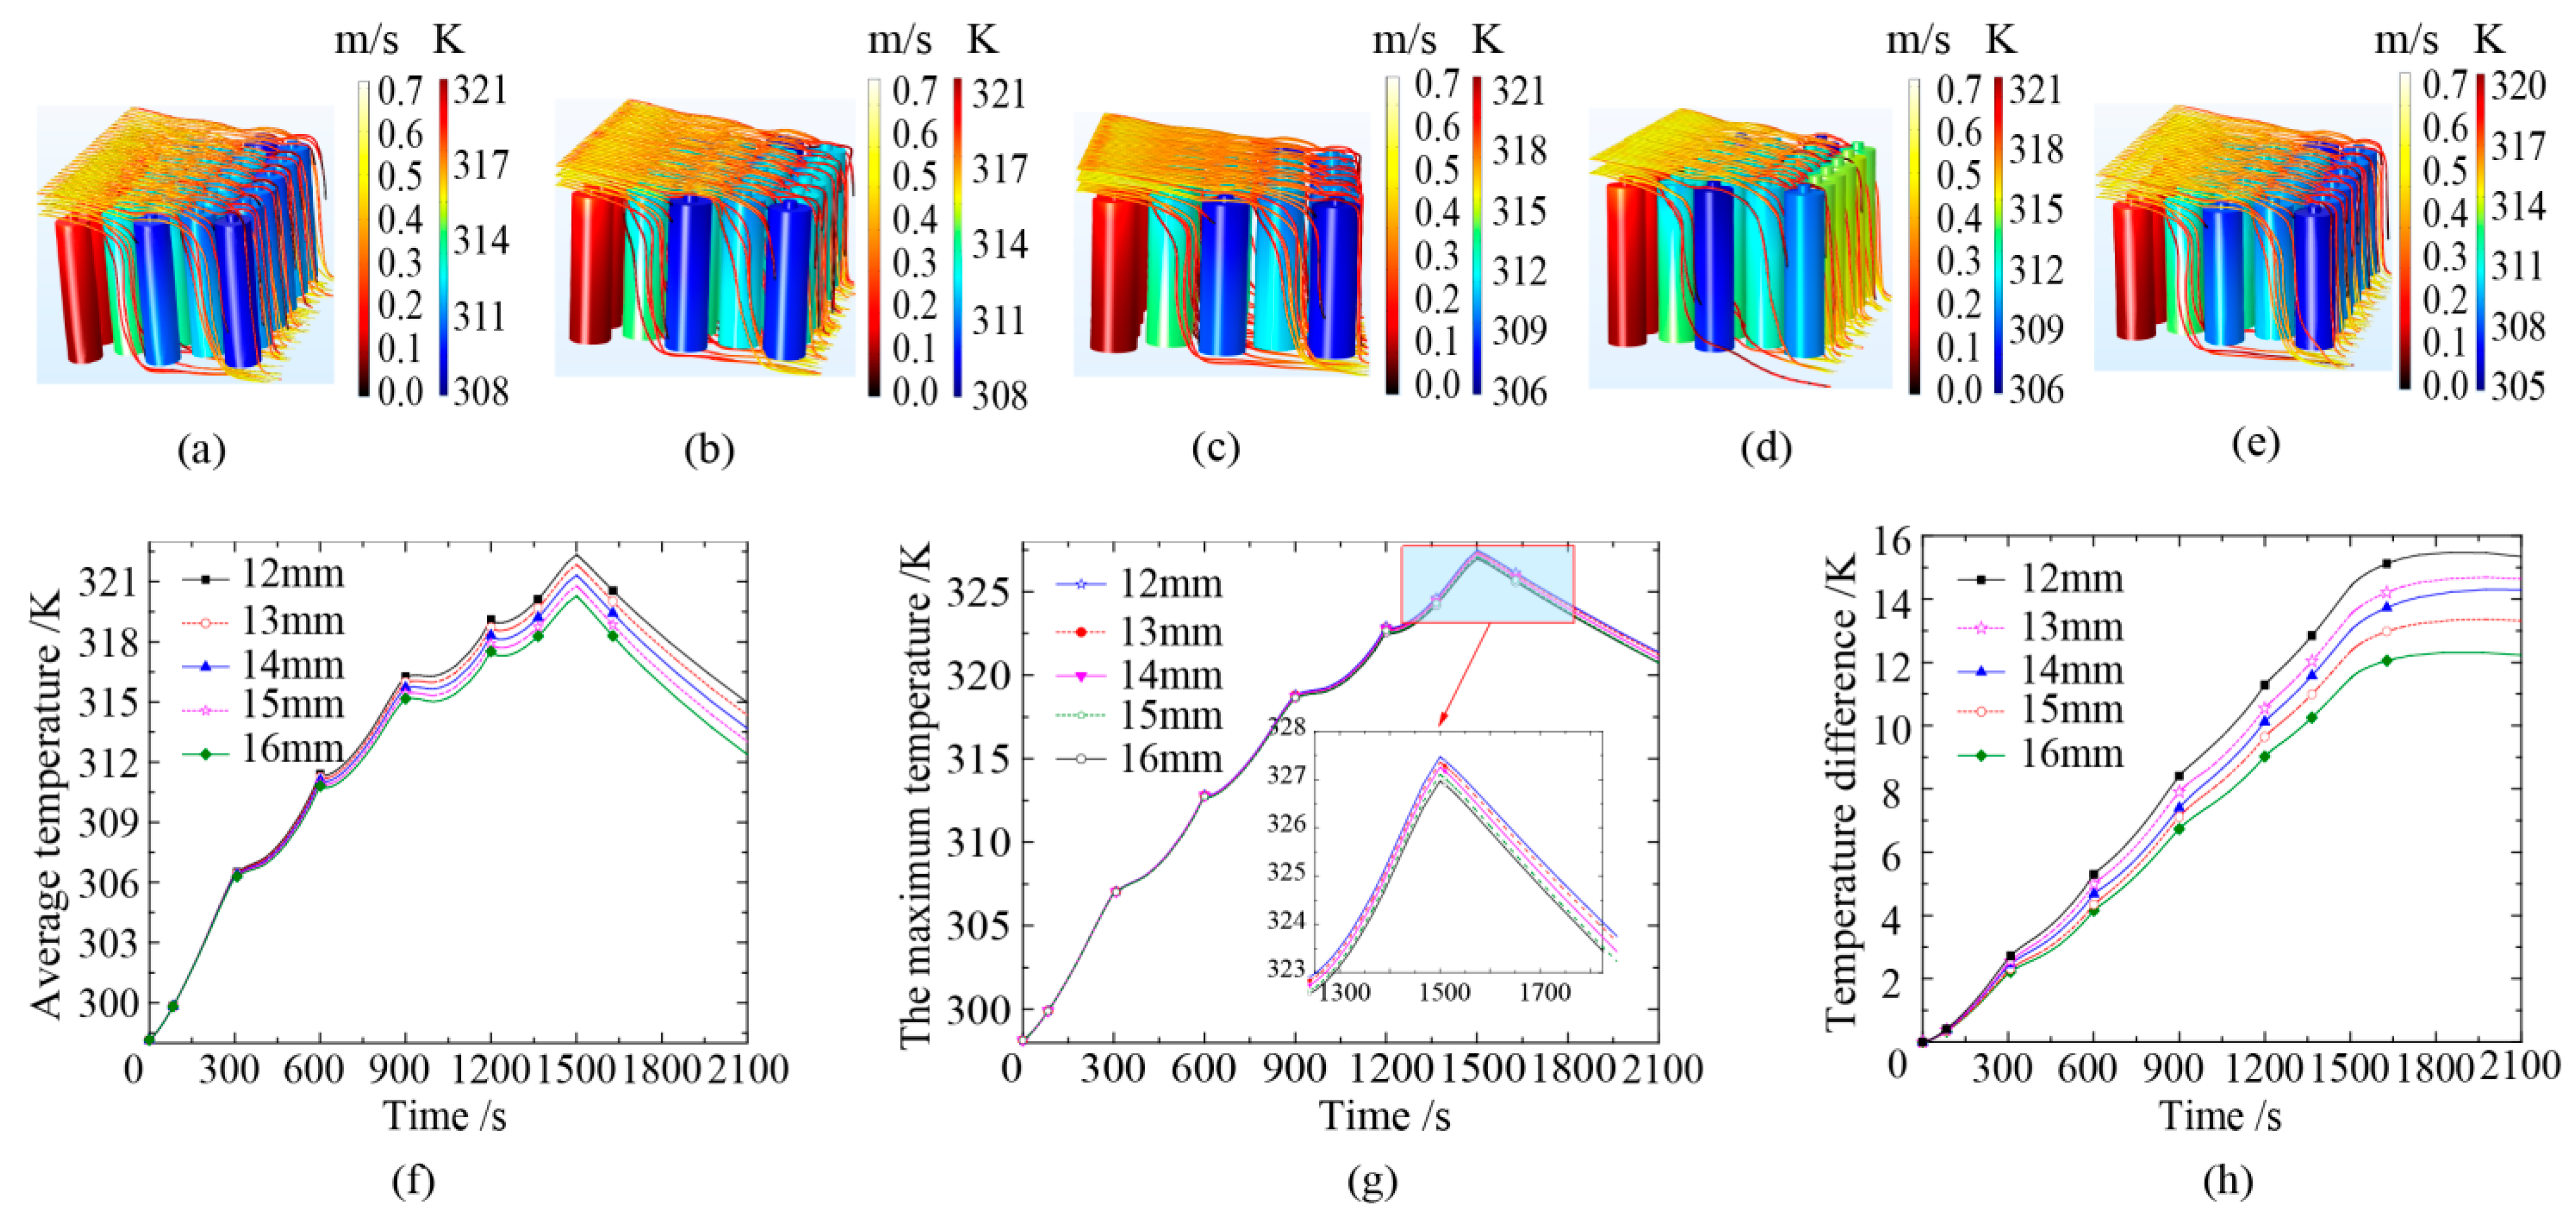
4.3. The Influence of the Height of the Collecting Plate at the Inlet and Outlet on the Heat Dissipation Characteristics

In order to study the influence of the height of the collecting plate at the air inlet and outlet on the heat dissipation characteristics of the battery pack, under H = 12   mm , 13   mm , 14   mm , 15   mm   and   16   mm five different conditions, when α = 6 ° , the change in the heat dissipation characteristics of the battery pack is analyzed. The initial conditions and boundary conditions of the battery pack are the same as those of the previous section. The temperature distribution of the battery, the relationship between the average temperature, the maximum temperature, and the temperature difference with time were studied.
Figure 6a–e shows the air streamline and battery temperature program when the height of the collecting plate at the air inlet and outlet is different. It can be seen in Figure 6a–e that the temperature of the battery changes in gradient, and the temperature gradually decreases from left to right. The upper part of the left side is the air inlet, and the lower part is the air outlet. The small inclination angle of the collecting plate and the battery temperature near the air outlet are relatively low; this is mainly because, when the air flows in from the left side, the air near the air inlet cannot easily flow vertically into the first row of batteries on the left side. This can be analyzed in combination with the air streamline diagram. It can be seen from the diagram that the air streamlines between the batteries near the left side are smaller, while the streamlines between the batteries near the air outlet on the right side are bigger, and the flow velocity is also higher, so the left battery row has poor heat dissipation and the highest temperature, while the right battery row has good heat dissipation and a low temperature. Additionally, the temperature change trend of the five different schemes is similar, so it is difficult to see the effect of different schemes on the heat dissipation of the battery. It is necessary to further analyze the relationship between the average temperature, maximum temperature, and temperature difference of the battery with time.
Figure 6f shows the relationship between the average temperature of the battery and time when the angle of the collector plate is fixed and different height schemes are adopted. It can be seen from the figure that in all schemes, the average temperature of the battery increases with the extension of the charging and discharging time, and the average temperature of the battery reaches the highest at the end of the charging and discharging period. The average temperature of the battery decreases with the increase in the height of the collector plate. As shown in the figure, up to 1500 s, when the height of the collector plate is 12 mm, the maximum average temperature of the battery reaches 322.3 K; when the height is 16 mm, the maximum average temperature of the battery is 320.3 K; that is to say, the maximum average temperature of the battery decreases by 2.1 K when the height increases by 4 mm.
Figure 6g shows the relationship between the maximum temperature of the battery and the time when the collector plate has a certain tilt angle and different height schemes are adopted. It can be seen from the figure that with the increase in the height of the collecting plate at the air inlet and outlet, the maximum temperature of the battery gradually decreases, which shows a decreasing function relationship. However, for every 1 mm height increase, the effect on the maximum temperature increase is not particularly obvious. The highest temperature is 327.5 K when the height is 12 mm, and 327.0 K when the height is 16 mm. That is, when the height difference is 5 mm, the maximum temperature difference is 0.5 K.
Figure 6h shows the relationship between the temperature difference of the battery and time under five different schemes. It can be seen from the figure that the temperature difference of the battery pack changes as an increasing function of time, and the temperature difference increases with time. The temperature difference has an inverse function relationship with the height of the collector plate. The larger the height, the smaller the temperature difference, and the better the temperature distribution uniformity. As shown in the figure, when the collector plate height is 12 mm and 16 mm for 1500 s, the battery temperature difference is 14.4 K and 11.5 K, respectively, with a difference of 2.9 K. Therefore, the height has a great influence on the temperature difference of the battery and the uniformity of its temperature distribution.
To sum up, the height of the collecting plate close to the air inlet and outlet has a certain impact on the heat dissipation characteristics of the battery pack, which will not only affect the change in the maximum temperature of the battery but also have a greater impact on the temperature distribution uniformity of the battery pack, which should be fully considered in the design of the battery pack.

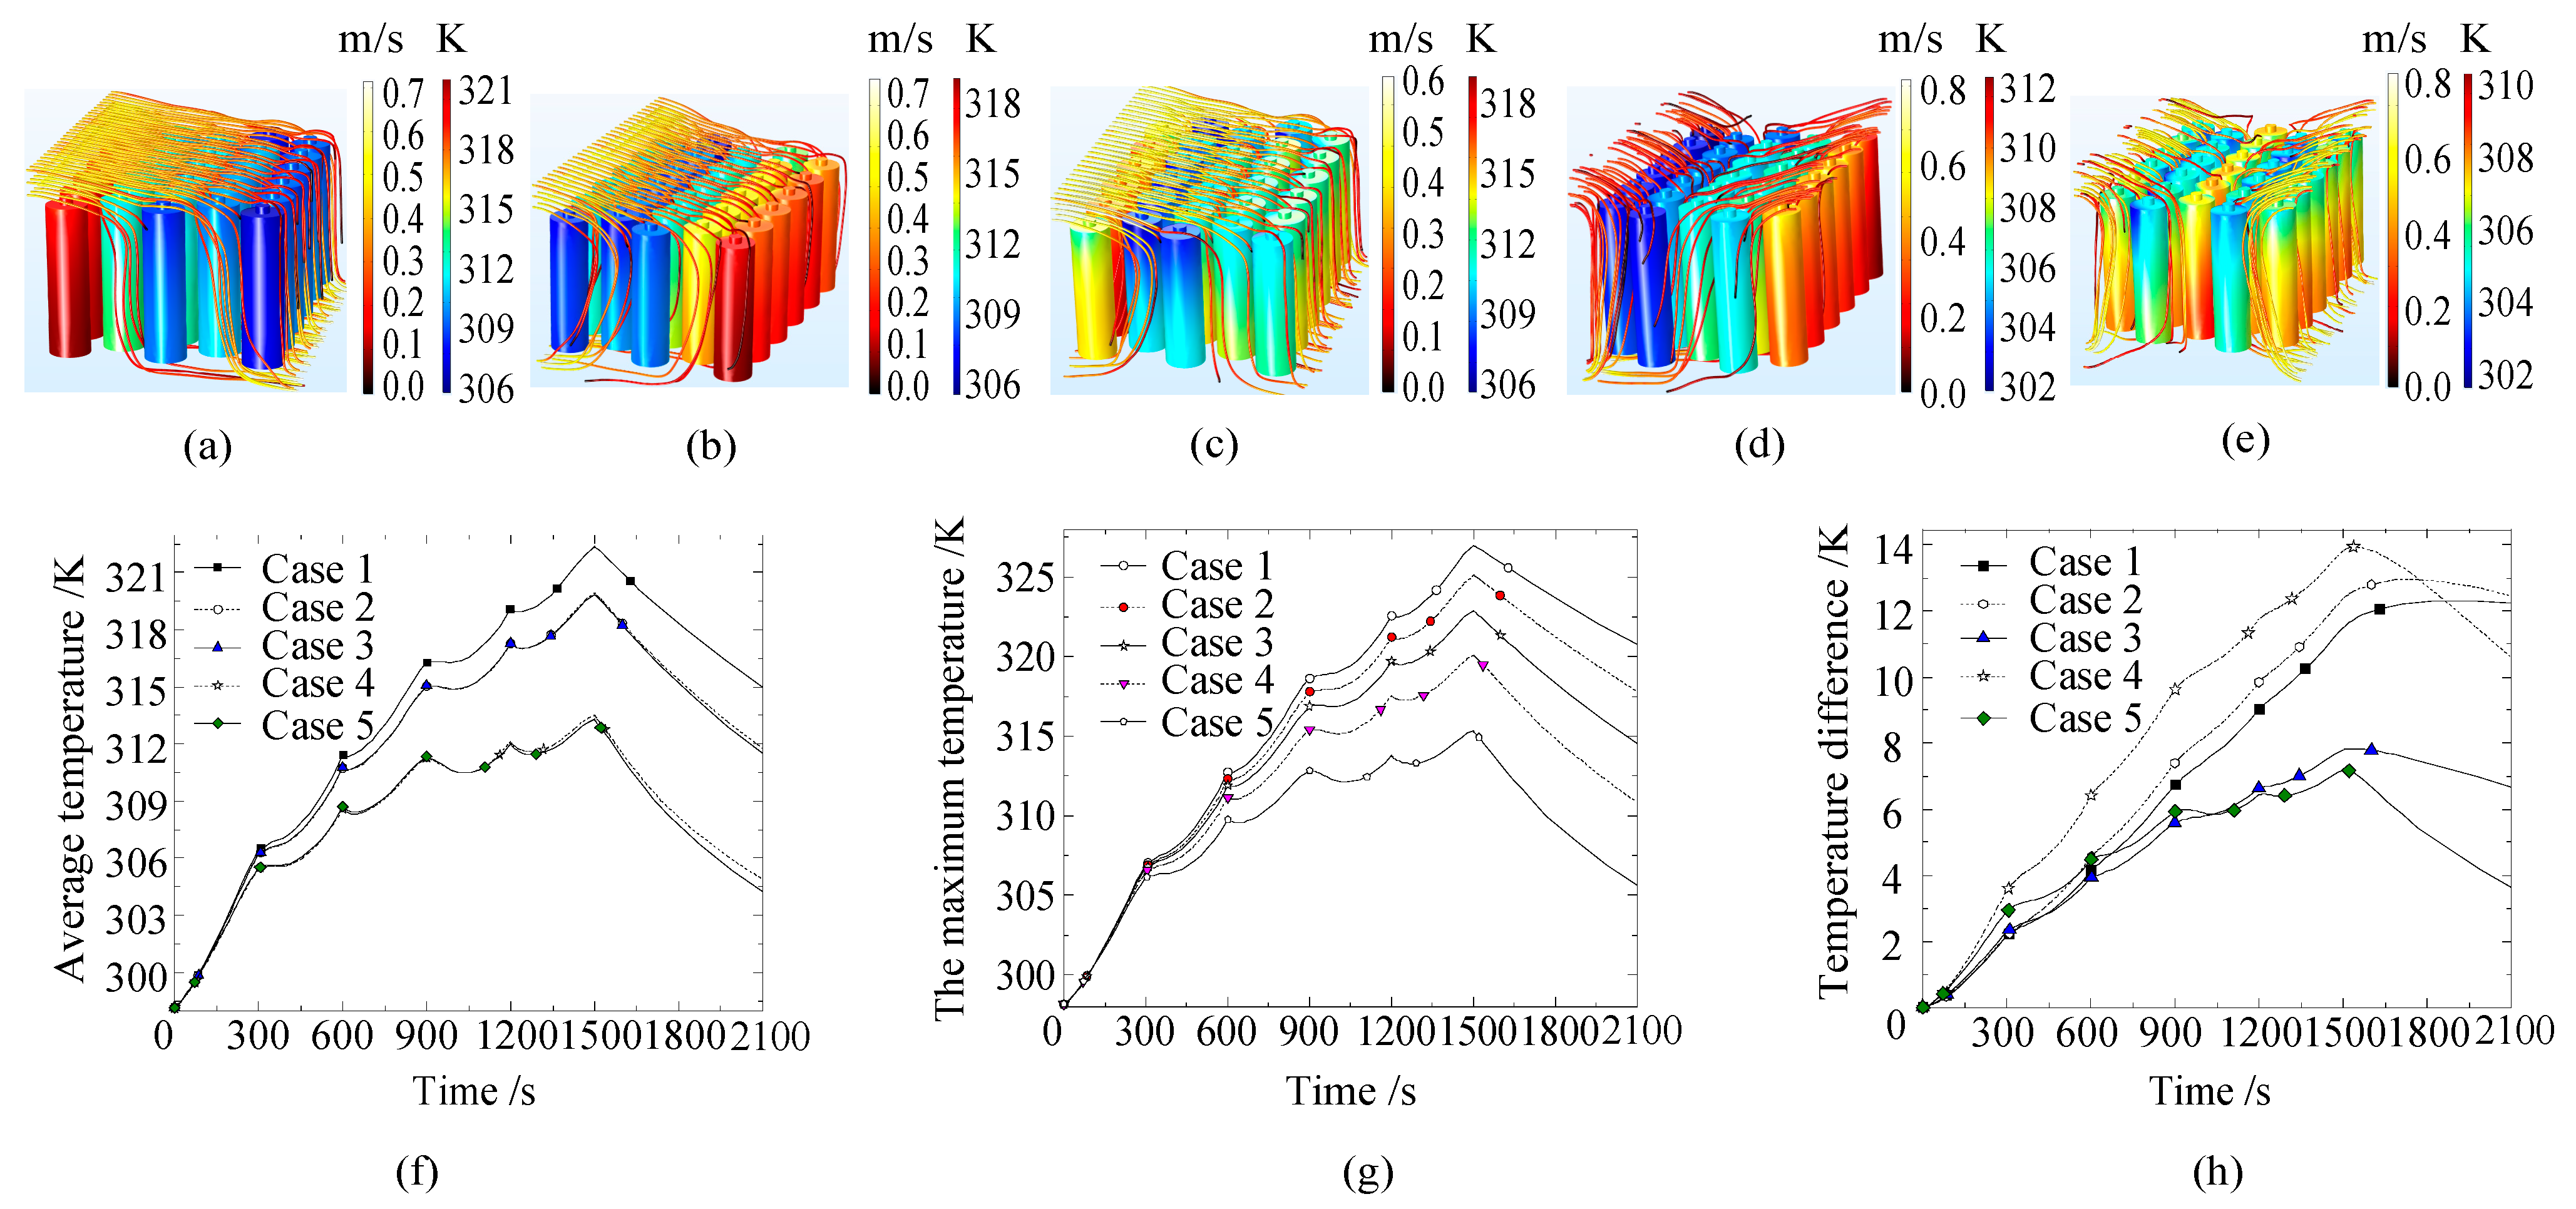
4.4. Influence of Air Inlet and Outlet Setting on Heat Dissipation Characteristics

In order to analyze the influence of the position and number of air inlets and outlets on the heat dissipation of the battery pack. Based on the original one air inlet and one air outlet (case 1), the air inlet and outlet are, respectively, located on both sides. Four other schemes (Figure 7) are designed: one inlet and one outlet with the let on the same side (case 2), one inlet and two outlets (case 3), two inlets and one outlet (case 4), and two inlets and two outlets (case 5).
In the scheme of one inlet and two outlets (case 3), the upper left is the air inlet, and the lower left and lower right are the air outlets; in the scheme of two inlets and one outlet (case 4), the upper left and the upper right are the air inlets, and the lower left is the air outlet; in the scheme of one inlet and one outlet (the same side) (case 2), the upper left is the air inlet, and the lower left is the air outlet; in the scheme of two inlets and two outlets (case 5), the upper left and the upper right are the air inlet, and the lower left and the lower right are the air outlet.
The charging and discharging modes and rates of the battery are the same as those mentioned above. Set the airflow rate of each air inlet at 0.5 m/s and compare the heat dissipation of the battery under five different inlet and outlet schemes.
Figure 8a–e shows the air streamline and battery temperature cloud chart under five different schemes of the air inlets and outlets. Among the five schemes, the temperature gradient of case 1 and case 2 changes greatly, and the color difference is obvious, which shows that the temperature distribution uniformity of the batteries under the two schemes is poor. In the scheme of case 1, the temperature of a row of batteries near the air inlet (left side of the figure) is higher, and the temperature of batteries near the air outlet (right side of the figure) is lower but the temperature distribution in case 2 is just the opposite.
Secondly, when the inlet air velocity is constant, the inflow cross-sectional area is the same, compared with the one inlet, two outlet scheme, the airflow of the case 4 is larger, which can make the battery pack achieve better heat dissipation. As can be seen from Figure 8d, when case 4 is adopted, the maximum temperature of the battery is lower and the temperature gradient is also larger.
The best heat dissipation scheme is case 5. As can be seen from Figure 8e, the color change in the battery surface is relatively gentle. Compared with the other four schemes, the temperature change gradient of the battery is not large, the maximum temperature of the battery is obviously low, and the highest temperature of the battery is lower, which appears in the lower part of the middle row battery.
Figure 8f shows the relationship between the average temperature of the battery pack and time in five different cases. It can be seen from Figure 8f that the average temperature of cases 2 and 3 is relatively close, and the case 4 outlet scheme is relatively close to case 5, although the former is slightly higher than the latter. The order of the average temperature is as follows: T 1 > T 2 T 3 > T 4 T 5 . The five schemes are compared, the average temperature of case 1 is the highest, reaching 322.3 K at 1500 s. The case with the lowest score is case 5, with an average temperature of the battery pack of 312.6 K at 1500 s. The average temperature of the battery pack produced by the two cases, 9.7 K, is quite different. Since the average temperature of case 4 at 1500 s is 313.4 K, cases 4 and 5 are relatively close. When considering the average temperature, both schemes can be selected. However, as there is more than one air outlet in case 5, the structure is more complex and the cost is higher. Therefore, considering the average temperature and structure, case 4 can be selected preferentially.
Figure 8g shows the relationship between the maximum temperature of the battery pack and time under five schemes. It can be seen from the figure that different air inlet and outlet settings have a greater impact on the maximum temperature of the battery pack. The maximum temperature of the one-in one-out (opposite side) battery pack in scheme 1 (Figure 4) can reach 327.0 K at 1500 s, while in case 5, the maximum temperature of the two-inlet and two-outlet battery pack is about 314.6 K. The maximum temperature difference between the two schemes is large, reaching 12.4 K.
The highest temperature order of the five schemes is as follows: T max 1 > T max 2 > T max 3 > T max 4 > T max 5 , whereby case 1 has the highest temperature, case 2 is second, and case 5 has the lowest temperature.
Figure 8h shows the relationship between the temperature difference of the battery pack and time under five schemes. According to the results in the figure, in the process of charging and discharging, the temperature difference in the battery group increases gradually with the increase in time. In addition, the temperature difference varies with different air inlet and outlet schemes. By the end of charging and discharging, case 4 has the highest temperature difference, reaching 13.6 K; case 2 has a temperature difference of 12.4 K; and case 5 has the lowest temperature difference, reaching 6.9 K. The difference between the maximum temperature difference and the minimum temperature difference is 6.8 K. Therefore, in terms of temperature distribution uniformity, case 5 has the smallest temperature difference and the best temperature distribution uniformity.
Through the comparison of five different schemes, from the average temperature to the maximum temperature to the uniform temperature distribution, case 5 has the best heat dissipation effect on the battery pack, which means that the more air inlets and outlets, the better the heat dissipation of the battery pack, but the more complex the structure.

5. Conclusions

In order to analyze the influence of inlet and outlet parameters on battery heat dissipation, an electrochemical thermodynamic coupling model of an 18,650 lithium-ion battery was established and simulated, and the conclusions are as follows:
1. In this paper, the electrochemical thermodynamic coupling model of an 18,650 lithium-ion battery is established. When the battery operates at different discharge rates, the simulated voltage and surface temperature curves are in good agreement with the experimental data. The maximum temperature difference is 0.7 K, which is 0.23% different from the experimental data. The model is accurate.
2. For the cross-arrangement scheme, the parallel forced ventilation cooling method is used to cool the battery pack. Four different tilt angles and five different heights are set, respectively, and the heat dissipation of the battery pack under different schemes is analyzed. It mainly analyzes the air flow, the temperature cloud diagram of the battery pack, the relationship between the average temperature, the maximum temperature, and the temperature difference of the battery pack with time. According to the analysis, the larger the inclined angle of the collector plate, the smaller the average temperature and the maximum temperature of the battery. Therefore, the increase in the inclined angle of the collector plate is beneficial to the heat dissipation of the battery pack. At the same time, the smaller the temperature difference is, the better the temperature distribution uniformity of the battery pack will be.
3. In order to analyze the influence of the number and location of the air inlet and outlet on the heat dissipation of the battery pack, five different schemes are designed for analysis. The five schemes are as follows: one inlet, one outlet (opposite side), one inlet, one outlet (same side), one inlet, two outlets, two inlets, one outlet, and two inlets, two outlets. The results show that the more air inlets, the better the heat dissipation of the battery pack, and the more uniform the air inlets, the more uniform the temperature distribution of the battery pack. However, the increase in vent will also lead to a more complex structure of the battery pack; the higher the cost, the greater the quality.

Author Contributions

Conceptualization, Y.W. and H.D.; methodology, H.D.; software, H.D.; validation, H.D.; formal analysis, H.D.; investigation, H.D.; resources, H.D.; data curation, H.D.; writing—original draft preparation, H.D.; writing—review and editing, H.D.; visualization, H.D.; supervision, H.D.; project administration, H.D.; funding acquisition, H.D. All authors have read and agreed to the published version of the manuscript.

Funding

We received funding from the natural science foundation project of the Guangdong province (Grant No. 2114050001056).

Data Availability Statement

The data that support the findings of this study are available from the corresponding author upon reasonable request. E-mail: daihy@gcu.edu.cn.

Conflicts of Interest

The authors declare no conflict of interest.

References

  1. Sarchami, A.; Najafi, M.; Imam, A.; Houshfar, E. Experimental study of thermal management system for cylindrical Li-ion battery pack based on nanofluid cooling and copper sheath. Int. J. Therm. Sci. 2022, 171, 107244. [Google Scholar] [CrossRef]
  2. Qaderi, A.; Veysi, F. Investigation of a water-NEPCM cooling thermal management system for cylindrical 18650 Li-ion batteries. Energy 2022, 244, 122570. [Google Scholar] [CrossRef]
  3. Rui, Z.; Bin, D.; Zhang, C.H.; Gong, S.Z. Accurate lithium-ion battery modeling with inverse repeat binary sequence for electric vehicle applications. Appl. Energy 2019, 251, 113–139. [Google Scholar]
  4. Dinesh, K.S.; Aneesh, P. A review on air cooled and air centric hybrid thermal management techniques for Li-ion battery packs in electric vehicles. J. Energy Storage 2021, 41, 102885. [Google Scholar]
  5. Zhou, H.B.; Fei, Z.; Xu, L.P.; Kong, J.Z.; Qing, X.Y. Thermal performance of cylindrical Lithium-ion battery thermal management system based on air distribution pipe. Int. J. Heat Mass Transf. 2019, 131, 984–998. [Google Scholar] [CrossRef]
  6. Zhao, L.; Yu, X.L.; Wei, L.C.; Qiu, Y.L.; Zhang, L.Y.; Meng, X.Z.; Jin, L.W. Parametric study of forced air cooling strategy for lithium-ion battery pack with staggered arrangement. Appl. Therm. Eng. 2018, 136, 28–40. [Google Scholar]
  7. Wang, Y.J.; Zhu, D.W. Performance analysis of a novel thermal management system with composite phase change material for a lithium-ion battery pack. Energy 2018, 156, 154–168. [Google Scholar] [CrossRef]
  8. Park, S.; Jang, D.S.; Li, D.S.; Seong, H.H.; Kim, Y. Simulation on cooling performance characteristics of a refrigerant-cooled active thermal management system for Lithium ion batteries. Int. J. Heat Mass Transf. 2019, 135, 131–141. [Google Scholar] [CrossRef]
  9. Schimpe, M.; Naumann, M.; Truong, N.; Holger, C.H.; Santhanagopalan, S.; Aron, S.; Jossen, A. Energy efficiency evaluation of a stationary lithium-ion battery container storage system via electro-thermal modeling and detailed component analysis. Appl. Energy 2018, 210, 211–229. [Google Scholar] [CrossRef]
  10. Bao, Y.; Fan, Y.Q.; Chu, Y.Y.; Chen, L.; Tan, X.J.; Yang, S. Experimental and numerical study on thermal and energy management of a Fast-Charging Lithium-Ion battery pack with air cooling. J. Energy Eng. 2020, 145, 04019030. [Google Scholar] [CrossRef]
  11. Mousavi, M.; Hoque, S.; Rahnamayan, S.; Dincer, I.; Naterer, G.F. Optimal design of an Air-Cooling system for a Li-Ion battery pack in electric vehicles with a genetic algorithm. In Proceedings of the 2011 IEEE Congress of Evolutionary Computation (CEC), New Orleans, LA, USA, 5–8 June 2011; pp. 1848–1855. [Google Scholar]
  12. Mahamud, R.; Park, C. Reciprocating air flow for Li-ion battery thermal management to improve temperature uniformity. J. Power Sources 2011, 196, 569–5685. [Google Scholar] [CrossRef]
  13. Wang, F.X.; Cao, J.H.; Ling, Z.Y.; Zheng, G.Z.; Fang, X.M. Experimental and simulative investigations on a phase change material nano- emulsion-based liquid cooling thermal management system for a lithium-ion battery pack. Energy 2020, 207, 118215. [Google Scholar] [CrossRef]
  14. Bizhongxia, Y.; Ruihuang, Y.Y.; Zheng, W.W.; Wang, H.W. Thermal analysis and improvements of the power battery pack with liquid cooling for electric vehicles. Energies 2019, 12, 3045. [Google Scholar]
  15. Koyama, R.; Arai, Y.; Yamauchi, Y.; Takeya, S.; Endo, F.; Hotta, A.; Ohmura, R. Thermophysical properties of trimethylolethane (TME) hydrate as phase change material for cooling lithium-ion battery in electric vehicle. J. Power Sources 2019, 427, 70–76. [Google Scholar] [CrossRef]
  16. Liu, F.F.; Lan, F.C.; Chen, J.Q. Dynamic thermal characteristics of heat pipe via segmented thermal resistance model for electric vehicle battery cooling. J. Power Sources 2016, 321, 57–70. [Google Scholar] [CrossRef]
  17. Zhao, R.; Gu, J.J.; Liu, J. An experimental study of heat pipe thermal management system with wet cooling method for Lithium ion batteries. J. Power Sources 2015, 273, 1089–1097. [Google Scholar] [CrossRef]
  18. Alhallaj, S.; Maleki, H.; Hong, J.S.; Selman, J.R. Thermal modeling and design considerations of lithium-ion batteries. J. Power Sources 1999, 83, 1–8. [Google Scholar] [CrossRef]
  19. Kizilel, R.; Sabbah, R.; Selman, J.R. An alternative cooling system to enhance the safety of Li-ion battery packs. J. Power Sources 2009, 194, 1105–1111. [Google Scholar] [CrossRef]
  20. Sabbah, R.; Kizilel, R.; Selman, J.R. Active (air-cooled) vs. passive (phase change material) thermal management of high power lithium-ion packs: Limitation of temperature rise and uniformity of temperature distribution. J. Power Sources 2008, 182, 630–638. [Google Scholar] [CrossRef]
  21. Watcharakorn, I.; Amornrat, K.; Shuichiro, H. thermal investigation of cell arrangements for cylindrical battery with forced air-cooling strategy. Trans. TSME 2020, 8, 1. [Google Scholar]
  22. Basu, S.; Hariharan, K.S.; Subramanya, M.K.; Song, T.; Sohn, D.K.; Yeo, T. Coupled electrochemical thermal modelling of a novel Li-ion battery pack thermal management system. Appl. Energy 2016, 181, 1–13. [Google Scholar] [CrossRef]
  23. Dylan, C.; Erb, I.E.; Sanjay, E.S. Effects of cell geometry on thermal management in air-cooled battery packs. In Proceedings of the Transportation Electrification Conference and Expo (ITEC), Dearborn, MI, USA, 14–17 June 2015; pp. 1–6. [Google Scholar]
  24. Liao, X.P.; Ma, C.; Peng, X.B.; Garg, A.; Bao, N.S. Temperature distribution optimization of an air-cooling lithium-ion battery pack in electric vehicles based on the response surface method. J. Electrochem. Energy Convers. Storage 2019, 16, 041002. [Google Scholar] [CrossRef]
  25. Liebig, G.; Kirstein, U.; Geißendörfer, S.; Schuldt, F.; Agert, C. The Impact of Environmental Factors on the Thermal Characteristic of a Lithium–ion Battery. Batteries 2020, 6, 3. [Google Scholar] [CrossRef]
  26. Duan, X.T.; Jiang, W.J.; Zou, Y.L.; Lei, W.X.; Ma, Z.S. A coupled electrochemical thermal mechanical model for spiral-wound Li-ion batteries. J. Mater. Sci. 2018, 53, 10110–10987. [Google Scholar] [CrossRef]
  27. Wang, J.; Chen, Q.; Cao, B. Support vector machine based battery model for electric vehicles. Energy Convers. Manag. 2006, 47, 858–864. [Google Scholar]
  28. Hu, X.; Li, S.; Peng, H. A comparative study of equivalent circuit models for Li-ion batteries. J. Power Sources 2012, 198, 359–367. [Google Scholar] [CrossRef]
  29. Meng, J.W.; Yue, M.L.; Diallo, D. Nonlinear extension of battery constrained predictive charging control with transmission of Jacobian matrix. Int. J. Electr. Power 2023, 146, 108762. [Google Scholar] [CrossRef]
  30. Chaturvedi, N.A.; Klein, R.; Christensen, J.; Ahmed, J.; Kojic, A. Algorithms for advanced battery-management systesns. IEEE Control. Syst. Mag. 2010, 30, 49–68. [Google Scholar]
  31. An, Z.J.; Jia, L.; Ding, Y.; Dang, C.; Li, X.J. A review on lithium-ion power battery thermal management technologies and thermal safety. J. Therm. Sci. 2017, 26, 391–412. [Google Scholar] [CrossRef]
  32. Samba, A.; Omar, N.; Gualous, H.; Capron, O.; Van den Bossche, P.; Van Mierlo, J. Impact of TAB location on large format Lithium-Ion pouch cell based on fully coupled Tree-Dimensional Electrochemical-Thermal modeling. Electr. Acta 2014, 147, 319–329. [Google Scholar] [CrossRef]
  33. Panchal, S.; Mathewb, M.; Fraser, R.; Fowler, M. Electrochemical thermal modeling and experimental measurements of 18650 cylindrical lithium-ion battery during discharge cycle for an EV. Appl. Therm. Eng. 2018, 135, 123–132. [Google Scholar] [CrossRef]
  34. Bizeray, A.M.; Zhao, S.; Duncan, S.R.; Howey, D.A. Lithium-ion battery thermal-electrochemical model based state estimation using orthogonal collocation and a modified extended Kalman filter. J. Power Sources 2015, 296, 400–412. [Google Scholar] [CrossRef]
  35. Marc, D.; Thomas, F.F.; John, N. Modeling of Galvanostatic Charge and Discharge of the Lithium/Polymer/Insertion Cell. J. Electrochem. Soc. 1993, 140, 1526–1533. [Google Scholar]
  36. An, Z.J.; Li, J.; Wei, L.T.; Chao, D.; Qi, P. Investigation on lithium-ion battery electrochemical and thermal characteristic based on electrochemical thermal coupled model. Appl. Therm. Eng. 2018, 137, 792–807. [Google Scholar] [CrossRef]
  37. Xu, M.; Zhang, Z.Q.; Wang, X.; Jia, L.; Yang, L.X. Two-dimensional electrochemical thermal coupled modeling of cylindrical LiFePO4 batteries. J. Power Sources 2014, 256, 233–243. [Google Scholar] [CrossRef]
  38. Ashwin, T.R.; McGordon, A.; Jennings, P.A. Electrochemical modeling of Li-ion battery pack with constant voltage cycling. J. Power Sources 2017, 341, 327–339. [Google Scholar] [CrossRef]
  39. Liu, L.; Park, J.; Lin, X.; Sastry, A.M.; Lu, W. A thermal-electrochemical model that gives spatial-dependent growth of solid electrolyte interphase in a Li-ion battery. J. Power Sources 2014, 268, 482–490. [Google Scholar] [CrossRef]
Figure 1. Simplified charging–discharging model of lithium-ion battery.
Wevj 14 00113 g001
Figure 2. Battery test experiment system.
Wevj 14 00113 g002
Figure 3. Comparison of experimental and simulation results; (a) cell voltage versus discharge time; and (b) temperature on battery surface versus discharge time.
Wevj 14 00113 g003
Figure 4. Structural diagram of air cooling system.
Wevj 14 00113 g004
Figure 5. Thermal characteristic analysis (a) cloud chart of air streamline and battery temperature α = 0 ° ; (b) cloud chart of air streamline and battery temperature α = 2 ° ; (c) cloud chart of air streamline and battery temperature α = 4 ° ; (d) cloud chart of air streamline and battery temperature α = 6 ° ; (e) relationship between the average temperature and time; (f) relationship between the maximum temperature and time; and (g) temperature difference versus time.
Wevj 14 00113 g005
Figure 6. Thermal characteristic analysis. (a) Cloud chart of air streamline and battery temperature ( H = 12   mm ); (b) cloud chart of air streamline and battery temperature ( H = 13   mm ); (c) cloud chart of air streamline and battery temperature ( H = 14   mm ); (d) cloud chart of air streamline and battery temperature ( H = 15   mm ); (e) cloud chart of air streamline and battery temperature ( H = 16   mm ); (f) relationship between the average temperature and time; (g) relationship between the maximum temperature and time; and (h) temperature difference versus time.
Wevj 14 00113 g006
Figure 7. Schematic diagram of air inlet and outlet scheme. (a) One inlet one outlet (case 2); (b) one inlet two outlets (case 3); (c) two inlets one outlet (case 4); and (d) two inlets two outlet (case 5).
Wevj 14 00113 g007
Figure 8. Thermal characteristic analysis. (a) Cloud chart of air streamline and battery temperature (case 1); (b) cloud chart of air streamline and battery temperature (case 2); (c) cloud chart of air streamline and battery temperature (case 3); (d) cloud chart of air streamline and battery temperature (case 4); (e) cloud chart of air streamline and battery temperature (case 5); (f) relationship between the average temperature and time; (g) relationship between the maximum temperature and time; and (h) temperature difference versus time.
Wevj 14 00113 g008
Table 1. Parameter value.
ParameterPositive ElectrodeDiaphragmNegative Electrode
Ds (m2/s)3.9 × 10−141.0 × 10⁻¹⁴
D l (m2/s)7.5 × 10−11Formula (6)7.5 × 10⁻¹¹
R ( μ m )1.1514.75
ε s 0.4710.297
ε l 0.3570.4441
σ s (s/m)1003.8
σ l (s/m)Formula (19)
k 0 2 × 10−62 × 10−6
α a 0.50.5
α c 0.5 0.5
γ 1.51.51.5
K T (W/m·K)515
t + 0 0.3630.3630.363
C s , max (mol/m3)2.639 × 1042.286 × 104
ρ (kg/m3)2.5 × 1031.2 × 1031.5 × 103
C ρ ( J   /   kg K )700700700
Disclaimer/Publisher’s Note: The statements, opinions and data contained in all publications are solely those of the individual author(s) and contributor(s) and not of MDPI and/or the editor(s). MDPI and/or the editor(s) disclaim responsibility for any injury to people or property resulting from any ideas, methods, instructions or products referred to in the content.

