Perspective

Cost-Benefit Analysis of Downstream Applications for Retired Electric Vehicle Batteries

Chair of Production Engineering of E-Mobility Components (PEM), RWTH Aachen University, 52072 Aachen, Germany
*
Authors to whom correspondence should be addressed.
World Electr. Veh. J. 2023, 14(4), 110; https://doi.org/10.3390/wevj14040110
Submission received: 27 February 2023 / Revised: 27 March 2023 / Accepted: 30 March 2023 / Published: 14 April 2023
(This article belongs to the Special Issue Battery Production for Electric Vehicles)

Abstract

:
Mass transport conversion to an electrified powertrain requires suitable strategies for processing electric vehicle (EV) batteries after their intended first service life. Due to aging mechanisms, EV batteries lose capacity over their period of use and become unsuitable for their initial application at some point. However, to expand their lifetime and to meet the sustainability demand for EVs, the usage of these batteries in so-called Re-X applications is under intense discussion. Until now, downstream processing has been subject to high uncertainty regarding the expected advances. While many issues on the technical and ecological side have been at least partially resolved, the economics are still under assessment. For this reason, this paper intends to give a well-based outlook on the costs and benefits of three chosen scenarios: reuse, repurpose, and recycle. It is expected that under the given national policies and global market conditions, growing quantities of retired EV batteries will return from the transportation markets. Consequently, the market potential for retired batteries in downstream applications will significantly increase, as well as calls for stable solutions.

1. Introduction

Interest in battery electric vehicles has been rising in recent decades. Technologies including lithium-ion energy storage have many environmental advantages compared to conventional propulsion concepts. Besides the manufacturing and usage of lithium-ion-powered vehicles, their long-term sustainability also depends on the downstream of their batteries [1]. As a result of the low amount of recycled waste in many industrial sectors, the EU pushes for sustainable circular economy approaches [2]. In the waste hierarchy published by the EU, the priority in dealing with waste is prevention followed by reuse and repurpose [3,4]. This also represents the challenges of the sustainability of lithium-ion batteries today. Due to the ongoing high increase in electric vehicles, a circular economy in battery engineering must be distinguished. With the increasing number of new registrations, it is expected that in approx. 10 years, depending on the lifetime of the batteries, a large number of used battery systems will be available [5]. These may be defective batteries as well as batteries that can be used in a potential second life. For example, during repurposing, up to 90% of material and energy resources can be retained in the product life cycle [6]; however, the economic viability of such applications remains unclear. In the literature, a high amount of costing models exist. The focus of the present research is on activity-based costing, which is not present in the literature yet. This publication presents an approach to a cost–benefit analysis of downstream applications for retired electric vehicle batteries based on a case study. The goal is to expose the hidden costs of processing and assign them to the end product to show the impact on the real cost of business operations.

2. Battery Lifecycle

To ensure the maximum utilization of a traction battery a higher adaptation to customer needs is necessary. The overall ideal lifecycle for battery systems is shown in Figure 1. Starting with raw material processing, the production of battery cells, and later, battery systems, begins. After the production phase, the integration into the car and corresponding usage time follow. For the scope of this work, the subsequent processes are especially relevant. In any case of specific battery analysis, a dismounting of the battery from the car must be performed. Afterward, different paths can be chosen, the so-called Re-X processes.
A distinction must be made between scenarios with further use of the battery and recycling. Recycling is the process step where the battery is broken down into its raw materials. These can be used again to manufacture new battery cells. By recycling the circular loop of the battery can be closed.
In general, further use of the battery after the initial usage phase is defined as second life. In Figure 2 the different processes leading to second life are described. The processes described are based on the theoretical ideal. In practice, there are deviations in the details. Among other things, this is the case because in reality, and especially in smaller companies, both entire battery packs and individual modules are processed.
As already mentioned above, recycling should not be the first thing to do after dismounting the battery from the car. To distribute impacts from production (e.g., the emission of carbon dioxide equivalents in terms of sustainability requirements), it may be desirable for the battery to have the longest possible usage time. Additionally, a lot of retired battery systems might not be useless but could just suffer from smaller defects, for example in the integrated electronics. All paths have in common that some kind of initial characterization of the system is needed. Depending on the individual results of the characterization, different paths are chosen. After achieving the best results, a reuse is considered. In reuse, the battery system is reinstalled in the original application. This might be the case when there has been an accident with the vehicle without impacts on the battery and therefore no replacements of components are needed. Reuse most likely requires the direct cooperation with an OEM. In remanufacturing, different battery systems are characterized, and with the healthiest parts (for example battery modules) a new system is built up and used in the original application. As with reuse, the cooperation with an OEM is necessary to fulfill the initial requirements. Another path quite similar to the already explained one is the path of repurpose. In this scenario, the battery might be manipulated, if necessary [7]. The main element that distinguishes repurpose and remanufacturing is the use in a new application. This means that a former traction battery can be used, for example in stationary energy storage, with less strong requirements regarding the depth of discharge but maybe higher requirements in terms of cyclability. Repurpose does not require cooperation with the OEM since the battery is disassembled. However, access to the battery management system is highly appreciated, which is difficult for third parties.

3. Battery Process Routes for Downstream Applications

The downstream process map for the retired vehicle batteries demonstrated in Figure 3 must be understood as a multi-variable investigative approach. For development, theoretical models from the literature [8,9,10,11] were merged with state-of-the-art industry practice gathered from expert interviews with market players.
The process map does not claim completeness but can be considered a generic model for the investigated downstream pathways and stage gates. Therefore, the model can be adjusted with low effort due to its modularity. Every downstream pathway for the explored Re-X scenarios contains four generic stages [5]:
  • Preparation and support processes simplified to the receipt of goods;
  • Classification operations heavily determine the further downstream pathway of the batteries;
  • Disassembly of the goods received;
  • Downstream applications for the batteries.
Different decision criteria determine the downstream pathways [12], starting with the kind of goods received and considering the processed state of the retired batteries (EV, pack, or module) as well as their system architecture (cell-module-pack (CMP), cell-to-pack (CTP)…) [13,14] and the classification abilities of the processor and the classification result. Table 1 gives an overview of the criteria options for the respective applications.
To avoid exceeding paper limitations, not every pathway is presented. Please note that the table does not provide information on which XOR-knot the decision occurs or on relevant criteria concerning pathway variations within the sections.

3.1. Preparation, Classification, and Disassembly

The model foremost centers around the disassembly steps necessary to prepare the batteries for their respective downstream applications. It is assumed that there is no information about the condition of incoming batteries. Their status is treated as a black box until classification occurs. Therefore, the process lanes of disassembly and application progress depend on the classification (methods as well as) results and the processed state of goods received. The path development for classification relies on the latter and the classification capabilities of the processor [15]. Investigating battery pack disassembly revealed that current the process designs heavily rely on manual labor with low automation present. The lack of automation in battery disassembly results in operators having to perform time-consuming, expensive, and often dangerous work [16]. The diversity of pack design variants complicates a standardization of process activities and leads to disassembly line designs having still a pilot character. It is expected that automated disassembly approaches will accelerate throughputs by increasing process capacities as well as cutting process time and costs drastically [17,18].
In terms of classification, a wide range of approaches is available [19,20]. This model considers two of those approaches. Regarding process time, a direct readout of battery data from the battery management system (BMS) would be the most preferable option [21], eventually followed by electrochemical impedance spectroscopy (EIS) [22]. However, a direct readout requires extensive monitoring of the battery during vehicle operation and access to sensitive data, mostly exclusive to manufacturers. For this reason, third-party entities especially rely on Coulomb Counting (CC) as an alternative [19,23,24]. This method conducts pre-defined charge and discharge cycles on the battery to determine its condition [25]. Even though CC could be applied as an easy-access alternative for classification, this option consumes most of the overall process time [26]. Therefore, as a compromise between classification accuracy and downstream costs, testing on modules is considered an efficient trade-off, especially since the handling of battery cells was not in the scope. The disadvantage of merely testing modules instead of cells would be that just one defective cell could determine the whole module’s fitness and suitability for further downstream activities. Additionally, the determination of a deep discharge during the process would disqualify the battery in any processed state from every downstream application except recycling [27].
The actual disassembly process starts after the receipt of goods or classification, depending on how much the battery has been processed already [8]. To exemplarily characterize the process, it is assumed that the disassembler deals with EVs. The reuse application requires the processor to be capable of performing a direct BMS readout. For the repurpose and recycling cases, primarily third-party processing with access only to CC is assumed. If the processor has no access to the necessary BMS data, removing the battery pack from the vehicle itself represents the first disassembly activity. A direct readout offers the option to first enter the classification of the battery pack while still installed in the vehicle. If the classification determines that the pack has over 80% of its initial capacity left, the requirement for reuse is matched and the disassembly process ends; otherwise, disassembly continues.
The delivery of battery packs or modules skips the pack removal process. Received modules also need no further disassembly and enter the CC classification directly. The disassembly of packs is considered if an SOH result of under 80% was determined previously or CC classification is the only option. At first, the pack should be discharged for safe handling. The discharging step is a free-floating task and can be applied at various points during the disassembly, depending on the goods received and the process design. However, it should be applied before handling the internal peripherals, modules, and cells to avoid serious safety risks. It is possible to skip the activity if an initial SOC measurement finds a deep discharge of the battery. Next, the external peripherals and the packing lid must be dismantled. Then, the removal of the inner peripherals follows. Finally, the modules can be dismantled from the battery pack, and classification using CC is performed [11], ending the disassembly stage.
This model uses the 80% residual capacity criterion to determine the downstream application [28,29]. The battery capacity must pass this limit to guarantee further operation lifetime for reuse or repurpose. Otherwise, the battery is fed into the recycling process chain. The value of 80% is still one of the most common approaches for defining the end life of a traction battery [5]. However, some consider overthinking this limit and shifting it towards lower capacities, achieving a maximally stretched-out lifetime until requirements can no longer be fulfilled and therefore a required higher adaption to customer needs [30,31,32].

3.2. Reuse of Battery Packs

The direct reuse process for retired traction batteries follows a generic approach [33]. For this application, many assumptions had to be considered due to a lack of industry practice in the reuse of EV batteries in vehicles. The approach designed for this paper examines the economic effects of purchasing retired traction battery packs or EVs, testing their suitability for reuse, renewing their operation license, and then reselling them. The model would require the processor to be able to read out necessary BMS data and would not consider battery reuse in an original or similar application after disassembling the battery system down to the module level. It is assumed that the resulting additional costs of a reassembly disqualify this option economically. The packs suitable for this scenario could be foremost allocated from EV service inspections, car resellers, or insurance write-offs. As a business model, a reuse of the battery in the same EV or similar EV model could be considered a warranty extension or a renewed operating certification of the battery or drive system [34]. The SOH classification is ideally conducted while the battery is still installed in the vehicle, cutting disassembly and reassembly costs; otherwise, the disassembly process must be applied as stated above. Depending on the legal situation, the last step for reusing the battery packs is for them to pass safety and functional tests, ensuring reliable EV operation. Due to the mentioned lack of industry examples, those safety and functional tests were based on the certification processes for new battery systems [35,36].

3.3. Repurpose on Module Level

The repurpose scenario in the model displays the production of energy storage for industrial applications. The application design requires the batteries to be disassembled to the module level. Although there was no focus on other repurposed products, all kinds of different scenarios are possible [28]. A prominent example would be container storage systems, where the integration of whole retired battery packs is possible. However, the basic manufacturing steps do not differ in a significant way [12].
For application suitability in our model, the modules must have an SOH value over 80% of their initial capacity [37]. To ensure safe and reliable operation, all modules must be balanced towards a uniform capacity [38]. The model achieves this by reducing the module capacities below the actual performance level. In our case, the capacity is reduced to 60% of the initial value. The significant difference between the SOH threshold and balance level should compensate for measurement errors in residual capacity results and also equalize inhomogeneities in the load history between different modules [39]. After classification and capacity leveling, the modules, together with the needed material (e.g., power electronics), are interconnected and mounted into storage cabinets. The last repurpose step lies (like reuse) in various safety and functional tests [21]. After passing, the storage system can be shipped.

3.4. Recycling of Battery

Commercial recycling plants can be differentiated based on their recycling technology and thus on their products’ quality. Industrial recycling companies in Europe use a combination of different recycling technologies. The different types of recycling technologies can be clustered into pre-treatment, mechanical treatment, pyrometallurgy, and hydrometallurgy [8]. The different types of recycling options are visualized in Figure 4.
To reduce the safety risks during the mechanical treatment and handling of the battery, incoming batteries are generally deep-discharged and dismantled into modules in the pre-treatment. Pyrolysis is also included in the pre-treatment cluster, as it can also be implemented to deactivate LFP batteries [40]. In the mechanical treatment, the batteries are shredded and processed by different types and combinations of separation technologies to achieve the highest possible quality of the intermediate product. After the mechanical treatment, the intermediate product is the battery active material mixture (BAMM), a mixture of cathode material and/or anode material and/or electrolyte and/or other components and impurities. Pyrometallurgy refers to a process that uses a high temperature of about 1400 °C to obtain a metallic alloy as an intermediate product [41]. In hydrometallurgy, the metals are extracted from the intermediate product using different water-based steps recovering the targeted metal as a compound (e.g., cobalt sulfate, nickel sulfate).
The model for the recycling scenario displays the recycling from end-of-life batteries until the metal precursor for two types of cathode chemistry: NMC811 and LFP. For the recycling chain, the following processes are considered: discharging, disassembly to the battery module, pyrolysis, dry shredding, mechanical separation, leaching with sulfuric acid, solvent extraction, and crystallization.
Recycling plants are generally strategically planned close to battery production facilities as well as automotive companies. Short transport distances have a highly positive economic impact on the recycling company, as the transport of end-of-life batteries is a high-cost factor. With more than 15 recycling companies, Germany is currently the most popular battery recycling location in Europe due to its central position and the high number of OEMs and battery production plants [42].

4. Cost–Benefit Analysis of Established Second-Life Processes

As shown in Chapter 3, there are multiple process routes for the various downstream approaches to investigate and measure arising costs. To focus the efforts, one representative process route for reuse and repurpose as well as two examples for recycling were selected. A standard cost accounting approach is used and integrated into a CBA tool.

4.1. Framework and Bases for the CBA

Standard costs are the costs planned per unit of product. In particular, these are the manufacturing costs planned per product unit (raw material or direct material, production wages, and production overhead). Since the manufacturing costs of a product are formed by summing the costs required for the various operations, the costs planned per operation also represent standard costs [43]. As standards, the following parameters shown in Table 2 are specified:
The vehicle model Audi e-tron quattro 50 (2019) and its battery model are used as the process input. The car relies on a battery system with 71 kWh capacity distributed over 27 modules. Each module contains 12 prismatic cells [44]. For calculations concerning recycling [18], it is assumed that NMC-811 (nickel, manganese, cobalt) and LFP (lithium, iron, phosphate) cathode formats are used in the battery. Other process routes are not affected by this assumption. It is further assumed that a processor has the opportunity to perform every downstream application to create equal starting conditions. However, the performed application itself is modeled as a stand-alone business operation. Consequently, the throughput of processed retired batteries varies with every scenario.
For cost calculations, an activity-based costing method [45] (German: Prozesskostenrechnung), according to the understanding of Horváth and Mayer (1989), was used [46]. In principle, basic processes called activities are treated as the smallest units within a cost center. Their cost-effecting in- and outputs are summed up, and related activities themselves are then combined into cost-center internal processes. Processes interconnected to different cost centers are aggregated into main processes within a company. To achieve measurement and scalability, a significant cost driver for each main process is identified [47,48]. In this case, the main cost driver for every downstream application was considered to be the respective process throughput. Additional information on the used equations are provided in Appendix A.
The initial costs and later benefits were based on assumptions, market data, and interview information. For example, the reuse business case is simplified to the purchase and reselling of battery packs or vehicles, taking into account a value loss for the used condition in comparison to the initial selling price. The assumption was a value loss of approx. 50%. Benefits raised by selling energy storage systems for industrial usage were achieved by calculating a selling price per kWh sold storage. The repurpose business case also needed to pay attention to legal regulations considering accruals and shipping expenses. Recycling benefits were generated through sales of the recovered raw materials. The in- and output variables of the cost model used for the CBA are shown in Figure 5.
The cost model is based on specific input and output parameter sets. Input parameters are clustered in vehicle model, operational, and battery model data. With the execution of the model, the output data for reuse, recycling, and repurpose are generated.

4.2. Cost Analysis of Downstream Applications

The cost distribution shown in Figure 6 for the reuse scenario under the standard cost assumptions is heavily dominated by the safety and functional test. The activity consumes nearly 60% of the overall downstream costs followed by the pack removal from the EV with approx. 30% cost share. Both processes are not necessarily mandatory for the reuse case. In particular, the role of testing for safety and function is up for debate due to the lack of in-practice comparisons. Therefore, the actual costs for reuse could be even lower for future real-life applications.
The repurpose scenario in Figure 7 shows similarities to the reuse case in its cost distribution, with pack removal and testing being major cost factors.
End-of-line testing of the finished products shows to have the largest share of overall costs due to the high consumption of process time and initial investment costs for test equipment. Like the reuse business case, pack removal from the EV is a negligible process activity if another process input is considered.
The cost distributions for both investigated cathode chemistries (NMC and LFP) displayed in Figure 8 (NMC) and Figure 9 (LFP) show that the actual recycling process activities have the largest cost share with over 90% of overall process costs.
Additionally, the recovery of the cell housing is the primary cost driver for both scenarios. This is likely due to the high investment cost for this process step as well as the high energy demand for its performance. For NMC cathodes, this process makes up approx. 30% of the overall process costs, whereas the cost share for LFP cathodes is nearly 45%. The second-largest cost driver lies in recovering the actual cathode materials manganese, cobalt, and nickel for NMC. For recycling batteries with LFP cathode chemistry, the recovery of electrolytes is shown to have the second-largest cost share.

4.3. Cost–Benefit Analysis for the Business Cases

The cost–benefit balance of the reuse business case displayed in Figure 10a shows to be profitable overall under the previously defined standard cost assumptions. With one disassembly worker and one shift operation, a throughput of approx. 3100 processed and reused vehicles per year is estimated to be realized.
Almost all costs can be attributed to the purchase of the retired battery systems. The purchase price of EUR 5325 comprises over 97% of the arising expenses. It is questionable if purchasing retired EVs or battery packs at similar prices is realistic. Due to their higher material value or the possibility for simple reuse, markets maybe tend to develop higher prices for retired EVs compared to their battery system. On the other hand, buying already removed battery packs from vehicles must consider these process costs to be likely added to purchase prices. The revenue compiles the assumed 50% value loss calculated with the mean purchase price for a comparable battery pack of around EUR 16,170. The revenues could turn out lower in the future because battery and, consequently, EV prices are expected to decrease [13]. Subsequently, this could similarly impact the second-hand market, causing no difference to the overall balance in the end.
The business case of repurposing displayed in Figure 10b is also demonstrated to be a profitable downstream for retired batteries. Due to the assembly material and process costs of approx. EUR 20,500, the influence of the initial purchase price is reduced to around 26%. With information from the interviews, a calculation of the material costs of approx. 250 EUR/kWh was conducted, contributing EUR 12,500 for a storage system under the given assumptions. Therefore, the material was shown to have the most significant cost share with nearly 61%. Revenues are mostly generated through the sale of storage, with a minor share being the sale of leftover components from the battery system disassembly. Under the standard cost assumptions, a production of approx. 500 energy storages per year are estimated.
A different picture is created by investigating the balances of the recycling application shown in Figure 11. The initial costs for processing exceed the revenues by far. In contrast, to reuse and repurpose, the overall costs are caused by high investment costs for the various recycling processes. Under the assumptions made, only 740 EVs per year could be processed due to time-consuming disassembly and recycling operations.
A comparison between the recycling of battery cells with NMC and LFP cathode chemistry shows that the recycling of NMC battery cells is more profitable despite needing more processes. This is due to the higher value of the cathode materials nickel, manganese, and cobalt than iron. Nevertheless, the revenue generation is not able to compensate for the expenses.

4.4. Sensitivity Analysis of Parameters of Interest

The previous section describes the cost structure of downstream processes and resulting costs, revenues, and balances for the three chosen applications under the standard cost assumptions. In Chapter 4.3, possible variables of interest, which could change the profitability of the applications depending on their value, were discussed.
For the reuse application, a loss in value for the reused battery pack or system is assumed. In Figure 12, the influence of the value loss in relation to the purchase price of the used but SOH-checked battery pack (in comparison to buying a new battery) on the overall cash balance of the reuse application is investigated. If there is no change in the other standard assumptions, the application can operate profitably until a value loss exceeds 66% for the battery. At this point, the operation would generate losses. The investigation into other variations of purchase prices demonstrates that a change in prices by about 25 EUR/kWh causes the break-even point of operations to demand an approx. 11% reduced value loss.
For repurposing, an investigation into the sales price of the energy storage systems in relation to the purchase price displayed in Figure 13 was conducted. As a result, the application of repurposing loses profitability if the sales price drops lower than approx. 410 EUR/kWh under the given assumptions. In addition, it is shown that a change in purchase prices of 25 EUR/kWh results in the break-even point to shift sales prices up by around 40 EUR/kWh.
Finally, the already discussed impact of the purchase price of retired batteries is investigated. For this, a sensitivity analysis varying the initial purchase costs for all applications is conducted. To take all major process pathways into account and be coherent, the influence of taking NMC and LFP cells as process inputs for the recycling business case are analyzed. As shown in Figure 14, the recycling business case under the given assumptions can only operate profitably by buying retired batteries. As it is already industry practice, charging a fee (as negative purchase costs) of a minimum of approx. 40 EUR/kWh is necessary to avoid generating losses. Repurpose and reuse are less sensitive to price fluctuations. Reuse operates profitably until approx. 110 EUR/kWh, whereas repurpose avoids losses until retired battery prices rise to approx. 130 EUR/kWh, which is nearly a doubling in initial costs. Keeping history and forecasts of battery production costs in mind, these profit borders will eventually be lowered in the forthcoming months and years.
The linearity of the balance functions can be partly attributed to the significant influence of the initial purchase costs for the batteries. Additionally, the cost and revenue functions scale linearly with the process throughput. For the displayed analysis, the presented processes are designed without parallelization. A parallel streamlining of processes investigating and eliminating bottlenecks would likely result in non-linear functions if scaled up.
Finally, the economies of scale for the recycling application are investigated and shown in Figure 15 [49].
For the analysis, the process capacities and the throughput of EVs per year are consequently scaled up. Therefore, capacity-limiting assumptions such as the one-worker operation in disassembly is ignored. It is shown that even with a pilot disassembly line design and only manual labor, a profitable recycling operation for both cathode chemistries can be achieved if scaled up. As already displayed previously, recycling NMC cathode formats generates a higher balance value than LFP cathodes due to their containment of precious metals such as manganese, cobalt, and nickel. Although profitability is possible, the analysis also reveals clear boundaries for economic growth under the assumed circumstances. For both cathode chemistries, the steep balance growth slows down after scaling up the processing capacity to over 10,000 units/year. This threshold displays a point where the influence of the flexible process costs corresponding to the scaling starts to outperform the fixed cost, which could be compensated by the economies of scale effect. When the capacity threshold of 30,000 units/year is exceeded, no significant balance growth can be identified.

5. Conclusions

This paper presents a snapshot of the current downstream market situation for three different applications: reuse, repurpose, and recycling. The CBA was designed according to interview statements, information about the vehicle, and the installed battery model. In particular, the vehicle and traction battery data were essential input variables for calculating and scaling the various processes. For modeling different economic environments, basic operational information was added as input variables as well. In the model, the disassembly and classification sections represent the bottleneck of the entire downstream due to time-intensive process activities limiting the throughput in a significant way. It was shown that scaling-up capacities can have a limited positive influence on the application profitability. The cost model follows an activity-based costing approach and is integrated into a CBA tool giving costs, benefits (as revenues), and the balance as outputs. This method requires a considerable amount of data input concerning activity/process times, cost measurable in- and outputs, and additional information on process design.
While investigating, several challenges concerning data availability and validity were faced. The mass conversion of transport to an electric powertrain is still in its early stages compared to fossil-fueled alternatives. Consequently, downstream markets for traction batteries are also at their very beginning. These markets also develop in a delay from the first EV service lifetime. Those are estimated to be between eight and ten years on average, intensifying the challenges in data collection even further. This creates a widespread lack of industrial experience and general uncertainty. Therefore, the research relies on publicly available data, expert interviews, and filling gaps with reasonable assumptions. A detailed validation and update of the input parameter sets are planned as soon as the data situation has improved. Therefore, the aspect of reject quantities could also not be reliably addressed in the model. The effects of detecting scrap batteries with an unsuitable SOH status for a second life on the business revenue will be also addressed in the future. Another problem concerning data validity is the EV market’s volatility. Political agendas, technological disruptions, legislative environments, and economic realities on the industry and customer side are changing the narrative of electric transport at a fast pace, complicating extensive forecasts. As shown in the presented sensitivity analysis, changing input variables in a minor way could cause significant differences between loss and profit.
As a key result, there is a profound potential for reuse and repurpose in downstream battery applications, especially if initial purchase costs for used batteries on the secondary market fall in correlation to increasing efforts for the mass production of traction batteries and EVs for first-life applications. Under the circumstances, reuse reaches profitability if processors purchase used batteries under approx. 110 EUR/kWh (value loss 50%) or value losses of the reused battery do not exceed 66% (purchase price: 75 EUR/kWh). With the chosen process design, repurpose stays profitable until purchase prices rise over approx. 130 EUR/kWh (sales price: 500 EUR/kWh) or a sales price of approx. 410 EUR/kWh (purchase price: 75 EUR/kWh). In the case of recycling, current applications are not profitable according to the findings presented. Profits are only possible by charging fees for battery processing and improving scaling-up capacities. These findings reflect current industry practice. Additionally, a difference in economics depending on the cathode chemistry input is determined. Comparing LFP and NMC cells indicates higher profitability for recycling NMC cathodes due to higher material value despite needing more process steps. The higher balance of over EUR 500 per processed battery pack seems narrow but can accelerate when throughput is scaled up in the future. It should be noted that, in general, the material value correlates with material availability and need. If the need declines due to a technology change, this could relativize the described observations.
In sum, explicit boundaries for the investigated downstream regarding profitability were determined and showed the resilience areas for each application. Currently, there is a clear ecological and economic rationale for pursuing reuse and repurpose operations for retired traction batteries. The benefits of expanding battery lifetime compared to the modest rededication efforts prevail in the current market environment. However, the authors consider that recycling will likely benefit from future economic and legal frameworks, especially in the EU. Supported by lower investment and processing costs, this could lead to a change in our economic recommendations for Re-X pathways.

Author Contributions

A.K.: Funding Acquisition, Supervision; H.H.H.: Funding Acquisition, Supervision, Writing—Review and Editing; C.O.: Funding Acquisition, Supervision, Writing—Review and Editing; M.H.F.: Investigation, Writing—Original Draft, Writing—Review and Editing; M.G.: Conceptualization, Investigation, Writing—Original Draft, Writing—Review and Editing; N.S.C.: Investigation, Writing—Original Draft, Writing—Review and Editing; B.S.: Investigation, Writing—Original Draft, Writing—Review and Editing. All authors have read and agreed to the published version of the manuscript.

Funding

The project “Model2life” on which this publication is based was funded by the German Federal Ministry of Education and Research (BMBF) within the Competence Cluster Battery Utilisation Concepts (BattNutzung) under the grant number 03XP0334.

Data Availability Statement

The data presented in this study are available on request from the corresponding author. The data are not publicly available due to intellectual property restrictions.

Conflicts of Interest

The authors declare no conflict of interest.

Appendix A

The time consumption for a single performance of an activity is calculated by the multiplication of the time consumption of the measure expression and the form of the measure expression.
T single ,   i = T m i   ×   A m i ,   i     I ,   m i     M i
T single ,   i : time for a single performance of i
T m i : time consumption of m i
A m i : form of m i
i : activity
m i : measure expression of activity
The annual time consumption per activity is calculated by multiplication of the annual sub-process set and the time consumption for a single performance of an activity.
T annual ,   i =   T annual ,   i 3600   ×   m j ,   j     J ,   i     I
T annual ,   i : annual time consumption of j
m j : sub-process set of j
m i : measure expression of activity
The overall time consumption is calculated by summing over the time consumption for a single performance of an activity, and the time consumption of the annually performed activities, respectively.
T single ,   j   = i I T   single ,   i 3600 ,   i     I
T single ,   j   : time consumption of j
T annual ,   j = i I T annual ,   i ,   i     I
T annual ,   j : time consumption of annual performance of j
To calculate the annual depreciation costs of a sub-process, the sum over all work equipment is formed.
K a ,   j = a A I a ,   j     R a C a ,   with   R a = 0 ,   a     A ,   j     J
K a ,   j : annual depreciation costs of j
I a ,   j : investment cost of j used in a
R a   : residual value of j used in a
C a : operating life of j used in a
a : work equipment
Calculation of the annual energy costs by multiplication of the energy consumption, the annual time consumption, and the costs of the energy form. The product is then summed over all activities, work equipment, and used types of energy.
K E ,   j = a A i I e E V E ,   a ,   e ,   j × T annual ,   i   ×   K E ,   e ,   e     E ,   a     A ,   j     J
K E ,   j : annual energy costs of j
V E ,   a ,   e ,   j : energy consumption of e of j used in a
K E ,   e : costs for energy form
e : energy form
The annual service costs are calculated using maintenance rates multiplied by the investment costs of the respective work equipment and summing the product over all work equipment.
K W ,   j = a A I a ,   j   ×   S W ,   a ,   a     A ,   j     J
K W ,   j : annual maintenance costs of j
S W ,   a : maintenance rate of j
The setup costs are calculated by the sum of the multiplication of the annual equipment demand and the costs of the equipment over all work equipment.
K R ,   j = a A V R ,   a ,   b ,   j   ×   K R ,   b ,   b     B ,   a     A ,   j     J
K R ,   j : annual setup costs of j
V R ,   a ,   b ,   j : annual equipment demand
K R ,   b : costs of equipment b
b : equipment
The calculation of the annual personnel costs is performed by summing the product of the personnel costs for a qualification and the personnel demand for a qualification’s overall qualifications.
K P ,   j = q Q   V P ,   q ,   j   ×   K P ,   q ,   q     Q ,   j     J
K P ,   j : annual personnel costs of j
V P ,   q ,   j : personnel demand of q in j
K P ,   q : personnel costs of q
q : qualification
Personnel requirements for a sub-process are calculated as the quotient of the sum of the time consumption of the annual performance (counter) and the annual time allocation of an employee with the respective qualification (denominator).
j V P ,   q ,   j = j T   annual ,   j T q   ,   q     Q ,   j     J
T q : annual time allocation of an employee with q
The annual interest costs are calculated using an average value method for imputed interest.
K Z , j = a A I a ,   j 2 × S Z ,   a     A ,   j     J
K Z ,   j : annual interest costs of j
S Z : imputed interest rate
Calculation of the monetary benefit of the main processes “classification” and “disassembly” by multiplication of the share of valuable material in a battery component.
N PD = j l S l ,   w   ×   P j   ×   E w ,   w     W ,   l     L ,   j     J
N PD : monetary benefit of main processes “classification” and “disassembly”
S l ,   w : share of w in battery component l
E w : sales proceeds of w
l : battery component
w : valuable material
The monetary benefit of the main application process “reuse” is calculated using the new price of the battery pack and a factor to consider the depreciation in used condition.
N RU = K p , new ×   ( 1     S V )   ×   P j ,   p     P ,   j     J
N RU : monetary benefit of main process “reuse”
K p ,   new : new price of p
S V : depreciation in used condition
p : LIB type
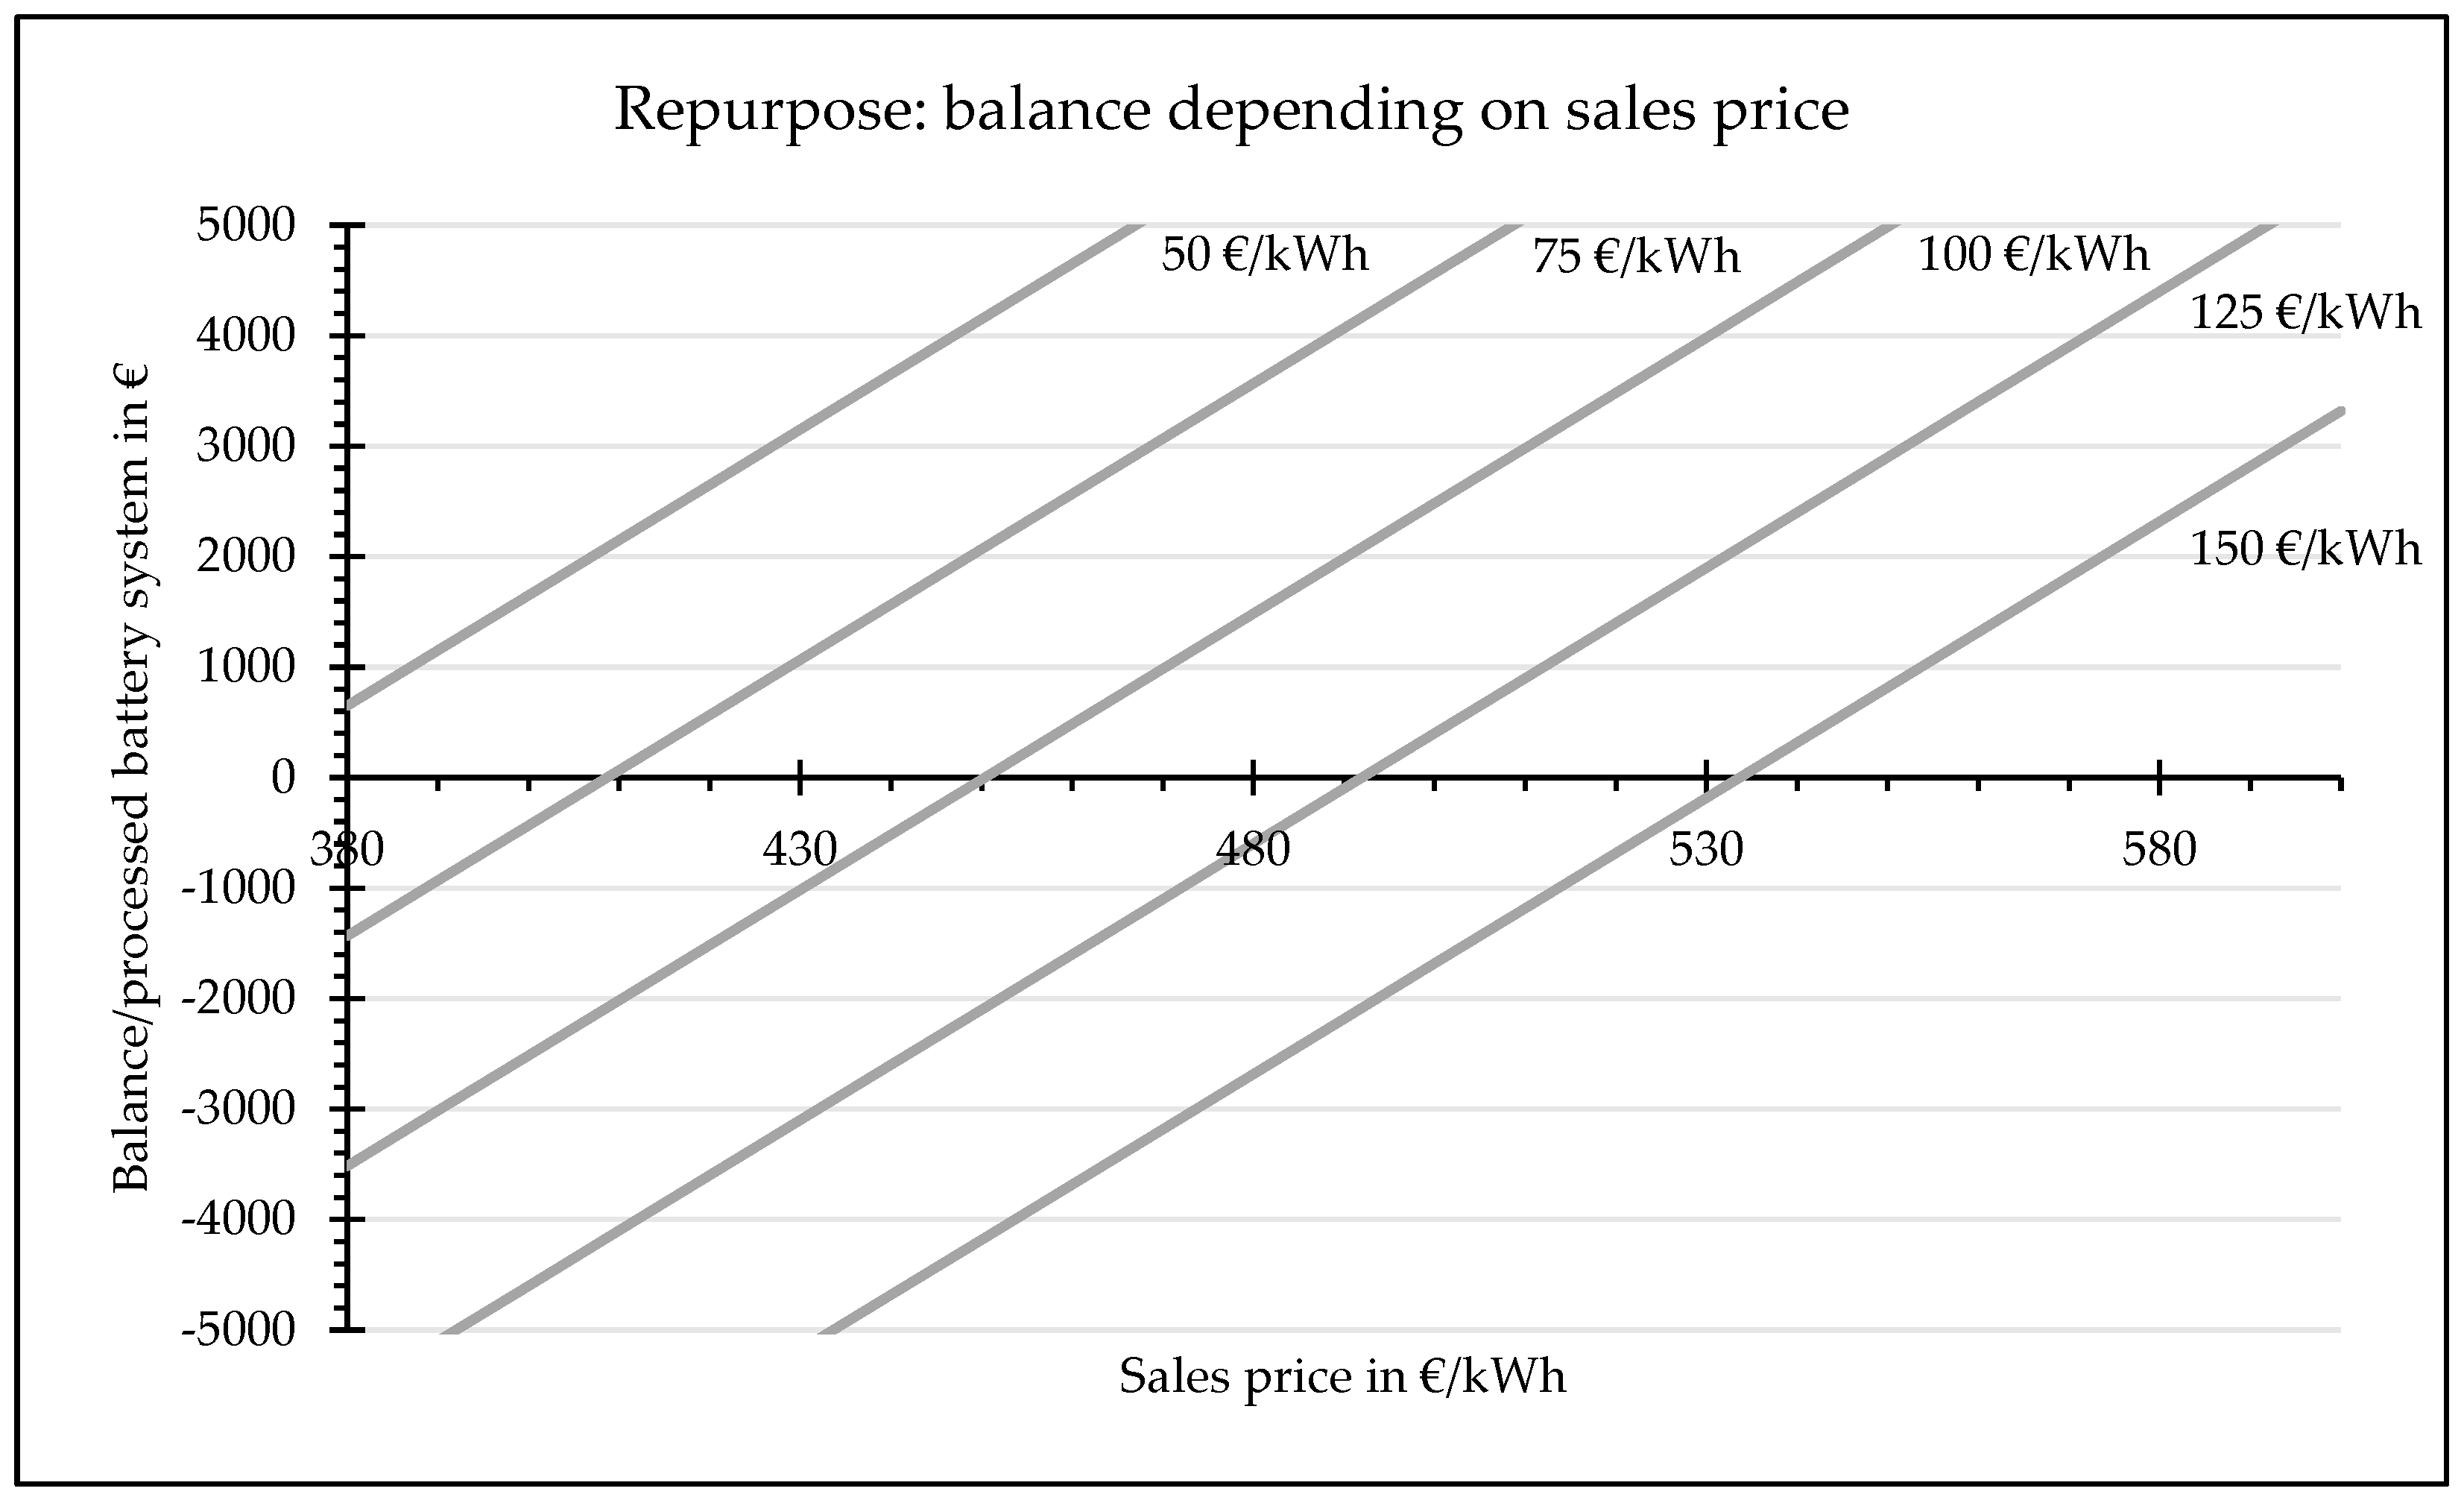
The main application process “repurpose” generates a monetary benefit over the sold capacity and the sales proceed.
N RM = C kWh   ×   E kWh   ×   P j ,   j     J
N RM : monetary benefit of main process “repurpose”
E kWh : sales proceed per kWh
C kWh : capacity of energy storage
The monetary benefit of the main application process “recycling” is calculated analogously to “classification” and “disassembly” under further consideration of recovering rates.
N RC = j i l S l ,   w   ×   S i ,   w   ×   P j   ×   E w ,   w     W ,   l     L ,   i     I ,   j     J
N RC : monetary benefit of main process “recycling”
S i ,   w : recovery rate of w in i

Appendix B

Table A1. Activities of the main process “preparation”: receiving.
NumberProcess
1areceive: vehicle
1breceive: battery module/pack
2breceive: other
Table A2. Activities of the main application process “repurpose”: dispatch.
NumberProcess
1dispatch: energy storage
Table A3. Activities of the main processes “classification” and “disassembly”: capacity determination, if battery system is still in vehicle.
NumberProcess
1read data (SoH): traction battery
Table A4. Activities of the main processes “classification” and “disassembly”: removal of battery pack.
NumberProcess
1remove: cooling system and fluid
2remove: connector plug motor
3lift and lower: vehicle
4loosen: bolting car body
5loosen: central bolting
6lay on table: battery system
Table A5. Activities of the main processes “classification” and “disassembly”: status report.
NumberProcess
1checking: battery pack exterior
2aread data (SoH): battery pack
2bvoltage measurement (SoC): battery pack
Table A6. Activities of the main processes “classification” and “disassembly”: disassembly periphery (outside).
NumberProcess
1disassemble: other periphery
2disassemble: battery junction box
3remove: communication system
4disassemble: BMS-Master
Table A7. Activities of the main processes “classification” and “disassembly”: discharge battery.
NumberProcess
1disconnect from power supply: battery
Table A8. Activities of the main processes “classification” and “disassembly”: disassembly lid.
NumberProcess
1loosen: screw connections
2apry open: battery pack lid
2bunravel: battery pack lid
3disassemble: BMS-Master
Table A9. Activities of the main processes “classification” and “disassembly”: disassembly periphery (inside).
NumberProcess
1remove: plug-in connection module
2remove: plug-in connection BMS-Slave
3loosen: BMS-Slave holder
4disassemble: wiring harness
5loosen: screw connections busbars
Table A10. Activities of the main processes “classification” and “disassembly”: remove battery modules.
NumberProcess
1loosen: screw connections busbars
2excavate: glued modules
Table A11. Activities of the main processes “classification” and “disassembly”: status report battery modules.
NumberProcess
1checking: battery module
2aimpedance spectroscopy (SoH): battery pack
2bvoltage measurement (SoC): battery pack
Table A12. Activities of the main application process “repurpose”: assembly energy storage.
NumberProcess
1cover: cabinet
2installation: rails
3installation: buzz-bar
4installation: busbars
5installation: module
Table A13. Activities of the main application process “repurpose”: checking (EoL).
NumberProcess
1checking: battery modules
2tightness test: module housing
3tightness test: cooling system
4isolation test + DSM: battery modules
5functional test: BMS
6Status report: BMS
7pulse-power test: battery system
8peak-power test: battery system
9safety test: battery system
Table A14. Activities of the main application process “reuse”: reuse test (approval of suitability).
NumberProcess
1checking: battery pack
2tightness test: battery housing
3tightness test: cooling system
4isolation test + DSM: battery pack
5functional test: BMS
6status report: BMS
7pulse-power test: battery system
8peak-power test: battery system
9safety test: battery system
Table A15. Activities of the main application process “recycling”: electrolyte.
NumberProcess
1pyrolysis: battery modules
Table A16. Activities of the main application process “recycling”: aluminum and steel.
NumberProcess
1shredder: deactivated modules
2zig-zag-view: shredding material
3separate: steel and aluminum
Table A17. Activities of the main application process “recycling”: recovery of aluminum and copper foil.
NumberProcess
1sieve: black mass, aluminum and copper foil
Table A18. Activities of the main application process “recycling”: recovery of graphite.
NumberProcess
1leaching: black mass
Table A19. Activities of the main application process “recycling”: remove contaminants.
NumberProcess
1precipitate: leached black mass
Table A20. Activities of the main application process “recycling”: recovery of nickel, cobalt, and manganese.
NumberProcess
1extract: nickel
2crystallize: nickel
3extract: cobalt
4crystallize: cobalt
5extract: manganese
6crystallize: manganese
Table A21. Activities of the main application process “recycling”: recover lithium.
NumberProcess
1precipitate: lithium (and FePO4)

References

  1. Martinez-Laserna, E.; Gandiaga, I.; Sarasketa-Zabala, E.; Badeda, J.; Stroe, D.-I.; Swierczynski, M.; Goikoetxea, A. Battery second life: Hype, hope or reality? A critical review of the state of the art. Renew. Sustain. Energy Rev. 2018, 93, 701–718. [Google Scholar] [CrossRef]
  2. European Commission. Waste and Recycling: Managing Waste in an Environmentally Sound Manner and Making Use of the Secondary Materials They Contain are Key Elements of the EU’s Environmental Policy. Available online: https://environment.ec.europa.eu/topics/waste-and-recycling_en (accessed on 17 January 2023).
  3. European Commission. Waste Prevention and Management. Available online: https://ec.europa.eu/environment/green-growth/waste-prevention-and-management/index_en.htm (accessed on 17 January 2023).
  4. Gharfalkar, M.; Court, R.; Campbell, C.; Ali, Z.; Hillier, G. Analysis of waste hierarchy in the European waste directive 2008/98/EC. Waste Manag. 2015, 39, 305–313. [Google Scholar] [CrossRef] [PubMed]
  5. Börner, M.F.; Frieges, M.H.; Späth, B.; Spütz, K.; Heimes, H.H.; Sauer, D.U.; Li, W. Challenges of second-life concepts for retired electric vehicle batteries. Cell Rep. Phys. Sci. 2022, 3, 101095. [Google Scholar] [CrossRef]
  6. Schlesinger, L.; Koller, J.; Oechsle, O.; Molenda, P. Remanufacturing of E-mobility Components—Five-Step Implementation Strategy to increase Sustainability within Circular Economy. In Proceedings of the 2021 11th International Electric Drives Production Conference (EDPC), Erlangen, Germany, 7–9 December 2021; IEEE: Piscataway, NJ, USA, 2021; pp. 1–8, ISBN 978-1-6654-1809-6. [Google Scholar]
  7. Becker, J.; Beverungen, D.; Winter, M.; Menne, S. Umwidmung und Weiterverwendung von Traktionsbatterien; Springer Fachmedien Wiesbaden: Wiesbaden, Germany, 2019; ISBN 978-3-658-21020-5. [Google Scholar]
  8. Harper, G.; Sommerville, R.; Kendrick, E.; Driscoll, L.; Slater, P.; Stolkin, R.; Walton, A.; Christensen, P.; Heidrich, O.; Lambert, S.; et al. Recycling lithium-ion batteries from electric vehicles. Nature 2019, 575, 75–86. [Google Scholar] [CrossRef] [PubMed] [Green Version]
  9. Gohla-Neudecker, B.; Bowler, M.; Mohr, S. Battery 2nd life: Leveraging the sustainability potential of EVs and renewable energy grid integration. In Proceedings of the 2015 International Conference on Clean Electrical Power (ICCEP), Taormina, Italy, 16–18 June 2015; pp. 311–318. [Google Scholar]
  10. Hossain, E.; Murtaugh, D.; Mody, J.; Faruque, H.M.R.; Haque Sunny, M.S.; Mohammad, N. A Comprehensive Review on Second-Life Batteries: Current State, Manufacturing Considerations, Applications, Impacts, Barriers & Potential Solutions, Business Strategies, and Policies. IEEE Access 2019, 7, 73215–73252. [Google Scholar] [CrossRef]
  11. Tan, W.J.; Chin, C.M.M.; Garg, A.; Gao, L. A hybrid disassembly framework for disassembly of electric vehicle batteries. Int. J. Energy Res. 2021, 45, 8073–8082. [Google Scholar] [CrossRef]
  12. Montes, T.; Etxandi-Santolaya, M.; Eichman, J.; Ferreira, V.J.; Trilla, L.; Corchero, C. Procedure for Assessing the Suitability of Battery Second Life Applications after EV First Life. Batteries 2022, 8, 122. [Google Scholar] [CrossRef]
  13. Fichtner, M. Recent Research and Progress in Batteries for Electric Vehicles. Batter. Supercaps. 2022, 5, e202100224. [Google Scholar] [CrossRef]
  14. Xiao, J.; Jiang, C.; Wang, B. A Review on Dynamic Recycling of Electric Vehicle Battery: Disassembly and Echelon Utilization. Batteries 2023, 9, 57. [Google Scholar] [CrossRef]
  15. Zhu, J.; Mathews, I.; Ren, D.; Li, W.; Cogswell, D.; Xing, B.; Sedlatschek, T.; Kantareddy, S.N.R.; Yi, M.; Gao, T.; et al. End-of-life or second-life options for retired electric vehicle batteries. Cell Rep. Phys. Sci. 2021, 2, 100537. [Google Scholar] [CrossRef]
  16. Kay, I.; Farhad, S.; Mahajan, A.; Esmaeeli, R.; Hashemi, S.R. Robotic Disassembly of Electric Vehicles’ Battery Modules for Recycling. Energies 2022, 15, 4856. [Google Scholar] [CrossRef]
  17. Schäfer, J.; Singer, R.; Hofmann, J.; Fleischer, J. Challenges and Solutions of Automated Disassembly and Condition-Based Remanufacturing of Lithium-Ion Battery Modules for a Circular Economy. Procedia Manuf. 2020, 43, 614–619. [Google Scholar] [CrossRef]
  18. Zorn, M.; Ionescu, C.; Klohs, D.; Zähl, K.; Kisseler, N.; Daldrup, A.; Hams, S.; Zheng, Y.; Offermanns, C.; Flamme, S.; et al. An Approach for Automated Disassembly of Lithium-Ion Battery Packs and High-Quality Recycling Using Computer Vision, Labeling, and Material Characterization. Recycling 2022, 7, 48. [Google Scholar] [CrossRef]
  19. Hannan, M.A.; Lipu, M.; Hussain, A.; Mohamed, A. A review of lithium-ion battery state of charge estimation and management system in electric vehicle applications: Challenges and recommendations. Renew. Sustain. Energy Rev. 2017, 78, 834–854. [Google Scholar] [CrossRef]
  20. Wang, Z.; Feng, G.; Zhen, D.; Gu, F.; Ball, A. A review on online state of charge and state of health estimation for lithium-ion batteries in electric vehicles. Energy Rep. 2021, 7, 5141–5161. [Google Scholar] [CrossRef]
  21. Hu, X.; Deng, X.; Wang, F.; Deng, Z.; Lin, X.; Teodorescu, R.; Pecht, M.G. A Review of Second-Life Lithium-Ion Batteries for Stationary Energy Storage Applications. Proc. IEEE 2022, 110, 735–753. [Google Scholar] [CrossRef]
  22. Wang, L.; Zhaob, X.; Deng, Z.; Yang, L. Application of electrochemical impedance spectroscopy in battery management system: State of charge estimation for aging batteries. J. Energy Storage 2023, 57, 106275. [Google Scholar] [CrossRef]
  23. Ng, K.S.; Moo, C.-S.; Chen, Y.-P.; Hsieh, Y.-C. Enhanced coulomb counting method for estimating state-of-charge and state-of-health of lithium-ion batteries. Appl. Energy 2009, 86, 1506–1511. [Google Scholar] [CrossRef]
  24. Zhang, S.; Guo, X.; Dou, X.; Zhang, X. A data-driven coulomb counting method for state of charge calibration and estimation of lithium-ion battery. Sustain. Energy Technol. Assess. 2020, 40, 100752. [Google Scholar] [CrossRef]
  25. Wu, T.-H.; Wang, J.-K.; Moo, C.-S.; Kawamura, A. State-of-charge and state-of-health estimating method for lithium-ion batteries. In Proceedings of the 2016 17th Workshop on Control and Modeling for Power Electronics (COMPEL), Trondheim, Norway, 27–30 June 2016; IEEE: Piscataway, NJ, USA, 2016; pp. 1–6. [Google Scholar]
  26. Hu, X.; Yuan, H.; Zou, C.; Li, Z.; Zhang, L. Co-Estimation of State of Charge and State of Health for Lithium-Ion Batteries Based on Fractional-Order Calculus. IEEE Trans. Veh. Technol. 2018, 67, 10319–10329. [Google Scholar] [CrossRef]
  27. Prochazka, P.; Cervinka, D.; Martis, J.; Cipin, R.; Vorel, P. Li-Ion Battery Deep Discharge Degradation. ECS Trans. 2016, 74, 31–36. [Google Scholar] [CrossRef]
  28. Ahmadi, L.; Yip, A.; Fowler, M.; Young, S.B.; Fraser, R.A. Environmental feasibility of re-use of electric vehicle batteries. Sustain. Energy Technol. Assess. 2014, 6, 64–74. [Google Scholar] [CrossRef]
  29. Hunt, G.L. USABC Electric Vehicle Battery Test Procedures Manual; United States Department of Energy: Washington, DC, USA, 1996. [Google Scholar]
  30. Saxena, S.; Le Floch, C.; MacDonald, J.; Moura, S. Quantifying EV battery end-of-life through analysis of travel needs with vehicle powertrain models. J. Power Sources 2015, 282, 265–276. [Google Scholar] [CrossRef] [Green Version]
  31. Podias, A.; Pfrang, A.; Di Persio, F.; Kriston, A.; Bobba, S.; Mathieux, F.; Messagie, M.; Boon-Brett, L. Sustainability Assessment of Second Use Applications of Automotive Batteries: Ageing of Li-Ion Battery Cells in Automotive and Grid-Scale Applications. WEVJ 2018, 9, 24. [Google Scholar] [CrossRef] [Green Version]
  32. Hou, Q.; Yu, Y.; Du, E.; He, H.; Zhang, N.; Kang, C.; Liu, G.; Zhu, H. Embedding scrapping criterion and degradation model in optimal operation of peak-shaving lithium-ion battery energy storage. Appl. Energy 2020, 278, 115601. [Google Scholar] [CrossRef]
  33. Bräuer, S.; Stieger, A. End-of-Life-Strategien für Traktionsbatterien: Szenarien, Dienstleistungen und Entscheidungsunterstützung, 1st ed.; Becker, J., Beverungen, D., Winter, M., Menne, S., Eds.; Springer: Wiesbaden, Germany, 2019. [Google Scholar]
  34. Olsson, L.; Fallahi, S.; Schnurr, M.; Diener, D.; van Loon, P. Circular Business Models for Extended EV Battery Life. Batteries 2018, 4, 57. [Google Scholar] [CrossRef] [Green Version]
  35. Wolter, M.; Leiva, D.; Fritsch, M.; Borner, S. Process development and optimization for Li-ion battery production. In Proceedings of the 2013 World Electric Vehicle Symposium and Exhibition (EVS27), Barcelona, Spain, 17–20 November 2013; IEEE: Piscataway, NJ, USA, 2013; pp. 1–5, ISBN 978-1-4799-3832-2. [Google Scholar]
  36. Wolter, M.; Fauser, G.; Bretthauer, C.; Roscher, M.A. End-of-line testing and formation process in Li-ion battery assembly lines. In Proceedings of the International Multi-Conference on Systems, Signals & Devices, Chemnitz, Germany, 20–23 March 2012; IEEE: Piscataway, NJ, USA, 2012; pp. 1–3, ISBN 978-1-4673-1590-6. [Google Scholar]
  37. Al-Alawi, M.K.; Cugley, J.; Hassanin, H. Techno-economic feasibility of retired electric-vehicle batteries repurpose/reuse in second-life applications: A systematic review. Energy Clim. Chang. 2022, 3, 4–16. [Google Scholar] [CrossRef]
  38. Azizighalehsari, S.; Venugopal, P.; Pratap Singh, D.; Rietveld, G. Performance Evaluation of Retired Lithium-ion Batteries for Echelon Utilization. In Proceedings of the IECON 2022–48th Annual Conference of the IEEE Industrial Electronics Society, Brussels, Belgium, 17–20 October 2022; IEEE: Piscataway, NJ, USA, 2022; pp. 1–6, ISBN 978-1-6654-8025-3. [Google Scholar]
  39. Kampker, A.; Wessel, S.; Fiedler, F.; Maltoni, F. Battery pack remanufacturing process up to cell level with sorting and repurposing of battery cells. J. Remanuf. 2021, 11, 1–23. [Google Scholar] [CrossRef]
  40. Beigl, P.; Scherhaufer, S.; Part, F.; Jandric, A.; Salhofer, S.; Nigl, T.; Altendorfer, M.; Rutrecht, B.; Pomberger, R.; Meyer, I. Entwicklung Einer Wertschöpfungskette für das Recycling von Lithium-Ionen-Batterien (Lib) in Österreich; WIFO, Österreichisches Institut für Wirtschaftsforschung: Vienna, Austria, 2021. [Google Scholar]
  41. Zhou, M.; Li, B.; Li, J.; Xu, Z. Pyrometallurgical Technology in the Recycling of a Spent Lithium Ion Battery: Evolution and the Challenge. ACS EST Eng. 2021, 1, 1369–1382. [Google Scholar] [CrossRef]
  42. Soldan, N.; Bockey, G.; Heimes, H.; Offermanns, C. Batterie-Recycling in Europa (Stand: Januar 2023). Available online: https://battery-news.de/index.php/2023/01/27/batterie-recycling-in-europa-stand-01-2023/ (accessed on 20 January 2023).
  43. Matz, A. (Ed.) Standardkosten: Ermittlung der Standardkosten und Analyse der Abweichungen, 7th ed.; Gabler Verlag: Wiesbaden, Germany, 1964. [Google Scholar]
  44. Christian, H. Neue Antriebsvariante für den Elektro-SUV: Der Audi e-tron 50 quattro; Audi Media Center: Ingolstadt, Germany, 2019. [Google Scholar]
  45. Kaplan, R.S.; Anderson, S.R. Time-Driven Activity-Based Costing 2003, 1–18. Available online: https://papers.ssrn.com/sol3/papers.cfm?abstract_id=485443 (accessed on 29 March 2023).
  46. Cooper, R.; Kaplan, R.S. Measure Costs Right: Make the Right Decisions. Harv. Bus. Rev. 1988, 66, 96–103. [Google Scholar]
  47. Horváth, P.; Mayer, R. Prozesskostenrechnung. Der neue Weg zu mehr Kostentransparenz und wirkungsvolleren Unternehmensstrategien. Controlling 1989, 1, 214–219. [Google Scholar]
  48. Mayer, R. Prozesskostenrechnung: State of the Art, 2nd ed.; Horvath & Partner GmbH, Ed.; Franz Vahlen GmbH: München, Germany, 1998. [Google Scholar]
  49. John, H.; David, W. Economies of Scale in Industrial Plants. J. Political Econ. 1967, 75, 373–385. [Google Scholar]
Disclaimer/Publisher’s Note: The statements, opinions, and data contained in all publications are solely those of the individual author(s) and contributor(s) and not of MDPI and/or the editor(s). MDPI and/or the editor(s) disclaim responsibility for any injury to people or property resulting from any ideas, methods, instructions, or products referred to in the content.
Figure 1. The ideal battery lifecycle with the four pathways for an efficient circular economy approach based on [5].
Wevj 14 00110 g001
Figure 2. The process of second-life determination [5].
Wevj 14 00110 g002
Figure 3. Downstream process map for used traction battery systems.
Wevj 14 00110 g003
Figure 4. Visualization of recycling technologies.
Wevj 14 00110 g004
Figure 5. Cost model for CBA with in- and output variables.
Wevj 14 00110 g005
Figure 6. Cost distribution for the reuse scenario under standard cost assumptions.
Wevj 14 00110 g006
Figure 7. Cost distribution for the repurpose scenario under standard cost assumptions.
Wevj 14 00110 g007
Figure 8. Cost distribution for the recycling (NMC) scenario under standard cost assumptions.
Wevj 14 00110 g008
Figure 9. Cost distribution for the recycling (LFP) scenario under standard cost assumptions.
Wevj 14 00110 g009
Figure 10. Cost–benefit analysis of the business case related to a processed battery pack for (a) reuse and (b) repurpose (non-scaled state-of-the-art process design).
Wevj 14 00110 g010
Figure 11. Cost–benefit analysis for the recycling business case related to a processed battery pack using (a) NMC cathodes and (b) LFP cathodes (non-scaled state-of-the-art process design).
Wevj 14 00110 g011
Figure 12. Sensitivity analysis: influence of the value loss in relation to the purchase price on the cost–benefit balance.
Wevj 14 00110 g012
Figure 13. Sensitivity analysis: influence of the sales price in relation to the purchase price on the cost–benefit balance.
Wevj 14 00110 g013
Figure 14. Sensitivity analysis: influence of the battery purchase cost under standard assumptions on the cost–benefit balance.
Wevj 14 00110 g014
Figure 15. Sensitivity analysis: influence of throughput per year of retired EVs on the cost–benefit-balance for (a) LFP cathodes and (b) NMC cathodes.
Wevj 14 00110 g015
Table 1. Decision criteria and application results embedded in the process model.
Received GoodsClassificationApplication
Processed StateArchitectureMethodSOCSOH
EVPackModuleCMPCTPEV (BMS)Pack (BMS)Module (CC)Deep
discharge
OK<
80%
>
80%
x x x x xReuse
x xx x x
x x x x x
x x x x x
x x x x xRepurpose
x x x x x
x x x x
x x x xx
x x x xx
x x xx
x x xx Recycling
x x xx
x xx
x x
x x
x x
Table 2. General assumptions for the standard cost base approach.
Area of AssumptionAssumption
Overall
  • One worker operation in the disassembly line
  • The disassembly line has a pilot character and relies on manual labor
  • One-shift operation
  • Process capacities dependent on the process with the lowest capacity
  • The estimated purchase cost of a retired traction battery: 75 EUR/kWh
Reuse
  • Classification by BMS read-out without pack removal from the car
  • SOH-value: >80%
  • Value loss of reused pack: 50%
Repurpose
  • Cell-to-module architecture
  • SOH value: >80% for every module
  • Energy storage cabinets capacity: 50 kWh
  • Sales price: 500 EUR/kWh
Recycling
  • Detection of recycling suitability at the first possible occasion (detection of depth discharge)
  • No initial purchase costs for retired batteries
  • Cathode chemistry:
    NMC-811
    LFP
  • Cell housing: steel
  • Cell format: prismatic
Disclaimer/Publisher’s Note: The statements, opinions and data contained in all publications are solely those of the individual author(s) and contributor(s) and not of MDPI and/or the editor(s). MDPI and/or the editor(s) disclaim responsibility for any injury to people or property resulting from any ideas, methods, instructions or products referred to in the content.

