Article

Analysis of Charging Infrastructure for Private, Battery Electric Passenger Cars: Optimizing Spatial Distribution Using a Genetic Algorithm

Chair of Methods for Product Development and Mechatronics, Technische Universität Berlin, Straße des 17. Juni 135, 10623 Berlin, Germany
*
Author to whom correspondence should be addressed.
World Electr. Veh. J. 2023, 14(2), 26; https://doi.org/10.3390/wevj14020026
Submission received: 10 November 2022 / Revised: 9 December 2022 / Accepted: 11 January 2023 / Published: 18 January 2023

Abstract

:
To enable the deployment of battery electric vehicles (BEVs) as passenger cars in the private transport sector, suitable charging infrastructure is crucial. In this paper, a methodology for the efficient spatial distribution of charging infrastructure is evaluated by investigating a scenario with a 100% market penetration of BEVs of (around 1.3 million vehicles) in Berlin, Germany. The goal of the evaluated methodology is the development of various charging infrastructure scenarios—including public and private charging—which are suitable to cover the entire charging demand. Therefore, these scenarios are investigated in detail with a focus on the number of public charging points, their spatial distributions, the available charging power, and the necessary capital costs. For the creation of these charging infrastructure scenarios, a placement model is developed. As input, it uses the data of a multi-agent transport simulation (MATSim) scenario of the metropolitan area of Berlin to evaluate and optimize different distributions of charging infrastructure. The model uses a genetic algorithm and the principle of multi-objective optimization. The capital costs of the charging points and the mean detour car drivers must undertake are used as the optimization criteria. Using these criteria, we expect to generate cost-efficient infrastructure solutions that provide high usability at the same time. The main advantage of the method selected is that multiple optimal solutions with different characteristics can be found, and suitable solutions can be selected by subsequently using other criteria. Besides the generated charging scenarios for Berlin, the main goal of this paper is to provide a valid methodology, which is able to use the output data of an agent-based, microscopic transport simulation of an arbitrary city or area (or even real driving data) and calculate different suitable charging infrastructure scenarios regarding the different optimization criteria. This paper shows a possible application of this method and provides suggestions to improve the significance of the results in future works. The optimized charging infrastructure solutions for the Berlin scenario show capital costs of between EUR 624 and 2950 million. Users must cover an additional mean detour of 254 m to 590 m per charging process to reach an available charging point. According to the results, a suitable ratio between the charging points and vehicles is between 11:1 and 5:1. A share of fast charging infrastructure (>50 kW) of less than ten percent seems to be sufficient if it is situated at the main traffic routes and highly frequented places.

1. Introduction

Over the last decade, air pollution in cities and greenhouse gas (GHG) emissions continued to increase worldwide. To slow down this development and reduce the negative impact on human health and global warming, governments, particularly those in industrialized countries, are seeking technological solutions to reduce their overall GHG emissions. One of the biggest emitters of pollutants and GHGs is the motorized individual transport industry [1]. The European Union has continuously tightened the emission limits for the transport sector since the introduction of the Euro 1 exhaust emission standard in 1992 [2]. Furthermore, the German government aims to reduce GHG emissions in the transport sector by 2030 by 40% compared to 1990 [3]. To reach this goal, alternative power train concepts are needed. Therefore, the German government focuses on the promotion of electric mobility. The preferred strategy for the private transport sector is the deployment of battery electric vehicles (BEVs). The Climate Protection Program 2030 of the German government constitutes, inter alia, objectives for the expansion of charging infrastructure in Germany. It is assumed that there will be approximately ten million BEVs in Germany by 2030. To supply these vehicles with the necessary electric energy, one million charging points should be erected. According to these assumptions, a ratio of vehicles to charging points of 10:1 would be appropriate [4]. These plans show that the expansion of charging infrastructure is crucial for the transition to electric mobility. However, it remains difficult to determine an exact number of necessary charging points and power due to diverse variables: technical factors such as charging time, which, in turn, is determined by the battery capacity of the car, state of charge of the battery, and available charging power, as well as non-technical factors such as the charging behavior of users.
The authors of this paper developed an algorithm that uses genetic optimization to automatically place the required charging infrastructure to supply BEVs in densely populated areas and applied it to the urban area of Berlin. This approach provides information about the number of required charging points, their usability, and the spatial distribution of the charging infrastructure. To verify the functionality of the developed algorithm, it is used to investigate the required charging infrastructure in the city of Berlin. The input data for the algorithm is provided by the Open Berlin Scenario created with MATSim, an agent-based, microscopic transport simulation [5]. In the investigated scenario, it is assumed that all private passenger cars in Berlin and Brandenburg are BEVs. Private vehicles registered in Brandenburg are considered to account for the impact of commuters on the availability of public charging infrastructure. The results of the simulation of the MATSim Open Berlin scenario contain the full day plans of agents that represent the populations of Berlin and Brandenburg aged 18 and above according to the Zensus 2011. The scenario realistically represents the traffic in the city of Berlin and contains all relevant forms of traffic, e.g., walking, riding a bicycle, private cars, and public transport. The public transport schedule is based on a real schedule [5].
It is important to mention that the vehicles used in the MATSim scenario are conventional vehicles with internal combustion engines. Therefore, the activities of the day plans do not include the charging of the BEVs. The authors of this paper use the developed algorithm to find suitable charging infrastructure without changing the daily plans of the agents, which are based on the usage of internal combustion engine vehicles (ICEVs). Applied to the real world, this means that a switch from ICEVs to BEVs would not imply any change in the mobility behavior of traffic participants.

2. State-of-the-Art Works

With the prospect of ever-increasing numbers of BEVs in metropolitan areas worldwide, strategic planning of charging infrastructure is becoming the focus of urban planning, policy making, and academia. One major problem is the spatial positioning of the infrastructure. Consequently, a large number of publications have been issued in the past decade that use different data sources, different methodological approaches, different levels of detail, and different degrees of realism to approach this problem. Due to a large number of published studies and the importance of the research topic, several major metastudies have been published in recent years. Since the aim of this report is not to conduct another comprehensive literature review but rather to further explore the research topic and present relevant new findings, we refer in this section to the most important metastudies and summarize their findings to outline the need for further research. Afterward, we highlight some of the most recent studies in order to better define the area of research and, with the help of these examples, show the different directions of electric vehicle (EV) charging research and highlight the existing shortcomings.
Pagany et al. [6] identified 119 studies published between 2010 and 2016 that addressed the spatial positioning of charging infrastructure. Only about half of these publications used empirical data and referred to real use cases, whereas the other half merely developed mathematical models and tested them in synthetic environments. A major problem is seen in the availability of data. Many of the empirical studies were based on statistical and census data, whereas others used very limited data sets with real trajectories such as cabs (compare [7]). The latter usually used data sets from ICEVs and assumed the unchanged usage behavior of users when switching to BEVs. An important distinguishing factor of the studies examined is their orientation to either travel routes (trip from point a to point b) or users and their points of interest (work, housing, shopping, leisure activities) as a basis for the placement of infrastructure. At present, there is a lack of approaches that link trips to specific consumption levels and times spent at points of interest. It is also noted that almost all studies optimized infrastructure based on cost parameters. Other factors, such as the walking distance between charging stations and the actual point of interest, are mentioned here as possible further optimization variables for future research. Finally, it is pointed out that there is still a research gap in the modeling of charging times and different charging powers, as this is a consideration in very few studies. A shift from studies based on one optimization parameter and a limited database to integrated studies is suggested.
Khadem et al. [8] analyzed 58 studies between 2013 and 2019. One finding obtained in this meta-analysis was that in recent years, an increasing number of publications have focused on mathematical approaches, such as the genetic algorithm (GA) and multi-objective GA, as well as heuristic approaches. Very few recent studies relied on different approaches such as behavioral models. The greatest potential for the further improvement of studies on the spatial allocation of charging infrastructure is the consideration of different charging powers and the resulting duration of the charging process. In addition, the travel frequency and trip length should be included in the considerations. Another important aspect mentioned was the user acceptance of certain locations for the infrastructure.
In the most recent study considered here, Unterluggauer et al. [9] conducted a comprehensive analysis of 49 studies between 2013 and 2022 considering the placement of charging infrastructure, with a focus on studies that also considered the energy grid. As a summary of their study, they formulated several directions in which further research should be oriented. The first research gap identified was that planning objectives were mainly focused on the minimization of grid losses and infrastructure costs. So far, there have been insufficient probabilistic approaches that would also be able to temporally and spatially resolve network usage, and thus identify the need for network reinforcement. In addition, increasing the level of detail on the demand side in future studies was proposed. So far, many studies have used simple models for traffic that cannot represent real situations. Therefore, the complex effects of real traffic systems cannot be adequately represented. Another important finding was that too few studies have examined different charging performance. Finally, the authors suggested that a more realistic focus of the studies should be achieved in general, instead of merely underpinning the theoretical problems with simplified example networks.
The study by Iqbal et al. [10] is a good example of studies on EV charging that focus primarily on the distribution network while neglecting the implications and effects of transport systems. Here, a strong emphasis was placed on how vehicles can be charged to reduce grid congestion. As is common in vehicle-to-grid (V2G) research, the desired effects, such as peak shaving through various smart charging strategies, are being investigated. However, the aspect of the vehicles was treated very theoretically. The load profiles were generated by stochastic simulations (Monte Carlo and Markov chains) and it is not possible to draw conclusions about a real traffic system, neither in terms of the charging demand of individual drivers nor the geographical distribution of charging stations and the required charging power.
Another recently published survey on the impact of BEV charging on the distribution network is [11]. However, compared to the aforementioned study, this approach mapped the transportation system in great detail. The study area was divided into cells and based on publicly available data such as average household income and building types within the cells; the traffic flow between the cells was determined in order to estimate the energy demand within the cells. The resulting energy requirements can be used to plan the network and develop and test intelligent charging strategies. However, this methodology did not provide a view of the individual vehicles and individual charging stations, as well as their locations and charging powers. Consequently, it is not possible to draw sufficiently precise conclusions about the specific positions, required charging capacity, and associated costs for charging infrastructure, though this was not the objective of the authors.
Some approaches used either heuristic approaches [12] or genetic algorithms [13] to position the charging infrastructure, similar to the study by [11] presented above; however, they did not use exact positions, but rather cells. One approach used in these two publications involved voronoi cells. This method can save computing time, but the resolution of the results in larger cells is also very inaccurate.
The study by Efthymiou et al. [14] had a strong focus on the placement of individual stations and used a genetic algorithm; thus, it is comparable to the research presented here. For the use case of the city of Thessaloniki in Greece, a genetic algorithm was used to position the charging infrastructure. However, a very reduced approach was chosen. First, only the expected electrification level of the fleet in 2020 was assumed, which was just 5%. This meant that there were very few vehicles that needed to be charged and the entire optimization problem was less complex. It was expected that only at higher levels of electrification (especially 100%) would significant optimization problems arise. In addition, different charging powers were not considered and only the positions, but not the number of stations, were optimized. The latter was an input variable through which manual iteration was performed. Overall, it can be said that this study presents a solid approach, which should, however, be exploited much more intensively.
A considerably more elaborate study was presented by Armas et al. [15]. Here, charging infrastructure optimization was carried out for a city in Ecuador with the aid of a genetic algorithm and the traffic simulation MATSim. The optimization was based on the total travel time of the agents who wanted to charge and on the number of charging stations required. However, it is also notable that with only 5000 vehicles, a very limited number of vehicles was considered in relation to the total number of vehicles in the observed area. In addition, different types of charging stations were not considered.
In summary, a number of lessons and challenges for further research can be derived from the metastudies, as well as the exemplary studies, reviewed. First, a trend toward nature-inspired optimizers such as the genetic algorithm has been observed in recent years. Many studies have shown that these algorithms are well suited for the present research topic of charging infrastructure positioning. Furthermore, all of the studies examined agreed that future research should focus more on demand, i.e., the underlying traffic model or traffic data used. It has been shown that in order to increase the plausibility and realism of the results, real or at least very realistic input data must be used to correctly represent the complexity of traffic and the resulting implications for charging. Another research gap identified by all the metastudies is the consideration of different charging powers. This is confirmed by our review. Although this is associated with a more complex optimization task, it enables more realistic results, which can be better used as a basis for planning. The last research gap identified across all the studies is the expansion of the optimization task to include other factors such as the additional distance to the actual destination if a specific charging infrastructure is chosen. This makes it possible to present and consider the benefits of the planned infrastructure to drivers. In [15], the distance was considered as an optimization parameter, but this referred to the entire traveled distance of the agent, not the necessary detour used to travel to the charging station.
In this study, we plan to address these research gaps by using the detailed travel patterns of an agent-based microscopic transport simulation as the input for a genetic, multi-criteria optimization of charging infrastructure placement, considering the different charging powers and optimizing both the infrastructure costs and necessary detours for the users.

3. Methodology

To investigate the need for charging infrastructure in Berlin, the charging decisions of agents based on the MATSim output and certain infrastructure scenarios are simulated. The resulting data are used to optimize the infrastructure scenarios, using a genetic algorithm (GA) with multi-objective optimization (MOO). To optimize the quantity and the distribution of charging infrastructure, in the first step, it is necessary to define an optimization problem with suitable optimization criteria and choose an optimization method (p. 517 f. in [16]). Furthermore, an electric vehicle population is required, considering the real distribution of vehicle classes in Berlin and Brandenburg. Moreover, a GA needs a starting population of solutions to start the optimization. The starting population can have a high influence on the optimization process and should be appropriate for the optimization problem. Figure 1 shows a principal visualization of the genetic optimization procedure.
In addition, it is crucial for the simulation to develop a charging decision model that determines the criteria for starting a charging process.

3.1. Optimization Problem

There are many possible criteria to evaluate the quality of electric charging infrastructure [17]. These criteria can be divided into the following categories: operator, power grid, and traffic flow. The operator category should mainly represent the economic interests of the operator of the charging infrastructure. The main criteria used to evaluate the charging infrastructure are the capital costs, operating costs, and occupancy rate of the charging infrastructure. The latter is crucial for estimating the possible return on investment for the operator. The power grid category represents the limits of the available power supply grid. Here, the decisive criteria are the available installed power at the locations of the charging infrastructure and the total load on the power supply grid. Furthermore, the traffic flow category should represent the usability of the charging infrastructure, which determines the grade of acceptance by the users of the charging infrastructure. The criteria for the traffic flow category are the detours that agents have to make to reach the next available charging point and the number of vehicles not able to cover their charging needs. This means that a vehicle would need to reach a state of charge (SOC) of zero percent. To minimize the complexity of this first version of the developed algorithm, only two criteria are chosen for the optimization. In further studies, however, it will be possible to add additional criteria with moderate effort. The main criteria of the GA are the capital costs and the detours that are necessary to make to reach the next available charging point. Hereafter, this is called the agent detour. The goal is to minimize both of these criteria. These criteria are suitable for the evaluation of the charging infrastructure, and their use allows for a search for the best compromise between economic efficiency and the usability of the charging infrastructure. Since this paper does not aim to figure out how to operate the charging infrastructure in a way that is profitable for the operator, the operating costs and occupancy rate of the charging infrastructure are not considered. Moreover, the limits of the currently available power supply grid in the city of Berlin are not considered in this paper.

3.1.1. Optimization Method and Genetic Algorithm

For the problem at hand, multi-objective optimization is used. MOO allows us to find any number of optimal solutions in relation to the criteria used. This results in solutions with very high capital costs and low agent detours and vice versa, with other Pareto-optimal solutions in between. Specifically, one solution of the described optimization is a specific distribution of charging infrastructure across the area of the city of Berlin. The solutions contain the number of charging points, their charging powers, and their locations. MOO can optimize according to multiple criteria at the same time, and a weighting of the criteria is not necessary. A Pareto-optimal solution dominates other solutions and is not dominated by other solutions. Domination means that a solution is at least equal in all objective function values and better in at least one objective function value than the solution it is compared with [16]. To evaluate the most suitable Pareto-optimal solutions for the present use case, further information, which is not considered during the optimization of the GA, must be included. This shows that it is reasonable to find many solutions distributed over the whole search space. Figure 2 shows an example of a front of Pareto-optimal solutions in relation to the criteria chosen for optimization.
The GA used to execute this optimization is called an elitist Non-Dominated Sorting Genetic Algorithm (NSGA-II). It is chosen due to the fact that in addition to a mechanism that preserves the best individuals of a population, it contains a mechanism for the preservation of the diversity of the population. The principle of the NSGA-II is described by Dan Simon in [16].

3.1.2. Criterion One: Capital Costs

The capital costs are determined by the number of charging points and their installed power. The prices of the charging points are fixed depending on the installed power. The assumed costs for each charging point are shown in Table 1. The charging infrastructure is divided into normal charging (≤22 kW) and fast charging (≥50 kW). The distinction between normal and fast charging in this work is based on the kind of current mostly used for these charging powers, which is an alternating current (AC) for normal charging and a direct current (DC) for fast charging.
The chosen charging powers are based on the charging powers mentioned in the Nationale Plattform Zukunft der Mobilität in [19]. The economies of scale for the charging infrastructure are not considered in this paper, and the stated costs for the different solutions of the GA are rough estimations. Primarily, the capital costs are used to compare the solutions in terms of their optimization.

3.1.3. Criterion Two: Agent Detour

The agent detour means the detour an agent has to make to reach the next available charging point. This situation occurs if there is no charging point available at the arrival link of the agent. If there is an available charging point at another link within a previously specified, maximum distance, the agent makes a decision about whether it is worth making the detour to execute a charging process. The charging decision model is explained below. The mean value of all the detours that the agents made during the simulation represents the criterion agent detour. The detour is calculated by a Dijkstra algorithm from the center of the arrival link to the center of the link with an available charging point [21]. The detour is only made theoretically. The agent does not change his/her daily plans in the MATSim simulation. This means he/she starts his/her next tour at the original arrival link and not at the link where the vehicle was charged. Due to this fact, the agent does not consume energy to make the detour. However, the length of the detours is limited to 1000 m. Thereby, the impact of the detour on energy consumption can be neglected. For the investigations made in this paper, the acceptable detour is set to 500 m, whereas the maximum detour is set to 1000 m. The chosen values refer to the traffic survey SrV Berlin. According to this survey, the mean distance of all walking trips is approximately 900 m [22]. Therefore, it seems plausible to set the acceptable and maximum detour to the aforementioned values. Nevertheless, sensitivity analyses will be necessary in future work to gain more information about the influence of the different accepted detours on the results.

3.2. Electric Vehicle Population

The agents in the MATSim Open Berlin scenario use ICEVs by default. Therefore, it is crucial to specify the different types of BEVs for the simulation. These vehicles are divided into four different classes according to the Kraftfahrtbundesamt (KBA). The share of these classes in the total number of vehicles was shown in a study by the Bundesministerium für Verkehr und digitale Infrastruktur. The distribution of the vehicle classes is shown in Table 2.
The share of the nonassignable class is distributed equally among the four other classes. A representative and currently on the market available BEV is assigned to each class. The attributes of these vehicles are used for the simulation in the GA. The chosen vehicles are shown in Table 3.
The data on the energy consumption of the vehicles refer to real data from tests of the ADAC [28]. The results of these tests show the average energy consumption divided into the categories of inner city (ic), out of town (ot), and motorway (mw). The links of the MATSim model are assigned to one of those categories according to their speed limit. So, it is possible to adapt the energy consumption of the vehicles during the simulation of the GA according to the link they drive on. Moreover, the energy losses during the charging process should also be considered. Since it is not possible to determine a universally valid value of charging losses due to the differences in the vehicles and, e.g., environmental factors, this study uses empirical data from the ADAC for which the effective amount of energy needed to charge 15 different BEVs was measured. The results ranged from 9.9% to 24.9%. For the calculations in this paper, an average of 16% is used for each charging process [29]. Furthermore, a charging process of up to 80% can be seen as nearly linear, but thereafter, the charging speed decreases drastically [30]. Therefore, the vehicles are only charged up to 80% of their available battery capacity. This especially applies to high charging powers, but the authors of this paper made the conservative assumption that vehicles that use normal charging are also only charged up to 80%. Permitting charging to a higher SoC would lead to fewer charging infrastructure requirements, which is considered less problematic than overestimating the performance of the charging infrastructure. Another reason is that unpredictable factors of influence, which may increase the energy consumption of vehicles in the real world, can be mitigated. However, in this scenario, it is also assumed that the vehicles can be charged with every charging power mentioned in Table 1, even if the real possible charging power is lower than 150 kW. The reason is that the authors of this paper assume that in a future scenario, where BEVs have a very high share of motorized individual transport (MIT), it is very likely that every BEV could handle charging powers of up to 150 kW. This assumption is supported by the 2018 progress report of the Nationale Plattform Zukunft der Mobilität, which explains that there will be many new models of BEVs supporting charging powers of 150 kW or higher [31].

3.3. Starting Population for Genetic Algorithm

The creation of a starting population is crucial for running a genetic algorithm [16]. It is the first population of solutions that the optimization starts with. The results shown in this paper are from a simulation with a population size of 20 solutions. Since the population size does not change over the generations, it is necessary to create a starting population with 20 solutions or 20 different charging infrastructure scenarios. The initial charging infrastructure scenarios are created in a random procedure. Figure 3 shows an exemplary illustration of a solution of the GA. One solution represents one distribution of the charging infrastructure, and each link in the network represents a gene that can be modified by the GA in terms of the number or power of charging points.
For the creation of the starting population, a random number of charging points with a specific charging power is assigned to each link. A link can receive one kind of normal charging point (3.7 kW, 11 kW, 22 kW) and one kind of fast charging point (50 kW, 150 kW) at the same time. However, the number of charging points is limited by two factors. The first factor is the length of the link, that is, it should be considered that the vehicles need a specific amount of space for parking. Since 90% of public parking lots in Berlin are aligned longitudinally with streets and have a length of at least five meters, it is assumed that a link can contain one charging point per 50 m length. It should be mentioned that one charging point in the simulation corresponds to ten charging points in a real situation due to the fact the MATSim scenario works with ten percent of the traffic volume. The second limiting factor is the maximum number of activities at a link that are executed at the same time. This assures that a link with a maximum of n activities executed simultaneously at any time of the day is assigned a maximum of n charging points. The solutions that should be optimized only contain public charging points, but the availability of home chargers is also considered. Since in Berlin, 40% of the population have access to a private parking space, home chargers are assigned randomly to 40% of the agents with home links in Berlin. In Brandenburg, only 13% of the population does not have access to a private parking space [23]. Therefore, every agent with a home link in Brandenburg receives a home charger. Another reason to assign a home charger is that there are no charging points in Brandenburg within the scenario. Thus, a home charger is the only way to charge for agents who only conduct trips in Brandenburg. Agents with home chargers can charge at their home link regardless of the available public charging points and start with a 100% SoC, whereas agents without home chargers start with an SoC of between 50% and 90%. This increases the plausibility of the scenario. Furthermore, the quality of the results of the optimization can be improved by a suitable starting population. Therefore, the vehicle-to-charging-point ratios of the solutions of the starting population are oriented toward a reference value of 10:1. As described in Section 1, the Bundesregierung assumes this value to be suitable for the charging infrastructure. The first generation of the GA used for the simulation in this paper shows ratios between 23:1 and 6:1. Note that a generation of the GA contains two populations, the parents, and the offspring. That means that the first generation contains 20 parents (starting population) and 20 offspring, which were created in the initial running of the simulation. A generation contains parents and offspring so it is able to preserve the best individuals of the parent population if they are better than the offspring.

3.4. Charging Decision Model

To determine when the agents decide to charge their vehicle, a charging decision model is necessary. This is derived from the charging decision model in Figure 4 [17] Before the decision model is used, it is checked whether the agent is at his/her home link and has a home charger. If this applies, the agent charges the vehicle with a power of 11 kW. This charging power seems to be suitable for home charging, considering the longer standing times. Moreover, in Germany, the installation of a wall box with up to 11 kW charging power does not require registration with the local network operator [32]. If the agent does not charge at home, the charging decision model is applied. At first, it is checked whether the charging process can be precluded. Therefore, the detour to the next available charging point is determined. If there is an available charging point at the arrival link, the detour is set to zero. Otherwise, it is calculated as described in Section 3.1.3. The charging process is precluded if there is no available charging point within the maximum distance, the parking time is less than the minimum parking time, or the SOC of the vehicle is higher than the maximum SOC that the vehicle can be charged up to. These limits have to be set by the user before the start of the algorithm. If one of these criteria applies to the situation, no charging process is executed. Otherwise, the necessity of the charging process is checked. A charging process is necessary if the SOC falls below the minimum SOC or the range of the vehicle is less than the length of the next tour of the agent. In this case, the agent charges his/her vehicle. If a charging process is not necessary, it has to be decided whether the charging process is possible. A charging process is possible if the detour falls below the tolerated distance set by the user or if the agent does not have a home charger. If this applies, the agent also charges his/her vehicle. Otherwise, he/she parks without charging.

3.5. Simulation

Before the simulation can be started, a few input parameters, as shown in Table 4, must be set.
Furthermore, a random seed is used to ensure the reproducibility of the results. A random seed is a number used to initialize a pseudorandom number generator. The random seed used determines the sequence of numbers generated, which means that the algorithm produces the same results in every run if the same random seed is used. The MATSim output data and the starting population serve as input data for the simulation. The simulation uses the network file and the events file of version 5.3 of the MATSim Open Berlin ten percent scenario. The network file is used for the calculation of the detour that agents have to make to reach an available charging point, as described in Section 3.1.3. For the simulation itself, the events file is used. It should be mentioned that most of the data in the events file that are needed for the simulation are pre-processed and stored in an agent-related object to simplify the simulation procedure. The data contain information about, for example, the covered distances, routes, and standing times of each agent.
In the first step of the algorithm, there is an initial run to create the first generation of solutions from the starting population. The first generation consists of 20 solutions from the starting population and 20 offspring of these. The population size of the starting population is freely selectable. Now, the simulation of the MATSim events can be executed for each solution of the generation to gain information about the quality of the charging infrastructure. Crucial for the simulation are the departure and arrival events from the MATSim events file. These events are processed in chronological order. If a departure event is processed, it is checked whether the related agent has charged his/her vehicle. In case he/she did, the charging point he/she occupied is released. If the charging link is different from the departure link, the charging point is released from the charging link and the agent starts his/her next tour at the original departure link. Thereafter, the next tour of the agent is simulated. This means that the new SoC of his/her vehicle after fulfilling this tour is calculated. If the SoC reaches zero percent, this is saved in the agent-related object for subsequent analysis but the agent remains part of the simulation. The processing of the departure event ends here and the next event is simulated. If an arrival event is processed, the agent has to decide if he/she will execute a charging process. The charging decision is already explained in Section 3.4. If an agent decides to charge the vehicle, he/she chooses the highest available charging power. Moreover, one of the available charging points at the related links is occupied until the agent leaves the link. Afterward, the new SoC after the charging process is calculated and the processing of the arrival event ends.
After this procedure is executed for each solution of the generation, the solutions can be compared in terms of the defined criteria. The comparison and the subsequent creation of the new generation are performed by the NSGA-II. This is repeated until the set number of generations has been created and simulated. The final generation should contain mostly Pareto-optimal solutions. The recombination method used is a three-point crossover and the mutation rate is set to two percent. Figure 5 represents the described process.

4. Results

Firstly, an overview of the development of the solutions across the generations of the GA is given. Subsequently, the results of the final generation are described and compared to the first generation. Finally, three different solutions of the final generation are described in detail.

4.1. Development across Generations

Since the results were calculated with only ten percent of the population of Berlin, they were multiplied by ten to obtain results relevant to the full population. Figure 6 shows the development of the generations of solutions across the 100 generations.
The color of the data points indicates the front of solutions to which a solution was assigned. Front zero means that the solution was non-dominated or Pareto-optimal. Generation one showed the influence of the randomly created starting population. Only a few solutions were assigned to front zero. Furthermore, there were more fronts of solutions compared to the later generations. This means that there were more unsuitable solutions, which were dominated by one or more other solutions. After five generations, the functionality of the algorithm was already visible. Many of the dominant solutions were sorted out. This resulted in fewer fronts of solutions and more solutions in front zero. After 50 generations, the algorithm tried to reduce the mean detour of the agents, whereas the minimum capital costs remained the same. Notably, the solution with the lowest capital costs remained consistent across all generations. This means that no cheaper solutions with a comparable mean detour were found. Moreover, the crowding distance mechanism of the NSGA-II prevented this solution from accidentally becoming lost by preferring edge solutions. Additionally, this mechanism ensured that the solutions were well distributed over the search space. The last generations contained only two different fronts. Most of the solutions were situated in front zero. These solutions became the potential solutions to the optimization problem. Figure 7 shows more details of the development of the key values of the solutions.
The values refer to the mean value of all 40 solutions of a generation. Firstly, the algorithm started to sort out expensive and non-optimal solutions. This resulted in lower capital costs and fewer detours, although the solutions contained more charging points. It is interesting that the average mean detour decreased, whereas the average total detours increased. This can be explained by the fact that solutions with few charging points or inappropriate spatial distribution of charging points were sorted out. In those solutions, fewer charging processes were executed because there was often no charging point available for the agents. No charging process also means no detour. Therefore, the mean detour decreased due to better distributed charging infrastructure, whereas the total detours increased due to a higher total number of charging processes. In generation one, 700,000 charging processes were executed compared to 900,000 charging processes in generation five. The development from generation 5 to generation 75 showed a continuously decreasing mean detour and total detours, whereas the number of charging points and the capital costs continuously increased. This development was inverted from generation 75 to 100 since the number of charging points slightly decreased.

4.2. Results of the Final Generation

Generation 100 was the final generation of the simulation reviewed in this paper. The solutions situated in the optimal front of this generation can be considered equivalent, possible solutions to the optimization problem. Below, the results of this generation are analyzed. Table 5 shows the mean values of the different parameters of generation 1 and generation 100.
The number of charging points of the solutions in generation 100 ranged from 112,040 to 379,690. This was, on average, twice as much as in generation one. The ratios of vehicles to charging points were between 3:1 and 11:1. The mean capital costs increased by approx. 32% to EUR 2.8 billion, whereas the mean detour decreased by approx. 30%. However, the total detours increased by 3%. This contradictory development is due to the increase in the charging processes by 50%. As a consequence of the higher number of charging points, the temporal occupation rate decreased slightly. Nevertheless, the quality of the charging infrastructure improved according to the increased mean SoC after the last trip and the decreased number of agents, which reached an SoC of zero percent. Moreover, the share of fast charging infrastructure with charging power above 50 kW decreased from 20.8% to 10.1%. In generation 100, there were no outliers. This shows the extraordinarily high share of fast charging infrastructure. This share ranged from 2.9% to 14.3%. Figure 8 shows the solutions of generation 100. The correlation between the capital costs and the mean detour is clearly visible. Considering the chart on the right, one point can be identified where the reduction in the charging points led to more detours of lengths above the maximum distance, thereby leading to more agents declining charging processes.

4.3. Analysis of Different Solutions of the Final Generation

In this section, 3 out of the 40 solutions of generation 100 are analyzed. These solutions pertain to a solution from the middle of the optimal front and the two edge solutions, one with the highest costs/fewest detours and the other with the lowest costs/highest detours. The analysis of the individual solutions provides information about the specific number of charging points, their charging power and spatial distribution, and the agents’ detours, among other details. Table 6 shows the values of the three analyzed solutions.

4.3.1. Bottom-Edge Solution

Firstly, the bottom-edge solution is analyzed. The solution contained 112,040 charging points. This corresponded to a ratio of 11:1 of vehicles to charging points. Table 7 shows the distribution of the charging points among the different charging powers.
The capital costs for the charging infrastructure amounted to approx. EUR 624 million, which is significantly below the capital costs of the other analyzed solutions. Although the ratio of vehicles to charging points was slightly above the reference value of 10:1 set by the European Parliament, the low capital costs make this solution interesting. This is mainly caused by the low share of fast charging infrastructure of 2.94% and the high number of charging points with a charging power of 3.7 kW. On the downside, the low number of charging points caused more detours for the agents. These were, on average, 590 m for the bottom-edge solution, which means that the detours were above the tolerated distance of 500 m, beyond which the agents will only execute a charging process if it is crucial. This was also reflected in the number of charging processes, which was significantly lower compared to the other analyzed solutions. However, it cannot be determined whether a charging process was not executed because the detour was above the tolerated distance or because it was above the maximum distance. Despite the low number of charging processes, the temporal occupation rate of the charging infrastructure amounted to 40.69%. Furthermore, the mean SoC after the last trip of this solution, which was the lowest value within generation 100, showed that the power supply of the vehicles was slightly below those of the other analyzed solutions. Nevertheless, it can be stated that only 0.5% more agents reached an SoC of zero percent than in the top-edge solution. Overall, 96.95% of agents did not reach an SoC of zero percent. Out of the 40,830 agents who reached an SoC of zero percent, 29,030 lived in Brandenburg and only 11,800 lived in Berlin. A possible explanation for this is that agents may also start their activities in Brandenburg even though there were no public charging points installed there, as this paper only observed the charging infrastructure in Berlin. Agents with home links in Brandenburg were only observed to take into account the influence of commuters, as mentioned in Section 1. In addition, they may only charge their vehicles at their home links (see Section 3.3). Therefore, agents who mainly executed activities in Brandenburg had an increased probability of running out of energy. Another explanation could be that agents with residency in Brandenburg covered longer distances, on average, and there was insufficient charging infrastructure to supply their vehicles. The length of trips where agents reached an SoC of zero percent was approx. 62 km, on average, and the median was 55 km. The total distance traveled by these agents was 193 km, on average, and the median was 184 km. Thus, these agents belong to the five percent of agents who covered the longest distances in one day. Finally, the spatial distribution of the charging infrastructure was investigated. The results are shown in Figure 9. The charging infrastructure was more concentrated in the western part of Berlin than in the east, especially in the districts of Charlottenburg and Wilmersdorf. In the rest of Berlin, the density was rather low and there were few clusters of charging points at single links. In the case of a cluster, the charging points mostly had a charging power of 3.7 kW, for example, in Neukölln, Kreuzberg, and edge districts such as Hohenschönhausen, Reinickendorf, and Köpenick. The sporadic clustering of charging points can be associated with hotspots of activity. The distribution of fast charging infrastructure was similar, but the bottom-edge solution only had a very low share of fast charging points. Furthermore, it is noteworthy that clusters of fast charging points were situated along the Berlin urban highway.

4.3.2. Mid-Front Solution

This solution is situated in the middle of the solution front and represents a trade-off between the bottom- and top-edge solutions. It had 246,630 charging points, which is similar to a vehicle-to-charging point ratio of 5:1 and significantly lower than the reference value from the European Parliament. Table 8 shows the distribution of the charging powers.
The capital costs of the charging infrastructure amounted to approx. EUR 2.95 billion. Furthermore, the share of fast charging infrastructure was 10.8%. Again, most of the charging points had a charging power of 3.7 kW. The higher total number of charging points in this solution led to a significant reduction in the mean detour to 378 m, which had an especially high impact on the total number of charging processes executed and was lower than the tolerated distance. The total number of charging processes amounted to 1,100,340, with a temporal occupation rate of the charging infrastructure of 38.3%. Moreover, there was also an impact on the mean SoC after the last trip of the agents, which in this solution, was 71.58%. This indicated the better power supply of the charging infrastructure. Furthermore, the share of agents who reached an SoC of zero percent was 2.63%. This corresponded to a total number of 35,130 agents. Out of these agents, 24,730 resided in Brandenburg and 10,400 in Berlin. Compared to the bottom-edge solution, the number of agents was lower by 14%. The average length of the journeys of these agents changed only slightly. The mean value was 62 km and the median was 54.5 km. The distance covered over the course of a whole day was, on average, 197 km and the median was 187 km. Moreover, the spatial distribution of the charging infrastructure in this solution was also reviewed and is shown in Figure 10. Compared to the bottom-edge solution, there was a significantly higher density of charging points in all areas. However, the trend in the spatial distribution continued. There were many charging points in western Berlin in the districts of Charlottenburg and Wilmersdorf. In addition, the densities of the charging points were also high in Steglitz, Schöneberg, Tempelhof, and Neukölln. Additionally, there were many more charging points in the center of Berlin compared to the bottom-edge solution. Edge districts, such as Spandau, Reinickendorf, and Köpenick, were supplied significantly better. In these districts, the densities of the charging points were slightly lower, but several clusters of charging points at links were observed. The spatial distribution of the fast charging infrastructure showed a similar trend to the bottom-edge solution and did not deviate from the observations previously mentioned for the normal charging infrastructure. Of note was that bigger clusters of fast charging points at single links appeared, especially in places such as hospitals or train stations near city highways or big parking spaces. Some examples are the Vivantes Klinikum Spandau and the Grunewald city train station near the city highway, which is highly frequented by commuters between Berlin and Potsdam.

4.3.3. Top-Edge Solution

The final investigated solution was the top-edge solution of the final generation. It contained 379,690 charging points in total, which corresponded to a vehicle-to-charging point ratio of 3:1. Table 9 shows the distribution of the different charging powers.
The capital costs of this solution amounted to EUR 5.7 billion and the share of fast charging infrastructure was the highest among the compared solutions at 14.2%. Among the normal charging powers, the proportions were nearly equal. Moreover, this solution showed an increase in the number of executed charging processes, with a total of 1,246,130. However, this increase was small compared to the difference between the bottom-edge and mid-front solutions. In contrast, the temporal occupation rate of the charging infrastructure dropped to 29.07%. The mean SoC after the last trip was 72.11%, which was slightly above that of the mid-front solution. Furthermore, in the top-edge solution, 33,720 agents reached an SoC of zero percent, of whom 23,750 resided in Brandenburg and 10,150 in Berlin. In addition, in this solution, the average length of the journeys in which the agents ran out of energy was nearly the same as in the other solutions. The mean value was 62.0 km and the median was 54.5 km. The total covered distance of these agents amounted to 197 km, on average, and the median was 188 km. Moreover, the spatial distribution of the charging infrastructure was investigated and is shown in Figure 11. It can be stated that in this solution, nearly the whole urban area of Berlin was well covered by the charging infrastructure including the edge districts, where there were no supply gaps. A slight dominance of the western part of Berlin was observed. The tendency for bigger clusters of fast charging points to appear near hospitals, big parking spaces, or train stations near urban highways was also confirmed in this solution.

5. Discussion

The results explained in Section 4 were generated using a genetic algorithm developed by the authors, which uses data from the MATSim Open Berlin scenario. Arbitrary data sources, such as other transport simulation scenarios or real driving data, would be possible but were not used in this study. The goal of this algorithm was to investigate how electrical charging infrastructure could be distributed in urban areas. In this case, we chose Berlin as our investigation area and assumed a BEV market share of 100%.
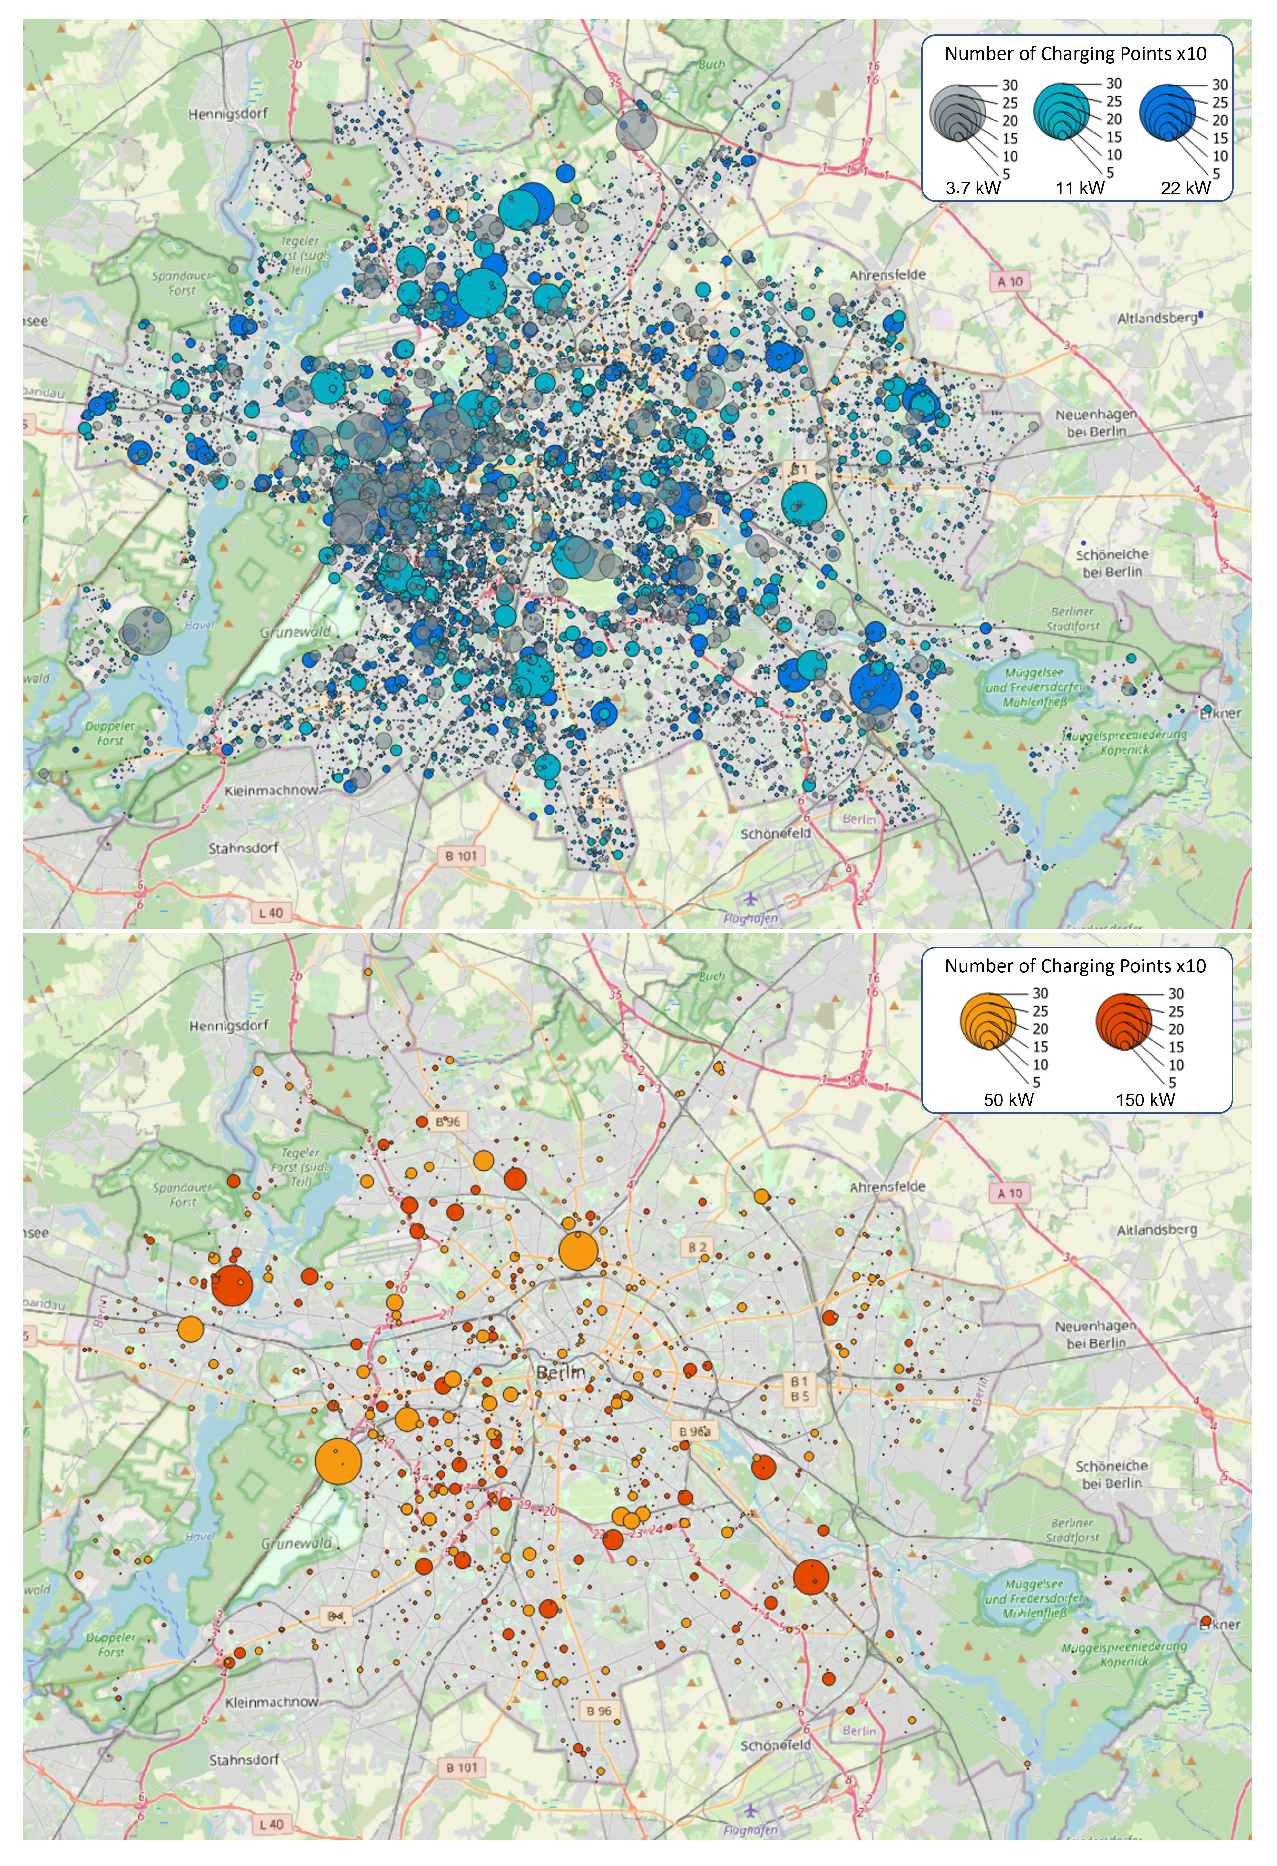
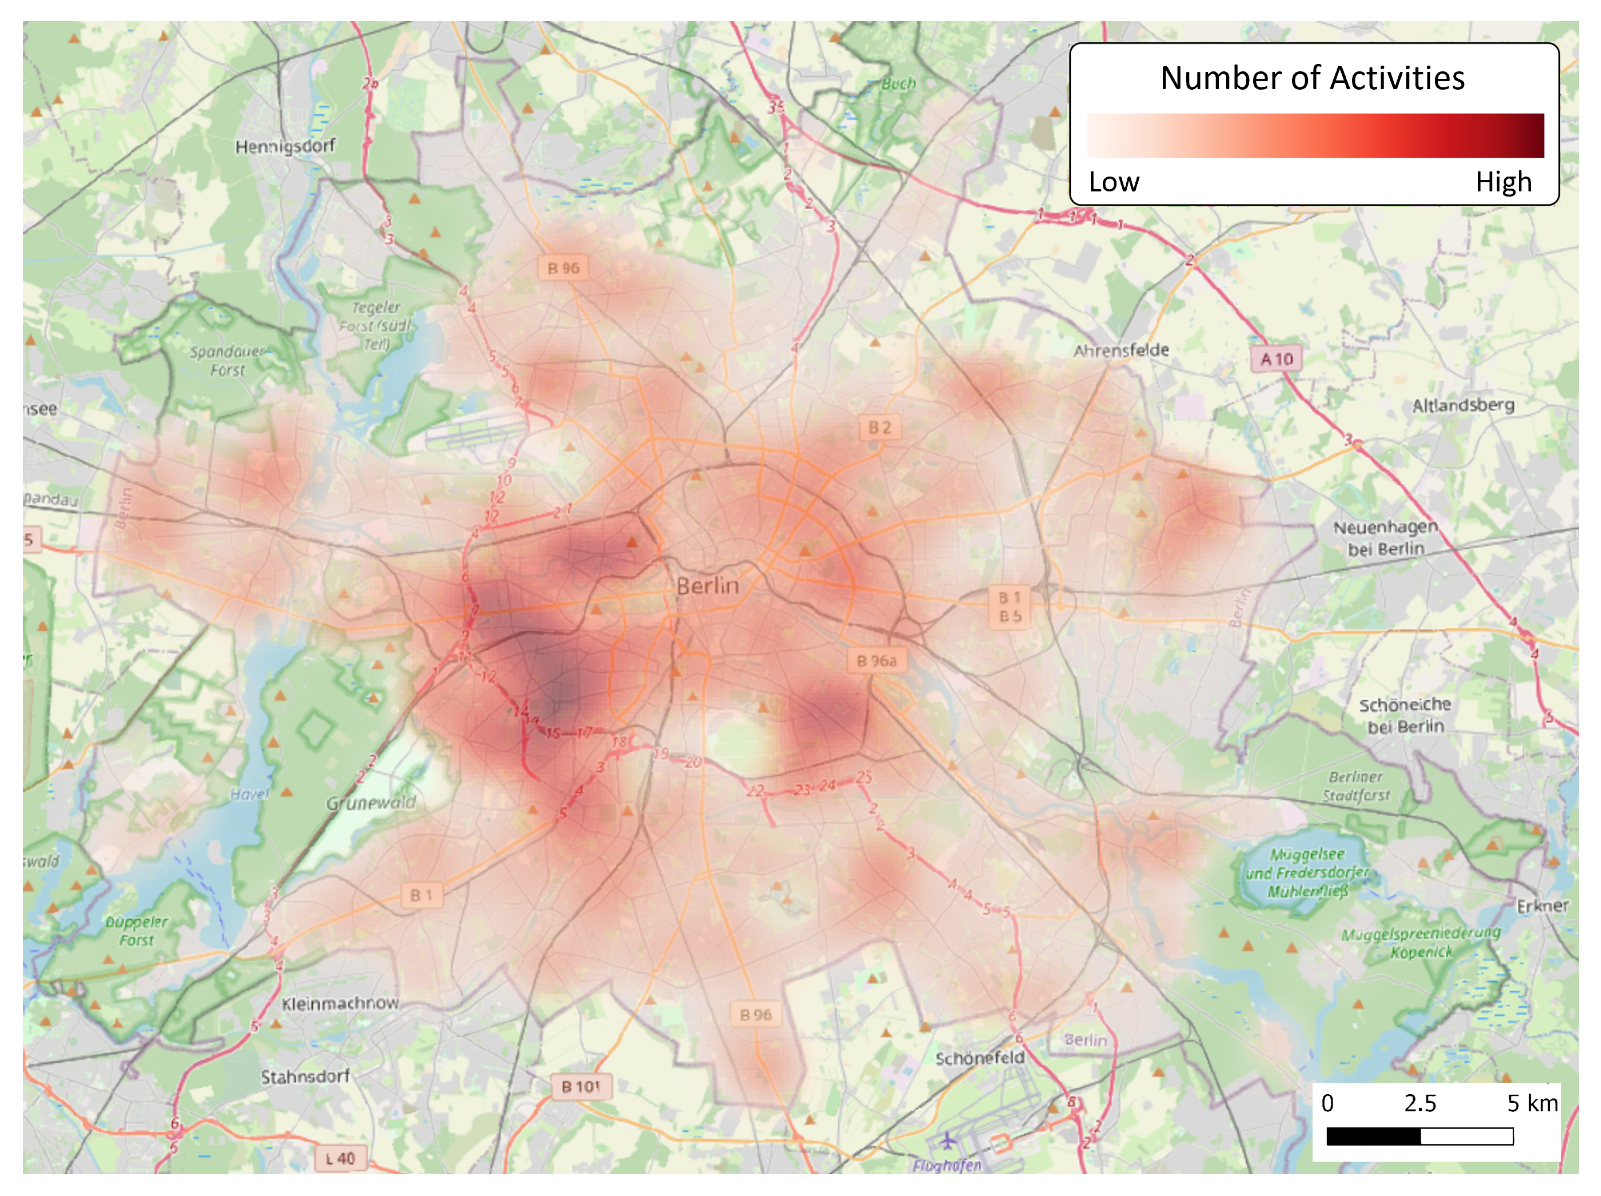
The results of the 100th generation showed charging infrastructure scenarios that had between 112,040 and 379,690 charging points. Charging points with a power of 3.7 kW had the biggest share, with 36.5%, on average, whereas the average share of charging powers of 11 kW and 22 kW was 26.6% and 26.1%. The share of fast charging infrastructure amounted to 10.1%, on average, and was distributed equally for 50 kW and 150 kW. The capital costs were between EUR 624 million and EUR 5.7 billion. Furthermore, the average detours of agents were from 254 m to 590 m across all solutions. Moreover, all solutions were able to cover the energy requirements of most of the agents within the investigated scenario. The highest share of agents that ran out of energy was 3.05%, whereas the lowest share was 2.52%. The investigation of the spatial distribution of the charging infrastructure showed that the solutions prevailed when the charging infrastructure had a similar spatial distribution to the activities of the agents in the MATSim scenario. The distribution of activities is shown in Figure 12. The summarized results are discussed below, together with the used methodology.

5.1. Results

Back in 2014, the directive of the European Parliament for the deployment of alternative fuel infrastructure specified that there should be, on average, at least one charging point per ten vehicles [33]. With a ratio of 11:1 of vehicles to charging points, the bottom-edge solution is closest to this directive among the three investigated solutions. Since this solution is able to supply most agents in the MATSim scenario, the European directive can be scrutinized in relation to the requirements of charging infrastructure in urban areas. Moreover, the saturation effect mentioned by Stroband [17] should be taken into account, which shows that the additionally required charging infrastructure decreases with the increasing market penetration of BEVs. Additionally, it can be assumed that this effect is amplified in densely populated areas, where the distances between charging points are lower compared to rural areas. This is why a vehicle-to-charging point ratio of 11:1 would be appropriate for a city such as Berlin if the market share of BEVs is 100% and the spatial distribution of the charging infrastructure is adequate. From this perspective, the mid-front and top-edge solutions seem to be oversized. To avoid the investigation of these oversized solutions in future works, it would be helpful to set appropriate limits for the search space.
In contrast, the amount of charging points cannot be assessed without taking into account the average detour of agents to the next available charging point, which has a strong influence on the usability and efficiency of the charging infrastructure. Due to a deficiency in the empirical data regarding the operation of the entire charging infrastructure, it is not possible to make a statement about the average detour distance that leads to the highest possible acceptance of the users. Here, it may be useful to draw a comparison to the infrastructure planning of public transport (PT). In the Berlin local transport plan 2019–2023, it is specified that for 90% of the population, the distance from a residence to the next PT station should not exceed 500 m [34]. Another comparative value could be the distance between car-sharing stations. According to Bundesverband CarSharing, a distance of 300 m from one car-sharing station to another is considered very accessible, whereas a distance of 500 m is considered acceptable [35]. These examples all have in common the distances that need to be covered by the user to access the service offered. Therefore, it can be assumed that if there is acceptance of users for other transport services under the given circumstances, there is also acceptance of users of BEVs for the public charging infrastructure under similar circumstances. The mean detour affects the costs of the charging infrastructure significantly. The bottom edge solution with a mean detour of 590 m can be evaluated as still acceptable considering the tolerated distance of 500 m. According to the assumptions of the local transport plan and Bundesverband CarSharing, the mean detour of 590 m is too high for high user acceptance. Considering this, the mid-front and top-edge solutions with mean detours of 378 m and 254 m are preferred. However, these solutions lead to much higher capital costs. Therefore, effective planning of charging infrastructure should consider the detours that lead to high user acceptance. Another aspect of analyzing the agents who reached 0% is the small difference between the solutions despite the major differences in the numbers of charging points and conducted charging processes. One explanation for this is that the MATSim scenario of Berlin lasts only 36 h and agents starting with a high SoC who cover only short distances do not run out of energy within the scenario, even if they have no charger available during their journey.
Moreover, the calculated capital costs for the different charging infrastructure scenarios have to be discussed critically. It is necessary to note that the capital costs should be considered as a rough estimation of the real capital costs. They are primarily used to compare the solutions. Different factors could lead to changes in capital costs. Not considered are, e.g., future price changes and economies of scale, which the acquisition of a large number of charging points could lead to. Furthermore, the calculation of capital costs does not consider that the first charging point at a link is more expensive than the following charging points at the same link. One reason is that certain prerequisites such as transformer stations are only needed once for a certain number of charging points. In addition, this paper does not consider investment for the expansion of the power grid, which would be necessary for the provision of the required power.
Besides the detours and capital costs, it is important that the charging infrastructure can adequately cover the energy demand of the agents. The three investigated solutions show a difference of only 0.5% in the number of agents who run out of energy. Each solution is able to supply nearly all agents in the MATSim scenario. It can be stated that the higher the covered distance of an agent during the day, the higher the probability that the agent runs out of energy during the simulation. In the bottom-edge solution, the average distance these agents cover is 193 km, whereas it is 197 km in the top-edge solution. This means that the top-edge solution can supply agents who cover long distances slightly better. This can be due to different reasons, e.g., the higher share of fast charging infrastructure or higher spatial coverage of charging points in general. However, the small advantage in supplied agents is not justifiable considering the huge difference in capital costs between the two solutions.
Furthermore, the aspects not covered by the algorithm should be discussed. For example, it is not possible to gather information about the agents who would run out of energy unless the scenario of the simulation lasts a couple of days rather than 36 h. In such a scenario, agents who cover short distances every day but have no charging points available in their environment could reach an SoC of zero percent. Since a multiple-day scenario would require significantly higher computational capacity, it would be more efficient to extrapolate the SoC of the agents based on the availability of charging points on their trips. This additional step in the algorithm can be implemented without much effort and would lead to higher quality information about the energy supply of the agents. Moreover, agents who run out of energy because they only execute activities outside of Berlin where no charging points are available, except the home charger at their home link, cannot be determined. In addition, an inconvenient assignment of the vehicle class can cause an SoC of zero percent if an agent who covers a high distance is assigned a vehicle with a small battery. Although the proportions of the different vehicle classes in the simulation are related to the real share of vehicle classes, the final assignment of the vehicle class to an agent happens randomly. This inconvenient combination of agent and vehicle class increases the probability of reaching a zero percent SoC. In reality, a person would probably choose a vehicle appropriate for his/her needs.
Furthermore, the distributions of the different charging points are discussed. The solutions show that charging points with a charging power of 3.7 kW are dominant. A high number of these charging points in cities is possible because they can be easily integrated into the posts of street lights and are sufficient for charging a vehicle if the standing times are long enough. Due to the fact that a large number of car owners in Berlin park their vehicles in public spaces in the street overnight, it seems plausible that 3.7 kW charging points would have an appropriate use case here. These charging points also cause a lower load on the power grid compared to charging points with higher power. Nevertheless, a high number of 3.7 kW charging points also has some drawbacks. If they are not integrated into a light post, the large number of charging points needed could cause unnecessary high consumption of space. In addition, the low charging power could lead to limited usability for some car owners who do not park their cars for long periods of time in a certain area but still want to charge their vehicles sufficiently. Therefore, more data about the efficiency of charging processes during the simulation should be generated to evaluate where car owners are exposed to major disadvantages due to the low charging power. The share of fast charging points is 10.1%, on average, in all solutions of the final front, which is an appropriate percentage according to the conditions of the MATSim scenario. However, the low share of fast charging infrastructure in the bottom-edge solution shows that there are also suitable infrastructure scenarios with fewer fast charging points that are situated in the right places. These solutions would, accordingly, show lower capital costs.
The last aspect of the discussion of the results is that of the spatial distribution of the charging infrastructure. It is clear that the solutions show a comprehensive charging infrastructure (Section 4). The spatial distribution correlates with the distribution of activities started in the MATSim scenario. There are no large areas observed without any kind of charging infrastructure. The tendencies that are observed in the bottom-edge solution also continue in solutions with a higher total number of charging points. Besides the comprehensive distribution of the charging infrastructure, there are single links that show clusters of charging points. These links also show high numbers of simultaneous activities, which means that the limitation of the charging points using the maximum number of simultaneous activities and link lengths delivers realistic results. The links featuring clusters of charging points are mainly situated near train stations, public parking spaces, hospitals, and other highly frequented places for leisure activities, e.g., Tempelhofer Feld, Tierpark Berlin, the environment of the Gärten der Welt in Marzahn-Hellersdorf, and the environment around Charlottenburg train station. These examples are taken from the mid-front solution but the described observations can, in general, be confirmed by all the investigated solutions. It seems that the algorithm calculates reasonable solutions considering the used input data. This indicates that extending the input data by also considering other influencing factors on the requirement of charging points or the ability of a link to host charging points could lead to more significant results. The separate investigation of the fast charging infrastructure shows that it corresponds to the observations already described, except for the bottom-edge solution, which shows some supply gaps because of the very low share of fast charging points. Fast charging infrastructure also concentrates on highly frequented streets or train stations. Especially interesting are the clusters along city highways, where several links with a high number of charging points can be observed. This is even observed in the bottom-edge solution despite the low share of fast charging infrastructure. This seems reasonable because urban highways are highly frequented, especially in rush-hour traffic. Therefore, it is likely that many activities would be started relatively close to them. Moreover, urban highways are often used to cover long distances within the city or for entering or leaving the city. Therefore, it seems reasonable that the agents can increase their ranges in a short amount of time due to the proximity of fast charging infrastructure. It is important to mention that this cannot be done intentionally from the algorithm using the MATSim Open Berlin scenario 5.3. Since this MATSim scenario does not feature electric vehicles, it also does not consider activities that are started specifically for charging a vehicle. The need for charging points depends on the number of activities with other purposes only. Another example of this is the cluster of fast charging points in the mid-front solution located at the Grunewald train station in western Berlin. The train station is situated next to a highway that connects Potsdam and Berlin and is highly frequented by commuters. Theoretically, it is reasonable that there are fast charging points for commuters leaving or entering Berlin to increase their ranges in less time. Since those activities are not featured in the scenario, the reason the algorithm places the charging points there is a high number of leisure activities that are started at this location. Furthermore, not all clusters are easy to justify. In a few cases, there are clusters of 100 or more charging points on small streets. In these cases, further investigations are needed. Even though the algorithm indirectly considers the space at a link by considering its length, it must be taken into account that the algorithm cannot consider the available power supply or the structural conditions at the link, e.g., bike lanes or rail transport facilities. This means that the algorithm does not consider whether the power grid at the affected link is able to supply the amount of charging points or whether the link is suitable for charging infrastructure due to its special structural conditions. The potential for load shifting between the power grid and battery electric vehicles is also not investigated. These issues are investigated by Straub et al. [11].

5.2. Methodology

Here, the developed methodology is discussed. For the calculation of the results, the charging decisions of agents based on the MATSim output and certain infrastructure scenarios are simulated. The resulting data are used to optimize the infrastructure scenario by using a genetic algorithm with multi-objective optimization. Considering the results discussed previously, it can be established that this kind of algorithm is suitable for evaluating and optimizing different charging infrastructure scenarios with very different expressions of the optimization criteria. The procedure is able to generate significant results based on the corresponding input data of a MATSim scenario. The presented approach can also be applied to other MATSim scenarios with little effort. With greater effort, it is also possible to use real-world data or data from other agent-based traffic simulations. An advantage of the used methodology is that the charging infrastructure scenarios can be observed holistically and with a very high resolution. This means that the addition of a charging point at a link can lead to an observable change in the use of a charging point at another link by influencing the charging decision of an agent who executes activities at both of these links. Moreover, by allowing agents to make detours to the next available charging point, the coverage of charging demands at a link not only depends on the available charging infrastructure at the link itself but also the available charging infrastructure at the links in the nearby environment. This enables more efficient distribution of charging infrastructure. Compared to other approaches that determine the charging demand for multiple links by cells, the presented method allows for higher precision in determining charging demands and placing charging infrastructure. This is consistent with the need for precise data about the trip and activity history of the population within the investigated area, which a microscopic traffic simulation such as the MATSim Open Berlin scenario can provide. However, if those traffic simulations are able to model charging infrastructure and the charging of electric vehicles, they are suitable for providing charging infrastructure with a very high resolution and optimizing it with the same level of precision.
Another disadvantage of the method is that it uses only the output data from an agent-based microscopic traffic simulation, which are not directly implemented within this simulation. This would improve the accuracy of the results because agents would make detours within the simulation and start a charging activity. There would also be an additional trip from the location of the charging infrastructure to the actual location of the activity of the agent. The randomness of the optimization has advantages and disadvantages. Since the plausibility of the changes from one generation to another is not checked, single solutions may be worsened. The use of methods for a more targeted evolution of the solutions could lead to better results and a more efficient algorithm. In contrast, randomness is a very important part of the evolution of the solutions. It benefits the diversity of the solutions and prevents a solution from being preferred over another, which could result in other equally suitable solutions not being found. Approaches for enhancing the procedure to obtain more significant results are touched upon in Section 6.

6. Conclusions/Outlook

To address the major challenges of climate change and air pollution in cities, Germany and the European Union are aiming toward decarbonization of the transport system. To achieve this, the rollout of electric vehicles for motorized individual transport is crucial. As a consequence, there will be a large increase in the number of BEVs on the streets of Germany and Europe. To supply these vehicles with electric energy, a large-scale setup of public charging infrastructure will be required. The setup of charging infrastructure is a complex optimization problem and should be considered as such from the beginning in order to be able to provide effective charging infrastructure for the increasing numbers of BEVs. Until now, there has not been adequate empirical data on the large-scale operation of BEVs and the charging infrastructure. Therefore, methods are required that are able to estimate the required charging infrastructure. In this paper, the results of a genetic algorithm that uses a multi-objective optimization based on data from the microscopic traffic simulation MATSim for the metropolitan area of Berlin are reviewed. The algorithm developed by the authors is able to evaluate and optimize different charging infrastructure scenarios based on the input data of a MATSim scenario. It can be stated that the charging infrastructure solutions calculated by the algorithm produce promising results, which set the stage for further investigations. Although the results regarding the dimensioning of charging infrastructure should be considered exemplary and are not yet ready to be implemented in reality, we show that the developed procedure is able to model suitable charging infrastructure based on the corresponding input data. It should be noted that the results are highly dependable on the quality of the input data. The results are summarized as follows. The results indicate that for a good trade-off between detours and capital costs, a vehicle-to-charging point ratio that is between the bottom-edge solution (11:1) and mid-front solution (5:1) is adequate. A ratio such as that in the top-edge solution (3:1) seems to be quite oversized due to the non-significant improvements in the supply of agents and the significantly higher capital costs. The required capital costs ranged from EUR 624 million to EUR 2.95 billion. Furthermore, the importance of detours was discussed due to their significant influence on the usability of the charging infrastructure. Thus, it is possible to make an assumption about the detours users are willing to cover to reach an available charging point in the simulation. However, this does not guarantee transferability to reality. Due to the lack of empirical data, similar values from the public transport and car-sharing sectors were used for the evaluation of the detours. In relation to these values, an appropriate mean detour should be between 300 m and 500 m to achieve user acceptance. Further research on the prerequisites of the acceptance of charging infrastructure would be helpful to make more accurate assumptions.
Moreover, some tasks that future research should address are mentioned. Firstly, a MATSim scenario should be implemented that features electric vehicles including their special needs for charging. Thus, the execution of charging processes should be part of the daily plans of the agents. This enables the agents to adapt their daily plans to charge their vehicles efficiently in a minimal amount of time. The procedure investigated in this paper could provide initial data about charging infrastructure for such a MATSim scenario. In turn, the new MATSim scenario could provide the adapted daily plans of agents for a more significant optimization of the charging infrastructure with the placement algorithm. Another problem with the MATSim Open Berlin scenario in terms of optimizing charging infrastructure is the duration of the scenario. The simulation includes an exemplary working day and lasts 36 h. For modeling charging infrastructure, it would be reasonable to extend the scenario to an exemplary week. This would lead to more significant results in terms of the required charging infrastructure due to the identification of insufficiently supplied agents who do not run out of energy within one day because they only cover short distances. Another way to obtain similar data would be to generate information about the availability of the charging infrastructure to each agent. Whether an agent has access to a charging point at any of his activity locations, even if he/she does not charge a vehicle, could be determined. This could also identify insufficiently supplied agents. Furthermore, the algorithm itself shows major potential for improvement, which would be required to achieve the transferability to reality of the charging infrastructure scenarios. One improvement could be to include more criteria in the optimization that are able to represent the quality of the charging infrastructure. The results discussed in this paper show that it is reasonable to consider the number of agents that run out of energy and the temporal occupation rates of the charging infrastructure in the process of the evolution of the solutions. This would also offer the possibility to calculate the economic efficiency of the charging stations. One option for considering insufficiently supplied agents is to use penalties on the capital costs of a solution. By using an exponentially increasing function, small numbers of agents could be accepted, whereas high numbers of agents could be severely punished. In contrast, the consideration of the temporal occupation rates of charging points can be used for a more efficient adaption of the number of charging points. Thus, it would be possible to add more charging points where existing charging points already show a high occupation, whereas charging points with a low occupation could be removed. Another criterion that could be included to provide more realistic results is the availability of the power grid and other spatial conditions at the links where charging points are placed. This is relevant since these conditions can be crucial for determining the charging power and number of charging points that can be placed at a link. Furthermore, the efficiency of charging processes should be calculated to evaluate the used charging power. This can prevent the placing of slow charging infrastructure at links with short activity duration and vice versa. Finally, it should be mentioned that the algorithm should also allow sensitivity analyses to investigate, e.g., the different tolerated distances of users and different market shares of BEVs.

Author Contributions

Conceptualization, D.F., A.M.S. and A.G.; Data curation, D.F. and A.M.S.; Formal analysis, D.F.; Funding acquisition, D.G., A.G. and A.M.S.; Investigation, D.F.; Methodology, D.F., A.M.S. and A.G.; Project administration, A.M.S. and A.G.; Resources, Dietmar Göhlich; Software, D.F.; Supervision, A.M.S. and A.G.; Validation, A.M.S. and A.G.; Visualization, D.F.; Writing—original draft, D.F.; Writing—review and editing, D.F., A.M.S. and A.G. All authors have read and agreed to the published version of the manuscript.

Funding

This work was funded by the Deutsche Forschungsgemeinschaft (DFG, German Research Foundation), project number 398051144.

Institutional Review Board Statement

Not applicable.

Informed Consent Statement

Not applicable.

Data Availability Statement

Transport simulation scenario: https://github.com/matsim-scenarios/matsim-berlin, (accessed on 10 January 2023).

Acknowledgments

We acknowledge the support of the German Research Foundation and the Open Access Publication Fund of TU Berlin for the open access publication.

Conflicts of Interest

The authors declare no conflict of interest. The funders had no role in the design of the study; in the collection, analyses, or interpretation of data; in the writing of the manuscript, or in the decision to publish the results.

References

  1. Europäische Kommission. Electrification of the Transport System. 2017. Available online: https://ec.europa.eu/newsroom/horizon2020/document.cfm?doc_id=46372 (accessed on 21 December 2022).
  2. Umweltbundesamt. Europäische Abgas-Gesetzgebung. 2019. Available online: https://www.umweltbundesamt.de/themen/verkehr-laerm/emissionsstandards/pkw-leichte-nutzfahrzeuge#textpart-1 (accessed on 21 December 2022).
  3. Bundesministerium für Umwelt, Naturschutz, Bau und Reaktorsicherheit. Klimaschutzplan 2050: Klimaschutzpolitische Grundsätze und Ziele der Bundesregierung. Available online: https://www.bmwk.de/Redaktion/DE/Publikationen/Industrie/klimaschutzplan-2050.pdf?__blob=publicationFile&v=6 (accessed on 21 December 2022).
  4. Die Bundesregierung. Klimaschutzprogramm 2030 der Bundesregierung zur Umsetzung des Klimaschutzplans 2050. Available online: https://www.bundesregierung.de/resource/blob/974430/1679914/e01d6bd855f09bf05cf7498e06d0a3ff/2019-10-09-klima-massnahmen-data.pdf?download=1 (accessed on 21 December 2022).
  5. Ziemke, D.; Kaddoura, I.; Nagel, K. The MATSim Open Berlin Scenario: A multimodal agent-based transport simulation scenario based on synthetic demand modeling and open data. Procedia Comput. Sci. 2019, 151, 870–877. [Google Scholar] [CrossRef]
  6. Pagany, R.; Ramirez Camargo, L.; Dorner, W. A review of spatial localization methodologies for the electric vehicle charging infrastructure. Int. J. Sustain. Transp. 2019, 13, 433–449. [Google Scholar] [CrossRef] [Green Version]
  7. Asamer, J.; Reinthaler, M.; Ruthmair, M.; Straub, M.; Puchinger, J. Optimizing charging station locations for urban taxi providers. Transp. Res. Part A Policy Pract. 2016, 85, 233–246. [Google Scholar] [CrossRef] [Green Version]
  8. Khadem, N.K.; Nickkar, A.; Shin, H.S. A Review of Different Charging Stations Optimal Localization Models and Analysis Functions for the Electric Vehicle Charging Infrastructure. In Proceedings of the International Conference on Transportation and Development 2020, Seattle, DC, USA, 26–29 May 2020; Zhang, G., Ed.; American Society of Civil Engineers: Reston, VA, USA, 2020; pp. 262–276. [Google Scholar] [CrossRef]
  9. Unterluggauer, T.; Rich, J.; Andersen, P.B.; Hashemi, S. Electric vehicle charging infrastructure planning for integrated transportation and power distribution networks: A review. eTransportation 2022, 12, 100163. [Google Scholar] [CrossRef]
  10. Iqbal, S.; Habib, S.; Ali, M.; Shafiq, A.; ur Rehman, A.; Ahmed, E.M.; Khurshaid, T.; Kamel, S. The Impact of V2G Charging/Discharging Strategy on the Microgrid Environment Considering Stochastic Methods. Sustainability 2022, 14, 13211. [Google Scholar] [CrossRef]
  11. Straub, F.; Maier, O.; Göhlich, D.; Zou, Y. Forecasting the spatial and temporal charging demand of fully electrified urban private car transportation based on large-scale traffic simulation. Green Energy Intell. Transp. 2022, 100039. [Google Scholar] [CrossRef]
  12. Jahn, R.M.; Syré, A.; Grahle, A.; Schlenther, T.; Göhlich, D. Methodology for Determining Charging Strategies for Urban Private Vehicles based on Traffic Simulation Results. Procedia Comput. Sci. 2020, 170, 751–756. [Google Scholar] [CrossRef]
  13. Jordán, J.; Palanca, J.; Del Val, E.; Julian, V.; Botti, V. Localization of charging stations for electric vehicles using genetic algorithms. Neurocomputing 2021, 452, 416–423. [Google Scholar] [CrossRef]
  14. Efthymiou, D.; Chrysostomou, K.; Morfoulaki, M.; Aifantopoulou, G. Electric vehicles charging infrastructure location: A genetic algorithm approach. Eur. Transp. Res. Rev. 2017, 9, 27. [Google Scholar] [CrossRef]
  15. Armas, R.; Aguirre, H.; Orellana, D. Evolutionary bi-objective optimization for the electric vehicle charging stand infrastructure problem. In Proceedings of the Genetic and Evolutionary Computation Conference, Boston, MA, USA, 9–13 July 2022; Fieldsend, J.E., Wagner, M., Eds.; ACM: New York, NY, USA, 2022; pp. 1139–1146. [Google Scholar] [CrossRef]
  16. Simon, D. Evolutionary Optimization Algorithms: Biologically-Inspired and Population-Based Approaches to Computer Intelligence; John Wiley & Sons Inc.: Hoboken, NJ, USA, 2013. [Google Scholar]
  17. Stroband, A. Verfahren zur Dimensionierung und Platzierung von Ladeinfrastruktur für Elektrofahrzeuge. Ph.D. Dissertation, RWTH Aachen University, Aachen, Germany, 2018. [Google Scholar]
  18. Nationale Plattform Elektromobilität. Ladeinfrastruktur für Elektrofahrzeuge in Deutschland: Statusbericht und Handlungsempfehlungen 2015. 2015. Available online: https://www.plattform-zukunft-mobilitaet.de/wp-content/uploads/2021/12/2015_Ladeinfrastruktur_fuer_Elektrofahrzeuge_in_Deutschland_Statusbericht_und_Handlungsempfehlungen.pdf (accessed on 21 December 2022).
  19. Nationale Plattform Zukunft der Mobilität. Elektromobilität. Brennstoffzelle. Alternative Kraftstoffe—Einsatzmöglichkeiten aus technologischer Sicht: 1. Kurzbericht der AG 2. Available online: https://www.plattform-zukunft-mobilitaet.de/wp-content/uploads/2019/11/NPM-AG-2-Elektromobilit%C3%A4t-Brennstoffzelle-Alternative-Kraftstoffe-Einsatzm%C3%B6glichkeiten-aus-technologischer-Sicht.pdf (accessed on 21 December 2022).
  20. Funke, S.A. Techno-ökonomische Gesamtbewertung heterogener Maßnahmen zur Verlängerung der Tagesreichweite von batterieelektrischen Fahrzeugen. Ph.D. Dissertation, Universität Kassel, Kassel, Germany, 2018. [Google Scholar]
  21. NetworkXDevelopers. Single_Source_Dijkstra_Path_Length. 2015. Available online: https://networkx.org/documentation/networkx-1.10/reference/generated/networkx.algorithms.shortest_paths.weighted.single_source_dijkstra_path_length.html#networkx.algorithms.shortest_paths.weighted.single_source_dijkstra_path_length (accessed on 21 December 2022).
  22. Gerike, R.; Hubrich, S.; Ließke, F.; Wittig, S.; Wittwer, R. Tabellen zum Forschungsprojekt Mobilität in Städten—SrV 2018. Available online: https://changing-cities.org/wp-content/uploads/2020/03/Berlin_Tabellen_Berlin_gesamt.pdf (accessed on 5 November 2021).
  23. infas Institut für angewandte Sozialwissenschaften. Mobilität in Deutschland: Tabellarische Grundauswertung. 2017. Available online: http://www.mobilitaet-in-deutschland.de/pdf/MiD2017_Tabellenband_Deutschland.pdf (accessed on 21 December 2022).
  24. ADAC Autotest. Renault Zoe R135 Z.E. 50 (52 kWh) Intens. 2020. Available online: https://assets.adac.de/image/upload/v1585140678/ADAC-eV/KOR/Text/PDF/Renault_Zoe_R135_ZE_50_cweozh.pdf (accessed on 21 December 2022).
  25. ADAC Autotest. Nissan Leaf (62 kWh) e+ Tekna. 2020. Available online: https://assets.adac.de/image/upload/v1584015200/ADAC-eV/KOR/Text/PDF/Nissan_Leaf_62_kWh_e__Tekna_opybhm.pdf (accessed on 21 December 2022).
  26. ADAC Autotest. Tesla Model 3 Long Range AWD. 2019. Available online: https://res.cloudinary.com/adacde/image/upload/v1571751244/ADAC-eV/KOR/Text/PDF/Tesla_Model_3_Long_Range_AWD_ybki8e.pdf (accessed on 21 December 2022).
  27. ADAC Autotest. Audi e-tron 55 quattro. 2019. Available online: https://www.adac.de/_ext/itr/tests/Autotest/AT5926_Audi_e_tron_55_quattro/Audi_e_tron_55_quattro.pdf (accessed on 21 December 2022).
  28. ADAC. ADAC Autotest Website. 2022. Available online: https://www.adac.de/rund-ums-fahrzeug/tests/autotest/ (accessed on 21 December 2022).
  29. ADAC e.V. Kosten für E-Autos: Ladeverluste Nicht Vergessen. 2020. Available online: https://presse.adac.de/meldungen/adac-ev/technik/ladeverlust.html (accessed on 21 December 2022).
  30. Dearborn, S. Charging Li-ion Batteries for Maximum Run Times. 2005. Available online: https://www.semanticscholar.org/paper/Charging-Li-ion-Batteries-for-Maximum-Run-Times-An-Dearborn/e46c5f4c635e1ae98dacc76bfca3e8aa71a2800d (accessed on 21 December 2022).
  31. Elektromobilität, N.P. Fortschrittsbericht 2018: Markthochlaufphase. 2018. Available online: https://www.plattform-zukunft-mobilitaet.de/wp-content/uploads/2021/12/2018_Fortschrittsbericht_2018_Markthochlaufphase.pdf (accessed on 21 December 2022).
  32. eon. Elektroautos zuhause laden: Gründe für eine Wallbox fürs Eigenheim. 2020. Available online: https://www.eon.de/de/pk/e-mobility/elektroauto-zuhause-laden-wallbox.html#:~:text=Wallboxen%20gibt%20es%20mit%20einer,sowieso%20nicht%20mehr%20Leistung%20aufnehmen (accessed on 21 December 2022).
  33. Europäisches Parlament. Europäische Richtlinie für den Ausbau von Infrastruktur für Alternative Kraftstoffe. Available online: https://eur-lex.europa.eu/legal-content/DE/TXT/PDF/?uri=CELEX:32014L0094&from=DE (accessed on 8 December 2020).
  34. Senatsverwaltung für Umwelt, Verkehr und Klimaschutz Berlin. Nahverkehrsplan Berlin 2019–2023. Available online: https://datenbox.stadt-berlin.de/ssf/s/readFile/share/4826/-8007172482696866025/publicLink/Brosch%C3%BCre_NVP_2019_201109_internet.pdf (accessed on 21 December 2022).
  35. Bundesverband CarSharing. CarSharing Stellplätze in den öffentlichen Straßenraum Bringen. Available online: https://www.carsharing.de/sites/default/files/uploads/bcs-leitfaden_cs-stellplaetze_im_oeffentlichen_raum_november_2019_online.pdf. (accessed on 21 December 2022).
Figure 1. Principal of genetic optimization.
Wevj 14 00026 g001
Figure 2. Qualitative representation of a Pareto front.
Wevj 14 00026 g002
Figure 3. Example of a solution.
Wevj 14 00026 g003
Figure 4. Agent charging decision.
Wevj 14 00026 g004
Figure 5. Representation of the methodological procedure.
Wevj 14 00026 g005
Figure 6. Development of results across generations.
Wevj 14 00026 g006
Figure 7. Development of key values of solutions across generations.
Wevj 14 00026 g007
Figure 8. Results of generation 100.
Wevj 14 00026 g008
Figure 9. Spatial distribution of public charging infrastructure in bottom-edge solution.
Wevj 14 00026 g009aWevj 14 00026 g009b
Figure 10. Spatial distribution of public charging infrastructure in mid-front solution.
Wevj 14 00026 g010
Figure 11. Spatial distribution of public charging infrastructure in top-edge solution.
Wevj 14 00026 g011aWevj 14 00026 g011b
Figure 12. Spatial distribution of activities in the MATSim scenario.
Wevj 14 00026 g012
Table 1. Capital costs per charging point and installed power.
Charging Power [kW]Capital Costs [€]
3.71700 [18]
115000 [19]
225000 [19]
5045,000 [20]
150120,000 [20]
Table 2. Distribution of vehicle classes in Berlin/Brandenburg ([p. 254] in [23]).
Vehicle Class CategoryShare Berlin [%]Share Brandenburg [%]
Small2423
Compact3436
Medium2728
Large97
Nonassignable66
Table 3. Vehicle Attributes.
Vehicle ClassModelBattery Capacity
  [kWh]
Energy Consumption (ic/ot/mw) * [kWh/100 km]
SmallRenault Zoe [24]4115.4 (11.7/17.0/17.8)
CompactNissan Leaf e+ [25]6220.6 (15.6/21.8/24.5)
MediumTesla Model 3 LR [26]7517.5 (16.2/17.9/18.1)
LargeAudi e-tron [27]83.622.9 (20.8/23.9/23.0)
* ic = inner-city, ot = out of town, mw = motor way.
Table 4. Input parameters.
ParameterDescriptionValue
Max. Vehicle SoC [%]Maximum SoC the vehicles can be charged up to or agents start a charging process80
Min. Vehicle SoC [%]SoC for which an agent classifies a charging process as necessary30
Min. Standing Time [s]Minimum duration from arrival to departure necessary to start a charging process300
Tolerated Distance [m]Maximum detour an agent will cover if the charging process is classified as not necessary500
Max. Distance [m]Max. detour an agent will cover to execute a charging process1000
Number of GenerationsNumber of generations simulated100
Table 5. Average values of different parameters of generation 1 and generation 100.
ParameterMean Value Gen. 1Mean Value Gen. 100
Charging points118,250237,150
Capital costs [ 10 6 €]21842876
Mean detour [m]581405
Total detours [10 6 m]398411
Charging processes696,5301,046,240
Temporal occupation rate [%]41.0338.18
Mean SoC before first trip [%]85.9385.93
Mean SoC after last trip [%]70.1271.33
Share of AC charging points [%]79.289.9
Share of DC charging points [%]20.810.1
Agents with 0% SoC40,180 (3.0%)35,880 (2.68%)
Table 6. Values of three different solutions of generation 100.
ParameterBottom EdgeMid-FrontTop Edge
Charging points112,040246,630379,690
Capital costs [ 10 6 €]62429505692
Mean detour [m]591378254
Total detours [10 6 m]400416317
Charging processes676,7601,100,3401,246,130
Temporal occupation rate [%]40.6938.329.07
Mean SoC before first trip [%]85.9385.9385.93
Mean SoC after last trip [%]69.771.5872.11
Share of AC charging points [%]97.189.285.8
Share of DC charging points [%]2.910.814.2
Agents with 0% SoC40,830 (3.05%)35,130 (2.63%)33,720 (2.52%)
Table 7. Charging points per power of the bottom-edge solution.
Charging PowerNumber of Charging PointsRelative Share
3.7 kW59,39053.00%
11 kW25,00022.32%
22 kW24,36021.74%
50 kW15801.41%
150 kW17101.53%
Table 8. Charging points per power of the mid-front solution.
Charging PowerNumber of Charging PointsRelative Share
3.7 kW89,69036.37%
11 kW66,87027.11%
22 kW63,54025.76%
50 kW13,8405.61%
150 kW12,6905.15%
Table 9. Charging points per power of the top-edge solution.
Charging PowerNumber of Charging PointsRelative Share
3.7 kW113,48029.89%
11 kW106,43028.03%
22 kW105,86027.88%
50 kW27,1007.14%
150 kW26,8207.06%
Disclaimer/Publisher’s Note: The statements, opinions and data contained in all publications are solely those of the individual author(s) and contributor(s) and not of MDPI and/or the editor(s). MDPI and/or the editor(s) disclaim responsibility for any injury to people or property resulting from any ideas, methods, instructions or products referred to in the content.

