Article

Cell Design Considerations and Impact on Energy Density—A Practical Approach to EV Cell Design

Hazleton Campus, Penn State University, Hazleton, PA 18202, USA
World Electr. Veh. J. 2023, 14(10), 279; https://doi.org/10.3390/wevj14100279
Submission received: 11 September 2023 / Revised: 28 September 2023 / Accepted: 3 October 2023 / Published: 5 October 2023
(This article belongs to the Topic Battery Design and Management)

Abstract

:
Higher-energy-density, Wh L−1 or Wh kg−1, lithium-ion cells are one of the critical advancements required for the implementation of electric vehicles. This increase leads to a longer drive distance between recharges. Aside from material development, full lithium-ion cell design parameters have the potential to greatly influence fabricated cell energy density. The following work highlights the impact of these full-cell design parameters, investigating the effect of a negative to positive capacity ratio, positive electrode porosity, positive electrode active material content, and overall charge voltage on stack volumetric energy density. Decreasing the N:P ratio or increasing active material content results in an almost identical volumetric energy density increase: ~4%. Decreasing the positive electrode porosity from 40–30% or increasing the charge voltage from 4.2–4.35 V also results in an almost identical increase in volumetric energy density: ~5.5%. Combining all design changes has the potential to increase stack volumetric energy density by 20% compared to the baseline cell design.

1. Introduction

Since the commercialization of lithium-ion cells in the early 1990s, they have been the energy storage method of choice for portable electronics [1]. More recently, they have also become the top choice for the electric vehicle (EV) market, transitioning from nickel-metal hydride (NiMH) battery systems beginning around 2008 [2]. Since the commercialization of lithium-ion technology in EVs, developers have utilized various cathode materials in battery production including lithium cobalt oxide (LCO), lithium manganese oxide (LMO), lithium nickel manganese cobalt oxide (NMC), lithium nickel cobalt aluminum oxide (NCA), and lithium iron phosphate (LFP) [3,4]. During much of the time between the commercialization of lithium-ion cells and the present, LCO has been the cathode of choice [5,6]. Divakaran et al. [4] provide insight into the anode materials currently available or under development, such as graphite, silicon-based materials, or lithium titanate, outlining the key requirements for an anode material to be suitable for commercial lithium-ion cells, noting that historically graphitic carbon has dominated the global anode market for both portable electronics and EVs. The general trend in EV technology is that cells are being developed with higher gravimetric and volumetric energy density (Wh kg−1 or Wh L−1), with the goal of an increase in distance traveled per charge. Alongside increasing energy density, numerous additional factors such as safety and recharge time are considered highly important [7].
Aside from cell chemistry, another highly influential factor affecting energy density is cell design parameters. These include, but are not limited to, electrode composition, active material content, mass or areal loading of the positive and negative electrode, negative to positive equal area capacity ratio (N:P), current collector thickness, separator thickness, positive and negative electrode porosity, and cell charge voltage. Many of the advancements in cell energy density over the course of lithium-ion cell commercialization can be attributed to these factors. Cells were manufactured with thinner foils, lighter cases, and higher active material content, resulting in increases in energy density with no changes to cell active material [8]. It has only been over the past ~15 years that commercially available cells with alternative cathode active materials have been available, although LCO is still widely used [5].
The cell cycle life, safety, charge rate, and discharge rate are also influenced by many of these design parameters. Numerous authors have investigated the effect of one or more of these on cathode or anode performance. The effect of mass loading on the charge rate, discharge rate, and cycle life for various cathode active materials such as LCO, LFP, and variations of NMC have been investigated both experimentally and through modeling [9,10,11,12,13,14,15]. Authors have shown that an increase in electrode mass loading results in a decrease in cell rate capability, especially at higher loadings (≥3.5 mAh cm−2) where higher energy densities can be achieved. Singh et al. [16,17] demonstrated that variation in the cathode and anode porosity for a constant heavy loading plays a considerable role in cell performance, affecting the cell rate capability and electrode integrity. The effects of negative electrode thickness and porosity have also been investigated by many authors. Malifarge et al. [18] investigated, experimentally and through modeling, the performance of graphite electrodes with loading ranging from 2 to 6 mAh cm−2, concluding that higher loadings suffer from electrolyte limitations at medium to high current densities. Shim and Striebel [19] observe that higher-energy-density loadings led to an increase in reversible and irreversible capacity loss. A negative to positive capacity ratio has also been investigated by numerous authors [20,21,22,23], concluding that not only is an N:P greater than 1.0 needed for safety and the elimination of lithium plating but, typically, ratios of approximately 1.1 are used for increased safety and improved cycle life, with values as high as 1.2 being utilized. For the purpose of this manuscript, the N:P ratio is defined as the reversible equal area capacity ratio between the negative and positive electrode, where a graphite-specific capacity of 300 mAh g−1 is used, and LCO delivers varying specific capacities depending on the charge voltage, outlined in the following section.
Many of the previously mentioned material evaluations were performed utilizing half-cell evaluation techniques, where either the positive or negative electrode is evaluated versus a lithium metal electrode. This characterization offers valuable information on the material or electrode being evaluated, but results do not typically repeat when used in full lithium-ion cells. One of the major reasons for this discrepancy is that half-cells utilize an “infinite” lithium source where lithium consumption during solid electrolyte interphase (SEI) formation is replenished from the lithium metal electrode.
While this half-cell characterization is of extreme importance for the further advancement of lithium-ion technology, few references have been found investigating the effect of these parameters on overall designed full-cell energy density, which is crucial as we move toward an electrified transportation marketplace. Full lithium-ion cells are considered cells with a construction similar to commercially available lithium-ion cells—for this manuscript, a cell containing a graphite negative electrode and LCO positive electrode. Numerous authors have noted that cells containing higher areal loadings lead to cells with higher volumetric energy densities [24,25]; however, to the authors’ knowledge, this demonstrates the first in-depth evaluation combining numerous design parameters in one study pertaining to full lithium-ion cells.
As LCO cathodes and graphite anodes have historically been the “workhorse” of lithium-ion cell use, the following analysis is applied to this pairing. The basis of the evaluation is applied to a practical lithium-ion cell design process for a final packaged cell with a thickness of ≤7.0 mm. A 7.0 mm packaged cell approximately represents the cell thickness for various laminate cells in production for EV use [26]. The value of such analysis is first an understanding of how these parameters affect the energy density and capacity at the cell level, as opposed to individual material evaluation, and, second, as an evaluation process that can be applied to numerous commercial and currently in-development cell chemistries.
The following results compare the impact cell design parameters have on the designed capacity and energy density of cells as well as the electrode porosity, overall cell charge voltage, electrode mass loading, and N:P. For example, it is well known that charging an LCO electrode to a higher charge voltage results in an increased capacity of that electrode. What is seldom evaluated is what effect this has on a fully designed cell’s total energy density, taking into consideration that a higher negative loading is required to store this excess lithium safely. The same analysis can be applied to higher areal loadings. Evaluating just the electrode coating, increasing the loading does not result in an increase in coating energy density. Analyses must be applied to a full cell or a combination of electrode pairs. As electrode areal loading and coating thickness are increased, fewer pairs are needed to meet the cell’s desired thickness. This reduction in the number of electrode pairs produces a cell containing fewer Cu and Al current collector foils. The cell now contains a higher volume percentage of active material, leading to an increase in energy density.
It is understood that inert cell components such as current collector foil thickness and separator thickness also have an impact on energy density, but these variables were omitted from this study. The advantages gained from thinner inert materials are more realized in high-power cells, where a high number of thin electrode pairs are used. The presented data are calculated values, showing the contributions of these variables as a case study for EV cell design. This indicates that, currently, the listed capacities will most likely not be achieved at high discharge rates. Future developments, such as novel designs for thick electrodes, may allow full-cell capacities to be realized at higher rates [27]. The following demonstrates one of the first steps taken when designing lithium-ion cells for specific applications, with fixed cell dimensions showing what requirements must be met to reach the goals of the EV market.

2. Materials and Methods

For full lithium-ion cell design, not only are electrode formulations, porosities, the N:P ratio, charge voltage and mass loading determining factors in the energy density, but the cell thickness and area play a considerable role as well. Two typical approaches are used when a specific target cell thickness is desired. The first is to use “in stock” electrode coatings that have been developed and used before. These electrodes have known performances that can be determined with little additional testing. This process saves on performing additional electrode coatings for each individual target cell thickness. The second is to tailor the electrode thickness to meet the cell thickness requirements. This method would involve determining which previously mentioned cell design parameters are to be used. If all parameters are defined except one, the final parameter can be selected for a cell design to meet thickness requirements. As an example, if the N:P ratio, charge voltage, formulations, and mass loading are determined, negative and positive electrode porosities can be adjusted so the final cell thickness is as close to the allowable cell thickness without exceeding it. All of these factors affect the cell performance. As this second method requires properties to be defined, the first method will be used in the following evaluation.
Table 1 highlights the fixed properties that will be used in energy density evaluations, including the package and current collector thickness, electrode area, separator thickness, and separator area.
Thirty-six cell designs were evaluated with variations in the N:P ratio, positive electrode porosity, positive electrode active material percentage, and cell charging voltage. For each of these 36 variations, positive areal capacities were evaluated between 2.00 and 5.25 mAh cm−2 in 0.25 mAh cm−2 increments, resulting in a total of 504 various cell designs. As any changes to the negative electrode porosity or active material content would have greatly increased the quantity of presented data, this evaluation will be presented in a future publication. Table 2 illustrates the various cell designs evaluated. For the designs evaluated, the negative electrode composition masses were fixed at 92% active material, 1% additional conductive carbon (CC), and 7% PVDF binder, resulting in a mixture density of 2.16 mg cm−3 and a reversible capacity of 300 mAh g−1. For the positive electrode’s various charge voltages, the reversible capacity of LCO was 150, 160, and 165 mAh g−1 for 4.20, 4.30, and 4.35 V, respectively. For energy density calculations, the average voltages on discharge for 4.20, 4.30, and 4.35 V charges were 3.70, 3.75, and 3.78 V, respectively.
During the fabrication of full lithium-ion cells for commercial use, additional parameters can affect the energy density. The amount of space allotted inside the cell packaging for ultrasonic welds and electrolytes, heat seal width, and “flat pouch” vs. “cup” packaging all affect the overall cell volume and weight. As various manufacturers will use different parameters, all presented energy density values are per stack volume. If presented on a cell level, the trends would remain consistent with those presented in the following section.
The methodology for each cell design begins with the positive electrode formulation, areal loading, and porosity. In the cell design process, these values are fixed for each design. These values would give the positive electrode density, thickness, and capacity based on charge voltage. The negative electrode is then designed based on the positive electrode values. The N:P, negative formulation, and negative porosity would all affect the negative electrode thickness and areal capacity. Using the calculated thickness values, current collector thickness, and separator thickness, the number of electrode pairs is then calculated; the maximum number of pairs is used where the final thickness meets the previously outlined requirements. From the number of cell pairs and electrode area, the stack volumetric energy density and capacity can be determined. Changing any of the above-mentioned parameters would result in a cell with a different energy density, even if the number of electrode pairs and cell capacity remain unchanged.

3. Results

3.1. Impact of Negative to Positive Matching Ratio and Positive Electrode Porosity

In an attempt to highlight the numerous variables and their effect on the stack energy density, each property is first evaluated individually and then as a combination. Figure 1 displays the impact of negative to positive equal area capacity ratio and positive electrode porosity on stack energy density. Figure 1a,b illustrate a simplified view of the presented data for a single-cell design to allow for easier interpretation of the figure. For a positive electrode containing 91% LCO, 30% porosity and a 1.1:1 N:P, with a final cell thickness of ≤7.0 mm the stack energy density, the number of electrode pairs, final stack thickness, and cell capacity are shown. Figure 1c,d show the impact of N:P on the previously mentioned cell properties. As the N:P ratio is lowered or increased from 1.1:1, we see an increase or decrease in stack energy density. Lowering the N:P to 1:1 results in an energy density increase ranging from 4.0 to 4.7% depending on the electrode mass loading. Increasing the N:P to 1.2:1 results in a decrease in stack capacity between 3.6% and 4.3%. Capacity, Figure 1d, shows a similar trend to energy density, with the lower N:P ratio resulting in higher cell capacity, although the trend is not as clear. There are numerous positive loadings where cell capacities are equal. This is a result of the cell capacity being based on positive electrode loading. Each cell design would contain the same number of electrode pairs. The only difference is that the cell with the lower N:P ratio would contain a thinner negative electrode resulting in a higher stack energy density. The cell design thickness, ≤7.00 mm, limits the number of electrode pairs. A thinner negative electrode design resulting from a lower N:P does not allow for an additional electrode pair to be added while still meeting the thickness requirements. As previously mentioned, decreasing the N:P ratio closer to 1:1 typically leads to a shorter cell cycle life and safety concerns. Figure 1e,f show the same data, but for a positive electrode with increased porosity of 40% compared to 30%. Scale bars between Figure 1c,e as well as Figure 1d,f are kept equal to help with comparisons. Again, the same conclusions can be drawn, where a decrease in the N:P ratio from 1.1:1 to 1:1 results in an increase in energy density ranging from 3.7 to 4.4%. More important is a comparison between electrode stacks where positive electrode porosity is either 30 or 40% (Figure 1c,e). For an electrode stack with a 1.1:1 N:P ratio, as the porosity is increased to 40%, the resulting stack energy density shows a decrease of 5.1–6.0%. This is a direct result of a positive electrode with increased porosity containing the same amount of active material and having the same capacity, now being thicker than an electrode with 30% porosity, leading to a decrease in volumetric energy density. For all designs in Figure 1, cells contain 20 to 7 electrode pairs, with high loadings leading to lower electrode pairs. Stacks also range between 5.4 and 6.4 mm in thickness.

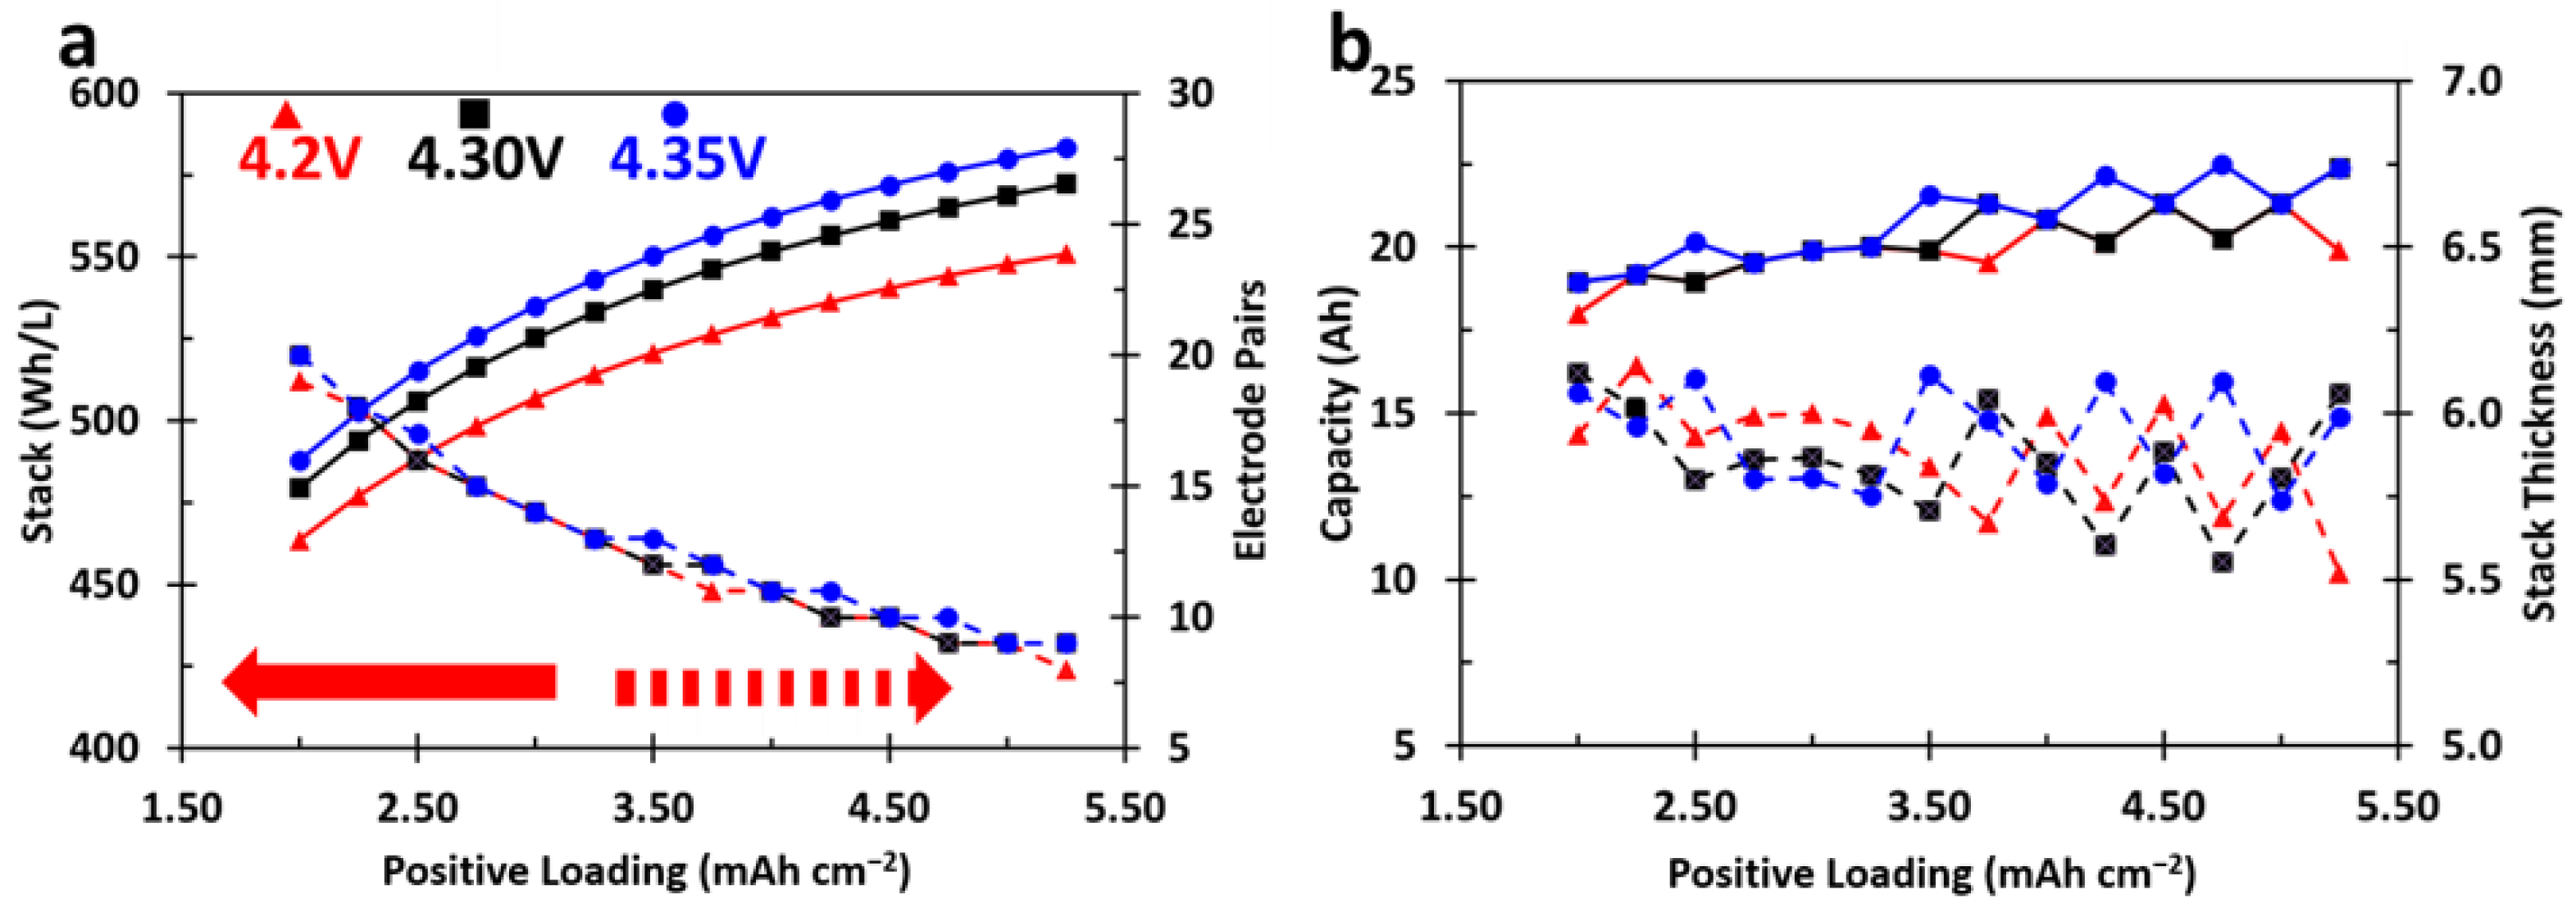
3.2. Impact of Charge Voltage

Along with changes to the N:P ratio and porosity, charging LCO cells to a higher voltage is another method often described as increasing energy density. LCO typically charged to 4.20 V vs. graphite, has in specific applications, been charged to 4.30 or 4.35 V. Charging to a higher voltage results in more lithium being removed from the cathode. At the anode, more graphite is required to store the Li+ while maintaining a constant N:P ratio. This is the main reason cells designed for a specific charge voltage cannot be charged to a higher voltage. If charging a 4.2 V cell to 4.35 V, the N:P ratio is decreased, and the cell can become unsafe or unusable. Figure 2 demonstrates the impact of the charge voltage on the stack energy density, electrode pairs, stack thickness, and cell capacity. As expected, increasing the positive electrode loading results in an increase in stack energy density. Figure 2a compares the energy density and electrode pairs for a cell designed with an N:P of 1.1:1 and a positive electrode porosity of 30%. Increasing the charge voltage from 4.20 V to 4.30 V increases the LCO specific capacity from 150 mAh g−1 to 160 mAh g−1, or 6.7%, and an average discharge voltage increase from 3.70 V to 3.75 V (1.35%) where the overall stack the energy density is increased from 3.5–3.9% depending on electrode loading. For a 4.35 V charge voltage, the specific LCO capacity is 165 mAh g−1, and the resulting electrode stack energy density increases from a 4.20 V cell design between 5.3 and 5.9%. Similar results are observed when increasing the charge voltage, as seen with decreasing porosity or decreasing N:P ratio. The cell capacity increases overall as electrode loadings are increased, but there are instances where increasing the charge voltage does not result in an increase in the overall cell capacity. There are instances from 2.25 to 3.25 mAh g−1 where a cell charged to 4.20 V, 4.30 V or 4.35 V will have the same capacity. Again, this is a result of the cells having a maximum allowable thickness.

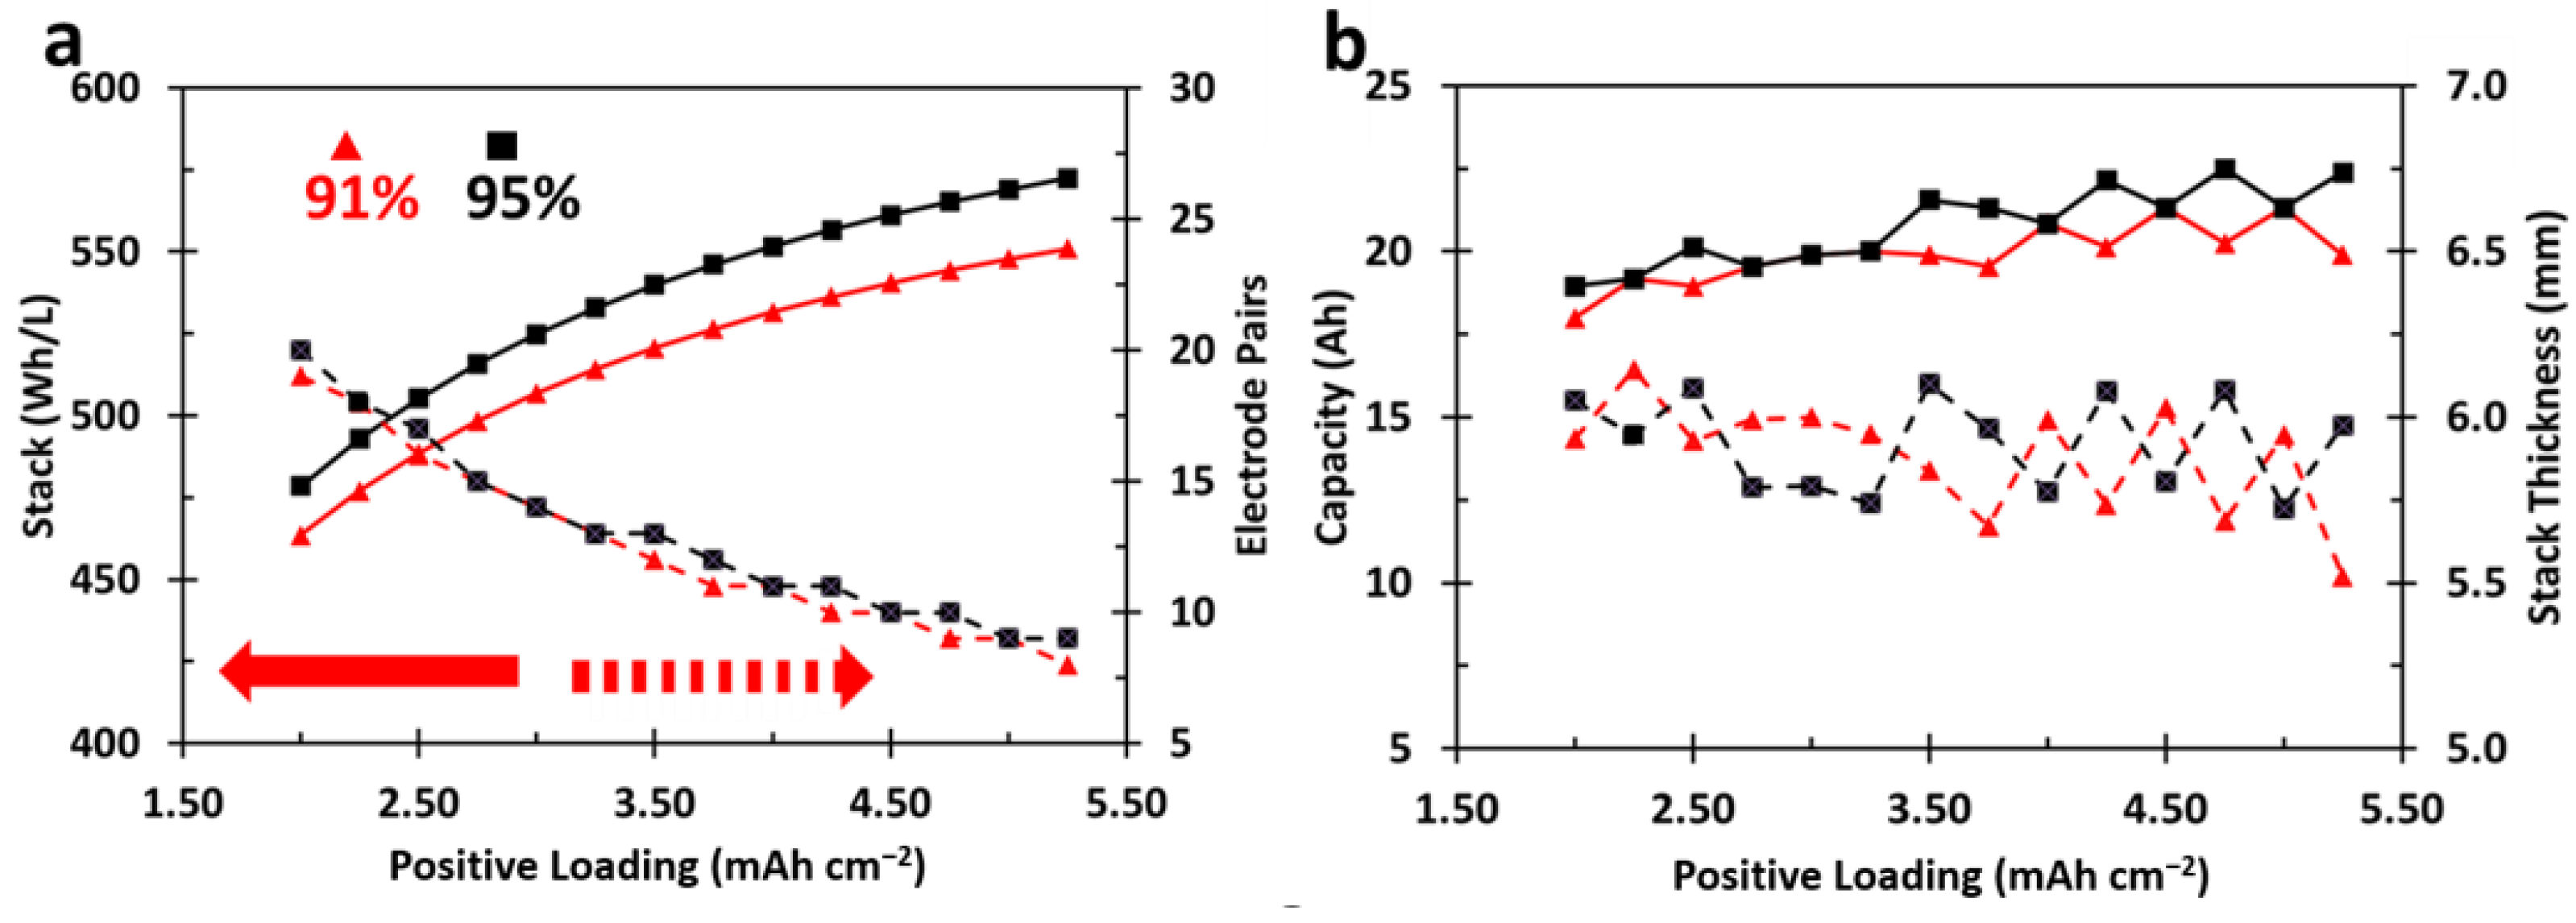
3.3. Impact of Positive Electrode Active Material Content

Increasing the active material content on the positive electrode has the potential to have a large impact on stack energy density, especially with a volumetric energy density wherein the density of the active material is typically more than double the other components in the electrode composite. To demonstrate this effect, cell active material is increased from 91 to 95%. As Table 2 shows, this increases the composite density at zero percent porosity from 4.363 to 4.627 mg cm−3. Figure 3 shows this impact for a baseline cell with a 4.20 V charge voltage, 30% positive electrode porosity and 1.1:1 N:P ratio. Increasing the active material content from 91% to 95% results in an increase in stack energy density from 3.3 to 3.9%. As the electrode active material content is increased, the coating calendar thickness of the higher active material electrodes is approximately 10% thinner when the change is made from 91% active to 95% active.

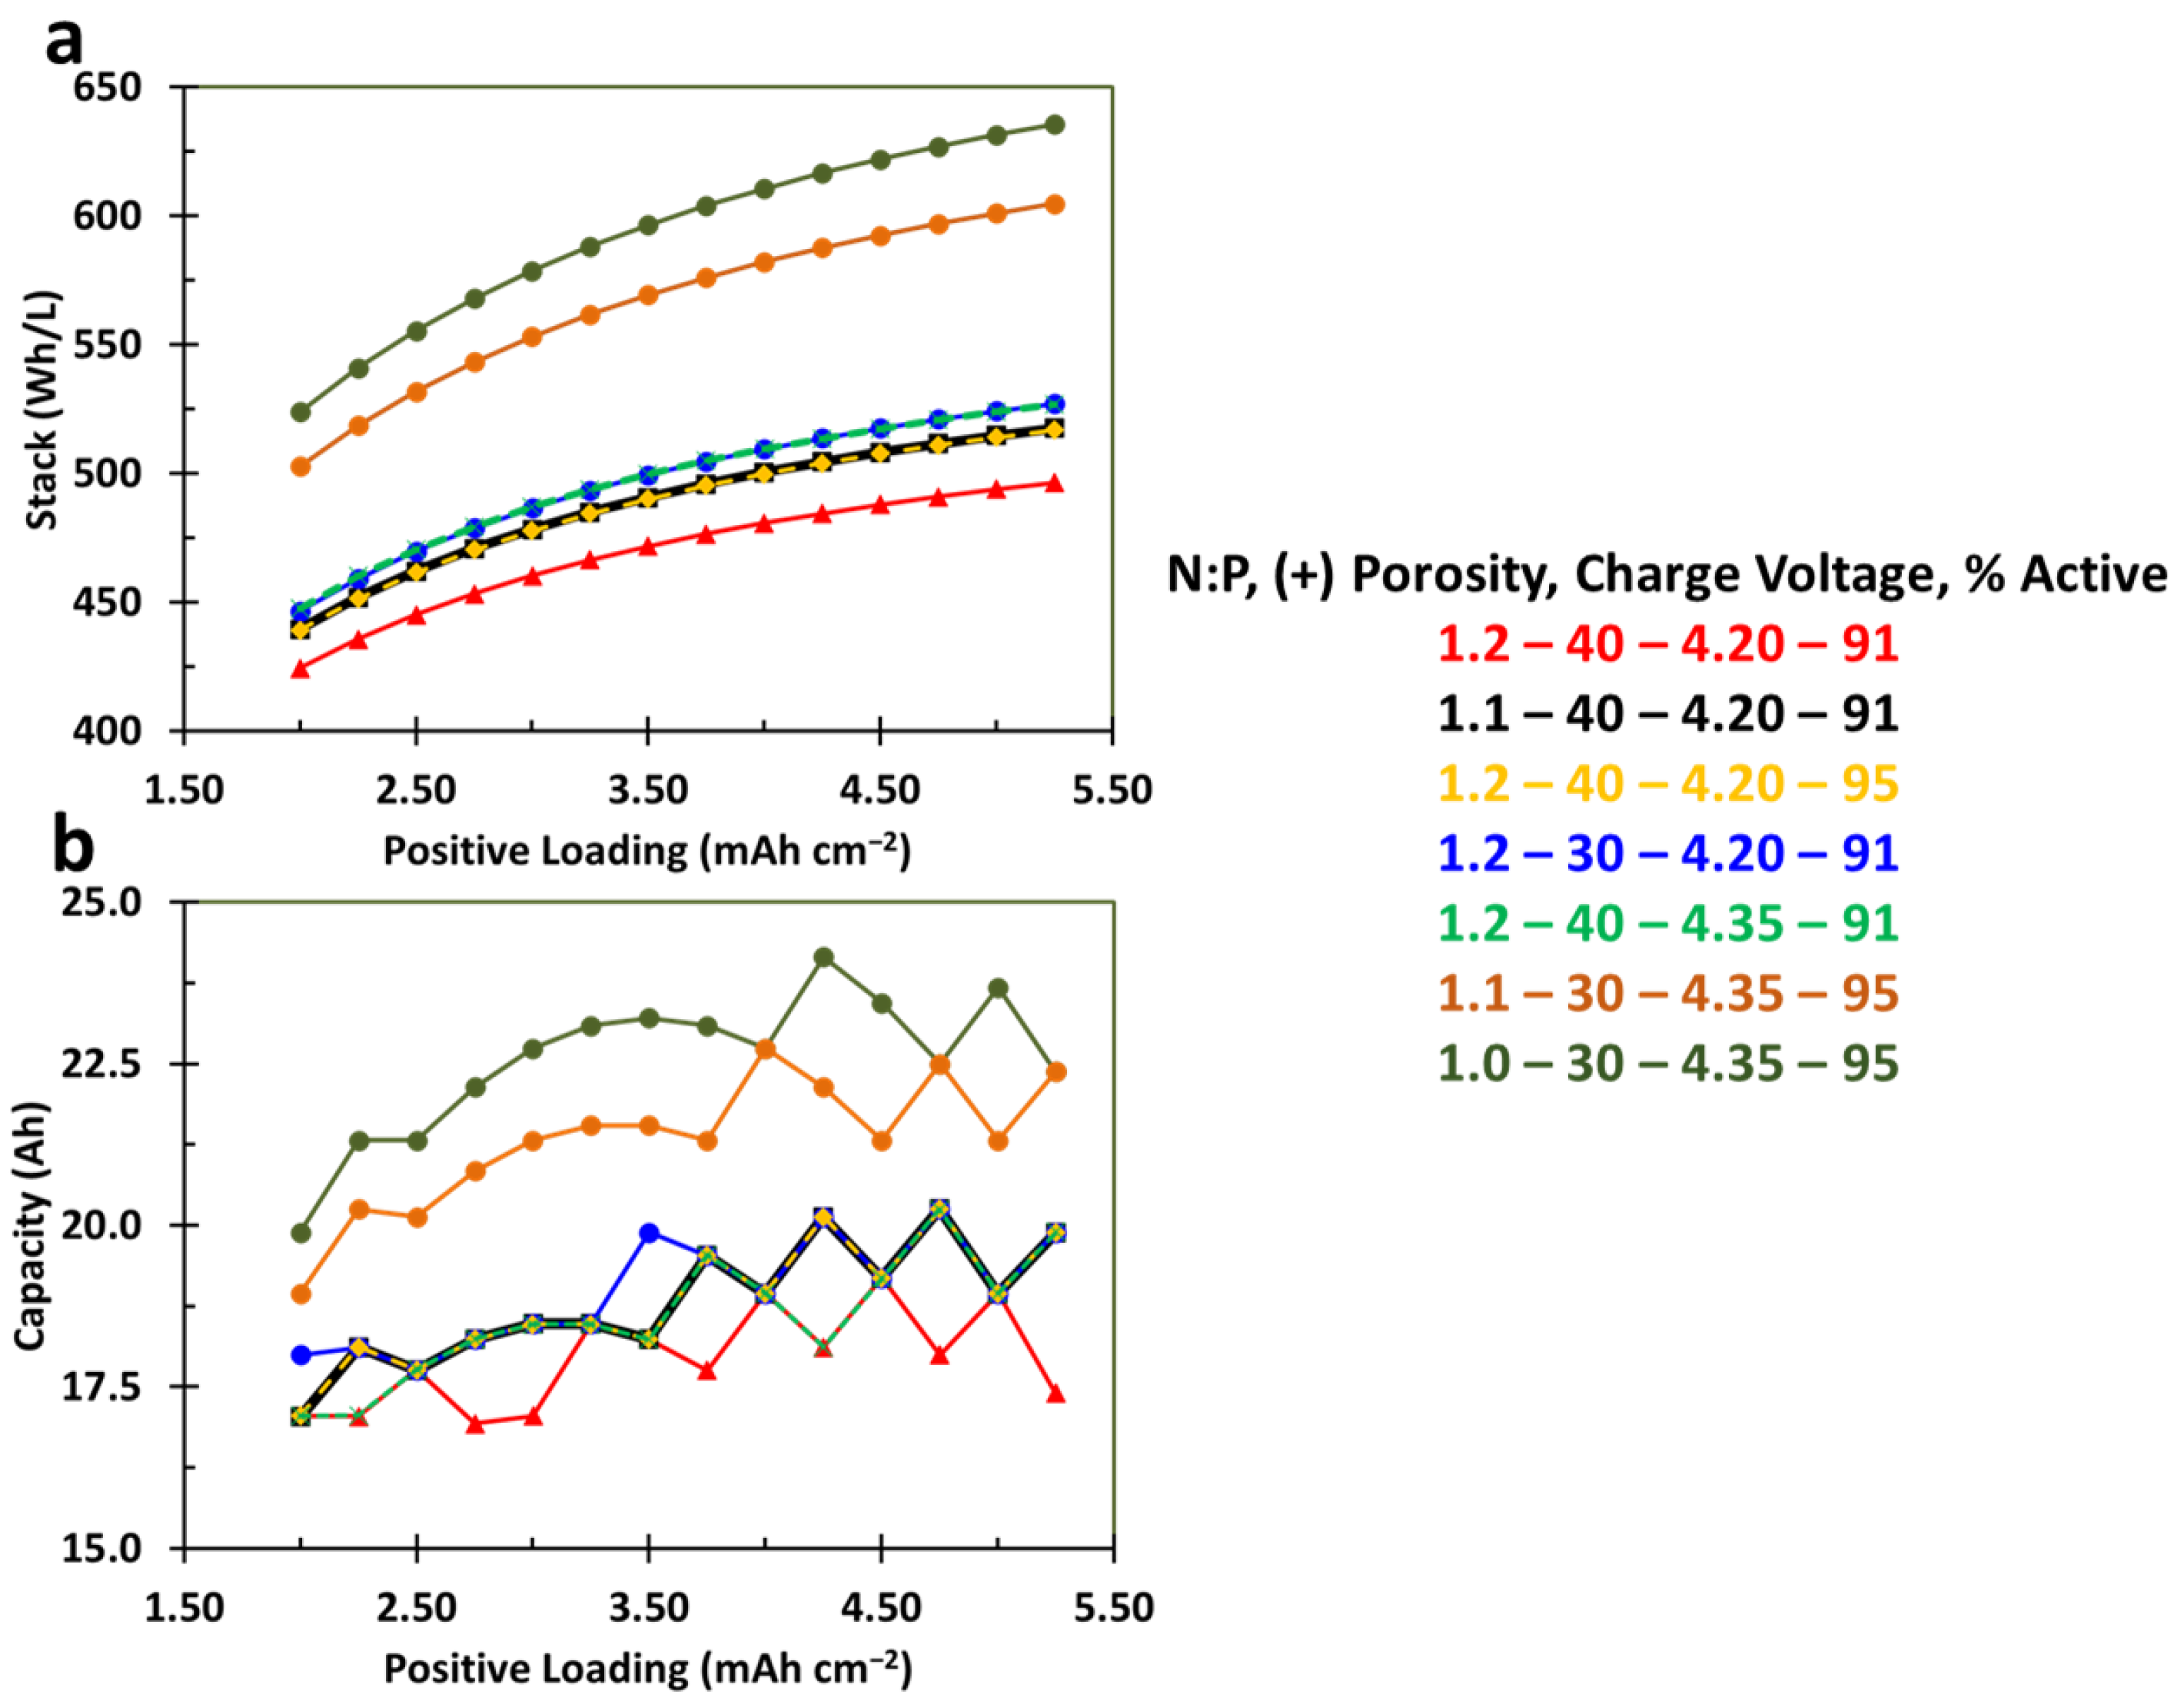
3.4. Combination of Porosity, N:P, Charge Voltage, and Active Material Content

Figure 4 demonstrates the effect each change has on the stack energy density and cell capacity, as well as the effect when all design parameters are combined. The baseline design in each figure (red) represents a cell with an N:P of 1.2:1, 40% positive porosity, a 4.20 V charge voltage, and 91 weight percent LCO. It should be noted that either a change in the N:P to 1.1:1 (black) or an increase in active material content to 95% LCO (yellow) results in an almost identical energy density increase ranging from 3.5 to 4.25% as the areal capacity is increased from 2.00 to 5.25 mAh cm−2. Almost identical increases are also observed when either the positive porosity is changed to 30% (blue) or the charge voltage is increased to 4.35 V (green). This increase compared to the baseline design ranges from 5.2 to 6.2%, increasing as the positive electrode areal capacity is increased. The orange line represents a realistic combination of all parameters: 1.1:1 N:P, 30% positive porosity, 4.35 V charging, and 95 wt% LCO. This design has a stack energy density of 502–604 Wh L−1 and results in an energy density increase compared to the baseline design of 18.5–21.8%. The top line in Figure 4a is the same design as the orange line, except that the N:P ratio has been lowered to 1:1. This design compared to the baseline has an energy density increase of 23.4–28%. Figure 4a shows that a cell with an N:P, porosity, charge voltage and percentage positive active material of 1.2–40–4.20–91 has the lowest stack volumetric energy density. As changes are made to the cell designs, moving downward through the list in Figure 4, we generally see an increase in stack energy density, with 1.1–30–4.35–95 and 1.0–30–4.35–95 delivering the two highest stack volumetric energy densities and cell capacities.

4. Conclusions

With the need and goal to develop cells with increased energy density for EV use, the primary focus of research continues to be the development of higher capacity positive and negative electrode materials such as nickel-rich NMC-based positive active materials and silicon-based, Si or SiOx, negative active materials. As an alternative approach, this work highlights the impact of cell design specifications on the stack volumetric energy density and capacity. Analyzing the impact is often overlooked when implementing manufacturing and material improvements into a full lithium-ion cell design. As materials are developed with higher specific capacities, parameters such as material density, voltage, and electrode thickness should also be evaluated. It is possible for a material with a lower density and higher specific capacity to result in a cell with decreased volumetric energy density due to the increase in cell thickness needed to achieve the same areal capacity for a material with a lower density. The presented evaluation should be paired with material advancements to appreciate and evaluate the full benefit of these advancements.
Some of the design changes that are evaluated are already utilized in commercial cells for various cell chemistries, while other changes currently limit cell performance. The presented results highlight a pathway for increased energy density, indicating which parameters should be a topic of future research. Realizing full-cell energy density at high discharge rates and high-areal capacity is critical for the future implementation of EVs. The presented work demonstrates, through the analysis of numerous cell designs, which cell design parameters have the largest impact on cell energy density. Decreasing the N:P ratio from 1.2:1 to 1.1:1 or changing the positive electrode active material content from 91 to 95% results in an almost identical increase in volumetric energy density. Reducing the positive porosity from 40 to 30% or increasing the LCO charge voltage to 4.35 V from 4.20 V results in a greater increase in volumetric energy density. Combining all design improvements should be the goal of future lithium-ion cell manufacturing, with a 20% improvement in stack energy density possible compared to a baseline cell design.

Funding

Work has been partially supported by the Penn State Hazleton Research Development Grant.

Data Availability Statement

Data available on request due to restrictions.

Conflicts of Interest

The authors declare no conflict of interest.

References

  1. Blomgren, G.E. The Development and Future of Lithium Ion Batteries. J. Electrochem. Soc. 2017, 164, A5019–A5025. [Google Scholar] [CrossRef]
  2. Salgado, R.M.; Danzi, F.; Oliveira, J.E.; El-Azab, A.; Camanho, P.P.; Braga, M.H. The Latest Trends in Electric Vehicles Batteries. Molecules 2021, 26, 3188. [Google Scholar] [CrossRef]
  3. Liu, W.; Placke, T.; Chau, K.T. Overview of Batteries and Battery Management for Electric Vehicles. Energy Rep. 2022, 8, 4058–4084. [Google Scholar] [CrossRef]
  4. Divakaran, A.M.; Minakshi, M.; Bahri, P.A.; Paul, S.; Kumari, P.; Divakaran, A.M.; Manjunatha, K.N. Rational Design on Materials for Developing next Generation Lithium-Ion Secondary Battery. Prog. Solid State Chem. 2021, 62, 100298. [Google Scholar] [CrossRef]
  5. Nitta, N.; Wu, F.; Lee, J.T.; Yushin, G. Li-Ion Battery Materials: Present and Future. Mater. Today 2015, 18, 252–264. [Google Scholar] [CrossRef]
  6. Berckmans, G.; Messagie, M.; Smekens, J.; Omar, N.; Vanhaverbeke, L.; Mierlo, J. Van Cost Projection of State of the Art Lithium-Ion Batteries for Electric Vehicles up to 2030. Energies 2017, 10, 1314. [Google Scholar] [CrossRef]
  7. Divakaran, A.M.; Hamilton, D.; Manjunatha, K.N.; Minakshi, M. Design, Development and Thermal Analysis of Reusable Li-Ion Battery Module for Future Mobile and Stationary Applications. Energies 2020, 13, 1477. [Google Scholar] [CrossRef]
  8. Scrosati, B.; Garche, J. Lithium Batteries: Status, Prospects and Future. J. Power Sources 2010, 195, 2419–2430. [Google Scholar] [CrossRef]
  9. Zheng, H.; Li, J.; Song, X.; Liu, G.; Battaglia, V.S. A Comprehensive Understanding of Electrode Thickness Effects on the Electrochemical Performances of Li-Ion Battery Cathodes. Electrochim. Acta 2012, 71, 258–265. [Google Scholar] [CrossRef]
  10. Kim, Y.; Kim, M.; Lee, T.; Kim, E.; An, M.; Park, J.; Cho, J.; Son, Y. Investigation of Mass Loading of Cathode Materials for High Energy Lithium-Ion Batteries. Electrochem. Commun. 2023, 147, 107437. [Google Scholar] [CrossRef]
  11. Choi, J.; Son, B.; Ryou, M.-H.; Kim, S.H.; Ko, J.M.; Lee, Y.M. Effect of LiCoO 2 Cathode Density and Thickness on Electrochemical Performance of Lithium-Ion Batteries. J. Electrochem. Sci. Technol. 2013, 4, 27–33. [Google Scholar] [CrossRef]
  12. Heubner, C.; Nickol, A.; Seeba, J.; Reuber, S.; Junker, N.; Wolter, M.; Schneider, M.; Michaelis, A. Understanding Thickness and Porosity Effects on the Electrochemical Performance of LiNi0.6Co0.2Mn0.2O2-Based Cathodes for High Energy Li-Ion Batteries. J. Power Sources 2019, 419, 119–126. [Google Scholar] [CrossRef]
  13. Li, D.; Lv, Q.; Zhang, C.; Zhou, W.; Guo, H.; Jiang, S.; Li, Z. The Effect of Electrode Thickness on the High-Current Discharge and Long-Term Cycle Performance of a Lithium-Ion Battery. Batteries 2022, 8, 101. [Google Scholar] [CrossRef]
  14. Danner, T.; Singh, M.; Hein, S.; Kaiser, J.; Hahn, H.; Latz, A. Thick Electrodes for Li-Ion Batteries: A Model Based Analysis. J. Power Sources 2016, 334, 191–201. [Google Scholar] [CrossRef]
  15. Xu, M.; Reichman, B.; Wang, X. Modeling the Effect of Electrode Thickness on the Performance of Lithium-Ion Batteries with Experimental Validation. Energy 2019, 186. [Google Scholar] [CrossRef]
  16. Singh, M.; Kaiser, J.; Hahn, H. Effect of Porosity on the Thick Electrodes for High Energy Density Lithium Ion Batteries for Stationary Applications. Batteries 2016, 2, 35. [Google Scholar] [CrossRef]
  17. Singh, M.; Kaiser, J.; Hahn, H. Thick Electrodes for High Energy Lithium Ion Batteries. J. Electrochem. Soc. 2015, 162, A1196–A1201. [Google Scholar] [CrossRef]
  18. Malifarge, S.; Delobel, B.; Delacourt, C. Experimental and Modeling Analysis of Graphite Electrodes with Various Thicknesses and Porosities for High-Energy-Density Li-Ion Batteries. J. Electrochem. Soc. 2018, 165, A1275–A1287. [Google Scholar] [CrossRef]
  19. Shim, J.; Striebel, K.A. The Dependence of Natural Graphite Anode Performance on Electrode Density. J. Power Sources 2004, 130, 247–253. [Google Scholar] [CrossRef]
  20. Mu, G.; Agrawal, S.; Sittisomwong, P.; Bai, P. Impacts of Negative to Positive Capacities Ratios on the Performance of Next-Generation Lithium-Ion Batteries. Electrochim. Acta 2022, 406, 139878. [Google Scholar] [CrossRef]
  21. Abe, Y.; Kumagai, S. Effect of Negative/Positive Capacity Ratio on the Rate and Cycling Performances of LiFePO4/Graphite Lithium-Ion Batteries. J. Energy Storage 2018, 19, 96–102. [Google Scholar] [CrossRef]
  22. Kim, C.S.; Jeong, K.M.; Kim, K.; Yi, C.W. Effects of Capacity Ratios between Anode and Cathode on Electrochemical Properties for Lithium Polymer Batteries. Electrochim. Acta 2015, 155, 431–436. [Google Scholar] [CrossRef]
  23. Kasnatscheew, J.; Placke, T.; Streipert, B.; Rothermel, S.; Wagner, R.; Meister, P.; Laskovic, I.C.; Winter, M. A Tutorial into Practical Capacity and Mass Balancing of Lithium Ion Batteries. J. Electrochem. Soc. 2017, 164, A2479–A2486. [Google Scholar] [CrossRef]
  24. Lain, M.J.; Brandon, J.; Kendrick, E. Design Strategies for High Power vs. High Energy Lithium Ion Cells. Batteries 2019, 5, 64. [Google Scholar] [CrossRef]
  25. Thompson, L.M.; Harlow, J.E.; Dahn, J.R. Increasing Stack Energy Density Without Lifetime Penalty by Increasing Electrode Loading in Single Crystal Li[Ni 0.5 Mn 0.3 Co 0.2]O2/Graphite Pouch Cells. J. Electrochem. Soc. 2021, 168, 100545. [Google Scholar] [CrossRef]
  26. Sun, P.; Bisschop, R.; Niu, H.; Huang, X. A Review of Battery Fires in Electric Vehicles. Fire Technol. 2020, 56, 1361–1410. [Google Scholar] [CrossRef]
  27. Kuang, Y.; Chen, C.; Kirsch, D.; Hu, L. Thick Electrode Batteries: Principles, Opportunities, and Challenges. Adv. Energy Mater. 2019, 9, 1901457. [Google Scholar] [CrossRef]
Figure 1. (a,b) Stack energy density, electrode pairs, stack thickness, and capacity for cells containing 91% active LCO in the cathode; (c,d) highlight the impact of N:P on stack parameters for a 30% porosity cathode and (e,f) for a 40% porosity cathode. All solid lines correspond to the primary vertical axis and all dashed lines to the secondary vertical axis.
Wevj 14 00279 g001
Figure 2. A comparison of cell characteristics for cells charged to 4.20 V, 4.30 V or 4.35 V. (a) illustrates the stack energy density and electrode pairs, and (b) highlights cell capacity and stack thickness. Solid lines correspond to the primary vertical axis and dashed lines to the secondary vertical axis.
Wevj 14 00279 g002
Figure 3. Impact of cathode active material content on (a) energy density, electrode pairs, and (b) cell capacity and stack thickness. Solid lines correspond to the primary vertical axis and dashed lines to the secondary vertical axis.
Wevj 14 00279 g003
Figure 4. (a) Stack energy increase and (b) cell capacity expected when numerous design changes are implemented on a cell design.
Wevj 14 00279 g004
Table 1. Fixed components for EV cell design.
ComponentDimensions Material
Positive Current Collector20 µmAl foil
Negative Current Collector10 µmCu foil
Cell Packaging113 µmDNP
Separator25 µmPolypropylene/Polyethylene
Negative Electrode200 mm × 120 mm-
Positive Electrode199 mm × 119 mm-
Separator 1201.75 mm × 120 mm-
1 Overall separator dimensions are used for stack length and width for stack energy density calculations.
Table 2. Cell designs evaluated for impact on energy density.
Weight % LCO, CC, PVDFComposite Density (0% Porosity)Charge Voltage Positive PorosityN:P Ratio
91-5-44.363 mg/cm34.20, 4.30, 4.3540%, 30%1.0, 1.1, 1.2
95-3-24.627 mg/cm34.20, 4.30, 4.3540%, 30%1.0, 1.1, 1.2
Disclaimer/Publisher’s Note: The statements, opinions and data contained in all publications are solely those of the individual author(s) and contributor(s) and not of MDPI and/or the editor(s). MDPI and/or the editor(s) disclaim responsibility for any injury to people or property resulting from any ideas, methods, instructions or products referred to in the content.

