1. Introduction and State of the Art
Greece is still at a very early stage of electric vehicle (EV) infrastructure compared to other European countries, which are already in line with recent EU carbon-reduction targets. According to the latest National Plan for Electromobility, Greece achieved a 6% market share of EVs by the end of 2021 and aims to reach 24–30% by 2030. Less than 3000 Battery Electric Vehicles (BEVs) were in circulation in Greece by the end of 2021. The fact that Greece has one of the most ageing car fleets in the EU could boost the support for their withdrawal and replacement with new zero-emission EVs [
1].
The energy needs of an EV depend on many parameters; a careful study is required in order to develop a profile for each EV and predict the daily energy demand. There is an abundance of studies and reviews on modelling the EV charging demand available in the literature; pioneering research dates from the 1980s and 1990s [
2,
3,
4,
5,
6]. Nowadays, an accurate EV charging model is an essential tool for predicting the impact of EVs on the electricity grid. Several models rely on monitoring the charging behaviour of a small group of EVs; these data are then used to generate the demand profile of a larger number of EVs [
7,
8,
9,
10,
11].
Gerossier et al. used a set of 46 privately owned EVs located in Austin, Texas [
11] that were restricted to slow residential charging. Charging was mostly modelled based on start-up time of day and duration of charging, and EVs were divided into four clusters based on these two variables. It was found that the electric consumption related to EVs was responsible for approximately 15% of total household consumption. No statistical differences were detected in the charging habits between weekdays and weekends, which is also in line with the very low intra-week variations of electric load in Texas. For an average EV, there were 150 days per year with no charging at all, 158 with only one charging cycle, and 57 with two or more charging cycles. According to the results, an average user will perform several ‘residual’ charges, but the related probabilities remain unclear.
Quirós-Tortós et al. [
12] analysed real data from the charging of 221 EVs in the United Kingdom. All EVs were of the same type and also restricted to slow residential charging. A total of 68,000 charging events were monitored for a whole year, i.e., an average of 0.84 daily charges per EV. The initial and final State of Charge (SoC) per charging was recorded, and they presented rather unexpected distribution curves. Approximately 70% of EVs were charged only once per day. The first and second daily charging were modelled separately, but some of the results are confusing since it is never certain which one is the main charge and which is the residual. It was concluded that EVs might be charged more than once a day; most start charging with an SoC between 25 and 75% of the battery capacity, and 7 out of 10 tend to fully charge. The annual average load per EV is estimated at 0.29 kW.
Another case study, with different content, took place in Belgium [
13]. This study focused on the daily profile of charging load, considering the CO
2 emissions rate of the electricity mix per hour and investigating the optimal charging hours that would minimise the total emissions in a Life Cycle Assessment of BEVs. The study monitored five EVs for an annual period and showed that the test vehicles were charged mostly during the daytime, from 08:00 to 22:00. It was assumed that the users opportunistically charged their EVs continuously at work and, later on, they might plug the EV in immediately after coming home.
Ashtari et al. [
14] recorded usage data for 76 EVs in a one-year period in the city of Winnipeg, Canada. The EVs were charged at home, at work, and at a shopping mall with two different slow charging rates (around 1 and 3 kW). The total load profile peaked around 17:00–18:00 when the users returned home.
Zhang et al. [
15] made the first efforts to propose different EV charging load curves based on owner demographics and social characteristics (e.g., gender, age, education level). Zheng et al. [
16] proposed load curves for four types of EVs, private cars, electric taxis, electric buses and official vehicles. Several other studies presented Monte Carlo Simulation approaches for loading profiles, with EVs charging at different locations during the day, usually at work and at home [
17,
18].
Regardless of the model assumptions and grid topology, there is an interest in the impact of EV charging on the electricity grid [
19,
20,
21,
22,
23]. This impact has been assessed by several studies and can generally be summarised as having two effects: demand increase (given that an additional load is introduced) and changes in the diurnal load profile (for example, changes in peak demand and peak-to-average demand ratio). Both effects can potentially influence electricity generation, as well as transmission and distribution infrastructures. An early comprehensive study by the National Renewable Energy Laboratory (NREL) indicated that increased electricity consumption due to EV charging will have a limited, if any, negative impact on the electricity generation infrastructure in the United States and identified the impact on distribution networks as the most pressing issue [
24]. In all of the regions considered in the study, the increase in total electricity demand remained below 5% for an EV market share of up to 25%, and below 10% for an EV market share of 50%.
Bizzarri et al. proposed an EV usage model for the city of Milan, Italy, to simulate time–spatial distribution of vehicles and their battery state of charge in order to perform an impact analysis [
25]. Similarly, Gruosso et al. combined bottom-up EV and residential load modelling to show that uncoordinated EV charging could create voltage imbalances in a low-voltage distribution test network [
26].
Controlled charging was explored in [
24,
25,
27]. Clement et al. proposed the use of coordinated charging to minimise the impact of plug-in hybrid EV charging in terms of transformer and feeder overloads, power losses, power quality and, eventually, maximising the main grid load factor [
27]. Su et al. use a Monte Carlo simulation to deduce the daily power demand for Auckland, New Zealand [
7], based on various EV charging strategies. This case study proposed the rescheduling of EV charging in relation to residential loads so as to flatten the load curve and postpone the investment of network reinforcement. Ensslen et al. [
28] estimated the future aggregated EV load curves for France and Germany under scenarios of direct (uncontrolled) charging and time-shifted charging. Numerous charges are shifted from the evening hours into the night-time and noon hours due to lower day-ahead market prices in these hours.
EV charging is often correlated with the operation of photovoltaic systems; in [
29], the authors evaluated the solar rooftop potential for the city of San Francisco and compared it to vehicle energy use. The results showed that the annual yield of the PV panels is higher than the charging load of the EVs, in kWh/capita. This result was valid for all population densities. In [
7], the authors made a similar calculation for the city of Auckland, New Zealand. This study was restricted to the efficient facades and roofs, depending on the tilt and orientation of the PV panel, and concluded that the person share of PV production could accommodate the EV charging load, regardless of the population density. The studies described above used deterministic assumptions for the EV models, but other studies used stochastic assumptions, which led to different results [
30].
Dominguez-Navarro optimised the synergy of a fast-charging station and renewable units using genetic algorithm techniques [
31]. Probabilistic distributions were used for realistic modelling of EV demand and renewable generation. In particular, the arrival rate of EVs during the day is a critical aspect of such a study. The feed-in tariffs for renewables, the prices for buying energy from the grid and selling energy to EVs, the use of a battery, capital costs, etc., were all investigated. The main inconvenience occurred when the station had to exchange power with the grid due to non-coincidence of generation and demand profiles.
Fretzen et al. studied the city-scale coordination of PVs and EV charging (based on data from the city of Rotterdam, Netherlands) [
32]. They proposed several priorities for the controlled charging of EVs, depending on the SoC, the urgency of needs of the vehicle, and the available solar energy. They concluded that for a week in spring, the fraction of EV charging load provided by solar panels can rise from 50% to 75% when shifting from uncoordinated to fully coordinated charging. They also considered that coordinated strategies are unobtrusive for the driving preferences of EV owners. A review of many similar projects was provided by Shepero in [
33].
Each of the above works is valuable in exploring certain characteristics of EV charging demand. For instance, several projects monitor a small fleet of EVs (usually a two- or three-digit number of vehicles) and gradually bring out and highlight aspects of charging behaviour. Yet, there are very few works focusing on the extraction of diurnal, weekly, and seasonal curves of EV charging load demand on a national or regional level. One of them is an extended report about the British National Grid [
20]. Several other pieces of research approached different EV charging issues or introduced certain novelties and occasionally ended up in a charging load curve, e.g., [
7] for New Zealand, [
28], France and Germany, [
11], and Texas, but this estimation is obviously simplistic, and it is not the basic aim of the authors.
Since EV fleets will be growing in the next decades, the impact on the power systems of each country has to be estimated, projected, and then continuously monitored and updated. Our paper provides such a guide for modelling this demand for the Greek Power System; it includes all relevant inputs, necessary assumptions on the size and mix of EV fleet; battery capacities; travelling schedules and charging habits; charging rates, locations, and strategies; weekday–weekend and seasonal effects, etc. Monte Carlo approaches are often adopted to cope with the complexity of the problem, and transparency is provided by presenting distribution curves for a variety of critical input parameters of the fleet (daily travelled distance, departure–arrival time, traffic volume, etc.).
The rest of the paper is structured as follows:
Section 2 introduces the 10,000 EV database that will be simulated and describes the basic elements and key parameters of the vehicles or the simulation itself (e.g., type of days, time step, etc.).
Section 3 describes in detail the annual simulation process and provides additional insight into how the seasonal effect is modelled and how the daily stochastic factor is added to the reference behaviour parameters that were set for each EV (e.g., departure/arrival time, daily distance).
Section 4 presents simulation results and relevant statistical analysis.
Section 5 explores the additional PV capacity in Greece that will compensate for the EV charging needs, while
Section 6 concludes the paper.
2. Input Parameters and Data Analysis
The energy needs of an EV depend on several factors, and careful study is required in order to accurately simulate the diurnal driving and charging profile for each vehicle. For this reason, numerous parameters have to be set, the mix of the EV fleet needs to be defined, and an algorithm has to be developed to manage the stochastic daily behaviour of the drivers.
A representative sample of 10,000 EVs was considered for this purpose. The number of EVs per class and category, the capacities of their batteries, the charging rates, etc., were determined in correlation with other stochastic factors, such as their daily driving schedule and arrival and departure times. Thus, several decisions have to be made regarding the distribution of values of each parameter within the whole fleet or category of EVs or the variations in the daily driving behaviour per vehicle. Monte Carlo simulation was used to assign random values (following the proper distribution) for each EV or for each day to produce different scenarios. All of the parameters and variables involved are outlined as follows:
- -
Vehicle categories;
- -
Battery capacity (kWh);
- -
Consumption of EVs (kWh/km);
- -
Charging location/strategy;
- -
Charging rate (kW);
- -
Departure/arrival time;
- -
Daily distance travelled (km).
EVs (based on their size and use) are classified into the following three basic categories:
L7e: Small four-wheeled EVs weighing up to 400 kg (excluding the load and battery) or up to 550 kg for vehicles intended to carry goods.
M1: Typical passenger cars with a maximum of nine seats.
N1: EVs for the carriage of goods up to 3.5 tonnes (without cargo). This category includes semi-trucks and light commercial vehicles.
It is assumed that the three basic classes will form the total of the EVs from 2020 onwards and will comprise 4% L7e, 90% M1, and 6% N1. This estimation is based on the recent statistics of car sales in the Greek market per year, but it also considers research estimations for the EU market. The range of battery capacities per class is provided in
Table 1.
An algorithm is proposed in order to perform detailed modelling of charging sessions for a representative fleet of 10,000 EVs in Greece. This number refers to the Greek National Plan and may be reached by 2024–2026.
The process follows the driving and charging sequence of each EV, individually, with a 15 min step for an annual period, and will eventually formulate the aggregate load curve of the fleet. Some of the basic issues involved in this simulation are analysed as follows:
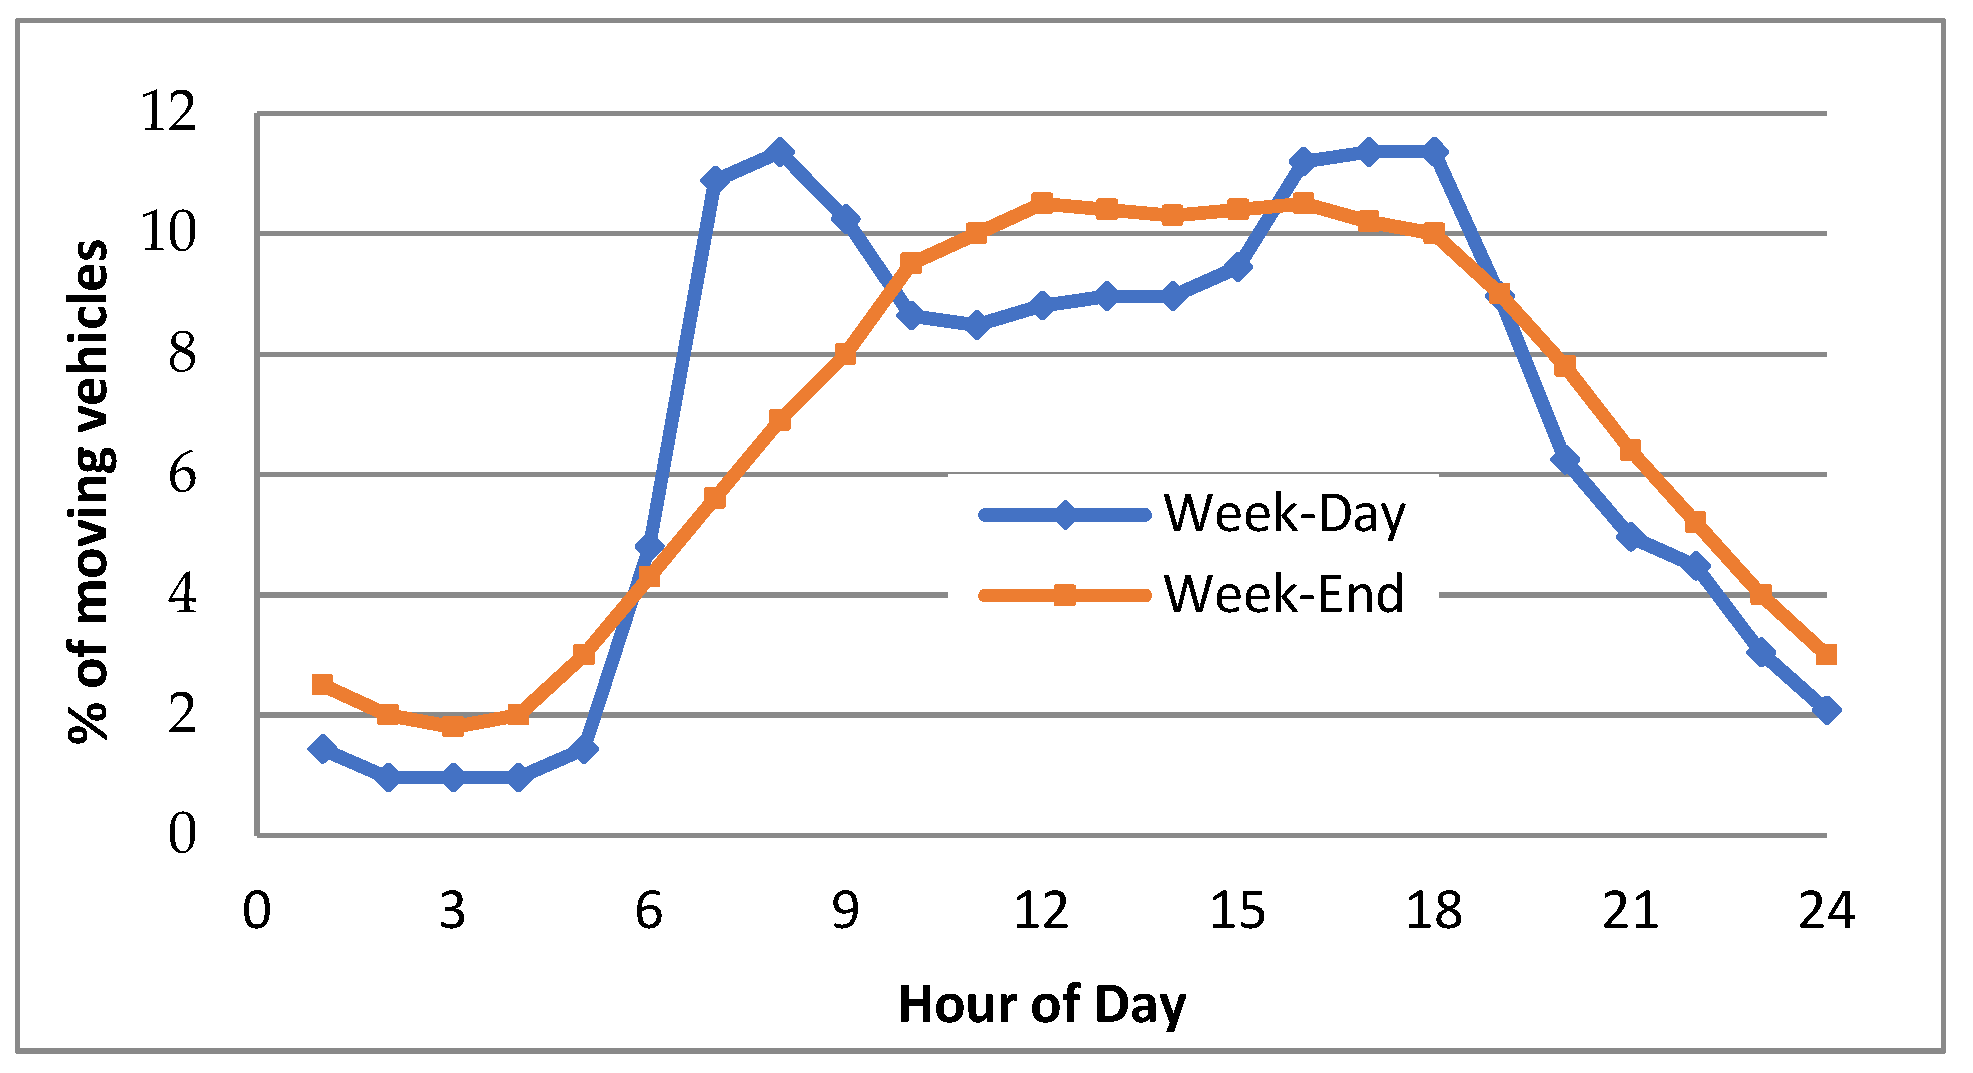
Type of Day: Every day of the year is characterised as a weekday or weekend and is modelled so that the hourly traffic volume of the fleet is compatible with the generic profiles of
Figure 1. Holidays are considered to be weekends, and the seasonal effect is also incorporated, as will be described later.
Therefore, for each day of the year, different reference values for driving distance and departure/arrival time will be activated for each EV.
Time Step: The time step for this study was set to 15 min in order to facilitate an accurate simulation. During a time step, the external environment is considered unchanged, so any event (start/end of charging session, arrival and departure time) is only studied for integer multiples of this time step. In other words, each day is divided into intervals i = 1, …, 96.
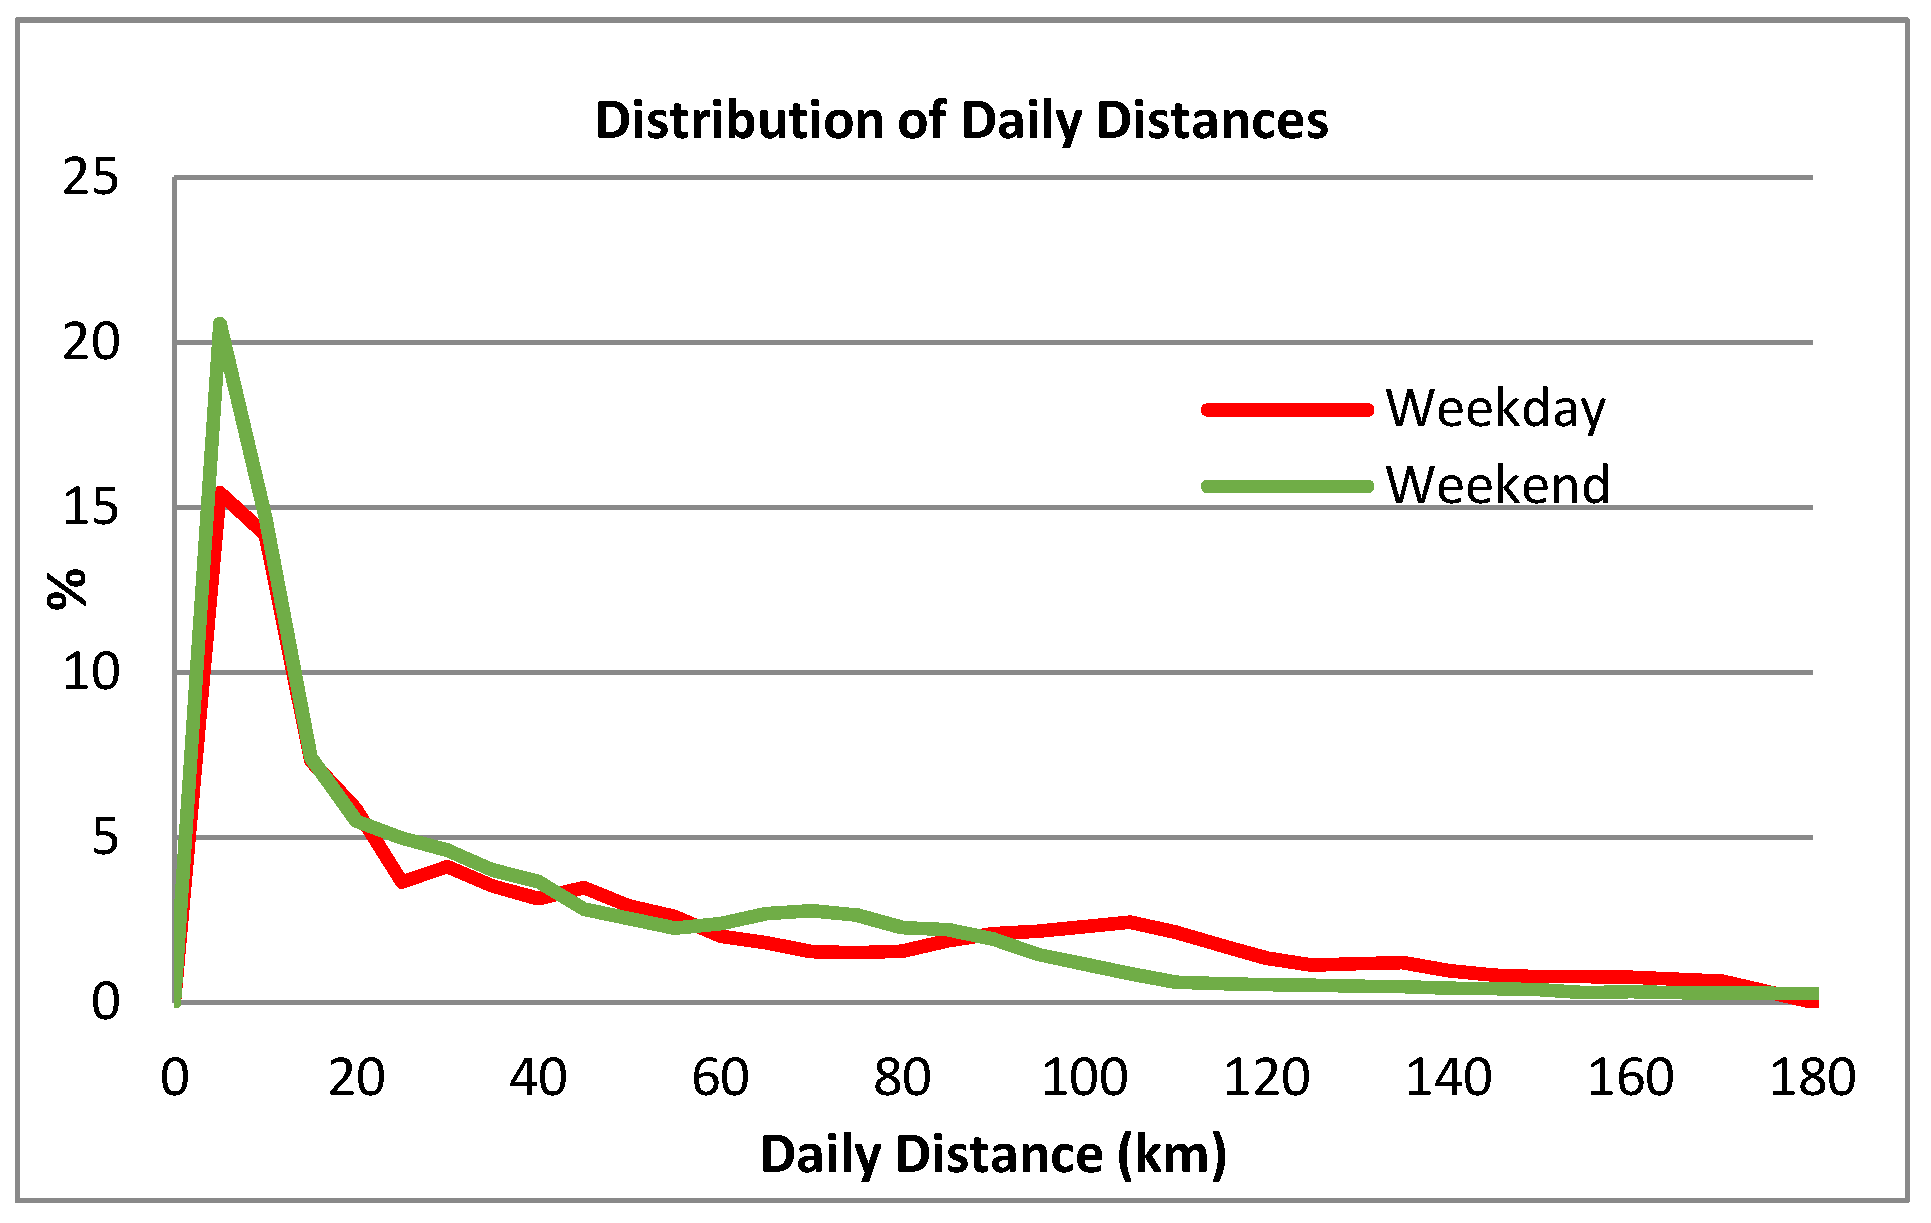
Driving Schedules: Reference values were set for the weekday and weekend driving schedule of each EV (see
Figure 2). This schedule includes the departure time and arrival time from/to home, work, or another destination and distances covered (km). Random deviation is added to the above values, and seasonal changes are incorporated into the time schedules.
Battery Capacities: Table 1 presents data for the minimum and maximum values of the battery capacities in the EVs of the fleet, depending on class and type. A distribution of values was formulated using all available statistical data. Battery capacities were also chosen to match the driving schedules of the EVs.
Consumption: Typical values for consumption (in kWh/km) are provided in
Table 2 and were distributed and utilised for the simulation.
State of Charge (SoC): This variable is monitored for each time step of the simulation. Discharging is based on the assessments for the driving schedule and the consumption rate of each EV, while charging considers the appropriate charging rates at home, work, or public locations and incorporates a typical charging curve. For each EV, a random initial value was set for the SoC at the beginning of the annual simulation.
Charging Rates: According to Greek legislation (Hellenic Ministry of Environment and Energy decision no. 4743, 2021 on Law 4495/2017), the charging levels considered in the simulation were 3.7 kW (residential), 7.2–22 kW (at work), and 22–150 kW (fast commercial charging).
Charging Schedule: Various charging habits were considered utilising all the available knowledge retrieved from the previous research. The charging sessions per day were adjusted to the driving schedules. The time schedule was different for domestic charges, charges at work, and fast charges.
It is critical for the simulation to pick the beginning time of each charge. The evolution of the process depends on the initial SoC, the charging rate, and the charging curve of the battery. A variety of charging curves were considered and simulated, either typical or commercial (see
Figure 3).
Charges may start after the arrival at work or home, while fast charges depend on the travel schedule. Owners were considered to proceed to regular home charging when the SoC was less than 50%. Additionally, research showed that, in real life, the owners often performed domestic residual charges, usually in the afternoon [
11]. Lastly, domestic charges may begin automatically after midnight based on a time-of-use tariff for electricity.
Charges at home and work are finalised or interrupted when the user has to depart; thus, the SoC may have a value close to or higher than 90%. On the contrary, a random duration between 30′ and 60′ is considered for each fast charging session; the final SoC is calculated accordingly.
3. The EV Charging Model
In this paper, we present a stochastic model for EV charging. The following calculations are realised for each EV independently and each day of the year with a 15 min step:
- -
The EV parameters were loaded (category, battery capacity in kWh, consumption in kWh/km, reference departure and arrival times, charging location/strategy, and reference daily distance in km). All EVs were considered to have access to home charging, while 15% of them were marked as having access to charging at work. The above-mentioned reference values were provided separately for weekdays and weekends.
- -
The daily parameters were loaded per EV. This means that, based on a Monte Carlo approach and depending on the type of day (weekday or weekend), different parameters were produced, slightly deviating from the reference values. This refers to departure and arrival times and daily distance. Additionally, the seasonal effect was considered, which introduces a systematic variation of reference values, as will be detailed later.
- -
Thus, a certain driving schedule was formulated for certain EVs on a certain day, while the SoC of the vehicle, based on its previous status, was sequentially monitored and updated.
- -
Depending on the above, the charging needs were considered, and plug-in time and charging mode (fast/slow, home/work) were decided.
- -
The duration and the end of the charging session were calculated based on the charging curve of the battery and the EV driving schedule (the latter means that the charging may be interrupted before reaching 100% of SoC). The load demand time series (for the specific vehicle and day) were produced with a 15 min step.
- -
The above process was followed for each of the 10,000 EVs independently, and the aggregated load demand was extracted.
- -
The incorporation of additional issues, e.g., residual charges, will be detailed later. A comprehensive block diagram of the simulation is presented in
Figure 4.
Some issues related to the above model are now described in detail, and indicative statistics are provided:
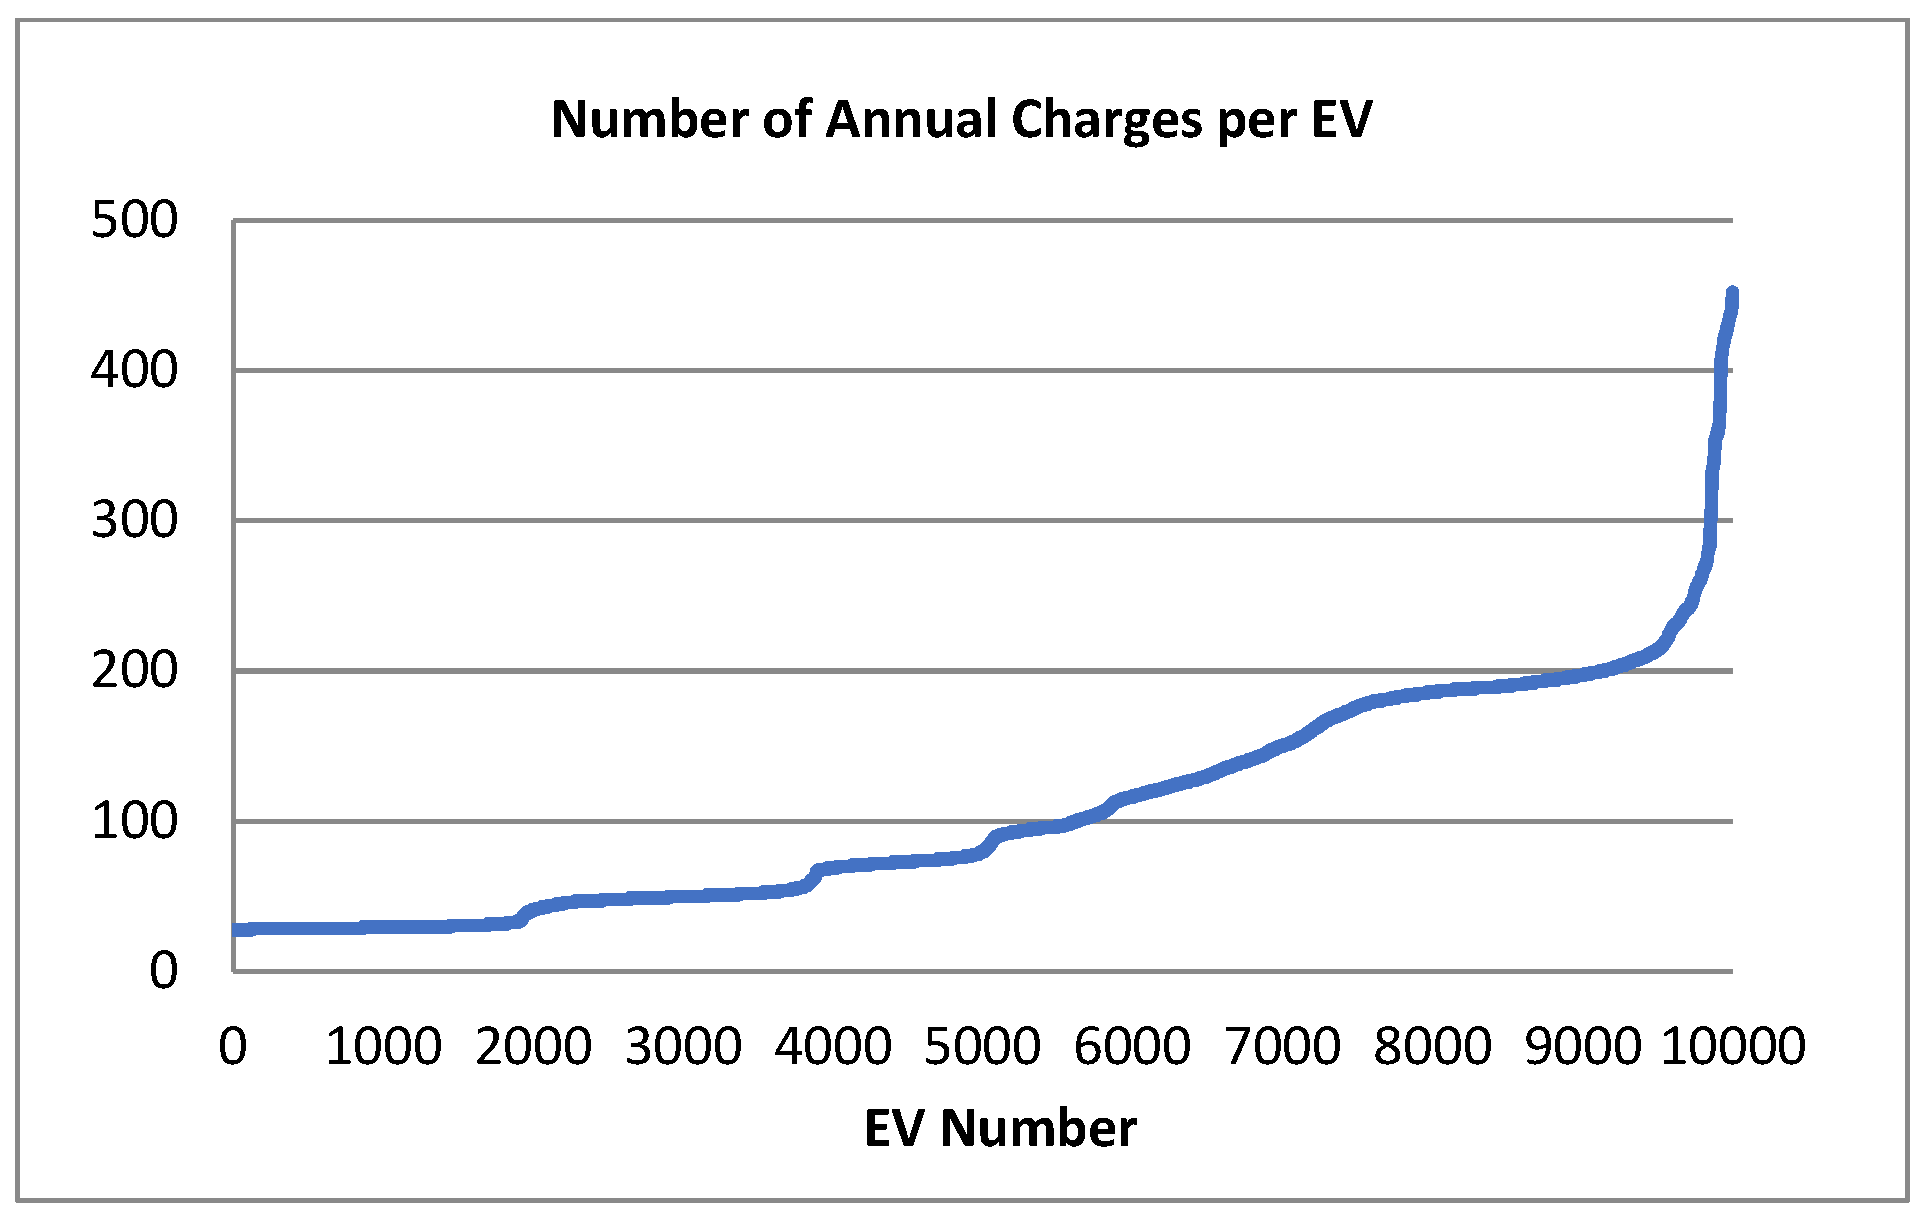
Frequency of charging sessions: The aggregated results for an annual simulation of 10,000 EVs suggest that 99.1% of the vehicles are charged less than once per day, while 35% are only charged once per week (see
Figure 5).
Regardless of the type of day, the first charge might occur at any time during the day, but a second one is more likely after 8 h. During weekends, there is usually only one charge, either on Saturday morning or Sunday night.
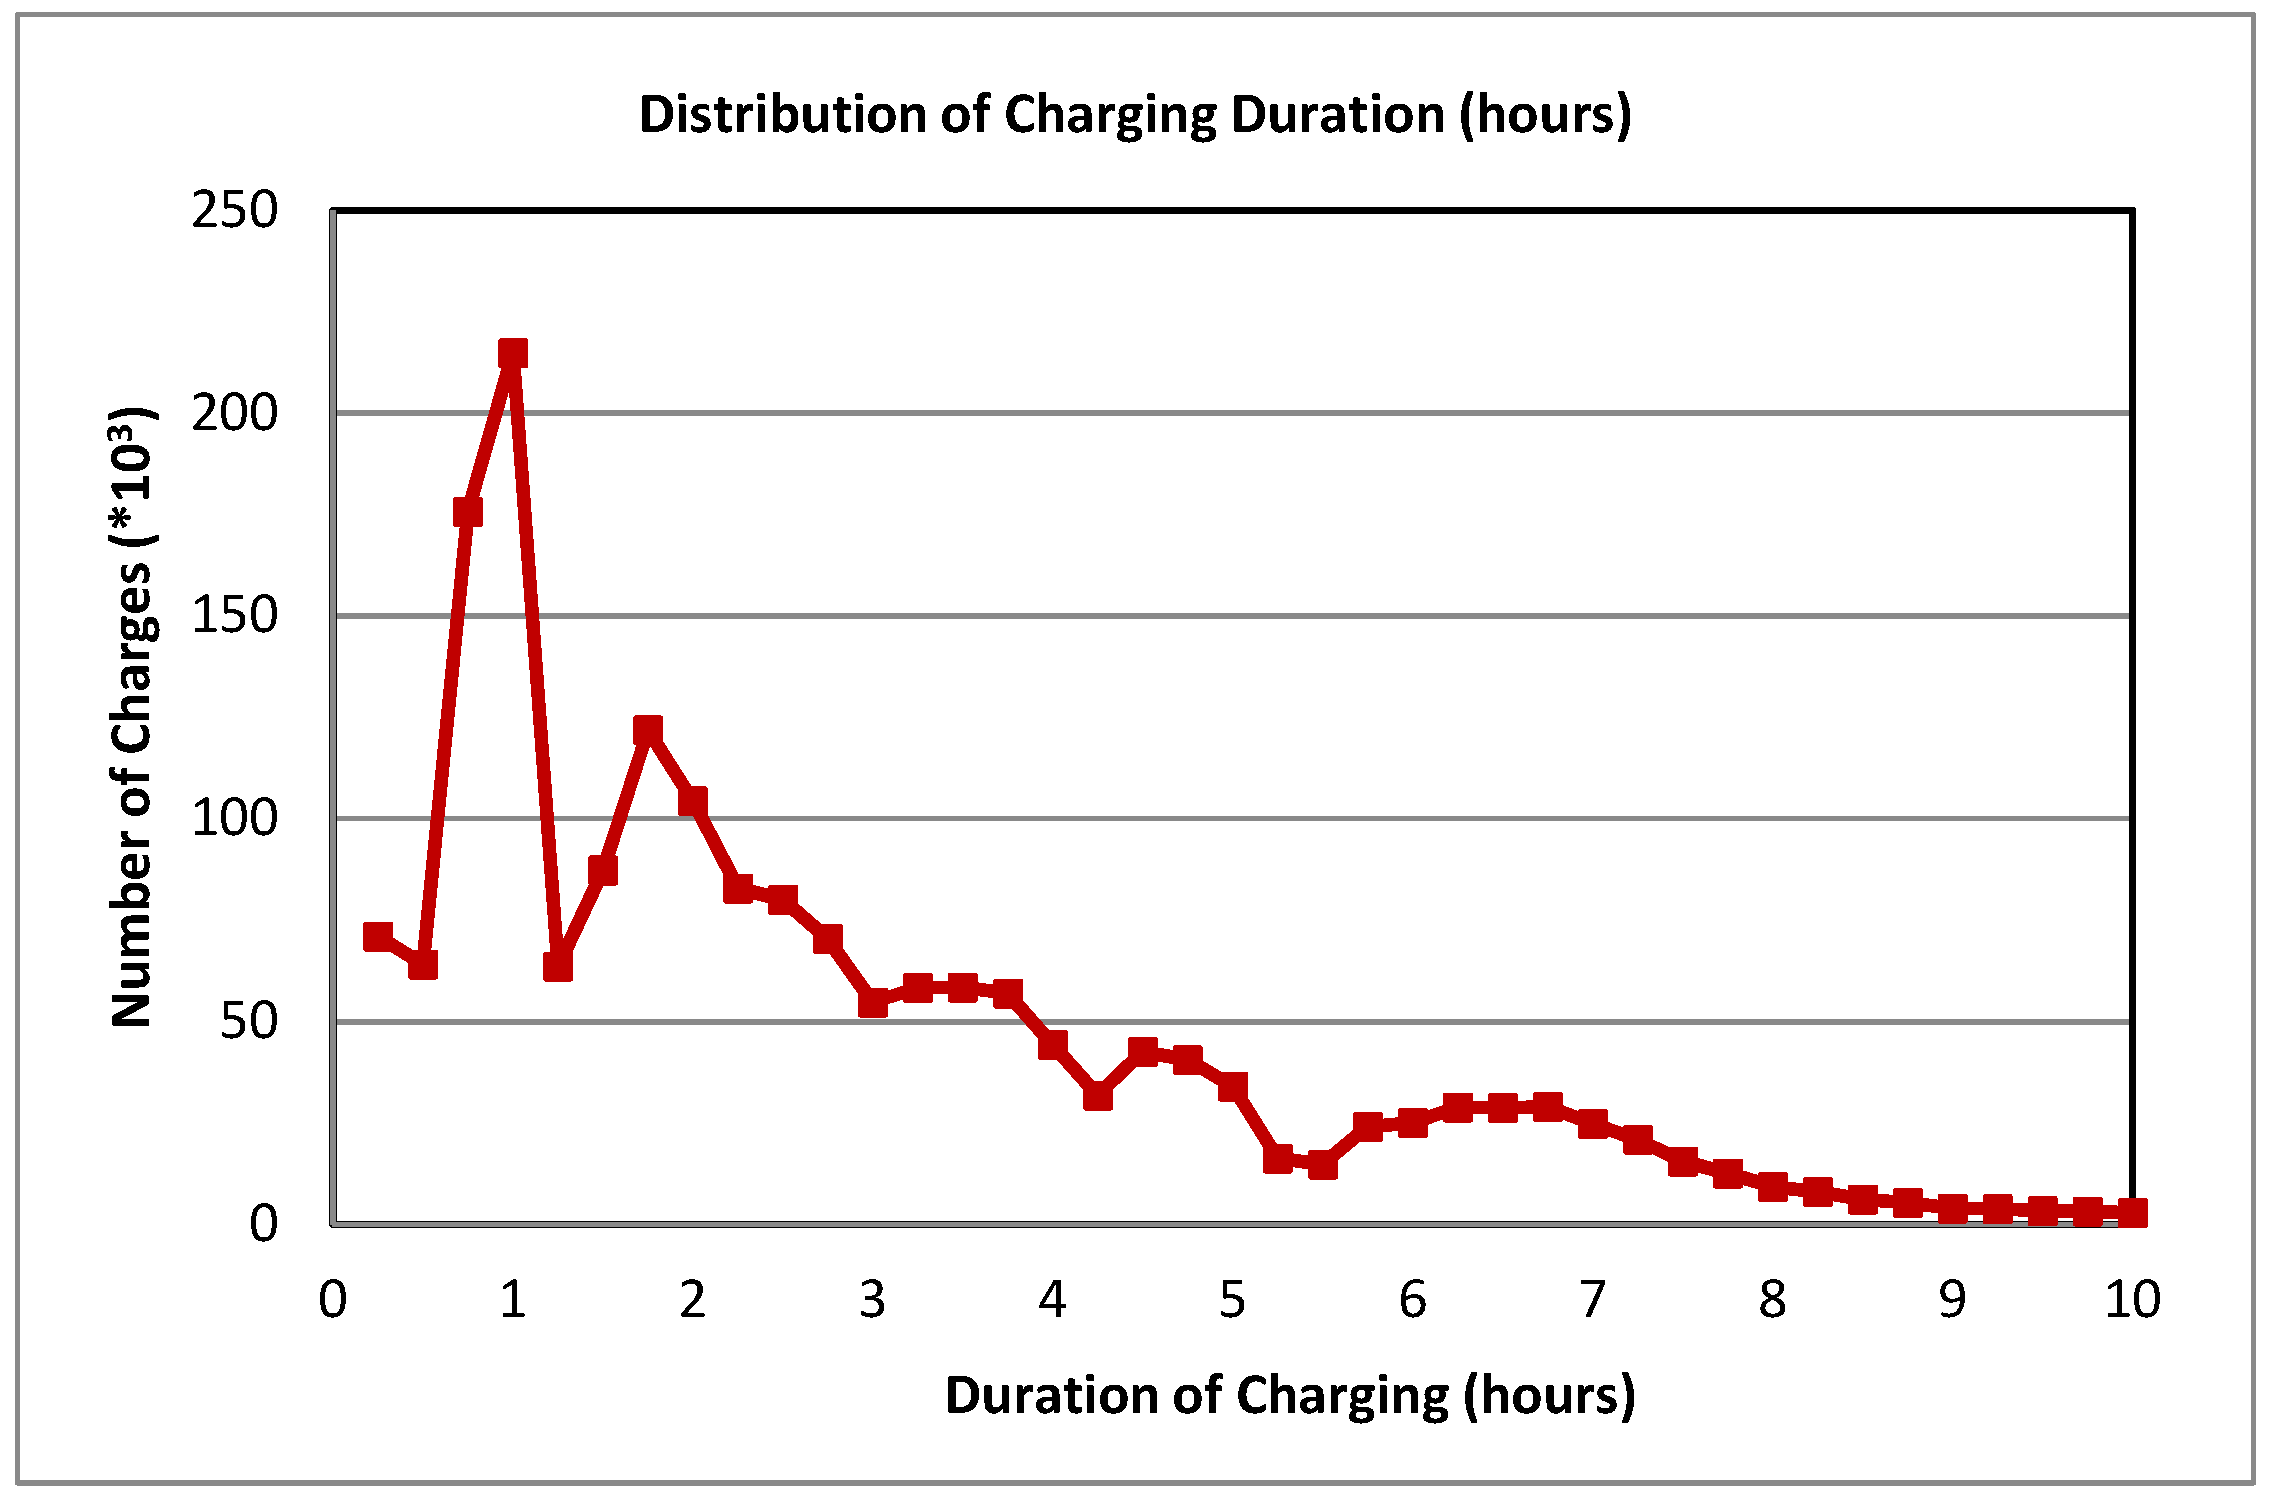
Home charging: During weekdays, according to our modelling, home charging begins immediately after the completion of the day’s final journey if the battery charge status (SoC) is less than or equal to 50%. This is reflected in
Figure 6. Charging may last until the time of departure of the EV the next morning. Statistics show that the median home charge lasts 2.5 h, and only 5% of them last more than 7 h (see
Figure 7). These durations refer to both regular and residual charging sessions.
Approximately 60% of the total fleet carries out one charge every 3–7 days, due to the limited mobility requirements in relation to their battery capacity. Almost 25% of the fleet carries a household charge every 2 days, while even fewer (15%) charge daily.
When the driving requirements are increased for an EV, then it usually charges both at an external charging station and at home upon arrival.
Residual Charging: This term refers to domestic partial charging and covers up to 17% of all charging sessions. This is a rather undesired case which also featured in other research and occurs for the following reasons:
- (a)
A scheduled full charging remains incomplete because the owner of the EV has to depart.
- (b)
The owner decides to charge, even though SoC is above 50%.
- (c)
Most of the residual charging sessions differ from the usual home charges because they start during the morning or the afternoon.
External fast charging: Fast charging occurs at rest areas, malls, gas stations, etc., usually when the EV has an extended travel schedule. It turns out that fast/public charges cover 16% of all charging sessions.
External/work charging: It was estimated that one-seventh of the Evs have access to charging at work. These chargers are, in general, faster than household ones (e.g., 7.4 or 11 kW). The respective charging sessions occur mostly on weekdays, and yet it is considered that a quarter of the above EVs also charge at work during weekends.
Daily distance: The daily distance profile (for weekdays and weekends) follows the distribution curve in
Figure 2. For 85% of the cases, travel distances do not exceed 100 km on weekdays. The average distance of all EVs is around 45.3 km on weekdays (median is 24 km) and 37 km on weekends and holidays (median is 18 km). These statistics do not include days/cases of EV immobility.
Departure/arrival time: Two of the most important implicated parameters are the departure and arrival time-stamps, as they define the daily travelling profile of the EV and eventually determine the charging process, its type, start time, and duration. A different profile was set for each EV in the data set, incorporating all available data from the literature. The data for an annual simulation are summarised in
Figure 8, where the distribution curves for departure and arrival times are presented using a time step of 15 min. The departure times are usually determined by working hours. It should be emphasised that the arrival times (which present a wider range) strictly refer to the last daily arrival at home.
Simulation of Seasonal, Weekend and Daily Effects: The seasonal effect was stochastically introduced to the driving schedules of each EV, as explained in Equations (1) and (2).
where
i = 1, …, 365 is the day of the year.
j = 1, …, 10,000 is the number of EVs.
depjref is the reference departure time for each EV (in hours).
depij is the actual departure time for each day of the year and each EV, after the seasonal effect and the daily effect is added (in hours).
arrX are respective terms for arrival time.
randj(0, 1) is a uniform distribution between [0, 1]; it constitutes a constant random effect per EV, representing the driver’s low or high seasonal deviation from the reference schedule.
randi(0, 1) is a uniform distribution between [0, 1]; it represents a random daily deviation from the reference schedule of each driver. As implied in Equations (1) and (2), the departure or arrival time can have an additional daily deviation of ±5%. Thus, for a departure time at 8 a.m. and arrival time at 8 p.m., this means a deviation of ±20 min and ±1 h, respectively.
The sinusoidal functions of Equations (1) and (2) are typically used in many similar problems to simulate the seasonal effect. They determine how both departure and arrival times have their lowest (earliest) values in mid-winter and highest (latest) values in mid-summer.
In general, during weekends, the reference departure times are about three hours later, and reference arrival times are two hours later. The range of the seasonal effect is also increased (50% for departure time and 25% for arrival time).
4. Results and Statistics of Charging Demand Modelling
The simulation resulted in a total of 1,074,274 charging sessions, so each EV was charged just over 107 times a year, on average.
About 75% of these charging sessions are home charges, specifically regular night charges (53.3%) and residual charges (22.1%). About one in seven EVs has access to charging at the workplace. Charging sessions at work cover 7.4% of total charges. Lastly, the remaining 12.1% of the charging sessions are fast/public charges, which are most frequent among the N1 EVs, as well as M1), with travelling profiles of long distances.
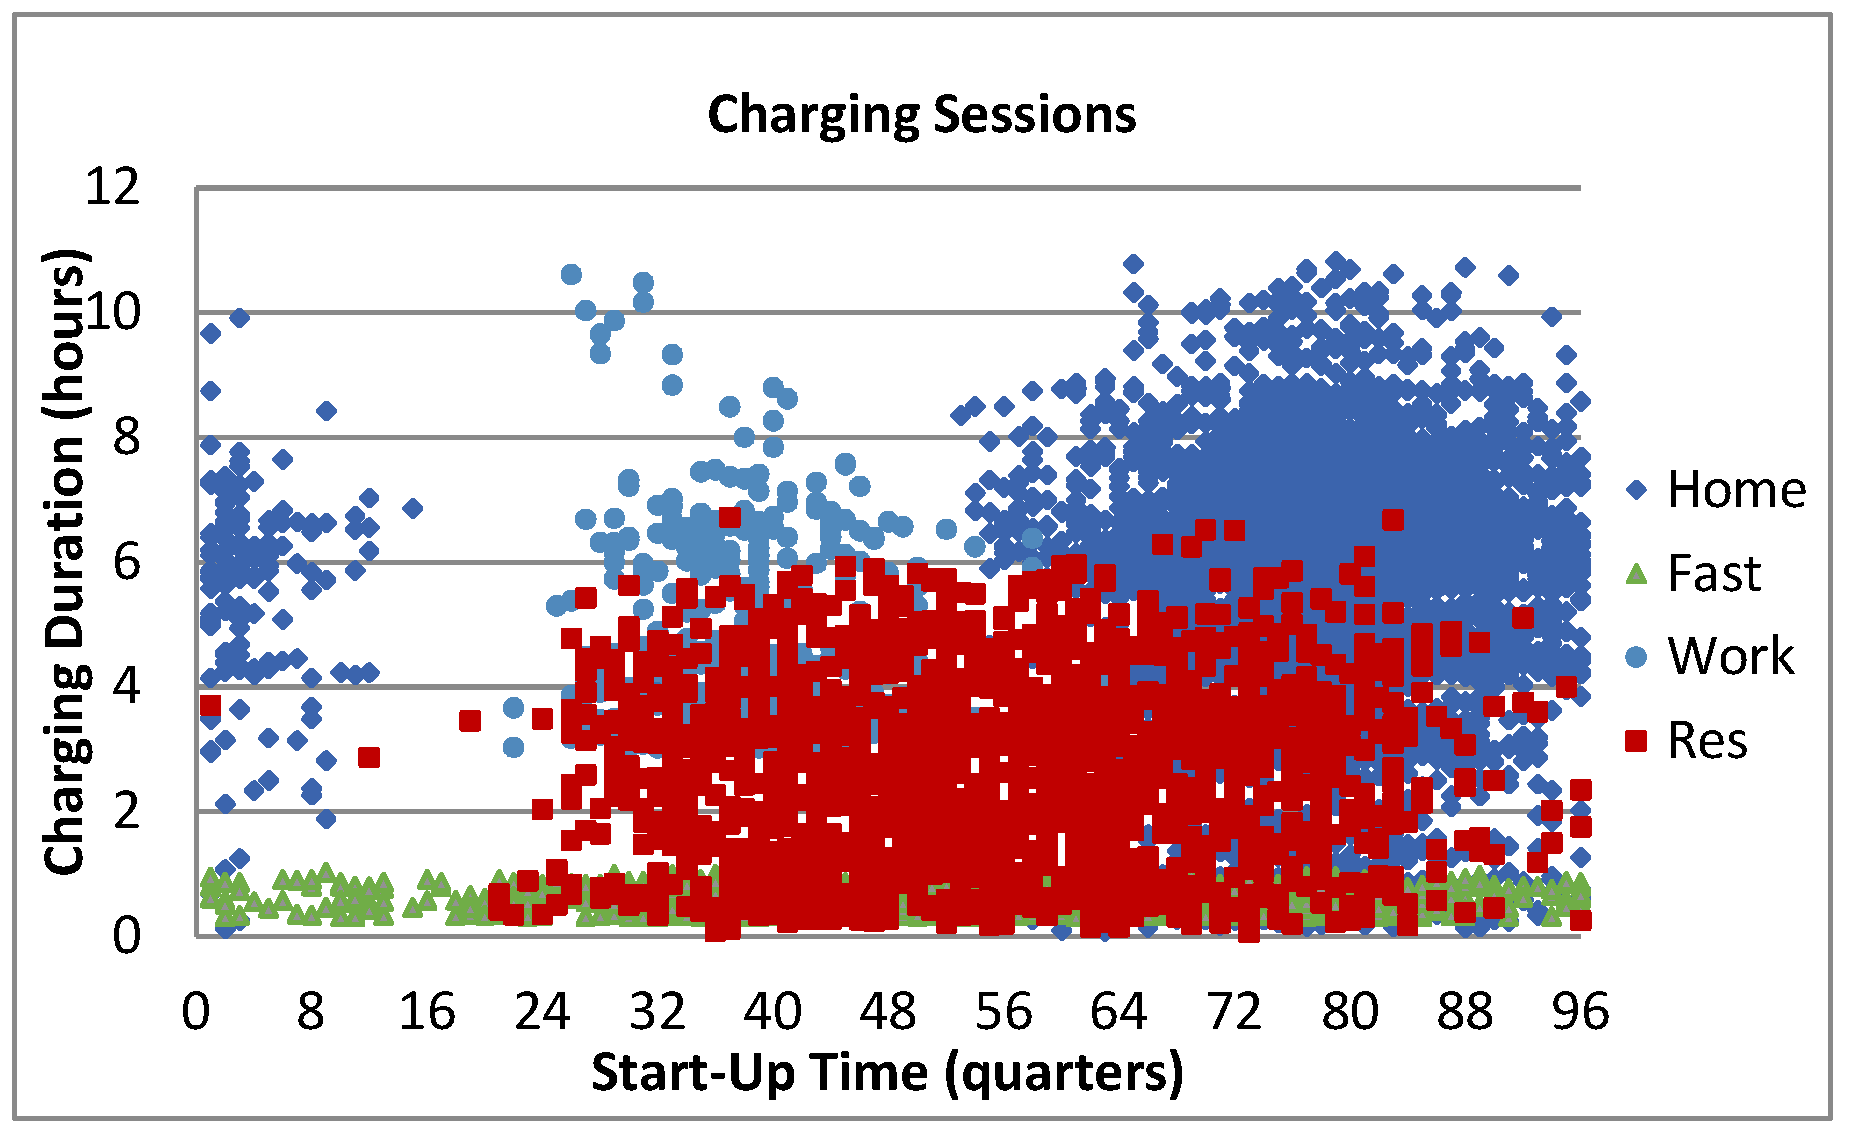
Figure 9 presents a scatter diagram of charging duration vs. start-up time for each of the four types of charges. It should be noted that this diagram includes a small fraction of the total charging sessions so that it is both as clear and representative as possible. The average duration per charge is as follows: home—5 h 41 min, fast/public—38 min, work—3 h 56 min, and residual—2 h 37 min.
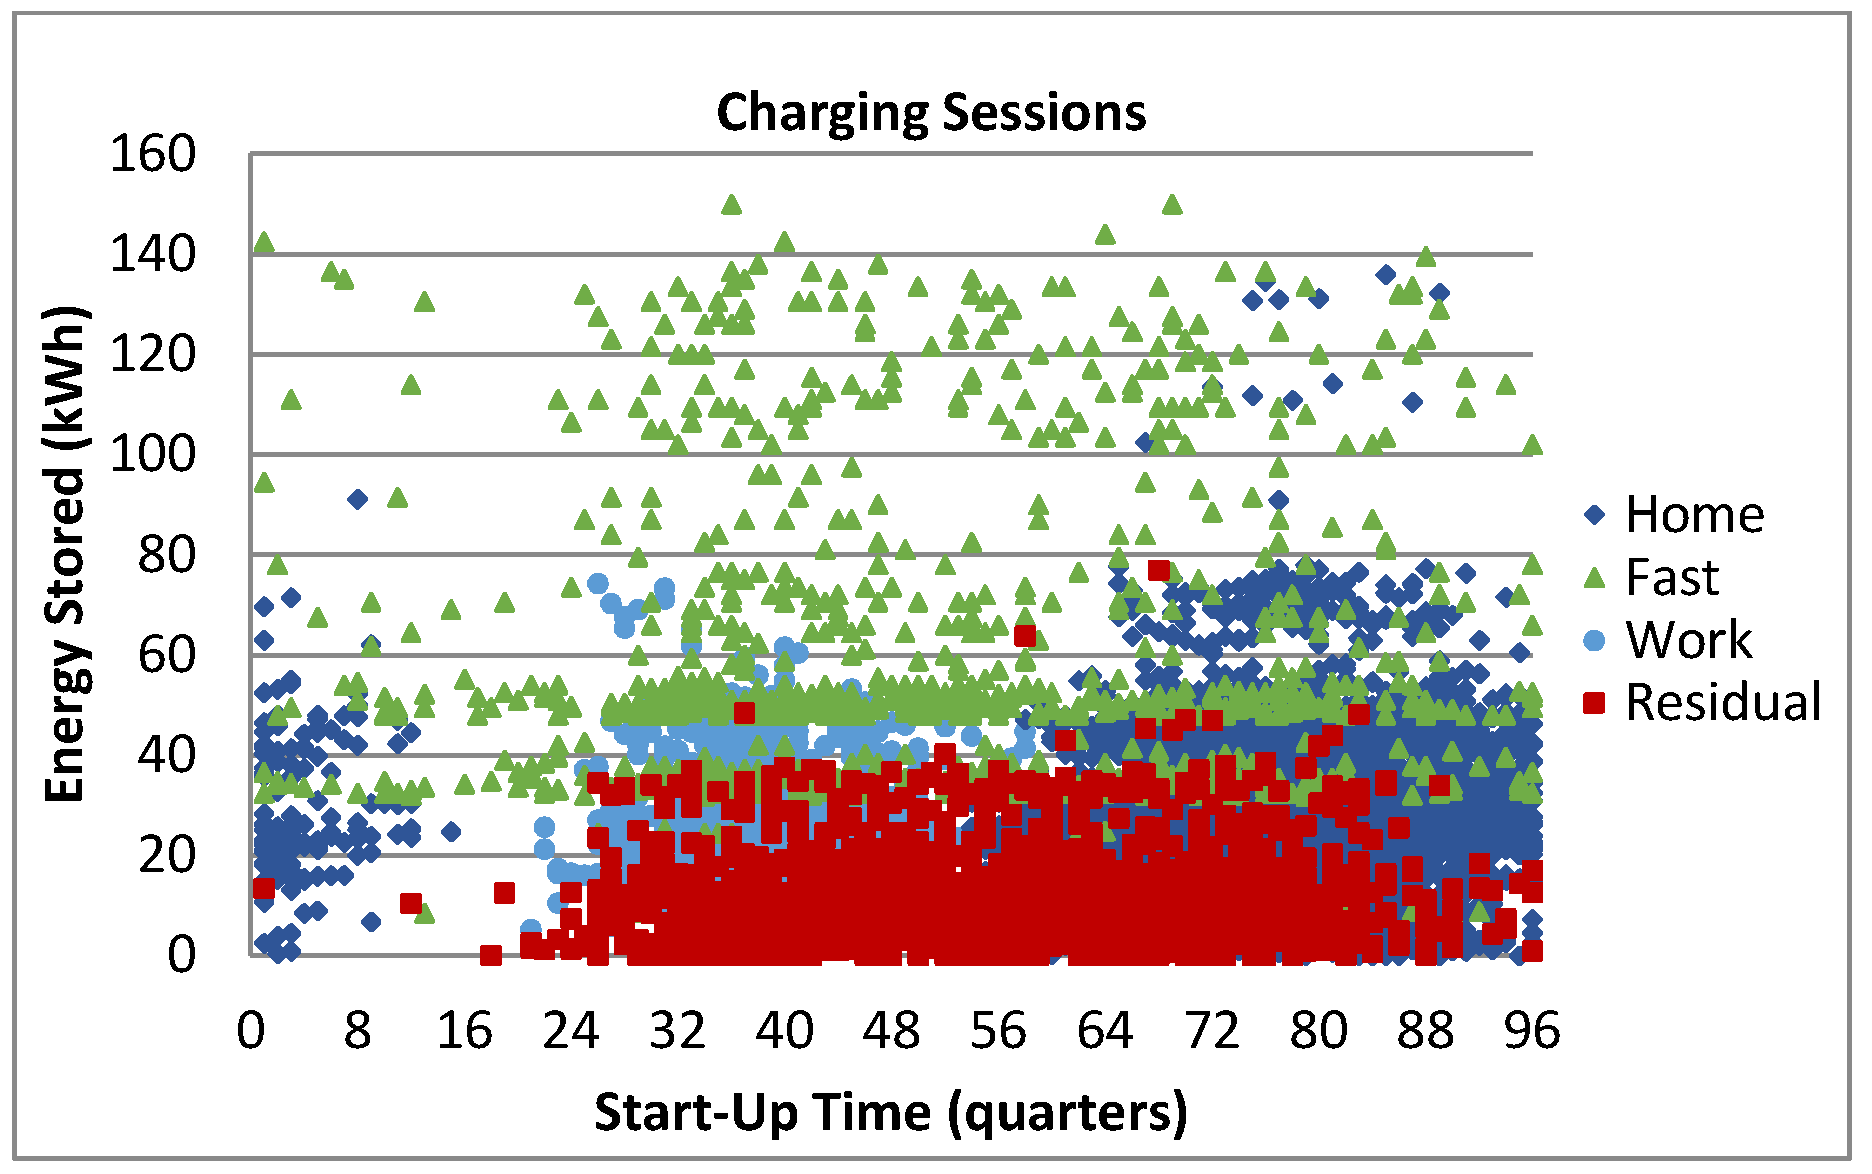
The amounts of energy stored per charge are presented in
Figure 10 for the same sample of charging sessions. The average amounts of energy are as follows: home—28.1 kWh, fast/public—58.0 kWh, work—27.1 kWh, and residual—11.5 kWh.
Figure 11 provides an interpretable depiction of the start-up times for each type of charge. It is clear that regular home charges start after returning from work, mostly between 18:00 and 24:00. On the contrary, residual charges are generally defined as unscheduled, partial, and incomplete, starting rather randomly during the morning, noon, afternoon, or evening. Charges at work mostly start in the first working hours.
The profile of the fast/public charges is more crucial, as these sharp and brief loads may affect the curve of local load demand. The timing of these charging sessions is also related to the travelling schedules and access to available public spots; it can be seen that they roughly follow the typical traffic volume pattern presented in
Figure 1 (see
Figure 12), with two peaks at around 08:00–09:00 and 18:00–20:00.
The sharpness and volatility of fast charging load are better illustrated in
Figure 13, which presents the loads for a random week.
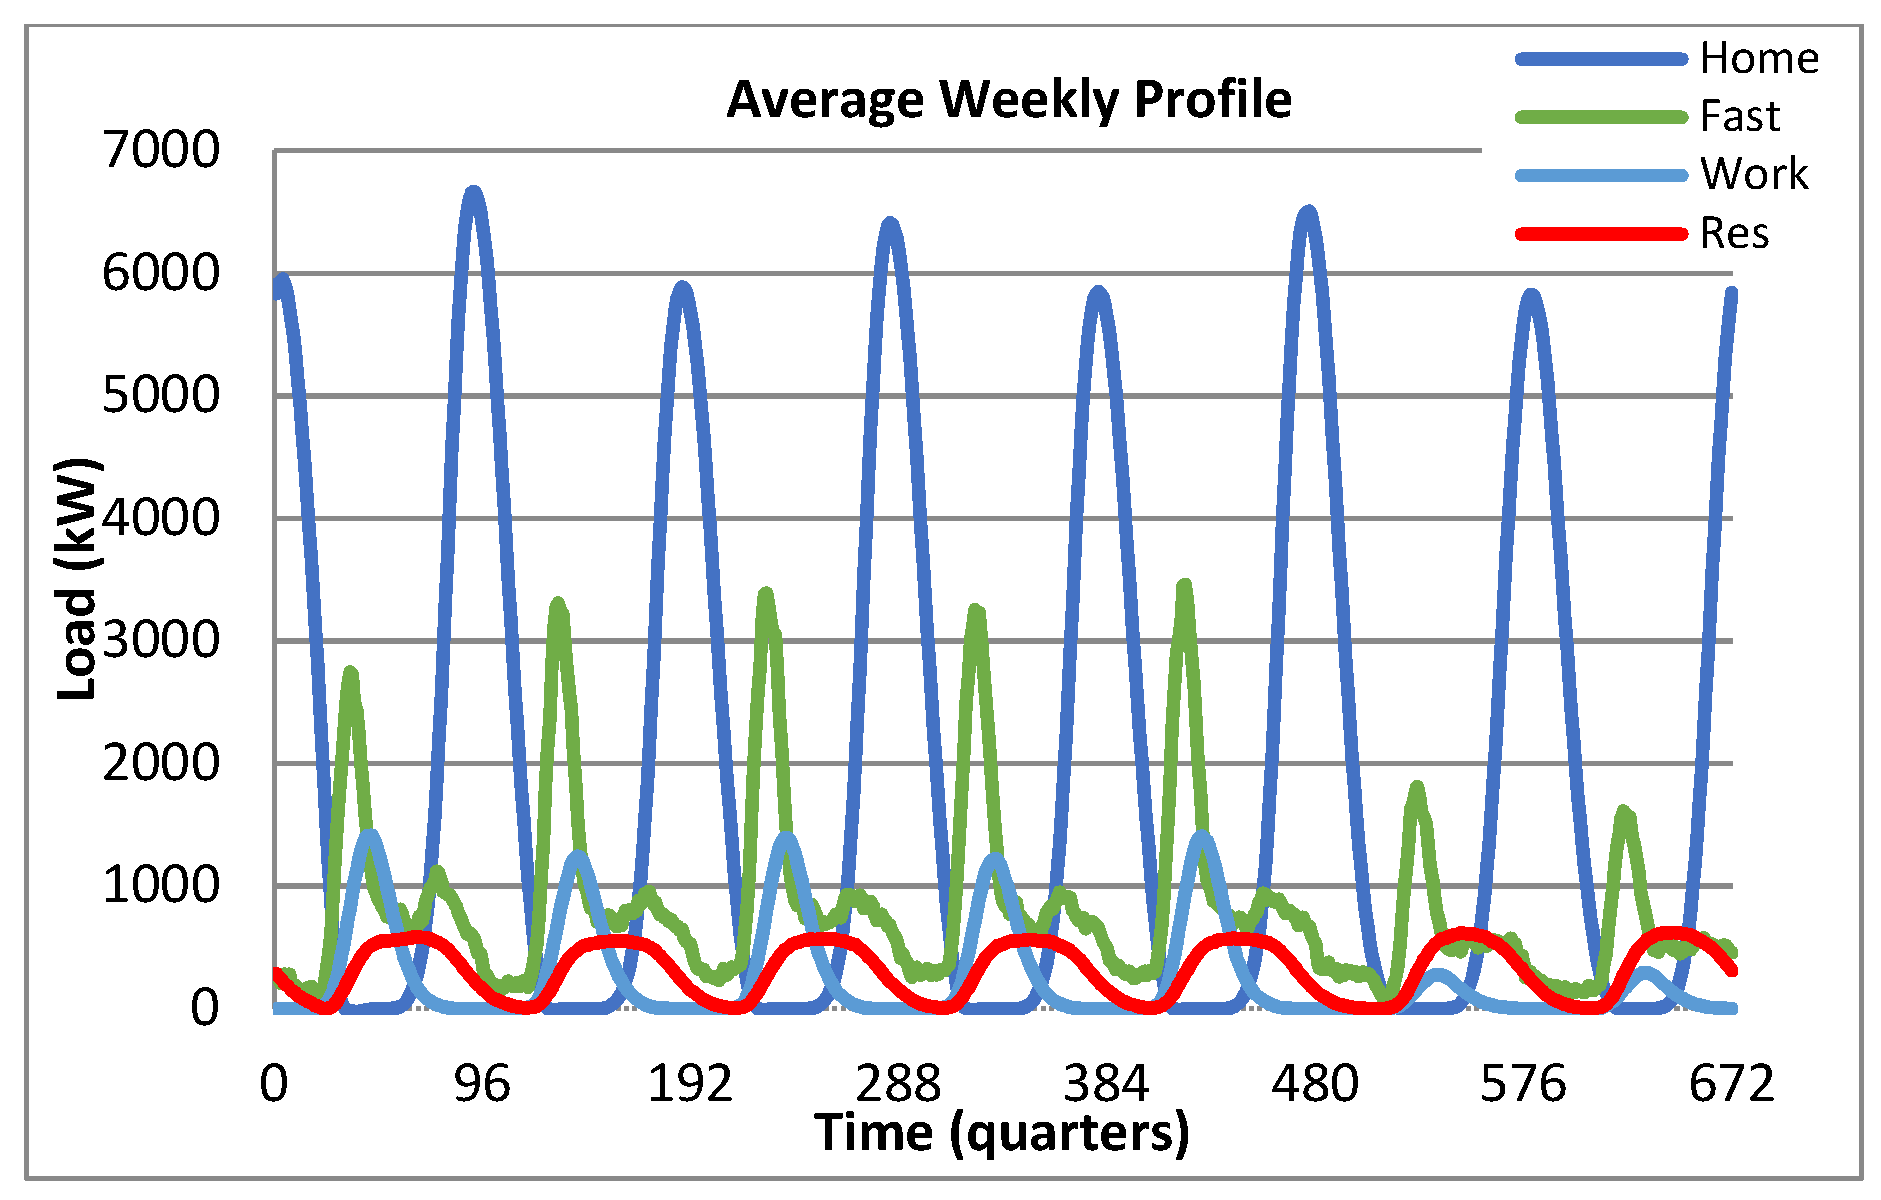
During the summer, the schedules and return-at-home hours become more flexible, so the peak is slightly lower and is shifted a little later, by one or two hours. Furthermore, the average demand is a little higher during winter because of the weather conditions and increased traffic volumes. In
Figure 14, the total load demand is presented for two random weeks in mid-January and mid-July. The average weekly profile is depicted in
Figure 15 and
Figure 16.
The annual peak loads per category are as follows: 8.68 MW (home), 5.51 MW (fast), 1.75 MW (work), 0.87 MW (residual), and 8.9 MW for total charging load. This peak value appears on a Friday in February at 10:30 p.m.
The total fleet of 10,000 EVs cumulatively requires 29.5 GWh to meet the energy needs for a whole year (i.e., 80.88 MWh per day). Specifically, 58.2% of this energy refers to home charges, 24.9% to fast charges, 7.6% to charges at work, and 9.4% refers to residual home charges. These energy needs translate to an average load of 0.338 kW per EV.
5. EVs and PV Energy Communities
According to [
1] (pp. 34–35), oil consumption in Greece decreased by one-third from 2005 to 2015 because of the 2008 financial crisis. The transport sector consumes around 5.6 million tonnes of oil equivalent (Mtoe), accounting for half of the total oil consumption in Greece. Road transportation accounts for 87% of oil consumption in transport, followed by domestic shipping (10%) and small shares of domestic aviation and rail transport. Assuming that 1 toe is equal to 11.63 ΜWh, the total energy needs for the road transport sector of Greece result in an annual average load of 6.47 GW, which is slightly higher than the average electric load of the country (5.82 GW).
According to Greek legislation (Law 4513/2018), the members of an energy community are allowed to cover their energy needs using schemes of virtual energy net metering. An energy community is a civil law partnership, either private or a synergy of the private and public sectors.
The annual energy needs calculated in the previous sections for the charging of a fleet of 10,000 EVs is around 29.6 GWh. These needs can be met by an aggregated, installed PV capacity of about 18.5 MW (the average capacity factor in Greece is 19%). This capacity has a capital cost of 12.9M EUR, a duration of 20 years, and requires a total area of 92 acres. Thus, if the 10,000 owners of the above fleet constituted an energy community contributing 1290 EUR each (on average), this would compensate for the EV charging needs for the next 20 years.
It should be emphasised that this fleet of the first 10,000 EVs in Greece has a specific mix of EV types and battery sizes, so it is not a representative sample of the total road transport sector.
6. Conclusions and Discussion
In this paper, a process for the modelling of EV charging load is presented for the first 10,000 EVs in Greece. This is a complicated task since several parameters are needed for each vehicle: the battery capacity, consumption rate (kWh/km), travelling schedule (km/day), etc. There is a scarcity of raw data, and various research projects in Europe are gradually adding knowledge and insight to a field that is growing and evolving year by year. In Greece, this is even more challenging as the EV penetration is still at a very early stage. Our modelling uses a wide database of vehicles representing the estimated fleet and makes assumptions on the involved parameters. It also utilises probabilistic techniques to produce day-by-day, weekend–weekday, and seasonal variations and formulates an annual simulation for the travelling and charging events of each vehicle.
The simulation considered a variety of charging habits and produced more than a million charging sessions, classified as home, work, fast/public, and residual charging, with appropriate plug-in hours and rates. In order to accomplish this, we gathered all of the knowledge provided in the literature based on the monitoring of smaller or bigger groups of real EVs, most notably in simulating residual charges, which are defined as domestic charges that are random, partial, and unscheduled.
A total of more than a million simulated charging sessions in one year showed that almost 2/3 of them take place at home (mostly at night, after the last arrival of the day) and the remaining 1/3 at work or in public.
The diurnal aggregated profile during weekdays has a nightly peak of about 7 MW (at around 22:00–23:00) and a lower morning peak of about 4 MW (at around 09:00–09:30). During weekends, both peaks are slightly lower and later, occurring at about 24:00–00:30 and 12:00–13:00, respectively.
Since the above peak may coincide with the night peak of total load for the Greek Power System, the application of smart-charging strategies and schemes of time-shifting is possible. Nevertheless, the amount and profile of the energy needs for the first 10,000 EVs are certainly not alarming for the operation of the distribution network or the national grid.
On the contrary, this paper infers that the energy needs of the above fleet, which translate to an average load of 0.338 kW/vehicle, can be met by an aggregated installed photovoltaic capacity of 18.5 MW. This means that the owners of the first 10,000 EVs in the Greek market, by constituting an energy community, will have no charging costs for the next 20 years due to the energy PV offset.


