Article

A Classification Method for Academic Resources Based on a Graph Attention Network

School of Computer Engineering and Science, Shanghai University, Shanghai 200444, China
*
Author to whom correspondence should be addressed.
Future Internet 2021, 13(3), 64; https://doi.org/10.3390/fi13030064
Submission received: 5 February 2021 / Revised: 26 February 2021 / Accepted: 2 March 2021 / Published: 4 March 2021
(This article belongs to the Special Issue Natural Language Engineering: Methods, Tasks and Applications)

Abstract

:
Classification of resource can help us effectively reduce the work of filtering massive academic resources, such as selecting relevant papers and focusing on the latest research by scholars in the same field. However, existing graph neural networks do not take into account the associations between academic resources, leading to unsatisfactory classification results. In this paper, we propose an Association Content Graph Attention Network (ACGAT), which is based on the association features and content attributes of academic resources. The semantic relevance and academic relevance are introduced into the model. The ACGAT makes full use of the association commonality and the influence information of resources and introduces an attention mechanism to improve the accuracy of academic resource classification. We conducted experiments on a self-built scholar network and two public citation networks. Experimental results show that the ACGAT has better effectiveness than existing classification methods.

Graphical Abstract

1. Introduction

With the rapid development of the internet, we have entered the era of big data [1]. In the academic field, scientific research has been supported and a large number of academic resources have been generated with the development of science and technology. Academic resources include a large number of academic research papers, academic researchers, and all the information that can be mined, such as an author’s research field and activities. Faced with the rapid growth of information resources, it is difficult for users to filter information. Academic resources are different from general information resources [2]. On the one hand, there is a wide range of information sources, and information is freely released. On the other hand, there are many and diverse types of academic resources. Therefore, it is particularly important to classify academic resources quickly and effectively [3]. At the same time, as an important means of resource organization and management, information classification [4] can effectively integrate academic resources and easily realize information retrieval, which is also the premise and foundation of personalized recommendation.
However, existing graph neural networks still have some limitations in the classification of academic resources. They ignore the influence information of the academic resources and allocate the neighborhood aggregation coefficient uniformly. Furthermore, they only use the connectivity and do not fully utilize the association information of edges, such as the strength and type [5]. As a result, the deviation of information aggregation in an academic resource network affects the accuracy of classification. In order to cope with the challenges above, this paper proposes an Association Content Graph Attention Network (ACGAT), which is based on association features and content attributes in order to classify academic resources. First, on the one hand, the model mines the association commonality among academic resource nodes to improve the aggregation of the network by reducing the existence of isolated nodes in the existing graph attention network. On the other hand, the model calculates the influence of a node, which enhances the positive effect of the node on the network and weakens the negative impact of the isolated nodes. Then, the content attributes of academic resources are extracted to mine the semantic similarity of nodes, which enriches the content of nodes. Finally, the model integrates the acquired information of academic relevance and semantic relevance from two dimensions. The attention mechanism is used to update the features of academic resources. The ACGAT can improve the accuracy of the classification of academic resources, including the types of papers and the research fields of the scholars. In addition, it can also classify other social networks that can mine edge information.

2. Related Work

Graph data contain two types of information: attribute information [6] and structure information [7]. Attribute information describes the inherent properties of objects in a graph, and structure information describes the information on associations between objects. The structure generated by associations is not only helpful for the description of nodes in graph data, but also plays a key role in the description of the whole graph. It is a key challenge in graph learning to effectively learn the complex non-Euclidean structure of graph data. The existing graph-embedding methods aim to learn the low-dimensional potential representations of nodes in a network [8]. The learned feature representation can be used as a feature in various graph-based tasks, such as classification, clustering, and link prediction. The traditional methods of realizing graph learning are mainly divided into two categories. One is comprised of embedding methods based on matrix decomposition, such as the graph factorization (GF) algorithm [9] and GraRep [10]. The other is based on a random walk, such as DeepWalk [11], LINE [12], and node2vec [13]. However, the embedding of traditional graph learning cannot capture complex patterns and does not incorporate node features, resulting in low-accuracy node classification results.
A graph neural network (GNN) [14] is a kind of neural network model that can operate on graph structure data to convey graph information. It uses the node information and structure information of a graph to effectively mine the information contained in the graph data. GNNs have achieved excellent results in many application fields, such as image recognition [15] and heterogeneous graph learning [16]. Convolution operations have been extended to graph learning with graph convolution networks (GCNs) [17]. Niepert et al. [18] proposed a convolution method that was applied to a graph data model, which needed to sort graph nodes and had high complexity. Kipf et al. [19] mapped graph features in the time domain to the spectral frequency domain and approximately simplified them with Chebyshev polynomials, which achieved successful results in semi-supervised classification of graph nodes. In addition to graph convolution networks, many researchers have introduced attention mechanisms to implement graph node classification. Petar [20] first proposed a graph attention network (GAT) that assigned different weights to different nodes in the neighborhood. Gong and Cheng [5] added edge feature vectors directly, which extended the attention mechanism proposed for the first time and focused on each type of feature neighborhood. Gilmer et al. [21] introduced an edge network in which the eigenvectors of edges were used as input and output matrices to transform the embedding of adjacent nodes. Lu et al. [22] proposed a channel graph attention network based on edge content, which could find the fine-grained signals of node interaction from text information and improve the accuracy of node characterization. The classification results of graph nodes show that the adaptive ability of GATs makes them more effective in fusing the information of node features and graph topology.
In existing research, it was effective to combine edge content in information aggregation. However, the feature content on the edge of the connections, such as intensity, has not been fully explored. In the classification of academic resources, ignoring the rich information on associations between resource nodes will lead to unsatisfactory classification results. Therefore, in this paper, we use semantic relevance and academic relevance (commonality between resources and influence information) for information aggregation to effectively improve the classification accuracy of academic resource network nodes.

3. Definition

3.1. Definition of Notations

We define the academic resource network as an undirected graph G = ( V , E ) , where V is the node set, and | V | = N is the number of nodes. The feature vector of a set of nodes can be expressed as h = h 1 , h 2 , , h N , h i R F . The feature vector is generated by keywords of statistical academic resources, where F is the dimension of the node features. The size of matrix h is N * F , which represents the features of all nodes in the graph, and each node is represented by a word vector of dimension F. Each element of the word vector corresponds to a word, and the element has only two values of 0 (nonexistence) or 1 (existence). E is a set of edges that indicates the connectivity between nodes. The aggregation coefficients involved in the aggregation process are the academic association commonality coefficient e i j , association influence coefficient β i j , and semantic similarity coefficient α i j . We define a minimal set of definitions required to understand this paper in Table 1.

3.2. Academic Resource Networks

In the construction of academic resource networks, this paper constructs a cooperation network based on the cooperative relationships between scholars and a citation network based on the citation relationship between papers. In the cooperation network, v i represents an author, the node feature F is described by the keywords extracted from the author’s published papers as the content attributes of the node, and the association information on the edge indicates the cooperation relationships between authors. In the citation network, v i stands for a paper. The keywords of the papers are used as content attributes to represent the feature F of the node. The edge indicates that there is a citation relationship between papers. We provide two simple examples of a scholar cooperation network (Figure 1a) and a citation network (Figure 1b).
In the scholar cooperation network, nodes represent scholars, and the edges between nodes represent the cooperative relationships between scholars. The final aggregation coefficient λ i j is determined by the semantic similarity coefficient α i j , association influence coefficient β i j , and weighted coefficients of the association community e i j . In the citation network, nodes represent papers, and the edges between nodes represent the citation relationships between papers. The black solid line represents the actual reference relationship, and the red dotted line represents the built reference relationship. Similarly, the final aggregation coefficient λ i j is also composed of three coefficients.

4. Proposed Method

We propose an Association Content Graph Attention Network (ACGAT) based on association features and content attributes to classify academic resources. Semantic association and academic association are introduced into the model. Firstly, the discrete academic resources are integrated into an academic resource network by using the association commonality and influence information between resources through a transformation operation. Then, an attention mechanism [23] is used to aggregate the neighborhood information to obtain the final node features to improve the accuracy of academic resource classification. The overall framework is shown in Figure 2.

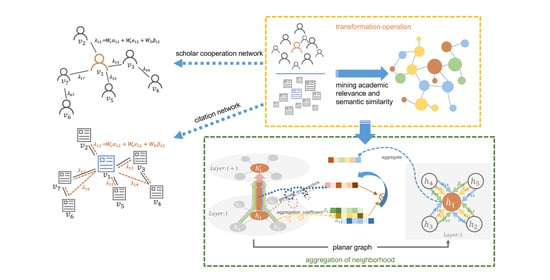
4.1. Mining and Representation of Academic Relevance

Academic relevance includes the influence information and the commonality between resources. Inspired by PageRank [24], the influence of the node is of great significance for the aggregation of information of neighboring nodes. However, the existing model does not consider the influence factor. In collaborative networks, the author weight represents the degree of activity of authors in a certain research field. In citation networks, node weights represent the academic relevance and influence in the networks. Thus, the ACGAT introduces the influence factor of the node, thus enhancing the positive effect of the node on the network and weakening the possible negative effects of isolated nodes.
The calculation method for the influence factor matrix A is as follows:
  • We calculate the degree matrix D of a network of N nodes, where d ( v i ) is the degree of node v i . D = d v 1 0 0 0 d v 2 0 0 0 d v N
  • The influence D i j of neighboring node j on central node i is expressed as the ratio of the degree of node j to the degree of node i, which can be obtained according to Equation (1).
  • The influence factor β i j of each node and A = β 11 β 12 β 1 N β 21 β 22 β 2 N β N 1 β N 2 β N N are obtained through normalization according to Equation (2).
D i j = d j d i
β i j = D i j m M D i m
D i j is the influence of node j on node i. In the author cooperation network, D i j is the ratio of the number of collaborators of author j to that of author i. In the citation network, D i j is the ratio of the number of citation associations of paper j to that of paper i. β i j is the influence factor of the normalized final node j on node i.
In this paper, we not only introduce the influence of academic resource nodes, but also integrate the association commonality between nodes into the model. In the citation network, the citation relationship between papers is a sparse matrix. We refer to the network-embedded model LINE [12], which not only obtains the local similarity of two nodes in the network, but also retains the second-order similarity between a pair of nodes ( u , v ) , that is, the similarity of their adjacent network structures. Citation networks have not only first-order similarity in content, but also second-order similarity in structure [25]. If the second-order similarity is high, there are no direct citation relationships, but there are a large number of co-cited relationships between papers. The higher the correlation, the more similar the two papers are. As shown in Figure 3, the relationship between paper 6 and paper 7 is a first-order local similarity, while the relationship between paper 5 and paper 6 belongs to second-order global similarity because they have the same co-citations, but no direct reference relationship. Based on this, when we construct the correlation matrix in the citation network, we are not limited to the information of directly related papers. We consider the papers that are adjacent and similar in structure, but have no real citation relationships. The shortest path [26] between nodes can exactly reflect the structural relationships between authors. We calculate the shortest path between nodes in the citation network as the association information between nodes. According to Equation (3), we get the coefficient q i j as the coefficient of association commonality between two nodes in the citation network. q i j is positively correlated with the degree of association and the commonality between two papers.
q i j = 1 d i s i j
Similarly, in the author cooperation network, nodes represent scholars and the connecting edges indicate that there is cooperation between authors. When the number of papers co-authored by two authors is larger, it means that the collaboration between the authors is closer, the commonality between the authors is greater, and the research fields are more related. As shown in Figure 4, author A has published six papers with author B, and author A has published three papers with author C. Obviously, the cooperation intensity between A and B is higher than with of other collaborators. Therefore, we introduce the cooperation strength into the scholar network as the association coefficient q i j of the nodes in the model.
Existing graph neural networks have a drawback in the representation of academic resource relationships, that is, the adjacency matrix belongs to a binary matrix (0 or 1), which can only indicate the existence of connectivity between nodes. However, the connection edge in the graph of an academic resource network contains rich information, such as strength and type, which is not a binary index variable. Therefore, the ACGAT combines the common association features of the edges and normalizes them in a bidirectional manner. We obtain the weighted coefficients e i j of the association commonality between nodes i and j according to the Equation (4):
e i j = q i j m = 1 M q i m ,
where M is the number of neighbor nodes of the central node. In the citation network, M represents the number of papers related to paper i in the association graph constructed above, and q i j represents the reciprocal of the shortest path between papers. In the author cooperation network, M represents the number of authors who have cooperative relationships with author i, and q i j represents the intensity of paper cooperation between authors.
After obtaining the weighted coefficient of correlation commonality, we transform the original binary adjacency graph (Figure 5a) into a bidirectional edge feature graph (Figure 5b) about the central node i, which is not a symmetric matrix and retains more abundant academic resource information.

4.2. Aggregation Based on an Attention Mechanism

In the application of academic resources, existing graph attention networks only calculate the attention based on the semantic similarity of nodes, but often neglect association information between academic resource nodes. The ACGAT introduces the semantic relevance and academic relevance of academic resources into the model and integrates them. In the process of the dissemination of information of graph nodes, it is necessary to learn three distribution parameters, which are the semantic similarity, association commonality, and influence information. According to these three parameters, we get the final updated feature of the aggregated attention coefficient and classify the academic resource nodes to improve the accuracy.
The ACGAT takes the semantic feature h = h 1 , h 2 , , h N , h i R F of the academic resource node as input, and all of the node features will be transformed by the linear change matrix W g . A shared attention mechanism θ is used on the node to calculate the measurement of similarity between nodes according to the features of the input nodes. Similarly to the graph attention model [20], this model calculates the measurement of similarity between the adjacent node and the center node using Equation (5):
ε i j = θ W h i | | W h j , j N i ,
where N i is the neighbor collection of node i. First, a linear-mapping sharing parameter W is used to increase the dimensions of the vertex features. Then, [ · | | · ] splices the transformed features of vertices i and j. Finally, θ ( · ) maps the spliced high-dimensional features to a real number.
The similarity measurement of the content features is normalized by the s o f t m a x function [27] of Equation (6) to obtain the attention coefficient α i j of the academic semantic features.
α i j = s o f t m a x ε i j = exp ε i j k N i exp ε i k
The advantage of using L e a k y R e L U is that in the process of back propagation, the gradient can also be calculated for parts of the input of L e a k y R e L U activation function that are less than zero [28]. The factor calculated by the attention mechanism is obtained using Equation (7).
α i j = s o f t m a x ε i j = exp L e a k y R e L U θ W h i W h j k N i exp L e a k y R e L U θ W h i W h k
Then, the aggregation coefficient is obtained as shown in Equation (8):
λ i j = W ε α i j + W e e i j + W D β i j ,
where W ε , W e , and W D are learning parameters that reflect the influence of three dimensions of academic semantic similarity, including academic semantic relevance, academic association commonality, and the influence coefficient. λ i j is the coefficient of the final fusion of academic resources.
The final aggregate attention coefficient is used to calculate the linear combinations of related features. The result is the final output of each node, and σ ( · ) is the activation function, as shown in Equation (9).
h i = σ j N i λ i j W h j
According to the existing multiple-attention mechanism [29], K independent attention mechanisms are used to execute Equation (9), and their features are related. The essence of multiple heads is the calculation of multiple independent attentions, which acts as an integrated function to prevent over-fitting. In the last layer of the neural network, the output feature expression of the result is updated, resulting in Equation (10).
h i = σ 1 K k = 1 K j N i λ i j k W k h j

5. Experiment

In order to verify the feasibility of the ACGAT, we conducted comparative experiments on a self-built dataset and two public datasets. The following two sub-sections will introduce the datasets and analyze the results.

5.1. Datasets

In this paper, we used a self-built scholar cooperative network dataset, SIG, and the public citation network datasets Cora and Citeseer [30] to verify the classification effect of our model on academic resources. The basic situations of these three data networks are as follows.
SIG is composed of research scholars of special interest groups on the ACM website, including information retrieval (IR), the Ada programming language (DA), information technology education (ITE), computer graphics (GRAPH), accessibility and computing (ACCESS), bioinformatics and computational biology (BIO), knowledge discovery in data (KDD), and artificial intelligence (AI)—a total of eight categories. We selected 3669 scholars who published at least four papers in various fields for research. According to their published academic papers, we obtained the cooperation relationships between scholars, selected the keywords with word frequencies greater than 10 as the feature dimension, and constructed a scholar cooperation network. The scholar cooperation network contained 3669 nodes and 10,399 edges, and each node had 3664 feature dimensions.
Cora is composed of machine learning papers, which are divided into seven categories: case-based, genetic algorithms, neural networks, probabilistic methods, reinforcement learning, rule learning, and theory. In the final corpus, each paper was cited by at least one other paper. There were 2708 papers in the whole corpus. There were 2708 nodes and 5429 edges in the citation network of the Cora dataset, and each node had 1433 feature dimensions.
Citeseer contains 3312 scientific publications, which are divided into six categories: agents, artificial intelligence (AI), database (DB), information retrieval (IR), machine learning (ML), and human–computer interaction (HCI). The dataset contains 3312 nodes and 4732 edges, and each node has 3708 feature dimensions.
The specific information of the three datasets is shown in Table 2.
We implemented the ACGAT based on the PyTorch framework. All the three datasets were split into training, validation, and test subsets with a ratio of 8:1:1. In all experiments, two layers of the ACGAT were used, and Adam was used as the optimizer. The learning rate was 0.005. For input features and normalized attention coefficients, we used a dropout rate of 0.6 and L2 regularization with a full attenuation of 0.0005.

5.2. Experimental Analysis

We dealt with the three datasets individually. When the authors in the scholar cooperation network of the the SIG had the same name, we adopted the method of “author name + organization” to determine unique authors. The cooperation intensity between authors was the feature of the association commonality between nodes. In the citation network datasets, Cora and Citeseer, we calculated the shortest path between nodes as the feature of the association commonality between nodes and constructed an incidence matrix of the citation networks for node classification. The three networks constructed with this method are shown in Figure 6, in which the isolated nodes in the datasets are removed from the Citeseer network diagram. Different sizes of nodes in the network graph indicate the influence of academic resources on the network graph. Large nodes have great influence on adjacent nodes and obvious aggregation effects.
We compared the proposed method with five existing benchmark methods—DeepWalk [11], LINE (2nd) [12], structural deep network embedding (SDNE) [31], a graph convolutional network (GCN) [19], and a graph attention network (GAT) [20]. We also compared it with versions of the proposed model that only add the association commonality feature (A-GAT) or only add the association influence factor (C-GAT). Due to space limitations, we show only visualized classification results of the traditional methods (Figure 7, Figure 8 and Figure 9). We used classification accuracy as the experimental index, which was obtained from Equation (11) [32].
Accuracy = T P + T N T P + F P + T N + F N ,
where TP (true positives) is the number of positive cases that are correctly classified. FP (false positives) is the number of false positive cases. FN (false negatives) is the number of false negatives. TN (true negatives) is the number of cases that are correctly classified as negative.
The classification results for scholars in the SIG are shown in Figure 10. The classification results for papers in the Cora and Citeseer citation networks are shown in Figure 11.
In the experiment on the scholar network dataset SIG, the use of A-GAT means that only the cooperation intensity relationships between scholars are added as the association commonality feature for the model; the use of C-GAT means that only the weights of the scholar nodes were added as the content influence feature for the model. As shown in Figure 10, the ACGAT achieves the best classification results compared with the other seven models. It shows that in the scholar network, under the original expression of the authors’ academic similarities, combining the cooperation intensity between the authors and an author’s influence weight can effectively improve the division of an author’s field.
Similarly, in the experiments on the Cora and Citeseer citation network datasets, A-GAT only adds the citation association commonality information between papers, that is, combining the shortest distance information between nodes; C-GAT only adds the weight of paper nodes as the feature of content influence. As shown in Figure 11, ACGAT also obtains the best classification result compared with other seven models. The results show that in the citation network, under the original paper feature representation, the combination of the papers’ similarity and structure relevance information can effectively improve the classification results of electronic academic resources. However, after combining the commonality features and influence information on Citeseer, the classification effect is not improved much compared with the A-GAT. The reason is that the classification in the Citeseer dataset is more general than that in the Cora dataset, and there are some isolated nodes, which affects the classification effect.
In addition to the classification accuracy, we also compared the Micro-F1 [32] and Macro-F1 [33] of the models. Equations (12)–(14) [34] and explanations of the two indices are given in the following.
Precision = T P T P + F P
Recall = T P ( T P + F N )
F 1 = 2 × Precision × Recall Precision + Recall
  • Micro-F1: We calculate this metric globally by counting the total true positives, false negatives, and false positives, and then calculate F1.
  • Macro-F1: We calculate this metric for each label and find its unweighted mean. This does not take label imbalance into account.
The experimental results are shown in Table 3. In addition, we compared the accuracy curves over 300 epochs (one epoch is when all of the training samples have a forward propagation and a back propagation in the neural network) of five graph neural network models, including the model that we present in this paper. The curve comparison diagrams are shown in Figure 12, Figure 13 and Figure 14, which prove the reliability of our model.
From Table 3 and Figure 7, Figure 8 and Figure 9, we can observe that the performance of the network representation learning method DeepWalk, which is based on a random walk, and the LINE method, which is based on the assumption of domain similarity, was not good for the three academic resource datasets, and they could not effectively classify different types of nodes. This indicates that more similar nodes have the same vector representations with a certain deviation by relying on simple empirical indicators, which cannot reflect the structural characteristics around the nodes well. In contrast, SDNE, which is based on deep learning, achieved better classification results than the traditional methods. SDNE performed better in the self-built scholar cooperation network, SIG, and the Cora citation network, but the node classification effect was still unsatisfactory due to the limited modeling ability.
The GCN assigned the same weights to the domain nodes [35], and its classification effect was inferior to that of the GAT. By introducing the attention mechanism, the graph attention network calculated the weight of each node’s neighbor nodes and learned to allocate different aggregation coefficients to obtain new features of nodes. The A-GAT, C-GAT, and ACGAT proposed in this paper are all based on the GAT combined with the edge information and the influence information. The ACGAT mines the resource association features and content attributes and integrates an attention mechanism to update the node features of academic resources. Figure 12, Figure 13 and Figure 14 show that the ACGAT has better effectiveness than the existing classification methods.

6. Conclusions

The classification of academic resources has important research status and practical significance. This paper mainly studies the use of academic resources to aggregate domain information for classification. We focused on the content attributes, structure attributes, and the edge attribute information of academic resources. The proposed model combines the academic semantic relevance, academic association commonality, and association influence factors to describe the characteristics of an academic resource network in order to mine more abundant information. At the same time, the attention mechanism is used to model and learn the different coefficients to get the best proportional distribution. We conducted experiments on a self-built scholar network dataset and public citation network datasets. The experimental results show that the algorithm in this paper has an improvement of 2.5–4.7% compared with the original graph attention network, and the classification effect is better than that of other existing methods. In addition to academic resource classification tasks, the ACGAT is also suitable for dealing with other social network classification tasks that are based on graph data. In the future, we will improve the model to realize the classification of heterogeneous vertices in academic networks.

Author Contributions

Conceptualization, Y.L. and J.Y.; methodology, Y.L. and J.Y.; validation, Y.L., C.P., and J.W.; investigation, Y.L.; resources, Y.L. and J.Y.; data curation, Y.L.; writing—original draft preparation, Y.L.; writing—review and editing, Y.L. and J.Y.; visualization, Y.L. All authors have read and agreed to the published version of the manuscript.

Funding

This research received no external funding.

Data Availability Statement

Prithviraj Sen, Galileo Namata, Mustafa Bilgic, Lise Getoor, Brian Galligher, and Tina Eliassi-Rad. Collective classification in network data. AI magazine, 29(3):93, 2008. The data for the self-built dataset (SIG) came from https://dl.acm.org/sigs (accessed on 4 March 2021).

Conflicts of Interest

The authors declare no conflict of interest.

References

  1. Lin, S.; Zheng, D. Big Data to Lead a New Era for “Internet+”: Current Status and Prospect. In Proceedings of the Fourth International Forum on Decision Sciences; Li, X., Xu, X., Eds.; Springer: Singapore, 2017; pp. 245–252. [Google Scholar]
  2. Fidalgo-Blanco, A.; Sánchez-Canales, M.; Sein-Echaluce, M.L.; García-Peñalvo, F.J. Ontological Search for Academic Resources. In Proceedings of the Sixth International Conference on Technological Ecosystems for Enhancing Multiculturality, Salamanca, Spain, 24–26 October 2018. [Google Scholar]
  3. Guo, G. Decision support system for manuscript submissions to academic journals: An example of submitting an enterprise resource planning manuscript. In Proceedings of the 2017 International Conference on Machine Learning and Cybernetics (ICMLC), Ningbo, China, 9–12 July 2017. [Google Scholar]
  4. Correia, F.F.; Aguiar, A. Patterns of Information Classification. In Proceedings of the 18th Conference on Pattern Languages of Programs, Portland, OR, USA, 21–23October 2011. [Google Scholar]
  5. Gong, L.; Cheng, Q. Exploiting Edge Features for Graph Neural Networks. In Proceedings of the IEEE/CVF Conference on Computer Vision and Pattern Recognition (CVPR), Long Beach, CA, USA, 15–21 June 2019. [Google Scholar]
  6. Sina, S.; Rosenfeld, A.; Kraus, S. Solving the Missing Node Problem Using Structure and Attribute Information. In Proceedings of the 2013 IEEE/ACM International Conference on Advances in Social Networks Analysis and Mining, Niagara Falls, ON, Canada, 25–28 August 2013. [Google Scholar]
  7. Fei, H.; Huan, J. Boosting with Structure Information in the Functional Space: An Application to Graph Classification. In Proceedings of the 16th ACM SIGKDD International Conference on Knowledge Discovery and Data Mining, Washington, DC, USA, 24–28 July 2010. [Google Scholar]
  8. Chen, S.; Huang, S.; Yuan, D.; Zhao, X. A Survey of Algorithms and Applications Related with Graph Embedding. In Proceedings of the 2020 International Conference on Cyberspace Innovation of Advanced Technologies, Guangzhou, China, 4–6 December 2020. [Google Scholar]
  9. Ahmed, A.; Shervashidze, N.; Narayanamurthy, S.; Josifovski, V.; Smola, A.J. Distributed Large-Scale Natural Graph Factorization. In Proceedings of the 22nd International Conference on World Wide Web; Association for Computing Machinery: New York, NY, USA, 2013; pp. 37–48. [Google Scholar] [CrossRef] [Green Version]
  10. Cao, S.; Lu, W.; Xu, Q. GraRep. In Proceedings of the 24th ACM International on Conference on Information and Knowledge Management-CIKM, Melbourne, Australia, 19–23 October 2015. [Google Scholar]
  11. Perozzi, B.; Al-Rfou, R.; Skiena, S. DeepWalk: Online Learning of Social Representations. In Proceedings of the 20th ACM SIGKDD International Conference on Knowledge Discovery and Data Mining, New York, NY, USA, 24–27 August 2014. [Google Scholar]
  12. Tang, J.; Qu, M.; Wang, M.; Zhang, M.; Yan, J.; Mei, Q. LINE: Large-scale Information Network Embedding. Line Large-Scale Inf. Netw. Embed. 2015. [Google Scholar] [CrossRef] [Green Version]
  13. Grover, A.; Leskovec, J. node2vec: Scalable Feature Learning for Networks. In Proceedings of the 22nd ACM SIGKDD International Conference on Knowledge Discovery and Data Mining, San Francisco, CA, USA, 13–17 August 2016. [Google Scholar]
  14. Zheng, D.; Wang, M.; Gan, Q.; Zhang, Z.; Karypis, G. Learning Graph Neural Networks with Deep Graph Library. In Proceedings of the Companion Proceedings of the Web Conference 2020, Taipei, Taiwan, 20–24 April 2020. [Google Scholar]
  15. Song, X.; Yang, H.; Zhou, C. Pedestrian Attribute Recognition with Graph Convolutional Network in Surveillance Scenarios. Future Internet 2019, 11, 245. [Google Scholar] [CrossRef] [Green Version]
  16. Zhang, C.; Song, D.; Huang, C.; Swami, A.; Chawla, N.V. Heterogeneous Graph Neural Network. In Proceedings of the 25th ACM SIGKDD International Conference on Knowledge Discovery & Data Mining, Anchorage, AK, USA, 4–8 August 2019. [Google Scholar]
  17. Che, M.; Yao, K.; Che, C.; Cao, Z.; Kong, F. Knowledge-Graph-Based Drug Repositioning against COVID-19 by Graph Convolutional Network with Attention Mechanism. Future Internet 2021, 13, 13. [Google Scholar] [CrossRef]
  18. Niepert, M.; Ahmed, M.; Kutzkov, K. Learning Convolutional Neural Networks for Graphs. In International Conference on Machine Learning; PMLR: Cambridge, MA, USA, 2016. [Google Scholar]
  19. Kipf, T.N.; Welling, M. Semi-Supervised Classification with Graph Convolutional Networks. arXiv 2016, arXiv:1609.02907. [Google Scholar]
  20. Veličković, P.; Cucurull, G.; Casanova, A.; Romero, A.; Lio, P.; Bengio, Y. Graph Attention Networks. arXiv 2017, arXiv:1710.10903. [Google Scholar]
  21. Gilmer, J.; Schoenholz, S.; Riley, P.; Vinyals, O.; Dahl, G. Neural Message Passing for Quantum Chemistry. In International Conference on Machine Learning; PMLR: Cambridge, MA, USA, 2017. [Google Scholar]
  22. Lin, L.; Wang, H. Graph Attention Networks over Edge Content-Based Channels. In Proceedings of the 26th ACM SIGKDD International Conference on Knowledge Discovery & Data Mining, San Diego, CA, USA, 22 August 2020. [Google Scholar]
  23. Shanthamallu, U.S.; Thiagarajan, J.J.; Spanias, A. A Regularized Attention Mechanism for Graph Attention Networks. In Proceedings of the ICASSP 2020—2020 IEEE International Conference on Acoustics, Speech and Signal Processing (ICASSP), Barcelona, Spain, 4–8 May 2020. [Google Scholar]
  24. Zhukovskiy, M.; Gusev, G.; Serdyukov, P. Supervised Nested PageRank. In Proceedings of the 23rd ACM International Conference on Conference on Information and Knowledge Management, Shanghai, China, 3–7 November 2014. [Google Scholar]
  25. Meyer-Brötz, F.; Schiebel, E.; Brecht, L. Experimental evaluation of parameter settings in calculation of hybrid similarities: Effects of first- and second-order similarity, edge cutting, and weighting factors. Scientometrics 2017, 111, 1307–1325. [Google Scholar] [CrossRef]
  26. Ortega-Arranz, H.R.; Llanos, D.; Gonzalez-Escribano, A. The shortest-path problem: Analysis and comparison of methods. Synth. Lect. Theor. Comput. Sci. 2014, 1, 1–87. [Google Scholar] [CrossRef]
  27. Low, J.X.; Choo, K.W. Classification of Heart Sounds Using Softmax Regression and Convolutional Neural Network. In Proceedings of the 2018 International Conference on Communication Engineering and Technology, Singapore, 24–26 February 2018. [Google Scholar]
  28. Jiang, T.; Cheng, J. Target Recognition Based on CNN with LeakyReLU and PReLU Activation Functions. In Proceedings of the 2019 International Conference on Sensing, Diagnostics, Prognostics, and Control (SDPC), Beijing, China, 15–17 August 2019. [Google Scholar]
  29. Jia, X.; Li, W. Text classification model based on multi-head attention capsule neworks. J. Tsinghua Univ. (Sci. Technol.) 2020, 60, 415. [Google Scholar] [CrossRef]
  30. Sen, P.; Namata, G.; Bilgic, M.; Getoor, L.; Galligher, B.; Eliassi-Rad, T. Collective Classification in Network Data. AI Mag. 2008, 29, 93. [Google Scholar] [CrossRef] [Green Version]
  31. Wang, D.; Cui, P.; Zhu, W. Structural Deep Network Embedding. In Proceedings of the 22nd ACM SIGKDD International Conference on Knowledge Discovery and Data Mining; Association for Computing Machinery: New York, NY, USA, 2016; pp. 1225–1234. [Google Scholar] [CrossRef]
  32. Vidyapu, S.; Vedula, V.S.; Bhattacharya, S. Quantitative Visual Attention Prediction on Webpage Images Using Multiclass SVM. In Proceedings of the 11th ACM Symposium on Eye Tracking Research & Applications, Denver, CO, USA, 25–28 June 2019. [Google Scholar]
  33. Lin, Z.; Lyu, S.; Cao, H.; Xu, F.; Wei, Y.; Samet, H.; Li, Y. HealthWalks: Sensing Fine-Grained Individual Health Condition via Mobility Data. Proc. ACM Interactive Mobile Wearable Ubiquitous Technol. 2020, 4, 1–26. [Google Scholar] [CrossRef]
  34. Shim, H.; Luca, S.; Lowet, D.; Vanrumste, B. Data Augmentation and Semi-Supervised Learning for Deep Neural Networks-Based Text Classifier. In Proceedings of the 35th Annual ACM Symposium on Applied Computing, Brno, Czech Republic, 30 March–3 April 2020. [Google Scholar]
  35. Chen, Y.; Hu, S.; Zou, L. An In-depth Analysis of Graph Neural Networks for Semi-supervised Learning. In Semantic Technology; Wang, X., Lisi, F.A., Xiao, G., Botoeva, E., Eds.; Springer: Singapore, 2020; pp. 65–77. [Google Scholar]
Figure 1. (a) Scholar cooperation network. (b) Citation network.
Futureinternet 13 00064 g001
Figure 2. Diagram of the overall framework of the Association Content Graph Attention Network (ACGAT). The left part is the transformation operation, which transforms the discrete points into the resource graph structure. The right part is the aggregation operation, which aggregates the domain information and uses the final aggregation coefficient λ i j to get the new feature representation of the central node.
Futureinternet 13 00064 g002
Figure 3. Diagram of second-order relationships between resources.
Futureinternet 13 00064 g003
Figure 4. Schematic diagram of scholar cooperation. The number between scholars indicates the number of articles written in collaboration.
Futureinternet 13 00064 g004
Figure 5. Adjacency feature graph. (a) Original binary adjacency graph; (b) an asymmetric bidirectional edge feature graph of the central node.
Futureinternet 13 00064 g005
Figure 6. The networks constructed for the three datasets. (a) SIG scholar collaboration network. (b) Cora citation network. (c) Citeseer citation network. In the networks, different colors represent different categories, and the size of a node represents its influence on other nodes.
Futureinternet 13 00064 g006
Figure 7. A comparison of the visualization results of the three methods for the SIG dataset. (a) The result of DeepWalk, (b) the result of LINE, and (c) the result of structural deep network embedding (SDNE). Differently colored nodes represent different categories. The dataset contains eight categories (Ada programming language (DA); computer graphics (GRAPH); information retrieval (IR); information technology education (ITE); accessibility and computing (ACCESS); artificial intelligence (AI); computational biology (BIO); knowledge discovery in data (KDD)).
Futureinternet 13 00064 g007
Figure 8. A comparison of the visualization results of the three methods for the Cora dataset. (a) The result of DeepWalk, (b) the result of LINE, and (c) the result of SDNE. Differently colored nodes represent different categories. The dataset contains seven categories (neural networks; rule learning; reinforcement learning; probability methods; theory; genetic algorithms; case-based).
Futureinternet 13 00064 g008
Figure 9. A comparison of the visualization results of the three methods for the Citeseer dataset. (a) The result of DeepWalk, (b) the result of LINE, and (c) the result of SDNE. Differently colored nodes represent different categories. The dataset contains six categories (agents; artificial intelligence (AI); database (DB); information retrieval (IR); machine language (ML); human–computer interaction (HCI)).
Futureinternet 13 00064 g009
Figure 10. Classification results for SIG.
Futureinternet 13 00064 g010
Figure 11. (a) Classification results for Cora. (b) Classification results for Citeseer.
Futureinternet 13 00064 g011
Figure 12. The comparison results of neural network models on the SIG scholar network.
Futureinternet 13 00064 g012
Figure 13. Comparison results of neural network models on the Cora citation network.
Futureinternet 13 00064 g013
Figure 14. Comparison results of neural network models on the Citeseer citation network.
Futureinternet 13 00064 g014
Table 1. Commonly used notations.
NotationsDescriptions
GA graph.
VThe set of nodes in a graph.
v i A node v i V .
EThe set of edges in a graph.
NThe number of nodes, N = | V | .
h R F The feature vector of a set of nodes.
FThe dimension of the node features.
q i j The academic association commonality coefficient.
e i j The weighted coefficients of the association commonality.
λ i j The association influence coefficient.
α i j The semantic similarity coefficient.
AThe influence factor matrix.
DThe degree matrix, D.
d ( v i ) The degree of node v i .
MThe number of neighbors of a node v.
θ The shared attention mechanism.
N v The neighbors of a node v.
WThe sharing parameter.
[ · | | · ] Splicing operation.
W ε , W e , W D Learning parameters, including the academic semantic relevance, academic association commonality, and influence coefficient.
λ i j The final coefficient.
σ ( · ) The activation function.
KThe multi-attention number.
Table 2. Summary of the datasets.
DatasetsNodesEdgesFeaturesClasses
Scholar cooperation networkSIG366910,39936648
Citation networkCora2708542914337
Citeseer3312473237086
Table 3. Micro-F1 and Macro-F1 of various algorithms.
Dataset Metrics (%)SIGCoraCiteseer
Micro-F1Macro-F1Micro-F1Macro-F1Micro-F1Macro-F1
DeepWalk60.9153.6657.7554.1241.6335.70
LINE65.2856.5262.5561.2354.4949.34
SDNE69.2360.0170.1167.4760.0155.38
GCN75.3169.3278.7271.3864.3558.21
GAT80.2077.6586.8378.8468.7264.36
A-GAT83.1175.2788.7183.2673.2669.24
C-GAT86.2681.3988.4385.1771.1166.83
ACGAT90.6785.2292.6288.5474.6970.30
Publisher’s Note: MDPI stays neutral with regard to jurisdictional claims in published maps and institutional affiliations.

