1. Introduction
Video conferencing services based on WebRTC protocol are increasingly popular among Internet users, particularly as the home office has become the norm in the pandemic era. From 2.75 billion USD in 2019, the market value of WebRTC is expected to increase at a rate of more than 41.7% over the period 2020–2027 [
1]. Further fueling this growth, Internet service providers (ISPs) have deployed recent Wi-Fi technologies, such as Wi-Fi 6 and fiber broadbands, that promise carrier-grade quality Internet access for real-time applications such as WebRTC. Customers purchasing such services expect to establish uninterrupted video conferencing with ultra-high-definition video and audio quality in any location. However, these 802.11 networks are, by design, best-effort services, and despite the addition of quality of service (QoS) amendments to prioritize specific services, users remain frustrated by network issues. In fact, half of the technical calls Internet service providers (ISPs) receive are due to Wi-Fi network issues [
2]. Since customers consider ISPs responsible for any quality degradation of Internet services, such as video conferencing, the number of these complaints and technical calls has increased in recent years, especially during the pandemic.
Recognizing this growing dissatisfaction, ISPs have sought to monitor quality of service on customer premises, generally using external measurement approaches, such as packet capture and speed tests. However, these approaches impose excessive operational costs and may further inconvenience customers. Moreover, speed test approaches only measure end-to-end Internet bandwidth and quality and therefore cannot capture transient wireless issues. As a result, users may remain frustrated even after speed tests. The fact that users are more concerned with the quality of video conferencing than with the maximum bandwidth or end-to-end performance parameters further highlights the need for monitoring the user-perceived quality of service (PQoS) of video conferencing. Traditionally, service providers have requested user feedback by distributing surveys or embedding them in the application interface after video conferencing to evaluate quality of experience (QoE). However, QoE tends to represent a user’s general opinion and is influenced by non-technical factors, including social expectations and the price of the service. Hence, analyzing the impact of technical factors on perceived quality is preferable to feedback campaigns for assessing the quality of delivered services.
Various research projects present objective approaches for estimating the level of service acceptability on Wi-Fi networks. However, while the majority of studies employ the term QoE to estimate service acceptability, they consider only technical factors, such as network performance parameters. For example, Hora et al. used a subset of Wi-Fi network performance parameters, structural similarity index (SSIM) of video real-time communication (RTC) and perceptual evaluation of speech quality (PESQ) of audio RTC, to calculate QoE in the form of mean opinion score (MOS) values [
3]. In the same way, Chakraborty et al. used the signal-to-noise ratio (SNR) as the QoS metric and peak signal to noise ratio (PSNR) as the QoE metric to calculate experiential capacity regions and improve the QoE of Skype video conferencing on Wi-Fi networks by limiting the number of clients serviced [
4]. On the other hand, Morshedi presented a conceptual model that used the term PQoS to monitor the level of service acceptability and the correlation between user-perceived quality and delivered quality [
5]. Thus, it is desirable to distinguish between methods using only performance parameters and those leveraging user surveys by using the terms PQoS and QoE. To our knowledge, related works have used external measurements to collect network performance parameters or legacy 802.11a/b/g/n standards to produce datasets for training machine learning (ML) algorithms. Others have performed end-to-end measurements of generic network performance parameters, such as delay, jitter, and bandwidth, which cannot distinguish quality degradation between wired and wireless networks. Furthermore, related works have used cloud computing methodology to collect and analyze raw data on ISPs’ infrastructure, raising privacy concerns regarding data storage, sharing, and analytics purposes.
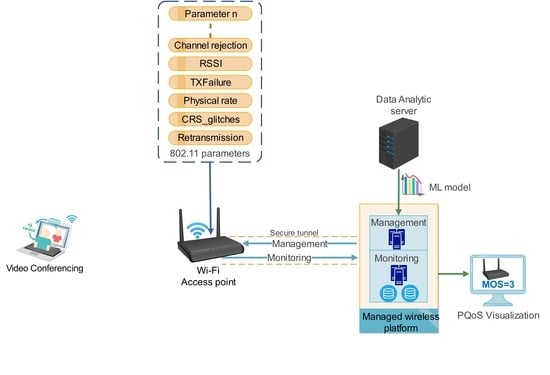
This paper presents methods to estimate the PQoS of video conferencing in WebRTC communication over Wi-Fi networks using ML. The ML algorithms were trained with four datasets to achieve reliable results. WebRTC application parameters, such as delay and packet loss, were collected from each client during video conferencing to calculate the level of PQoS in the form of MOS values in the range of 1–4 (1 = bad, 2 = poor, 3 = fair, 4 = good). A series of experiments was performed to produce datasets comprising 802.11g/n/ac/ax-specific network performance parameters labeled with MOS values. Finally, supervised learning algorithms were trained to select the best ML algorithm for estimating the PQoS of video conferencing on Wi-Fi networks.
Utilizing these methods, the proposed approach classified the PQoS of video conferencing with at least 92% accuracy. Indeed, this study demonstrated that 802.11-specific network performance parameters can reflect user-perceived quality of video conferencing on Wi-Fi networks. Since datasets initially comprised more than 240 features, which could increase the complexity of ML training, feature engineering techniques were used to reduce the dimensions of the datasets. Seven ML algorithms were then chosen to be trained with the reduced datasets. Of these, the REPTree algorithm performed best regarding accuracy, interpretability, and computational cost criteria. Finally, changes that occurred in features of the produced model were investigated to identify the cause of poor quality on 802.11 networks. This ML model can be executed as a script on Wi-Fi access points (APs) to estimate the PQoS of video conferencing services on the network edge and to send the MOS value and the related parameters during quality degradation to the ISPs’ cloud infrastructure for further analysis.
ISPs can thus utilize the results of this study to continuously monitor PQoS of video conferencing on customer premises and even identify anomalies or any quality degradation on wireless networks. In doing so, they will be better equipped to deliver predictable, measurable wireless Internet quality for home users while preserving customers’ privacy and reducing the operational costs of analytics. Ultimately, this study could be extended to consider a combination of different services in homes and buildings and to provide an extensive quality assessment approach.
The rest of this paper is organized as follows: tools and methodology are described in
Section 2. The results of data collection and training ML algorithms are presented in
Section 3.
Section 4 discusses the results and implications of the ML model, and
Section 5 presents related work for estimating QoE or PQoS using ML. Finally,
Section 6 concludes the study and presents a roadmap for future research.
2. Materials and Methods
The current study involved estimating the PQoS of video conferencing over Wi-Fi networks using ML techniques in homes and buildings. More than 16 experiments were performed to retrieve WebRTC application performance parameters and 802.11-specific network performance parameters from Wi-Fi APs. A script on the off-the-shelf Wi-Fi APs collected and sent 802.11-specific network performance parameters to our cloud monitoring platform. Next, four datasets were produced testing 802.11g/n/ac/ax standards operating in the 2.4 GHz and 5 GHz frequency bands. Finally, the number of features was reduced with feature engineering techniques before training ML algorithms to identify the best model in terms of accuracy, interpretability, and computational cost criteria.
During each video conferencing session, all WebRTC statistics for each client were stored, and at the end of the session, round trip time (RTT), jitter, packet loss, and the number of packets received were extracted to calculate MOS values for both video and audio sessions. The first parameter, RTT, indicates the time it took for a packet to travel from its source to its destination and back. Sometimes RTT is called latency, but often latency refers to a one-way delay. According to international telecommunication union (ITU) recommendations, highly interactive applications may be affected by one-way delay below 100 ms. However, most applications will not be affected by one-way delay below 150 ms, and maximum one-way delay should be considered below 400 ms [
6]. Therefore, the typical Internet user may not notice any delay if the RTT is kept below 300 ms. Jitter, the second parameter, indicates any variation of transmission delay over the network, although jitter less than 30 ms may not affect most of the applications. Jitter can occur when, due to congestion or multiple routing paths, packets are not sent sequentially. The third and fourth parameters are the number of lost packets and the number of received packets, respectively, which will be used to calculate packet loss ratio. A packet loss ratio greater than 2% can significantly affect a video conferencing session [
7,
8], and the call can fail completely when the packet loss ratio is greater than 2% in a short period of time.
In our experiments, wireless clients created a group video conferencing call in Google Hangouts as an example of a typical WebRTC service, and each client shared a video playback of a teaching session stored locally. At the end of the video conferencing session, WebRTC parameters were extracted from the internal statistics of the web browser. In the next step, extracted WebRTC parameters were represented as a mean opinion score (MOS), indicating the average value of user opinions in a range of 1–5 (1 = bad, 2 = poor, 3 = fair, 4 = good, 5 = excellent) for a given condition in subjective assessments [
9]. The ITU provided the E-Model [
10] as a transmission rating model using the transmission rating factor (R), which combines all transmission parameters in a connection. A simplified method considering only the impact of packet loss ratio and jitter exists to calculate the R-factor, and this method is used in various enterprise monitoring tools [
11,
12,
13].
First, the impact of delay and jitter on quality were calculated in the form of effective delay, in milliseconds, as follows:
In Equation (1), jitter is doubled because it has a higher impact on voice quality, and a delay of 10 milliseconds accounts for codec delays in a typical voice communication session. Next, the impact of delay and jitter on
R-factor was calculated, as follows:
Because packet loss can significantly affect the quality of video conferencing, the impact of packet loss ratio on the
R-factor was magnified and calculated as follows:
Finally, the
MOS values were calculated for different
R-factors using the ITU E-model [
10], as follows:
The abovementioned method facilitates calculating MOS values using parameters extracted from WebRTC internals so that MOS values can be calculated for both audio and video sessions between each wireless client and the cloud-based video conferencing endpoint.
This study leveraged the AirTies 4920 and the Zyxel 5501AP/Internet gateway as examples of off-the-shelf Wi-Fi APs to test wireless networks operating at various 802.11g/n/ac/ax standards over 2.4 GHz and 5 GHz frequency bands. Four groups of experiments were conducted to investigate the impact of wireless conditions on the quality changes of video conferencing in homes and buildings. The AirTies 4920 AP was used to test 802.11g/n/ac standards, whereas Zyxel 5501 was primarily used to test the 802.11ax standard. In each experiment, four wireless clients connected to an AP establishing video conferencing calls. For testing 802.11g/n/ac standards operating in both 2.4 and 5 GHz frequency bands, one Dell Latitude 5480 laptop equipped with Intel 8265 802.11g/n/ac wireless adapter, one HP Elitebook 8460P laptop equipped with Intel Centrino 6205 802.11g/n wireless adapter, one Lenovo E531 laptop equipped with Realtek 8812BU 802.11g/n/ac external wireless adaptor, and one Microsoft Surface tablet equipped with 802.11g/n/ac Marvell AVASTAR wireless adapter connected to the AirTies 4920 AP. For testing 802.11ax in both 2.4 and 5 GHz frequency bands, four Intel NUC PCs equipped with Intel AX200 PCI-e wireless adapters connected to the Zyxel 5501 AP.
In this study, Wi-Fi networks operating at 802.11g/n 2.4 GHz, 802.11ac 5 GHz, 802.11ax 2.4 GHz, and 802.11ax 5 GHz were tested, and in each test, clients deployed in two different scenarios, including all devices being near the AP in one room as well as clients distributed in different rooms.
Figure 1a depicts the first setup, a simulated round-the-table scenario where four wireless devices are connected to an AP that is approximately two meters from each device in one room.
Figure 1b depicts the second setup, in which four wireless devices are located in different rooms to simulate the most common use case in homes and buildings (e.g., a home school or home office).
The AirTies 4920 and Zyxel 5501 leverage a customized Linux operating system to control hardware. Each vendor customized the Linux operating system to control a different wireless adapter embedded in the AP so that available tools in each device return different parameters. One of these tools is the “wl”, which allows collection of 802.11 performance parameters such as wireless adaptor counters, multimedia access category counters, packet counters, and specific counters for each connected client. We developed a Bash script to collect wireless performance parameters, security, and privacy configuration every second. In doing so, the Bash script collected more than 190 wireless network parameters for each wireless adaptor and more than 48 parameters for each connected client to the AP. Then, the script sends collected parameters to an Elastic Stack [
14] platform as our cloud-based monitoring platform, which parses data upon arrival and indexes them to the Elasticsearch for further analysis.
In order to capture the impact of individual wireless devices on the perceived quality of the existing video conferencing session, wireless devices joined the call incrementally, one after another. Each client joined the call for 14 min in each test, while the Bash script collected the 802.11 network performance parameters on the AP every second. In each test, the first wireless device launched the video conferencing session with a cloud-based endpoint. Additional wireless devices entered the group call one after another every three minutes, and after the fourth device had participated for five minutes, all of the devices ended the call in first-in, first-out (FIFO) order. At the same time, statistics of the video conferencing call were collected from each wireless device in order to compute the perceived quality of call for each client in the form of MOS values, using Equations (1)–(4). During all tests, a signal generator device was used to simulate various kinds of interference on wireless networks by generating 802.11 packets and raw signals on the air.
In the data preparation phase, the floating-point MOS values calculated using Equation (4) were rounded to the nearest integer to discretize the values and comply with the description of the MOS scoring scheme in a range of 1–4 (1 = bad, 2 = poor, 3 = fair, 4 = good). Hence, the “good” MOS score of 4 was considered optimal quality. In addition, data were collected from both setups in order to increase the variability of wireless conditions and prevent overfitting of ML algorithms to a specific scenario. In this way, four datasets—802.11n 2.4 GHz (2n), 802.11ax 2.4 GHz (2ax), 802.11ac 5 GHz (5ac), and 802.11ax 5 GHz (5ax)—were produced in such a way that each dataset comprised 802.11-specific network performance parameters, all labeled with their respective video conferencing MOS class.
The next phase of our approach entailed training ML algorithms with datasets to identify the best model for estimating the PQoS of video conferencing. Before the ML training, three criteria were established to regulate the process of selecting the best model that could be executed on the Wi-Fi APs of customer premises. The first criterion was the maximum classification accuracy of the ML algorithm. The second criterion was interpretability, so that the model generated by ML could be easily understood, validated, and therefore used to infer the root cause of quality degradation. Miller defined interpretability as how well an observer can understand the decisions made by a ML model for prediction [
15]. A model with high interpretability facilitates the understanding of a decision that resulted in the prediction and why a specific decision was preferred. The interpretability criterion helps observers to extract knowledge captured by the model, detect personal biases, and debug and audit the ML process as well as enhances social trust of ML predictions. The third criterion was the computational cost of the model, ensuring that the model could be executable on off-the-shelf APs with generally low computational capabilities.
The training process was performed using the Weka workbench [
16] to select the best ML algorithm after analyzing more than 40 algorithms and applying 10 feature engineering techniques to the datasets. Next, J48 (C4.5), logistic model tree (LMT), reduced error pruning tree (REPTree), naïve Bayes tree (NBTree), ripple-down rule learner (RIDOR), and multilayer perceptron (MLP) algorithms were selected to be representative of different supervised ML categories. In addition to the abovementioned algorithms, the ZeroR algorithm was leveraged to establish a baseline to assess the efficiency of candidate ML algorithms compared with the majority prediction approach. Beyond this, the study used the resampling technique to identify the best training and testing sets split prior to the ML training phase. Therefore, it used 70% of these instances for training and the rest for the testing phase.
Datasets comprised more than 240 features, which increased the computational complexity of training. Although some algorithms were fast enough to be trained, all of the features in the dataset did not contribute to the output model. Furthermore, excessive features may increase the probability of overfitting and the CPU time required for testing. In effect, this study performed experiments with 10 evaluators, each utilizing more than 10 search algorithms to find the optimal feature selection technique. In this way, the correlation-based feature subset selection (CfsSubsetEval) was chosen as the optimal evaluator with the best-first (“greedy”) algorithm, incremental wrapper feature subset selection with naïve Bayes (IWSSEmbeddedNB), and particle swarm optimization (PSOSearch) as search algorithms to select features that could achieve the highest accuracy and interpretability compared with those produced by the full-featured dataset.
3. Results
This study performed more than 16 experiments while wireless clients participated in video conferencing group calls. Four datasets comprising 802.11-specific network performance parameters labeled with mean opinion score (MOS) classes in the range of 1–4 were produced to train seven ML algorithms for estimating the PQoS of video conferencing sessions in homes and buildings. Initially, each dataset comprised more than 7800 instances, and each instance consisted of more than 240 features, which increased the computational complexity of ML implementation. In light of this complexity, specific algorithms, such as multilayer perceptron (MLP), required hours of training, and it was possible to implement the model on Wi-Fi APs. Hence, after the feature selection phase using PSOSearch, 33, 62, 94, and 65 features were selected for 2n, 2ax, 5ac, and 5ax datasets, respectively. Datasets representing the 802.11ax standard experienced significant feature reduction; in the end, their features were reduced by nearly 80% compared with those of the full-feature dataset.
Table 1 presents the number of instances, missing values, features, and distribution of MOS labels in each dataset. As shown in
Table 1, the number of instances labeled with an MOS of 4 constituted more than 50% of the datasets, suggesting that clients experienced good quality most of the time. Notably, the 5ax dataset contained the highest rate of missing values because wireless clients were often disconnected from the AP due to poor wireless channel conditions during the experiments. As a result, client-related 802.11 performance parameters were missing.
This study utilized the ZeroR algorithm as a baseline to compare the classification accuracy of candidate algorithms with the majority class prediction approach. For example, because 67% of 802.11ax 2.4 GHz (2ax) instances were labeled as MOS = 4, the accuracy of the candidate algorithms should have been greater than 68%; if these conditions were not met, using complicated ML techniques would have been a waste of resources. Hence, the classification accuracies of J48, LMT, REPTree, NBTree, RIDOR and MLP algorithms were compared with ZeroR baseline.
Figure 2 presents the classification accuracies of seven ML algorithms, each trained with four different datasets. The accuracy of ZeroR for predicting MOS = 4 as the baseline algorithm was more than 56%, indicating that wireless clients experienced good quality in more than half of their video conferencing sessions. Indeed, six of the algorithms could achieve substantially better classification accuracies than ZeroR, with more than 92% classification accuracy in all datasets after feature reduction. Along with classification accuracy, two other criteria—interpretability and computational cost—were included for further efficiency assessment.
Classification accuracy is, after all, an overall performance metric and cannot provide a precise assessment of ML algorithms’ performance in predicting different classes. Therefore, the confusion matrix provides a granular assessment of ML algorithms by presenting the number of true and false positives.
Table 2 presents confusion matrices for REPTree predictions for the 2n, 2ax, 5ac, and 5ax datasets. As
Table 2 shows, the REPTree models performed quite well in predicting bad and good quality classes (MOS = 1 and MOS = 4, respectively), whereas they underperformed in predicting poor and fair quality classes. Since few instances were labeled with MOS = 2 and MOS = 3 in the datasets, all six candidate algorithms achieved low levels of precision and recall in predicting these two classes. Furthermore, 2ax and 5ax datasets were each missing up to 30% of their values, which likely hindered ML algorithms’ attempts to achieve higher accuracy in predicting MOS classes (see
Table 1).
The confusion matrix can provide additional metrics, including precision, recall, and F1 score, to evaluate the performance of ML algorithms. The precision measures the proportion of correct predictions and recall measures the proportion of correct prediction of true positives. In order to simplify the performance evaluation, F1 score presents harmonic mean of precision and recall, which is suitable for evaluating the performance of algorithms trained with an imbalanced dataset.
Figure 3 presents the F1 score of candidate algorithms tested with 30% of each dataset. These results indicate that candidate algorithms classified the perceived quality of video conferencing precisely, mostly because of the performance parameters used to train algorithms.
Regardless of missing values, feature engineering techniques such as replacing missing values with modes and means from training data can slightly enhance the classification accuracy, and in particular can enhance the poor and fair classes prediction.
Since the classification accuracies of all six candidate algorithms are quite similar, the interpretability criterion facilitates efficiency assessment by choosing the best model to interpret and identify the root causes of quality degradation in wireless networks. Therefore, models that are easy to interpret and easily traceable are particularly valuable in estimating the PQoS of video conferencing. The tree-like ML models are preferred because a human observer can explain a tree model by deconstructing each decision path into individual steps. A tree model generally is a simple model to visualize, and the tree presentation can depict interactions between features in the dataset. Furthermore, a tree structure provides contrastive presentation of decision paths such that a human observer can always compare the possible decision paths with each other. In contrast to other complex models, observers can perceive the order of feature importance from tree visualization.
Since ML algorithms that produce tree-like models are easy to interpret, the J48, REPTree, LMT, and NBTree fulfill the interpretability criterion. In addition, the LMT and NBTree produced a combination of tree-model with logistic regression and naïve Bayes functions, respectively, ultimately achieving superior results in some use cases, compared with pure tree models. Here, the REPTree and J48 were the best ML algorithms in terms of interpretability. Thus, the computational cost criterion served as a tiebreaker. In the interpretability ranking, the LMT and NBTree algorithms followed the REPTree and J48 algorithms, whereas the RIDOR and MLP algorithms ranked at the bottom.
Computational cost, the third criterion, assesses the CPU time required for estimating the PQoS of video conferencing.
Figure 4 presents the CPU time (in milliseconds) used for testing 30% of the instances in each dataset in a cloud server equipped with four Intel Haswell 2.6 GHz vCPU and 16 GB memory. As shown in
Figure 4, the REPTree and RIDOR algorithms spent nearly zero milliseconds estimating PQoS in all datasets, whereas the J48 and LMT algorithms took nearly zero milliseconds to estimate PQoS only in the 2n, 5ac, and 5ax datasets. The MLP algorithm used less than 100 ms, and the NBTree algorithm used up to 700 ms to estimate PQoS in 30% of the instances of all datasets. In the CPU time spent for the testing phase, the REPTree was the fastest algorithm trained, with 70% of the instances of all datasets. In the list ranking CPU time used for training, the J48, RIDOR, LMT, MLP, and NBTree algorithms all placed after the REPTree algorithm, in that order.
In terms of accuracy, interpretability, and computational cost, the REPTree algorithm was chosen as the best algorithm for estimating the PQoS of video conferencing services on Wi-Fi APs.
Table 3 presents the overall assessment of six ML algorithms trained for estimating the PQoS of video conferencing with respect to accuracy (A), interpretability (I), and computational cost (C) criteria. Complex algorithms such as MLP are more accurate and computationally expensive algorithms and are generally treated as a black box regarding interpretability and ease of explanation to decision makers. Therefore, there should be a trade-off between accuracy, interpretability, and computational cost. As can be seen in
Table 3, the classification accuracies of all algorithms are in the same range, thus the interpretability advantages of tree-like models over RIDOR and MLP resulted in choosing J48, LMT, REPTree, and NBTree in the interpretability assessment phase. Among these, NBTree produced a computationally intensive model, which could overload the CPU of APs. Finally, among the J48, REPTree, and LMT, the REPTree was chosen as the best algorithm because it had the lowest computational cost even for the training phase. This suggests that using REPTree can impose a lower operational cost for analytics.
The results demonstrated that PQoS levels for video conferencing can be estimated with a high classification accuracy (at least 92%) using only the 802.11-specific performance parameters on Wi-Fi APs in homes and buildings. This study demonstrated the proof of concept for objective assessment of the PQoS on wireless networks using ML, which can be implemented in the form of edge computing in customer premises. Although the datasets produced in this study may not represent all wireless conditions, collecting long-term data on wireless networks can improve the precision of ML estimations over time.
4. Discussion
This study introduced an approach for estimating the PQoS of video conferencing calls over Wi-Fi networks using 802.11-specific network performance parameters, while achieving a classification accuracy of more than 92%. The results of this study indicated that 802.11-specific network performance parameters on Wi-Fi APs highly correlate with the user-perceived quality of video conferencing calls in homes and buildings. Reviewing the literature indicated that existing approaches perform quality assessments and notify service providers regarding only levels of quality. However, existing approaches do not provide additional information about the root cause of quality degradation. Since customers consider service providers responsible for any quality degradation, they expect customer service to identify these causes and solve the corresponding issues as soon as possible. In this regard, our approach provides a model that is easy for operational teams to understand and use in identifying the root causes of quality degradation on wireless networks.
The results demonstrate that our approach achieved higher classification accuracy than the results presented in other studies [
3,
17,
18,
19,
20], even though related works have often used binary classification, which is essentially a simpler classification problem than multi-class prediction. Existing approaches have also used external measurements to collect generic network performance parameters for training ML algorithms and identifying quality degradation. In doing so, they increase operational costs for ISPs (shipping measurement equipment to customers, for example) and impose privacy concerns about data analytics. Although a few studies used Wi-Fi as an access network, related works did not leverage 802.11-specific network performance parameters for estimating perceived quality. Although related works trained their ML algorithms with relatively small datasets, this study produced multiple large datasets, with nearly 40,000 instances in total, to enhance the generalization of the output model. In contrast to related works, this study proposed a novel method in the form of edge computing to address the shortcomings of existing approaches. Most notably, this study pioneered estimating the perceived quality of video conferencing services using 802.11-specific network performance parameters for off-the-shelf Wi-Fi APs. Although ISPs promote APs operating at recent 802.11ac/ax standards to improve quality of wireless networks, testing video conferencing in these networks indicated that devices in these networks may experience bad quality even more than devices operating at 802.11n standards in various wireless conditions. In addition, these tests demonstrated that our methodology can assess perceived quality of recent Wi-Fi technologies and does not require modification.
In addition, this study used RTT, jitter, packet loss, and number of packets received to calculate PQoS in the form of MOS values for each instance in the datasets. In contrast, related works used different approaches for predicting the perceived quality of video conferencing. These include the binary classification of quality as “acceptable” or “unacceptable,” individual binary classifications for video and audio communications, and ternary classifications provided by applications. However, each of these alternative approaches is limited. For example, assessment of the perceived quality of video conferencing into acceptable and unacceptable binary classes may conceal the details required for identifying the root causes of quality degradation and for planning improvements. Representing the assessment of perceived quality in the form of MOS values addresses these issues and better classifies issues according to predefined levels in service providers’ business and operational plans.
Most of the off-the-shelf Wi-Fi APs use a Linux-based operating system, which provides 802.11 network performance parameters in the form of counters and information variables. However, some of these parameters may not correlate with PQoS, and APs may not update some of the parameters, so it is reasonable to eliminate unnecessary parameters. Unnecessary parameters may cause ML algorithms to overfit or underfit training data and consequently do not generalize well to unseen events. Therefore, feature engineering techniques can be used to manipulate features in datasets and improve the precision of the produced model. This study considered two criteria for comparing feature selection processes. The first measured accuracy, and the second measured whether selected features were informative enough to infer the root cause of any quality degradation. Thus, after applying various feature selection evaluators and search algorithms to datasets, we selected the CfsSubset with PSOSearch as the best feature selection technique. The best-first search algorithm with backward direction selected the fewest features in the datasets and could not compete with the accuracy of the full-featured dataset. Although both the IWSSEmbeddedNB and PSOSearch achieved similar accuracy as—or even higher accuracy than—the full-featured dataset, the number of features selected by the PSOSearch was greater than the number selected by the IWSSEmbeddedNB, and the new dataset presented more informative features, which could facilitate identifying the root causes of any quality degradation. Recognizing the challenge of choosing a suitable ML algorithm, this study proposed three criteria—accuracy, interpretability, and computational cost—to select the best algorithm that is executable on off-the-shelf Wi-Fi APs. Although the classification accuracies of all six algorithms were quite similar, this study selected REPTree as the best ML algorithm for this use case. Most of the related works exclusively utilized ML evaluation metrics, such as accuracy, recall, precision, F-measure, ROC, and RMSE, to assess the performance of their ML approaches. However, these ML evaluation metrics only consider how accurately the ML algorithms can classify the input data, and the model with the best precision is not always the best algorithm to implement. Therefore, this study considered interpretability and computational cost criteria to ensure the implementation and usefulness of the proposed approach for ISPs.
The REPTree is a fast learner algorithm that produces a decision tree using information gain and prunes the tree using reduced error pruning. Although J48 (C4.5), LMT, and NBTree achieved similar classification accuracies and satisfied the interpretability criterion, REPTree was fast enough to produce the model within the expected interpretability level and with similar accuracy. Furthermore, meta-algorithms such as AdaBoost can enhance the classification of REPTree learner even further. The MLP and NBTree were CPU-demanding algorithms compared with the other four candidate algorithms, whereas the rule-based RIDOR produced rules that were not easy to interpret when compared with those of a tree structure. Therefore, presenting 802.11 network performance parameters as a decision tree model facilitated identifying any change in key parameters affecting the perceived quality of video conferencing calls over Wi-Fi networks.
For example, the REPTree model trained with the 802.11ax 2.4 GHz (2ax) dataset was analyzed to showcase how 802.11-specific network performance parameters used in the tree model can correlate to any wireless quality degradation scenario. Indeed, operational teams can infer the root causes of any wireless quality degradation by correlating the changes that occurred within individual 802.11 network performance parameters to wireless conditions.
Figure 5 shows the tree model produced by the REPTree algorithm trained with the 2ax dataset to estimate the perceived quality of video conferencing on Wi-Fi networks; the depth of the tree has been limited to five leaves so that it can be presentable in this article.
Furthermore, the received signal strength indicator (RSSI) was selected as the root of the tree with the threshold of −68.5 dBm. RSSI is one of the most commonly used parameters for analyzing the quality of wireless communication. Although RSSI has been commonly used for quality assessment, different devices can report considerably different RSSI values in the same location because the IEEE has not yet standardized the correlation between RSSI and received signal strength (RSS). This study used different devices from different vendors to reduce the probability of RSSI overfitting during the training phase. The Zyxel 5501 AP was equipped with 4 × 4 multi-input, multi-output (MIMO) antennas for the 2.4 GHz interface. Therefore, it was expected to see different RSSI thresholds in the REPTree model for antenna numbers one and three during beamforming.
The txprshort represents the number of short preambles transmitted. The preamble synchronizes various timers between the transmitter and receiver, while the receiver uses the preamble to lock to the signal and select a suitable antenna. The short preambles can be transmitted only with 2 Mbps, 5.5 Mbps, and 11 Mbps speeds. When a collision occurs, the AP sends a new frame with a new preamble so that the receiver can synchronize again. An excessive number of short preambles can indicate poor channel quality, likely due to collisions.
The d11_txmulti and rxdtmcast represent the number of transmitted multicast frames and the number of received multicast data frames, respectively. The multicast traffic in 802.11 should maximize the number of receivers, and therefore the multicast transmitter uses much lower data rates with sufficient power levels to reach the farthest clients. Hence, a higher number of multicast frames will result in lower transmission speeds and greater airtime usage so that the capacity of a Wi-Fi network will decrease considerably. Therefore, even with 802.11ax technology, wireless clients participating in video conferencing can experience capacity limitations due to a high number of multicast frames. On the other hand, the rxdsucastmbss represents the number of received data frames with good frame check sequence (FCS) and matching receiver address in the mesh basic service set. In effect, a high number of multicast packets, compared with unicast packets in the 802.11ax 2.4 GHz (2ax) dataset, can indicate a capacity limitation on the Wi-Fi network.
The rxnodelim represents the number of delimiters that are not valid in a received aggregated media access control protocol data unit (MPDU), whereas the rxcrsglitch confirms that the preamble is correct, although it cannot correspond to the header in the received frame. These counters will increase when the received frame contains cyclic-redundancy check (CRC) errors, and necessary fields cannot be extracted from the frame. In a wireless network, CRC errors can occur due to packet collision in environments with dense populations of wireless devices, overlapping APs, and/or multipath or non-802.11 interference on their frequency bands. Moreover, these parameters can indicate interference in the communication medium.
The rxrtsucast represents the number of unicast request-to-send (RTS) frames targeted to the AP. The request to send/clear to send (RTS/CTS) frames are used to reserve the wireless medium for uninterrupted data transmission with a 2347 byte threshold, which is often used to avoid collisions caused by hidden nodes in the wireless network. Generally, the problem of hidden nodes is greater on busy networks in buildings composed of reflecting materials, where data transmissions are more often corrupted by unintended collisions [
21]. Since RTS frames are transmitted at the slowest speeds, transmitting RTS/CTS frames can reduce network throughput. Therefore, a high number of received RTS frames indicates that the network is busy and that the probability of collisions is high. In addition, ISPs can increase the number of APs along with reducing transmitting power and cell size to improve the quality of busy wireless networks.
The rxprobereq represents the number of probe request frames received by the AP. Clients transmit probe request frames on every channel that they support to scan the air for 802.11 networks. An excessive number of probe request frames indicates that clients have disconnected from the AP too frequently, which may be caused by interference or low signal strength.
Regarding client-side features in the REPTree model, the network time counter represents the number of seconds that a client was associated with as well as authenticated and authorized to the wireless network. Moreover, the network time counter, along with the number of probe requests, can be used to identify how often the client was disconnected from the network, which may have been caused by poor channel conditions.
The client-side transmit retries counter (txPktsRetries) shows that the AP retransmitted packets to a client. This counter increases for each packet that the AP retransmits, and therefore a sharp increase in the number of txPktsRetries indicates poor channel conditions. However, the txPktsRetries counter indicates only the number of retransmissions, so other parameters should be used to find the probable cause of retransmissions.
Figure 6 illustrates a sharp increase in the number of retransmitted packets, which indicates poor communication channel quality and is classified as MOS = 1 during video conferencing.
The transmit failures (txFailures) in the model indicate that frames were discarded when the maximum number of retransmission retries was exceeded due to either short or long retry limits. The number and duration of failed transmissions can indicate whether a poor channel condition was transient or long-lasting. In addition, comparing received errors with failed transmissions can distinguish between situations where the end-to-end communication channel is poor and those where only one side is experiencing issues transmitting data. In addition, APs collect the total number of transmitted frames that failed in the access categories introduced by IEEE QoS amendments. Changes in this parameter, along with client-side failed transmissions, can indicate whether the AP failed to transmit to a specific client or generally failed to transmit data due to interference.
This study achieved promising results in estimating the PQoS of video conferencing over Wi-Fi networks. The produced ML model can be executed on off-the-shelf Wi-Fi APs to monitor the quality of wireless connectivity at customer premises to ensure predictable, measurable wireless quality. Our novel approach avoids sending raw data to the cloud infrastructure of ISPs by classifying wireless quality on the edge of networks in the form of edge computing. In this approach, the level of PQoS is computed on Wi-Fi APs on customer premises, and in the case of any quality degradation, the MOS scores and related 802.11 performance parameters are sent to the ISP’s support and operations teams for further investigation. In effect, our approach provides three advantages: (i) preserving customer privacy by limiting data collection from customer premises, (ii) eliminating raw data processing on the cloud infrastructure of the ISP, and therefore reducing the operational cost of data analytics, and (iii) requiring no user interaction or external measurements for evaluating wireless quality in homes and buildings.
5. Related Work
As video conferencing applications have continued to grow in popularity, particularly during the pandemic, researchers have investigated the perceived quality of video conferencing over wireless networks to improve quality of experience (QoE) using ML. A few of these papers have investigated perceived quality, specifically for Wi-Fi networks in their experimental setups, whereas others have considered wired networks. In their survey of the literature predicting the PQoS using ML on Wi-Fi networks, Morshedi and Noll noted that the majority of works had used external measurements, such as packet captures and ping tests, to collect generic network performance parameters [
22]. Moreover, research efforts have leveraged different sets of parameters to estimate the perceived quality of video conferencing over wireless networks, which, in turn, has led them to select different quality assessment methods.
Yan et al. investigated the prediction of QoE of WebRTC over Wi-Fi networks. They devised an experiment involving a commodity AP and two clients, in which one connected wirelessly and the other connected through a wired setup to a joint WebRTC session. They performed 620 experiments by moving the wireless client between rooms on a building floor. Meanwhile, they collected wireless performance parameters, such as RSSI, link quality, signal quality, packet loss ratio, and RTT, for the Windows client. Next, they used the time interval between two consecutively played video frames to identify video freezing, and categorized frames with a time interval between two frames greater than one second as bad QoE and less than one second as good. They further categorized experiments as unacceptable when a session experienced bad QoE for more than 30% of the session. Using the decision tree, random forest, SVM, and extra tree classifiers with an 80–20% training-testing split, they achieved the highest F1 score, 0.74, with the decision tree [
17,
18].
Sulema et al. investigated the QoE of WebRTC in mobile broadband networks using the MONROE platform. They implemented a media server using Kurento in such a way that PC clients could connect to the media server for establishing WebRTC sessions. These researchers collected QoS parameters, including jitter, packet loss, bytes received, and RTT, which produced a dataset with 20,000 instances. After inviting 28 participants to assess the quality of 15% of the dataset in the form of MOS scores, they leveraged various ML regression algorithms, such as random forest, SVR, regression tree, and AdaBoost, to estimate the MOS value of 85% of the dataset. The results indicated that a daily average of QoE was between 4 and 4.5, suggesting that quality was good or excellent most of the time [
19]. In another study, Ammar et al. investigated an application of ML for estimating the performance of WebRTC and identifying the root cause of quality degradation. After designing lab experiments with three wired clients and a network emulator to generate network impairments, they invited 12 participants to rate the WebRTC quality. They collected WebRTC-internal statistics from web browsers and attempted to categorize video blockiness and audio distortion into acceptable and unacceptable classes. They leveraged C4.5, random forest, naïve Bayes, SMO, IBK, and bagging in WEKA and achieved 92% and 82% accuracy in categorizing video blockiness and audio distortion into binary classes, respectively [
20]. On the other hand, Hora et al. investigated the perceived quality of RTC video over Wi-Fi networks by measuring the SSIM of video and the PESQ of audio communications. They collected QoS parameters, such as medium busy time, physical rate of the last frame, number of transmitted and retransmitted frames, and RSSI, and achieved an RSME of 0.6–0.79 by running a support vector regression (SVR) [
3].
Since Skype is one of the most popular video conferencing services, Spetebroot et al. investigated the impact of various network conditions on Skype video calls. They collected packet loss ratio, network throughput, and RTT as QoS parameters, while utilizing the Skype quality meter feature to categorize calls as being of good, medium, or poor quality. Their results achieved 66% accuracy when estimating quality classes using the decision tree algorithm [
23].
The review of the literature presented here indicates the need for a more efficient quality assessment approach than external measurements provided because existing approaches may be inconvenient and increase the operational cost of data analytics for ISPs. As newer 802.11 standards have commercialized, the literature continues to design and test their quality assessment approach exclusively for legacy Wi-Fi networks. In addition, the literature has often utilized small datasets to train ML algorithms, which can cause dataset overfitting or underfitting and may produce results that do not extend well to unseen conditions. Finally, existing approaches collect all measurements on the service provider side, which raises privacy concerns regarding data storage, access, and analytics purposes. This study presented a novel approach to address the abovementioned shortcomings by using ML techniques trained with 802.11-specific network performance parameters on the edge of networks in the form of edge computing.
6. Conclusions
Although ISPs deploy fibers to deliver a higher quality of service, the best-effort nature of Wi-Fi networks as the last hop to the end user may prevent clients from experiencing maximum video conferencing quality. Existing approaches for estimating the perceived quality of video conferencing often leverage external measurements to collect generic network performance parameters, such as delay, jitter, and packet loss, for training ML algorithms on the cloud infrastructure of service providers. However, external measurements may not be convenient for users, and cloud analytics can impose security concerns and excessive costs for ISPs. Therefore, this paper presented a novel approach for estimating the PQoS of video conferencing services over Wi-Fi using 802.11-specific network performance parameters on customer premises. More than 16 video conferencing experiments were performed on Wi-Fi networks operating at 802.11g/n/ac/ax standards over 2.4 GHz and 5 GHz frequency bands to produce datasets containing more than 40,000 instances in total. After applying feature engineering techniques to reduce the number of features, ML algorithms classified the level of PQoS with 92–98% accuracy. In terms of accuracy, interpretability, and computation criteria, the REPTree was the best algorithm for estimating the PQoS of video conferencing. The produced ML model can be executed on the Wi-Fi APs as a lightweight script to continuously classify the level of PQoS on customer premises in the form of edge computing. The script calculates the PQoS in the form of MOS values and reports it to the customer support dashboard. When wireless quality degrades, the script can send the 802.11-specific network performance parameters, which correlate with quality degradation, to the cloud infrastructure of ISPs for further analysis by support and operational teams. Thus, ISPs can utilize this paper’s approach to deliver predictable, measurable wireless quality in homes and buildings prepared for carrier-grade Internet connectivity and upcoming novel services. With our unique approach, ISPs can also address clients’ privacy concerns regarding data analytics while reducing the operational costs of data analytics for themselves.
Although this study performed real-life experiments of video conferencing services in homes and buildings, it could not capture all wireless conditions or incorporate them into the training datasets. Therefore, future studies should collect data from various locations to improve the precision of the ML model. Furthermore, this study focused only on video conferencing services, whereas residential clients use a combination of services, such as video streaming, video conferencing, and web browsing. Therefore, the authors aim to extend this study to estimate the PQoS of wireless connectivity for various services in homes and buildings.


