1. Introduction
Drug delivery via the oral route is the most popular method. Tablets, the most widely used oral format on the market, are chosen by patients and medical professionals. Conventional formulations must be given in various doses during long-term therapy for the management of chronic illnesses, which has several drawbacks. Developing dosage forms that control the drug’s entry into the body at the target site and function for a long period has been shown to be a suitable approach to optimize therapeutic outcomes [
1]. Such systems enable the release of drugs to achieve the desired therapeutic response. Traditional drug delivery systems have fluctuating drug levels in plasma and might affect the therapeutic level of the drug. The therapeutic process can only be rendered useful with an efficient delivery mechanism.
Furthermore, to achieve maximum efficacy and safety, the drug must be delivered to the target site as precisely as possible at a specific and controlled rate. Controlled drug delivery systems are being developed to address the problems associated with conventional drug delivery. Over the past two decades, controlled drug delivery systems have progressed tremendously from macro- and nanoscale systems to intelligent, targeted delivery [
2]. Controlled drug delivery systems can maintain drug levels within a particular range, necessitate fewer doses, ensure the medicine is used to its full potential, and promote patient compliance. A high blood level of the drug over an extended period was the aim of many of the earliest controlled-release systems’ delivery profiles. For the oral route, matrices have been chosen as the most likely mode of prolongation of drug release. The typical components of an oral controlled drug delivery system are either a drug core coated with a film (also indicated as a membrane) or a matrix in which the drug is dispersed [
3].
A matrix is one of the approaches to controlled-release systems, which is an oral solid dosage form that maintains stable plasma drug concentrations and release rates to produce long-term therapeutic activity. Such controlled-release systems are designed for short-lived drugs with frequent dosing [
4]. A matrix is an oral solid dosage form in which the drug or active ingredient is uniformly dissolved or dispersed throughout the hydrophilic or hydrophobic polymeric matrix, which serves as a release rate retardant. In matrices, matrix-forming materials are often swellable hydrophilic or non-swellable hydrophobic polymers, and the polymer properties affect the drug release rate from the matrix through diffusion, permeation, and dissolution. For the drug to be released, it must first dissolve. Therefore, the rate at which water permeates the matrix is directly related to the drug’s ability to dissolve, diffuse out of the matrix and diffuse throughout the solution. Therefore, the matrix’s diffusion path length influences the drug’s release rate and subsequent absorption. Diffusion occurs when the drug moves from an area of high concentration within the matrix core to an area of low concentration in the surrounding medium [
5].
Excipients are inert constituents incorporated in dosage forms other than drugs and added to dosage forms for different uses, such as improving stability, enhancing bioavailability, helping in the preparation procedure, improving the appearance or taste, and easing the delivery or administration of the active ingredient [
6]. Excipients of an oral drug delivery system are classified based on their functions, including binders (binding agent), diluents (bulking agent), lubricants (reduce friction during ejection at the point where a tablet’s surface meets the die wall to lessen wear on punches and dies), disintegrating agents, plasticizers, and polymers [
7]. Polymers are used in oral controlled-release systems as matrix-forming materials to control drug release rates. Polymers have various pharmaceutical applications, including as binders, enhancing viscosity, and improving flow for liquids, suspensions, and emulsions. Polymers can be employed as film coatings to improve drug stability, change drug release properties, and mask a drug’s disagreeable taste. Polymer types include natural polymers (e.g., dextrin, arginine, chitosan, polysaccharides), synthetic polymers (e.g., poly(N-isopropyl acrylamide)s, poly (2-hydroxyethyl methacrylate), poly(ethylenimine)s), and biodegradable, bioabsorbable, and dendritic polymers [
8]. Ethocel ethyl cellulose polymers are colorless, odorless, tasteless, and non-caloric. Ethocel dissolves in various solvents, such as natural oils, chlorinated solvents, and aliphatic alcohols. It is practically insoluble in water, propylene glycol, and glycerin. These multifunctional, water-insoluble, and organosoluble polymers are used in various pharmaceutical and specialty uses. They function as binders, tougheners, maskers, time-release agents, flexible film formers, rheology modifiers, and water barriers. In Ethocel grade 10, there are Ethocel 10 premium (average particle size 375 µm) and Ethocel 10 FP premium (average particle size 6.4 µm) [
9]. Previously, different studies were reported using different polymers to prepare their drug matrices. Sustained-release matrices of losartan potassium were prepared using the polymers Eudragit RLPO, Eudragit RSPO, and ethyl cellulose, and they found extended release of the drug ethyl cellulose when used in combination with polymers used alone [
10]. Sustained-release matrices of losartan potassium were prepared with xanthan gum, HPMC, and ethyl cellulose and evaluated for in vitro drug release [
11]. Ethocel grade 100 alone was used to prepare the losartan potassium matrices [
12], and Ethocel 7 combined with Carbopol 934 was used as a rate-retarding polymer [
13]. The polymer Ethocel grade 10 combined with Carbopol was used to prepare controlled-release matrices [
14]. Sustained-release matrices of losartan potassium were formulated using hydroxymethyl propyl cellulose (HPMC) K100M and xanthan gum in combination with a direct compression technique [
15]. Controlled-release matrices of losartan potassium were prepared with different polymers: acacia gum, copal gum, hydroxypropyl methylcellulose K100 (HPMC K100), carboxy methyl ethyl cellulose (CMEC), and Eudragit RL 100, alone and in combination [
16]. The current study used Ethocel grade 10 (Ethocel 10 premium and Ethocel 10 FP premium) polymers, which were used alone to produce controlled-release losartan potassium matrices and to check the effects of their particle size on drug release rates.
The co-processed excipients or co-excipients are blends of two or more compendial or non-compendial excipients developed to physically modify their properties in a manner that is not attainable by simple physical mixing and without a significant chemical change. They help to overcome deficits arising with the use of single general-grade excipients. The co-excipients have higher functionalities than the individual excipients, like better flow properties, reduced lubricant sensitivity, and compressibility [
17]. Hydroxypropyl methylcellulose (HPMC) is a white or milky white, tasteless, odorless, fibrous powder or granule with a weight loss on drying that does not exceed 10%, soluble in cold but not hot water, swelling slowly in hot water, and forming a viscous colloidal solution, which becomes a solution when cooled and becomes a gel when heated. It is soluble in a mixed solvent of methanol and methyl chloride [
18]. Carboxymethylcellulose is a white, creamy powder that is tasteless and odorless. It is a linear, non-toxic, anionic, long-chain, and inexpensive water-soluble anionic polysaccharide with good film-forming ability. Starch is commonly used in different oral controlled-release systems in the pharmaceutical industry since it is a non-toxic, cheap, and biocompatible co-excipient [
19]. In the current study, along with the drug and excipients, co-excipients such as carboxymethylcellulose (CMC), hydroxypropyl methylcellulose (HPMC), and starch were used (10% of the filler) to check their effects on drug release rates.
Losartan potassium, a non-peptide molecule, is chemically termed 2-butyl-4-chloro-1-[p-(o-1H-tetrazol-5-ylphenyl)benzyl]imidazole-5-methanol monopotassium salt. Its empirical formula is C
22H
22ClKN
6O. It is a white–off-white crystalline powder whose melting point ranges from 263 to 265 °C. It is also freely soluble in water. The molecular mass of losartan potassium is 462.01. It belongs to Class III of the Biopharmaceutical Classification System (BCS) [
20]. Losartan potassium is an oral angiotensin-II antagonist used to treat high blood pressure, primarily by blocking the AT1 receptor. It is a highly favored antihypertensive drug and prescription drug. Although the drug is highly soluble in water, its oral bioavailability is just 33%. This results from its inadequate absorption from the lower gastrointestinal tract and a 1.5–2.5 h plasma elimination half-life. Losartan potassium has short half-lives, so it would be preferable to administer it in controlled-release matrices and less frequently to keep the drug’s plasma levels stable for at least 18 to 26 h [
21]. In the current study, losartan potassium, due to its short half-life (1.5–2.5 h) and regular dosing frequency, was added to controlled-release matrices using Ethocel grade 10 polymers to extend its half-life to 24 h, both in vitro and in vivo.
In previous studies, losartan potassium controlled-release systems, including matrices, have been evaluated in vitro and in vivo in attempts to extend the drug release rates. Sustained-release matrix pellets containing solid dispersions of losartan potassium were prepared using a hydrophilic polymer, PEG 6000, and mixed with Avicel
® PH 101. The optimized sustained-release pellets had a Tmax of 9.72 ± 2.22 h, compared to 2.11 ± 0.49 h in the case of the Cozaar
® immediate-release tablets, indicating a slower release of the drug from the pellets [
22]. Bhanja et al. prepared and assessed mouth-dissolving/disintegrating tablets (MDTs) of losartan potassium to improve the dissolution rate and enhance the bioavailability. They found that the water absorption ratio, the wetting time, and the in vitro and in vivo disintegration times of B8 were 86.1%, 8 s, 18 s, and 25 s, respectively. The B8 released up to 99.21% in 2 min and was considered the best formulation [
23].
Losartan potassium floating matrices were prepared using the direct compression method, with locust bean gum and HPMC K15M as polymers and sodium bicarbonate as a floating agent. The influence of the nature of the polymers was checked by preparing different formulations of matrices, and the drug amount (100 mg) was kept constant in the matrices. They found that matrices LPFT1 to LPFT9 sustained the drug release profiles, and the matrix LPFT4 sustained the drug release profile for 24 h, noting super case II transport diffusion drug release kinetics [
24]. It was reported that the floating matrices of losartan potassium were formulated using different amounts of hydroxypropyl methylcellulose (HPMC-K4M) and karaya gum. The matrices were evaluated for various pre-compression and post-compression tests, in vitro drug release, and in vivo X-ray imaging in rabbits. Gastric X-ray imaging of formulation F9 (drug/HPMC-K4M/karaya gum/microcrystalline cellulose/sodium bicarbonate/magnesium stearate/lactose) revealed that the matrix was constantly floating in the rabbit’s stomach; therefore, it could extend the gastric retention time to more than 12 h [
25]. It was reported in a study that sustained-release matrices of losartan potassium using natural polymers were developed by direct compression. The addition of natural polymers (xanthan and guar gum) to the matrix affected the release rate of the drug. In vitro release showed that the release rate decreased with an increased polymer ratio. The matrix SL1 released 76.08% of the drug in 12 h. The release mechanisms were determined using various kinetics models, and they noted that the drug was released by zero-order kinetics and followed super case II transport [
26]. In different amounts, losartan potassium sustained-release matrices were developed by wet granulation using the hydrophilic polymer HPMC and natural polymers such as xanthan gum and guar gum. The hardness, weight uniformity, friability assay, and in vitro drug release were tested for the physiochemical uniformity of the matrices using both official and unofficial USP tests. The matrices showed optimal hardness, consistent weight uniformity, friability, assay, and extended drug rates for 10 h, and their drug release was no less than 70%. They concluded that the in vitro dissolution indicated that the matrices (F2, F3, F4, F5, and F8) had drug release profiles close to the theoretical release profile [
27].
This work aimed to develop 200 mg controlled-release matrices of losartan potassium (100 mg) using the polymer Ethocel grade 10 (30 to 50 mg at drug-to-polymer ratios of 10:3, 10:4, and 10:5) as a rate-controlling agent, filler (44.1 to 69 mg), and lubricant (0.5%). These matrices were evaluated for physicochemical characteristics (thickness, diameter, friability, hardness, weight variation, assay, and in vitro dissolution) to achieve 24 h drug release rates, determine pharmacokinetic parameters (half-life, Tmax, Cmax, AUCo, AUCo-inf, MRT0–48h, and Cl), and establish the optimized matrices’ correlation in vitro and in vivo.
4. Discussion
The controlled-release matrices were formulated with the Ethocel grade 10 polymers (Ethocel 10 premium and Ethocel 10FP premium), along with excipients, and they were physically mixed to achieve formulation mixtures. The formulation mixtures’ flow properties (angle of repose, Carr index, and Hausner ratio) were tested using the USP. All of the formulated physical mixtures showed good-to-excellent flow properties (angle of repose 28.12 ± 0.36 to 33.98 ± 0.69, Carr compressibility index 9.56 ± 0.50 to 14.73 ± 0.38, and Hausner ratio 1.07 ± 0.48 to 1.16 ± 0.18), which were found within the USP flow range [
28]. The flow properties of the formulated physical mixture of Ethocel 10FP (10:5) with HPMC (angle of repose 28.12 ± 0.36, Carr compressibility index 9.56 ± 0.50, and Hausner ratio 1.07 ± 0.48) were significantly higher (
p < 0.05) than the flow properties of the remaining formulation mixtures. The formulated physical mixtures showed good-to-excellent flow properties, which might have been due to the proper mixing of the ingredients, and they might have good flow during the compression process due to the addition of the lubricants. Khandai et al. developed carbo-protein polymeric-complex-based sustained-release microspheres of losartan potassium and determined the capacity of the formulation to improve the flowability, compressibility, and tableting properties of losartan potassium; the carbo-protein-based polymeric microspheres helped to sustain the drug release for a prolonged time and increase the flowability, compressibility, and tableting properties of losartan potassium [
53]. The current study’s results are also similar to those observed by Vidyadhara et al., who found that the angle-of-repose values for different microcapsules were in the range of 21.6–23.85°, showing the good flow properties of microcapsules. The microcapsule compressibility index was 11.25–15.85%, showing good microcapsule flow properties [
54].
The drug (API) and a formulation mixture (Ethocel-10FP-based, at a 10:4 ratio) were subjected to DSC and FTIR analyses to identify any possible drug–excipient interactions, and slight variation was noted in the melting points of the drug (274.5 ± 0.18 °C) and the formulation mixture (273.3 ± 0.24 °C), indicating a negligible change in the melting points and that they might be compatible. These results of the DSC study confirmed the findings of Vidyadhara et al., who reported a lack of drug–polymer interaction in the DSC studies of the drug (API) and formulation mixtures [
54]. The FTIR analysis showed that the same functional groups (OH, C–H aliphatic stretching, C=N stretching, and C=C stretching) were found for the drug (API) and the formulation mixture (Ethocel-10FP-based, at a 10:4 ratio), with slight variations in wave numbers, which might indicate that they were compatible. These results (FTIR) confirm other authors’ findings that no possible interaction was found between the drug and excipients in FTIR studies, while compatibility was observed due to the main functional groups (OH, C–H, and C=N) being intact for the pure drug and the formulation powders [
55].
The matrices were subjected to physical quality control tests (thickness, diameter, friability, hardness, and weight determined for the matrices). The thickness of the matrices ranged from 2.4 ± 0.10 to 2.5 ± 0.43, the diameter of the matrices ranged from 8.0 ± 0.09 to 8.0 ± 0.51, the friability ranged from 0.05 ± 0.07 to 0.25 ± 0.11, the hardness ranged from 7.8 ± 0.51 to 9.5 ± 0.37, and the weight of the matrices ranged from 198 ± 0.14 to 203 ± 0.19, all of which were within the USP limits (thickness: 2–4 mm, diameter: 4–13 mm, hardness: 5–10 kg/cm
2, friability: <0.1%, weight: 130 to 324 mg with 7.5% variation) for the tablets’ physical tests, and this might have been because the compression process was handled carefully. These results were similar to those of the authors [
25], who also found the physical characteristics of their tablets to be within an acceptable range due to proper handling during the tableting process.
The drug assay was performed for the matrices, the results of which ranged from 98.67 to 99.25% and were within the USP compendial limits (90–110%) [
55]. This might have been due to the proper mixing and blending of the formulation ingredients, and the drug contents might have been uniformly distributed in the matrices. Masood et al. also reported that the drug in a controlled-release hydrogel was within the compendial limits (90–110%), which could have been due to the uniform distribution of the drug in the hydrogels [
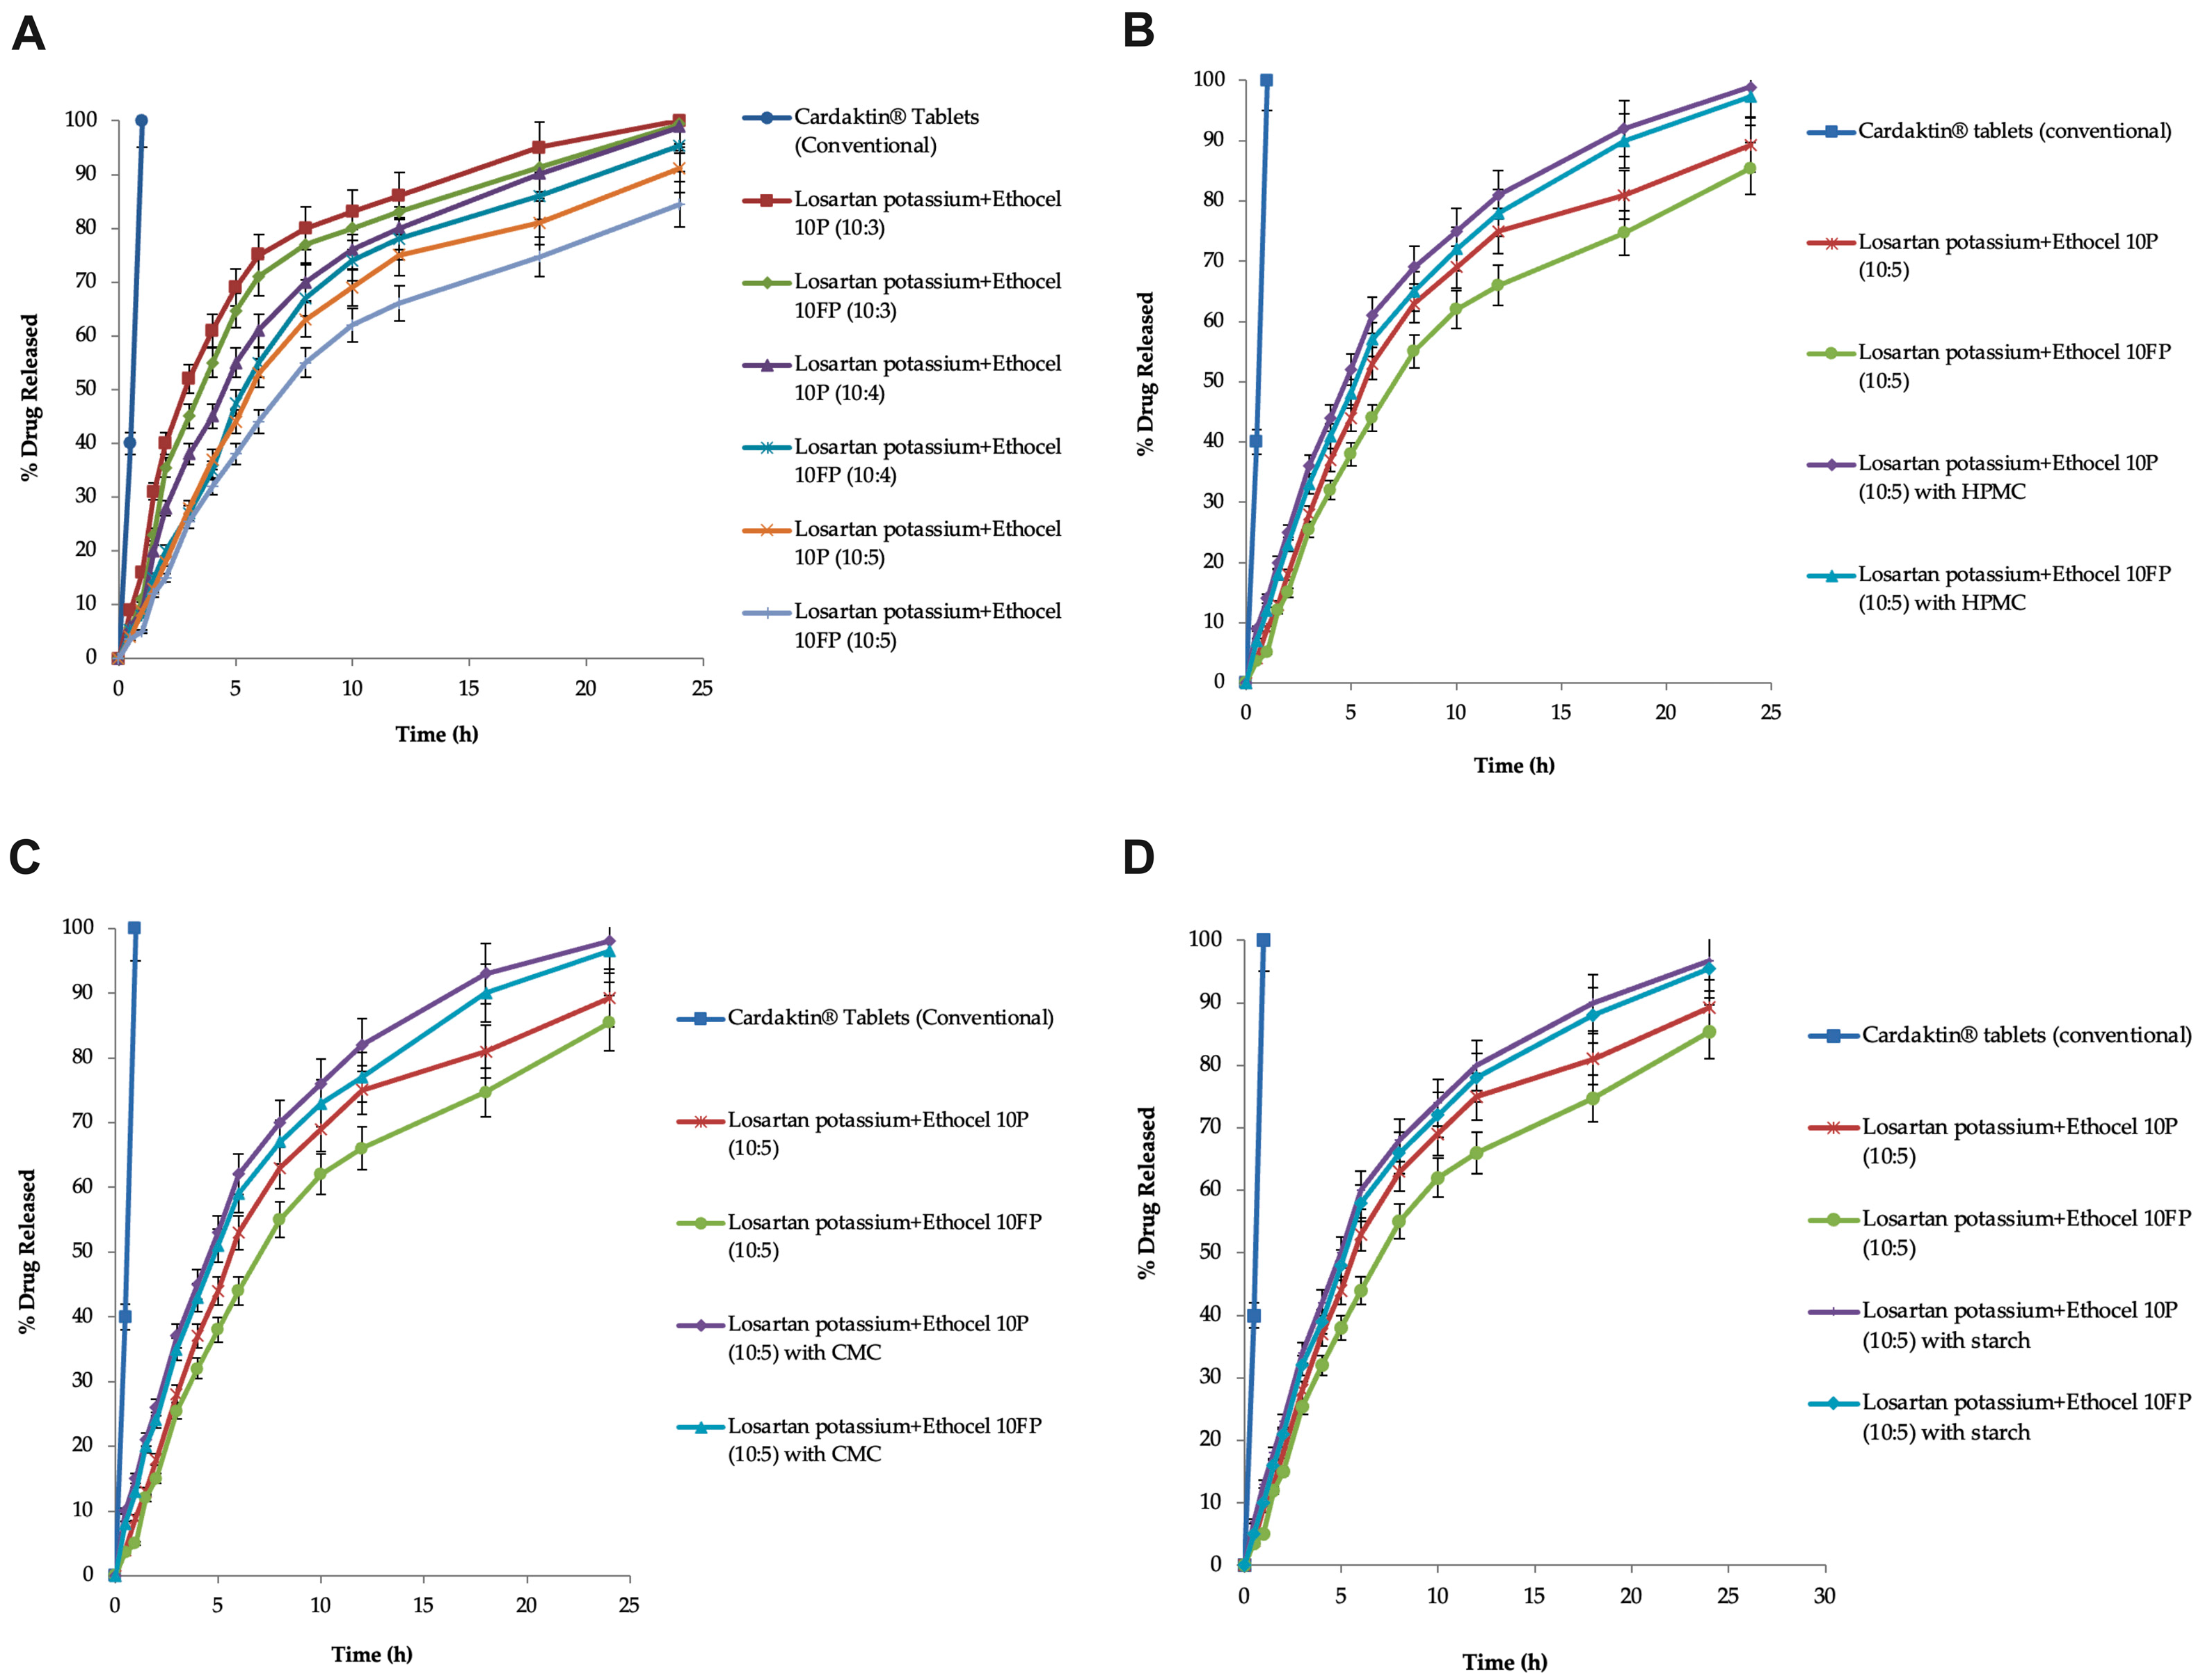
56]. The matrices were investigated for drug release for 24 h; it was found that the drug release was extended by 24 h. The controlled-release matrices with grade 10 Ethocel (Ethocel 10 premium and Ethocel 10FP premium) at D:P ratios of 10:3, 10:4, and 10:5 released 100, 99.34, 98.88, 95.32, 91.14, and 84.39% of the drug in 24 h, respectively. It was noted that as all of the matrices increased the polymer concentration at different D:P ratios, the drug release rates were also extended, and this might have been due to the increased polymer concentration providing more hindrance to penetration of the dissolution medium and, as a result, extending the drug release rates. Previously, Dash and Verma developed a losartan potassium polymeric matrix sustained-release tablet to extend the drug release up to a time of 24 h at a determined rate, and the in vitro dissolution profile for batch B4 was designed with a blend of HPMC K4M (67.2 mg), HPMC K200M (90 mg), and Eudragit RSPO (112.5 mg), where the drug release was about 94–98% [
57]. Wani et al. evaluated polymers HPMC K4M/ethyl cellulose-based expandable film (an oral sustained-release dosage form) loaded with losartan potassium, appropriate for extended gastric retention time and extended drug release over 12 h, which could be due to the HPMC K4M polymer’s swelling, diffusion, and erosion, along with the ethyl cellulose’s reduced water penetration, which might have caused drug release retardation [
58]. The authors Chithaluru et al. used the USP XXII dissolution apparatus for in vitro drug release experiments, indicating that the formulation (losartan potassium with sodium CMC and ethyl cellulose) produced a sustained effect, with 74.19% release, and due to diffusion along with erosion of the drug from the polymers’ swelling [
24]. These results confirmed the findings of other authors, such as Jan et al., who also observed retardation of drug release rates with increasing polymer concentrations when studying the effect of polymer concentration on the drug release rates of ibuprofen [
59]. The effects of the co-excipients (HPMC, CMC, and starch) on the drug release rates were checked, and they enhanced the drug release rates. In matrices with Ethocel 10 premium and 10FP premium, HPMC enhanced the drug release rates to 98.91 and 97.38%, respectively. The matrices with Ethocel 10 premium and Ethocel 10FP premium at a D:P ratio of 10:5 with starch as a co-excipient enhanced the drug release rates to 96.66 and 95.49%, respectively, in 24 h. In matrices with Ethocel 10 premium and 10FP premium with CMC, the drug release rates were enhanced to 96.55 and 98%, respectively. This might have been due to swelling of the co-excipients (HPMC, CMC, and starch), which might have caused an increase in internal osmotic pressure in the matrices, enhancing the drug release rates. Another possible reason might be the disintegrating behaviors of the co-excipients when used in small amounts (i.e., 10% of filler). Khan and Meidan (2007) [
60] checked the effects of co-excipients on the drug release and found that the co-excipients enhanced the drug release rate, possibly due to swelling of CMC when exposed to water, along with the internal osmotic pressure, which was enhanced by the burst release of the drug. Their findings were similar to the results of the current study. Jan et al. (2012) observed a similar burst release of the drug for ibuprofen controlled-release matrices when co-excipients were added to enhance the drug release rates [
59]. The influence of numerous co-excipients on ibuprofen–Ethocel controlled-release matrices with a D: P ratio of 10:3 was checked to increase the drug release rates. They found that the co-excipients increased the drug release rates, which could have been due to swelling, rupture of the polymer, and increased osmotic pressure in the matrices, similar to the current results. Drug release rate enhancement by co-excipients (HMPC, CMC, and starch) was also observed by Akhlaq et al. (2011) [
61], who added co-excipients in small amounts to ibuprofen–Eudragit-S-100-based matrices and found disintegration, swelling, and increasing osmotic pressure inside the matrices containing the co-excipients, which conformed to the present results. The drug was released by the matrices through Fickian diffusion, erosion/swelling (Hixson–Crowell model r
2 values: 0.891 to 0.986), and anomalous non-Fickian diffusion (power-law model n-values: 0.523 to 0.986), but not by first-order kinetics (first-order r
2 values: 0.216 to 0.478).
The matrices with Ethocel 10 FP showed more pseudo-zero-order kinetics (power-law model n-value: 0.986) than the remaining matrices (0.523 to 0.858). This might have been due to the hydrophobic nature of the Ethocel grade 10 polymers, which might reduce the penetration of the dissolution medium and retard the drug release rates in a controlled manner rather than burst drug release. The other release mechanisms might have been due to swelling of the polymeric matrices, diffusion of drugs from the swelling matrices, and erosion of the matrix. These current results are similar to those of Wahab et al. [
62], who observed that ketoprofen polymeric controlled-release tablets released the drug with anomalous non-Fickian diffusion, swelling, and erosion mechanisms, and their power-law model’s n-values were 0.596 and 0.784, indicating a concentration-independent release of the drug. Ain et al. applied kinetics models to the in vitro release data of the formulation, and it was found that formulation F13 exhibited zero-order release kinetics (n-values: 0.9242–0.9421) due to matrix erosion and swelling [
63]. Thus, their drug release from the prepared tablets was controlled by more than one mechanism, i.e., polymer swelling followed by drug diffusion from the swelled polymer and the tablets’ gradual erosion, and these findings conformed to the current results.
The test matrices based on Ethocel grade 10 (D:P 10:5) with no co-excipient or without the co-excipients’ dissolution patterns, when compared with the reference standard dissolution profiles, resulted in f
1 values that ranged from 35.73 to 58.22, indicating that the test matrices’ dissolution patterns were not comparable with the reference tablets’ dissolution profiles because these results were not found to have acceptable ranges or limits for f
1 (1–15). This might have been because the test matrices contained polymers that extended the drug release rates (24 h), but the reference tablets were immediate-release tablets, and burst release of the drug occurred, which might have led to differences in their dissolution patterns. Hossain et al. determined the difference factor (f
1) of all the formulations (F-1 to F-5) to compare their dissolution profiles with that of the innovator brand, and the f
1 values ranged from 1.76 to 40.22. Formulation F-3′s f
1 value was 1.76, which showed that the dissolution profiles of F-3 and the innovator brand were different, and their results contradict the current finding of f
1 (35.73 to 58.22) [
64]. Ghosh and Barik compared the dissolution profile of the aceclofenac sustained-release formulation with that of the Aroff 200 mg SR tablets by applying f
1, and the f
1 value was 2.44, which is within the acceptable range of f
1, contradicting the current study’s results for f1 (35.73 to 58.22) [
65].
The physicochemical characteristics of the selected matrices were found to be stable when exposed to accelerated stability conditions (at 40 ± 2 °C and relative humidity of 75 ± 5%) for 6 months, and no significant (
p < 0.05) differences were noted in their physicochemical characteristics. The optimized formulation was exposed to stability conditions as per the ICH guidelines at 25 ± 2 °C and 60 ± 5% relative humidity, as well as accelerated stability conditions (40 ± 2 °C and 75 ± 5% relative humidity). Viveksarathi et al. found that the optimized tablets did not show any significant variation (
p < 0.05) in average weight, hardness, drug release, or drug content in any of the tablets before and after the stability studies, similar to the results of the current stability study [
66].
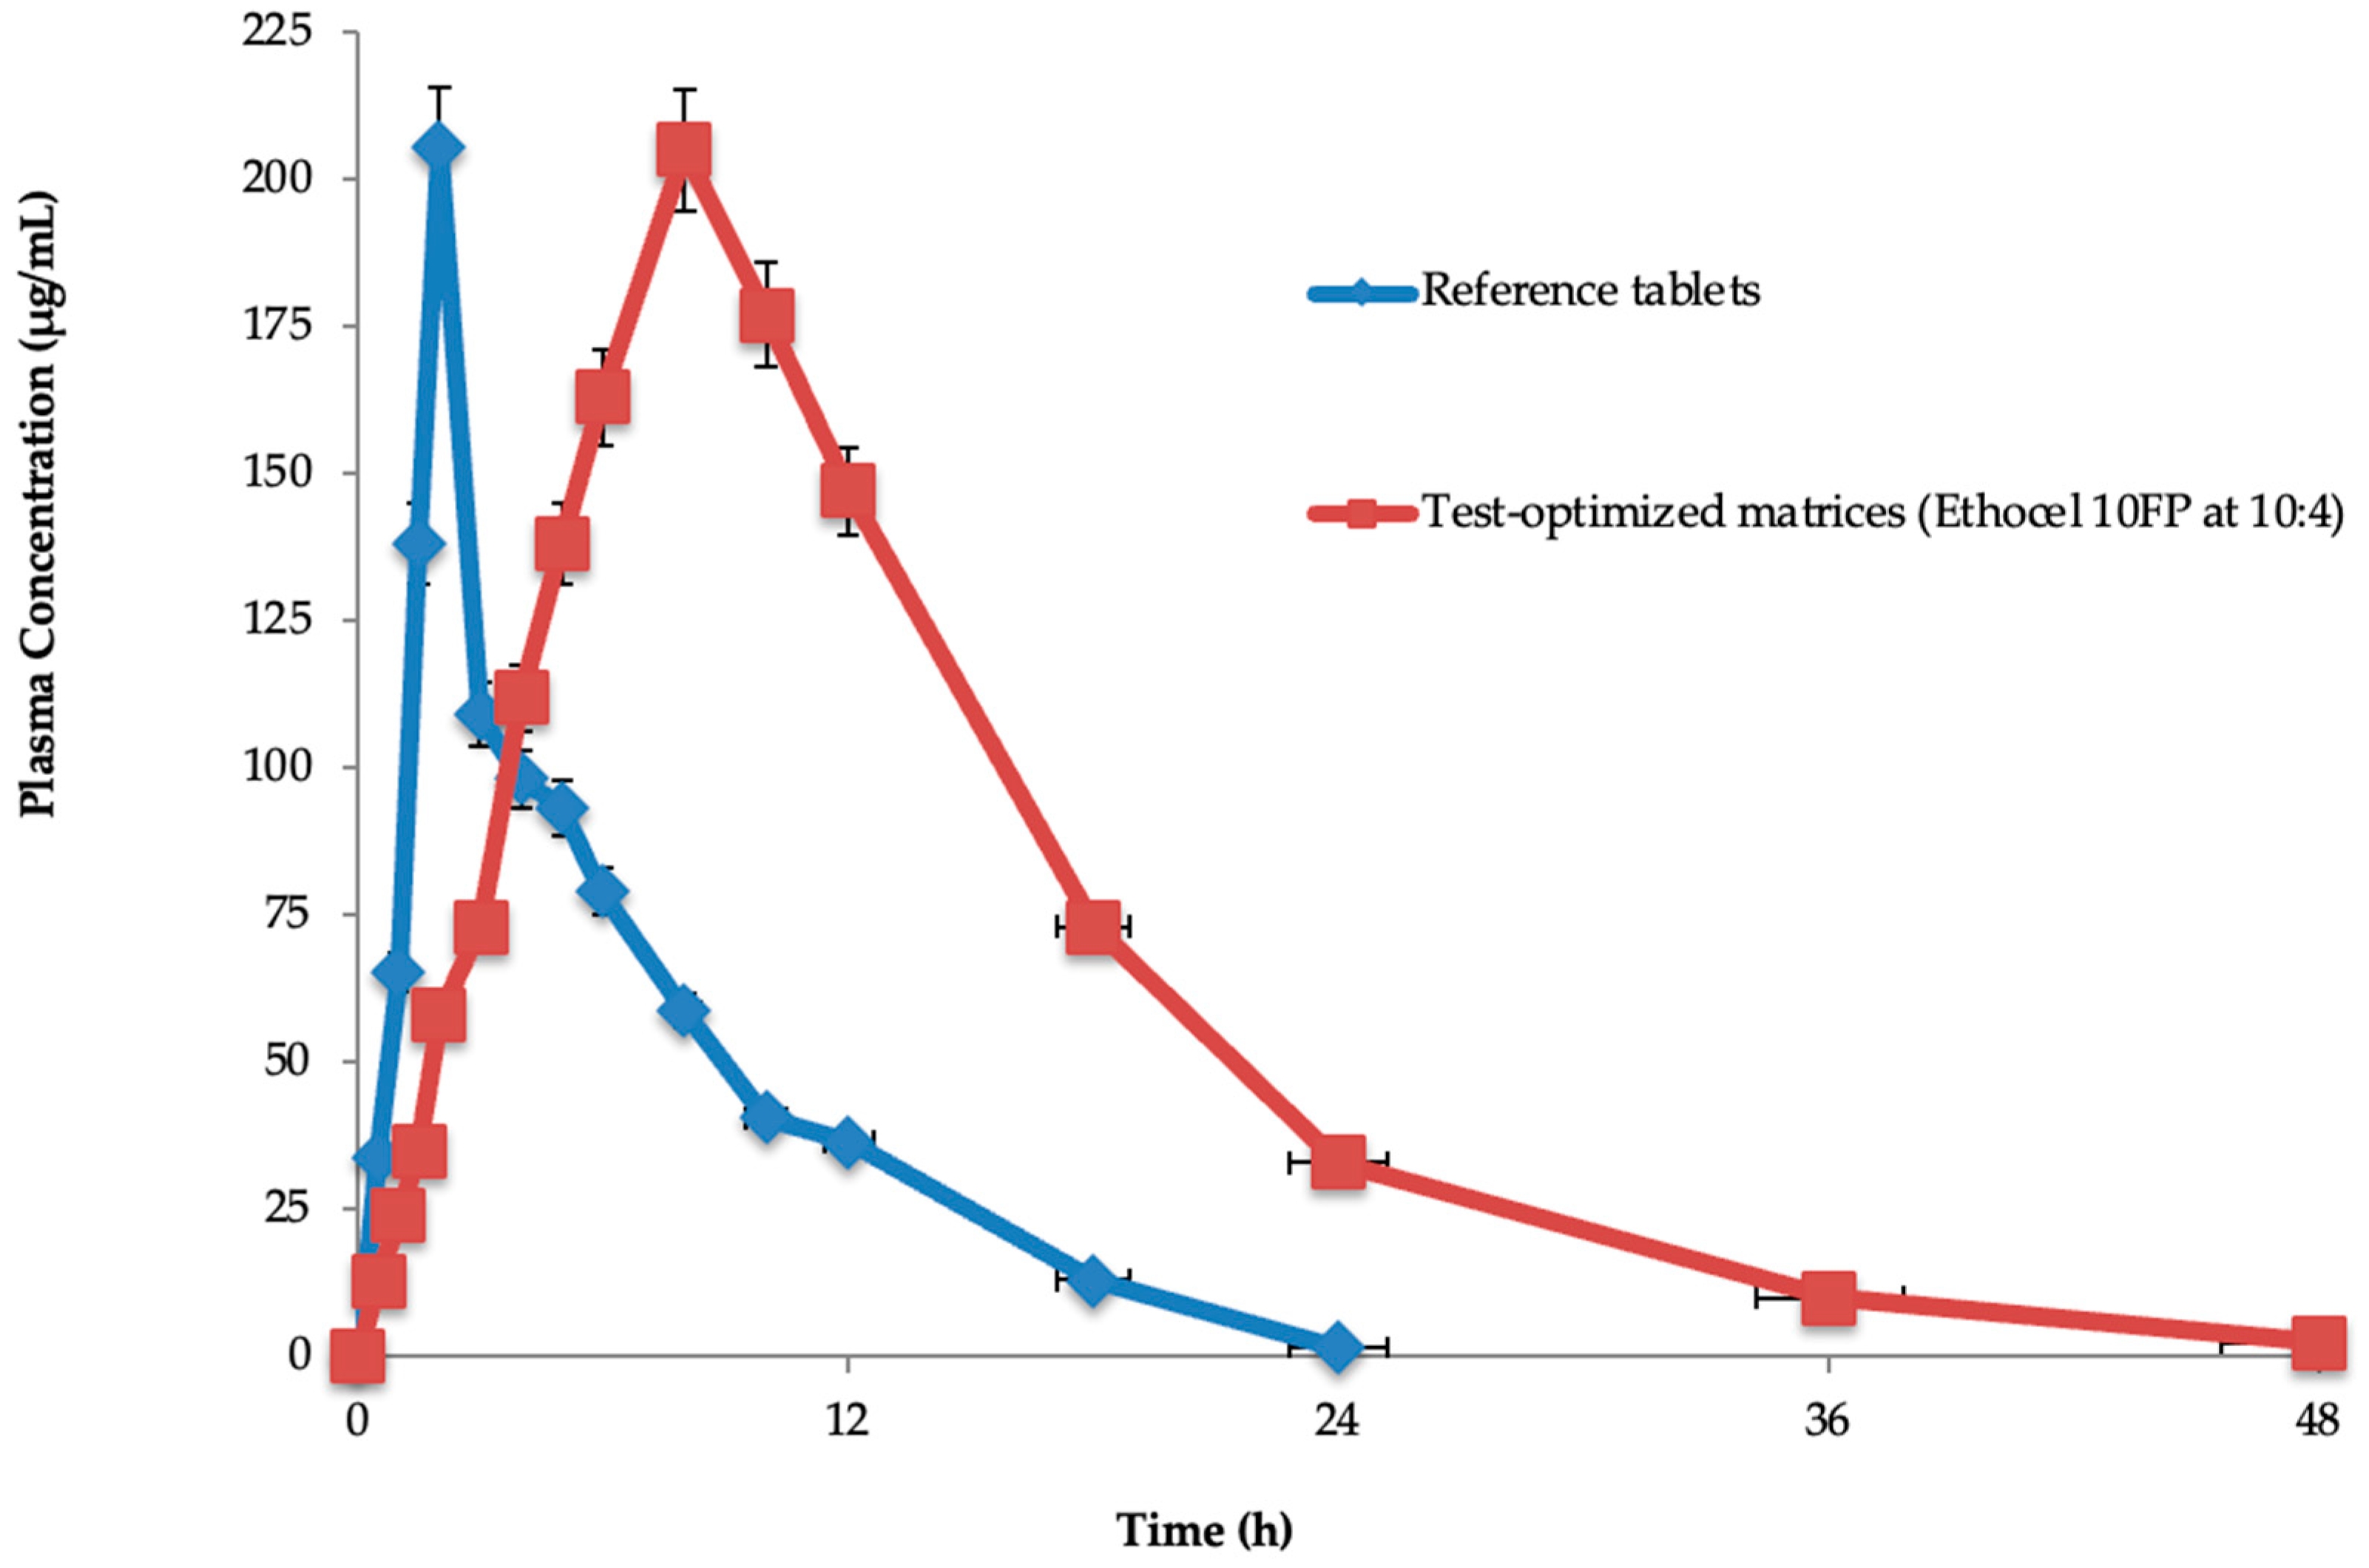
The half-life (11.78 ± 0.018 h), T
max (2.105 ± 1.131 h), C
max (205.98 ± 0.321 μg/mL), AUC
0 (5931.10 ± 1.232 μg·h/mL), AUC
0-inf (7348.46 ± 0.234 μg·h/mL), MRT
0–48h (17.34 ± 0.184 h), and Cl (0.002 ± 0.134 mL/min) were found for the test-optimized matrices. The reference tablets’ half-life (2.0 ± 0.125 h), T
max (8.0 ± 0.091 h), C
max (205.98 ± 0.321 μg/mL), AUC
0 (2534.12 ± 2.29 μg·h/mL), AUC
0-inf (6415.32 ± 0.012 μg·h/mL), MRT
0–48h (9.98 ± 2.169 h), and Cl (0.005 ± 0.128 mL/min) were also found. In the test-optimized matrices, polymeric materials were present, which significantly (
p < 0.05) extended the drug’s half-life (11.78 ± 0.018 h) compared to the reference tablets (2.0 ± 0.125 h), while the other parameters were insignificantly similar. This might have been because the polymers extended the in vivo drug release from the optimized matrices. Rahamathulla et al. evaluated pure losartan potassium and an optimized formulation (F3), and the C
max after oral administration was 298.4 ± 12.45 ng mL
−1 for pure losartan potassium and 148.4 ± 15.86 ng mL
−1 for F3 [
67]. The T
max for pure losartan potassium was 1.5 h, and for F3 it was 4.1 h. The obtained AUC
0–24 values were 928.12 ± 51.67 and 1382.40 ± 112.23 ng mL
−1 for the pure drug and F3, respectively. The MRT was increased from 4.223 ± 0.07 h for an oral solution to 18.92 ± 0.21 h with the sustained-release floating matrix tablet formulations. Their statistical analysis by
t-test indicated that the pure losartan potassium and the optimized formulations differed significantly (
p < 0.05), and their results contradict the current study’s findings of pharmacokinetic parameters, except for half-life. Chen et al. prepared and evaluated a losartan potassium and verapamil hydrochloride compound transdermal drug delivery system (TDDS) [
68]. Pharmacokinetic analysis indicated that the AUC
0–t, and MRT values determined for the patches were significantly better than those achieved after oral administration. Moreover, the plasma concentrations of losartan potassium and verapamil hydrochloride remained above 2 μg/mL for 24 h, which is an effective therapeutic amount. The AUC
0–t ratios relating to the TDDS of losartan potassium–verapamil hydrochloride and oral administration were evaluated, and it was noted that the TDDS’s bioavailability reached 338.51%, which was higher than that of the orally administered dosage form, and their results contradict the current study’s results on pharmacokinetic parameters (AUC
0–t, MRT, and AUC
0–t). Selvadurai et al. statistically compared the pharmacokinetic parameters of two different drug formulations of losartan potassium, which resulted in significantly different results, contradicting the current findings on C
max, AUC
0–t, and AUC
o–∞ [
50].
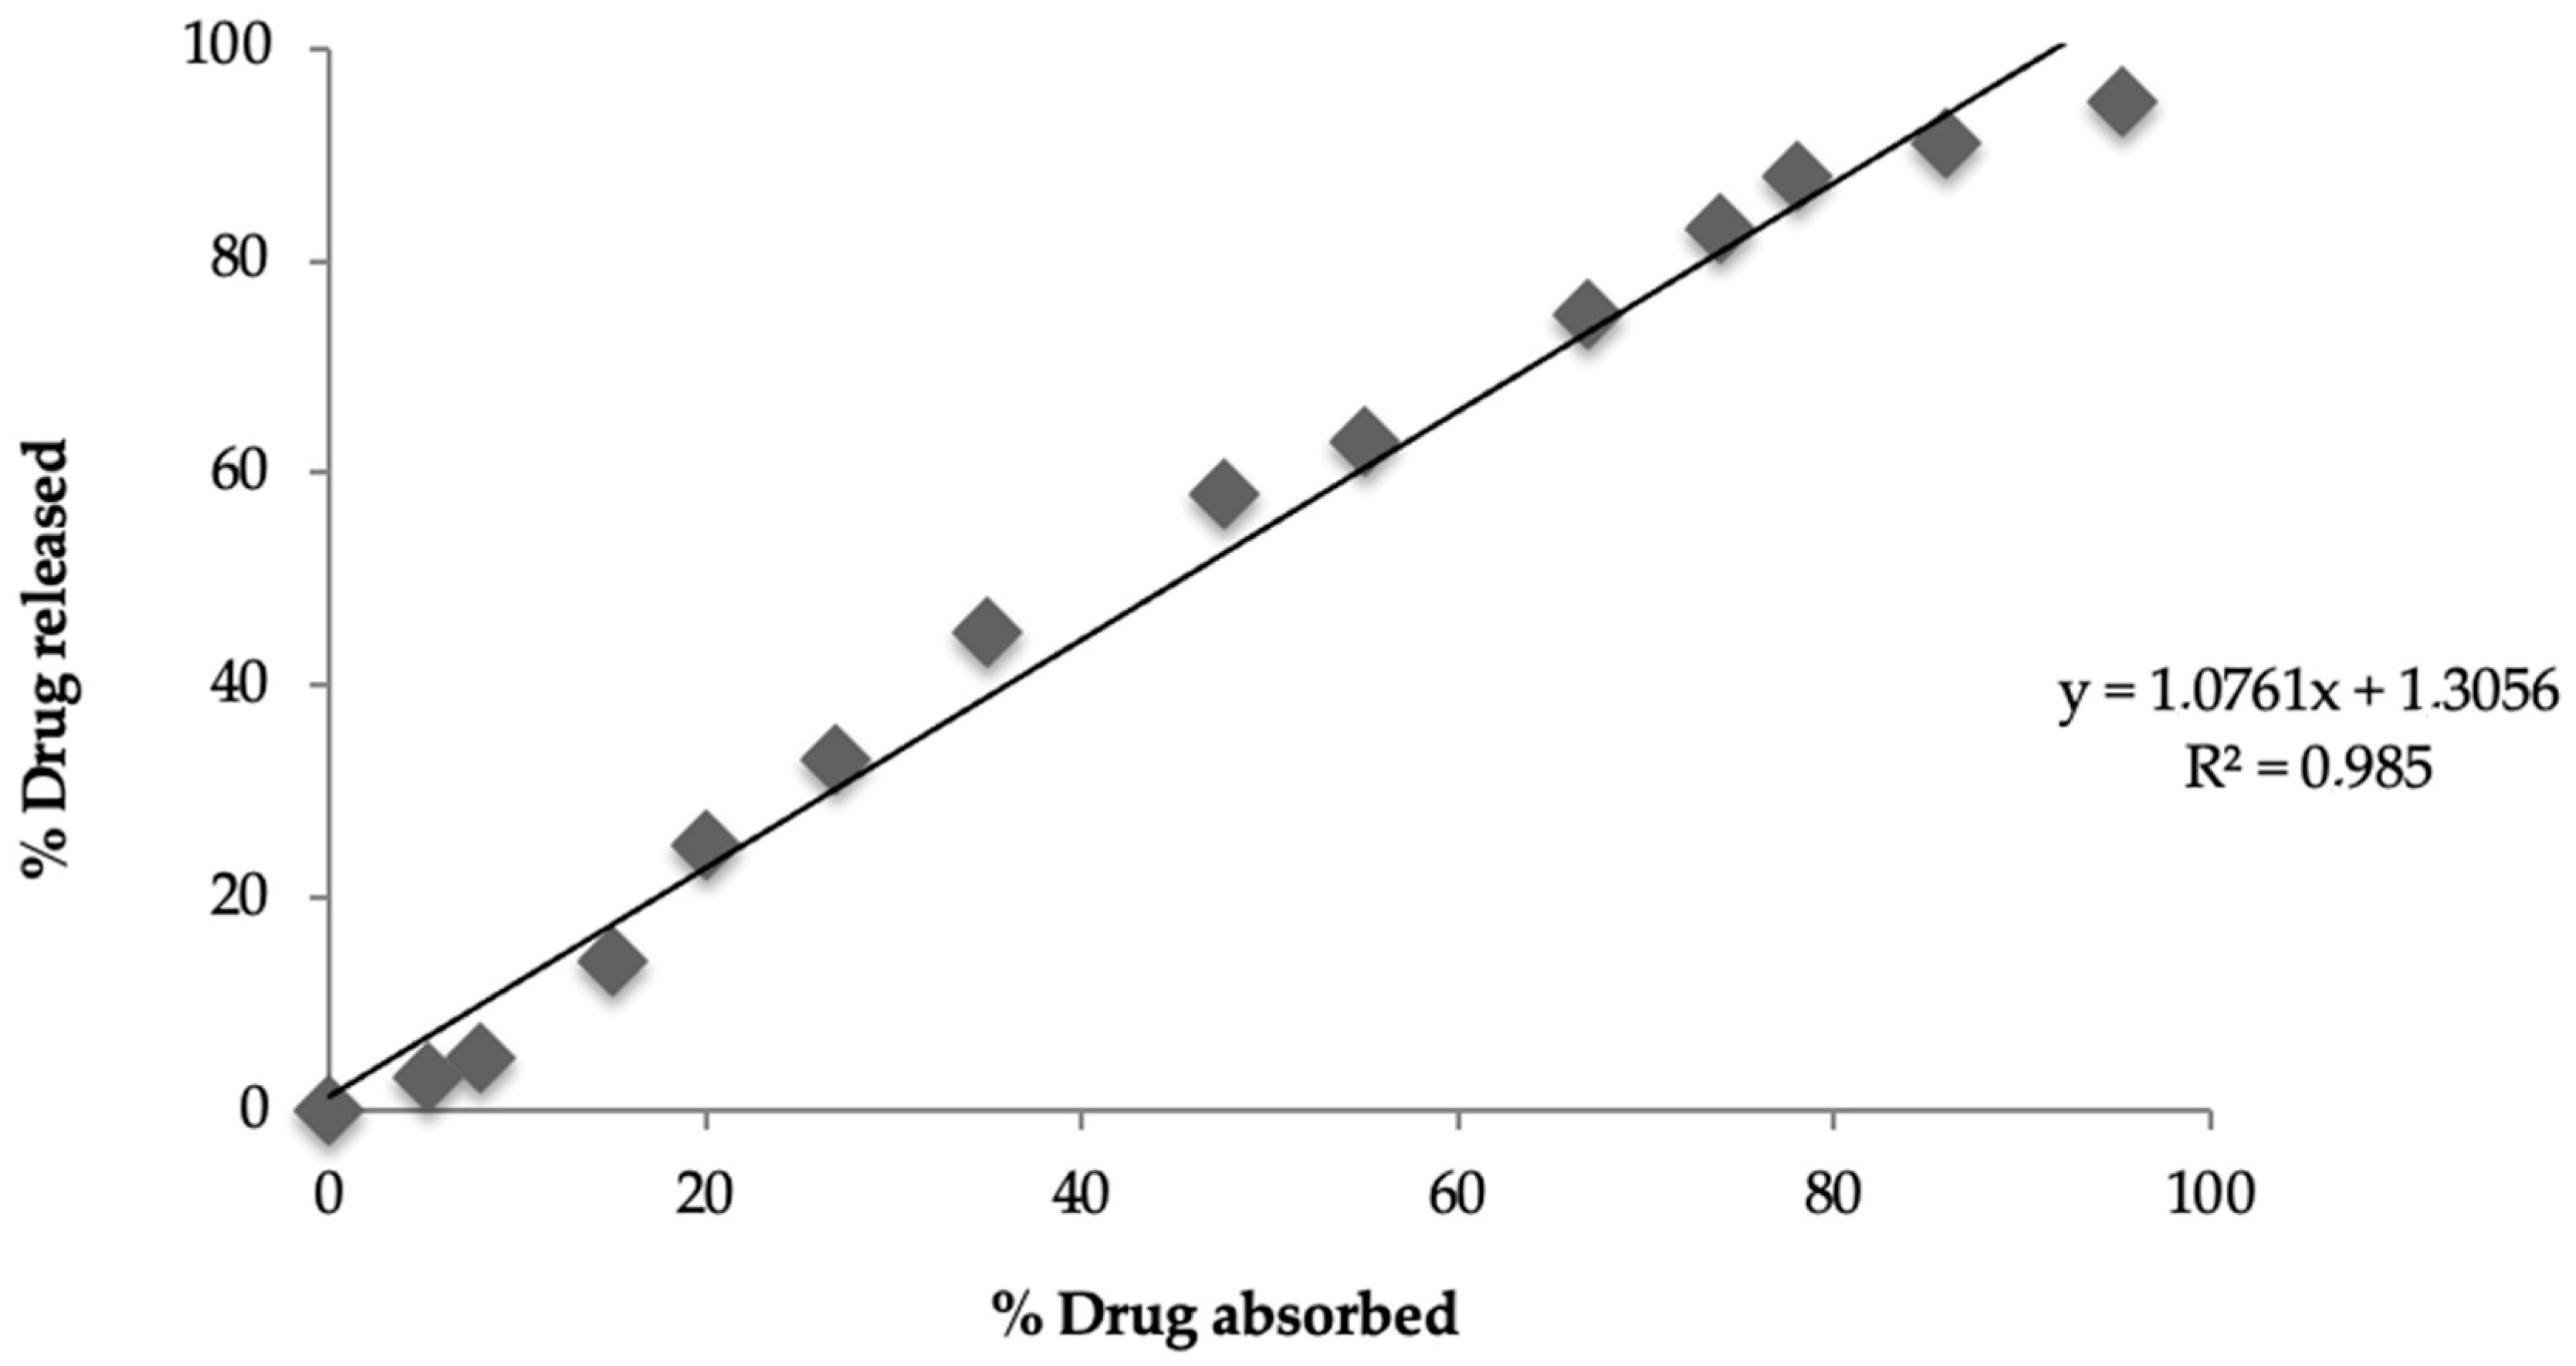
A correlation was established between in vitro drug release (24 h) and in vivo drug absorption (24 h) for the test-optimized matrices, and the resultant r
2 value was 0.985, indicating a level-A correlation between the percentage drug release in vitro (95.32%) and the percentage drug absorption (95%) in vivo. The current in vivo study was conducted in albino rabbits; however, it cannot be ruled out that human physiology might affect drug absorption and IVIVC. Qin et al. attempted to find the relationship between plasma concentration and drug release from selected pregabalin tablets, and they found a good in vivo–in vitro correlation (R
2 = 0.97 in fed conditions), showing that the in vivo response can be predicted by in vitro drug release, and their results for IVIVC are consistent with those of the current study [
69].


 ,
, 


