
Assessing Trans-Inhibition of OATP1B1 and OATP1B3 by Calcineurin and/or PPIase Inhibitors and Global Identification of OATP1B1/3-Associated Proteins
 ,
,  and
and
Abstract
:1. Introduction
2. Materials and Methods
2.1. Materials
2.2. Cell Culture and Transfection
2.3. Human Sandwich-Cultured Hepatocytes (SCH)
2.4. Purification of FLAG-OATP1B1 and FLAG-OATP1B3 by Immunoprecipitation and Immunoblot
2.5. Time-Lapse Confocal Fluorescence Microscopy
2.6. Qualitative Proteomics
2.7. Uptake Studies and IC50 Determination
2.8. Data Analysis
3. Results
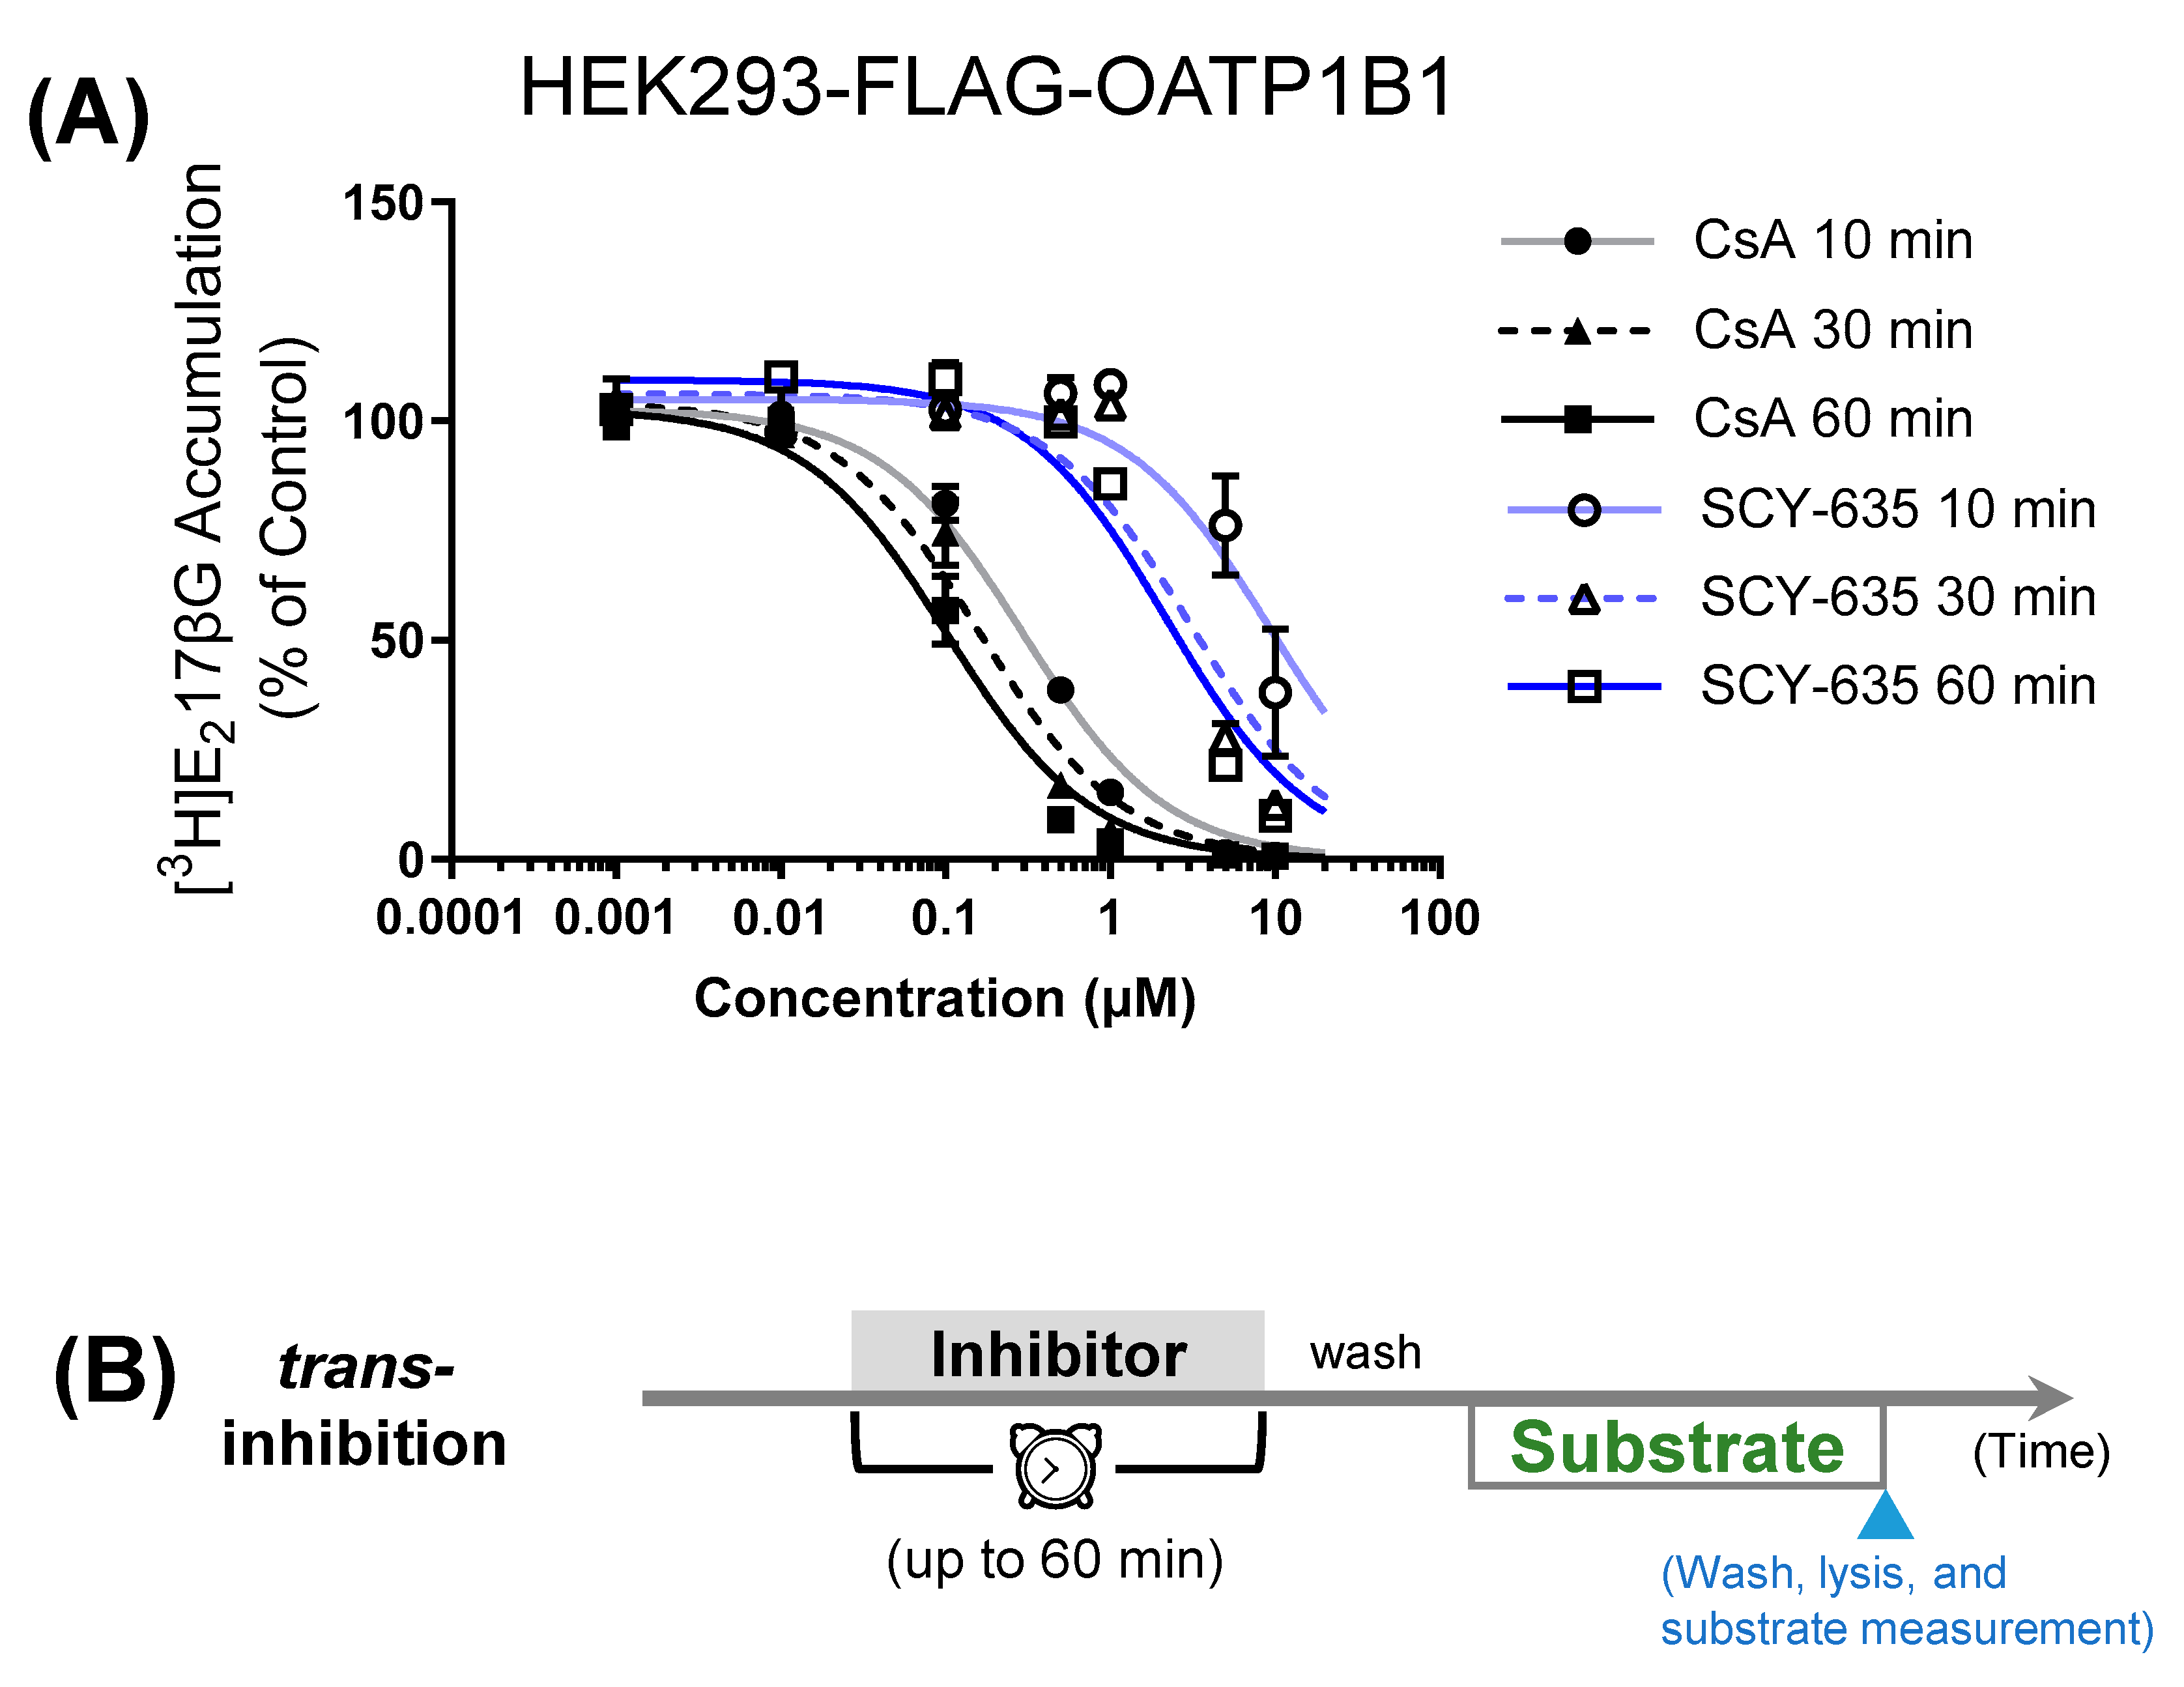
3.1. Comparison of Preincubation Effects of SCY-635 and CsA on OATP1B1-Mediated Transport
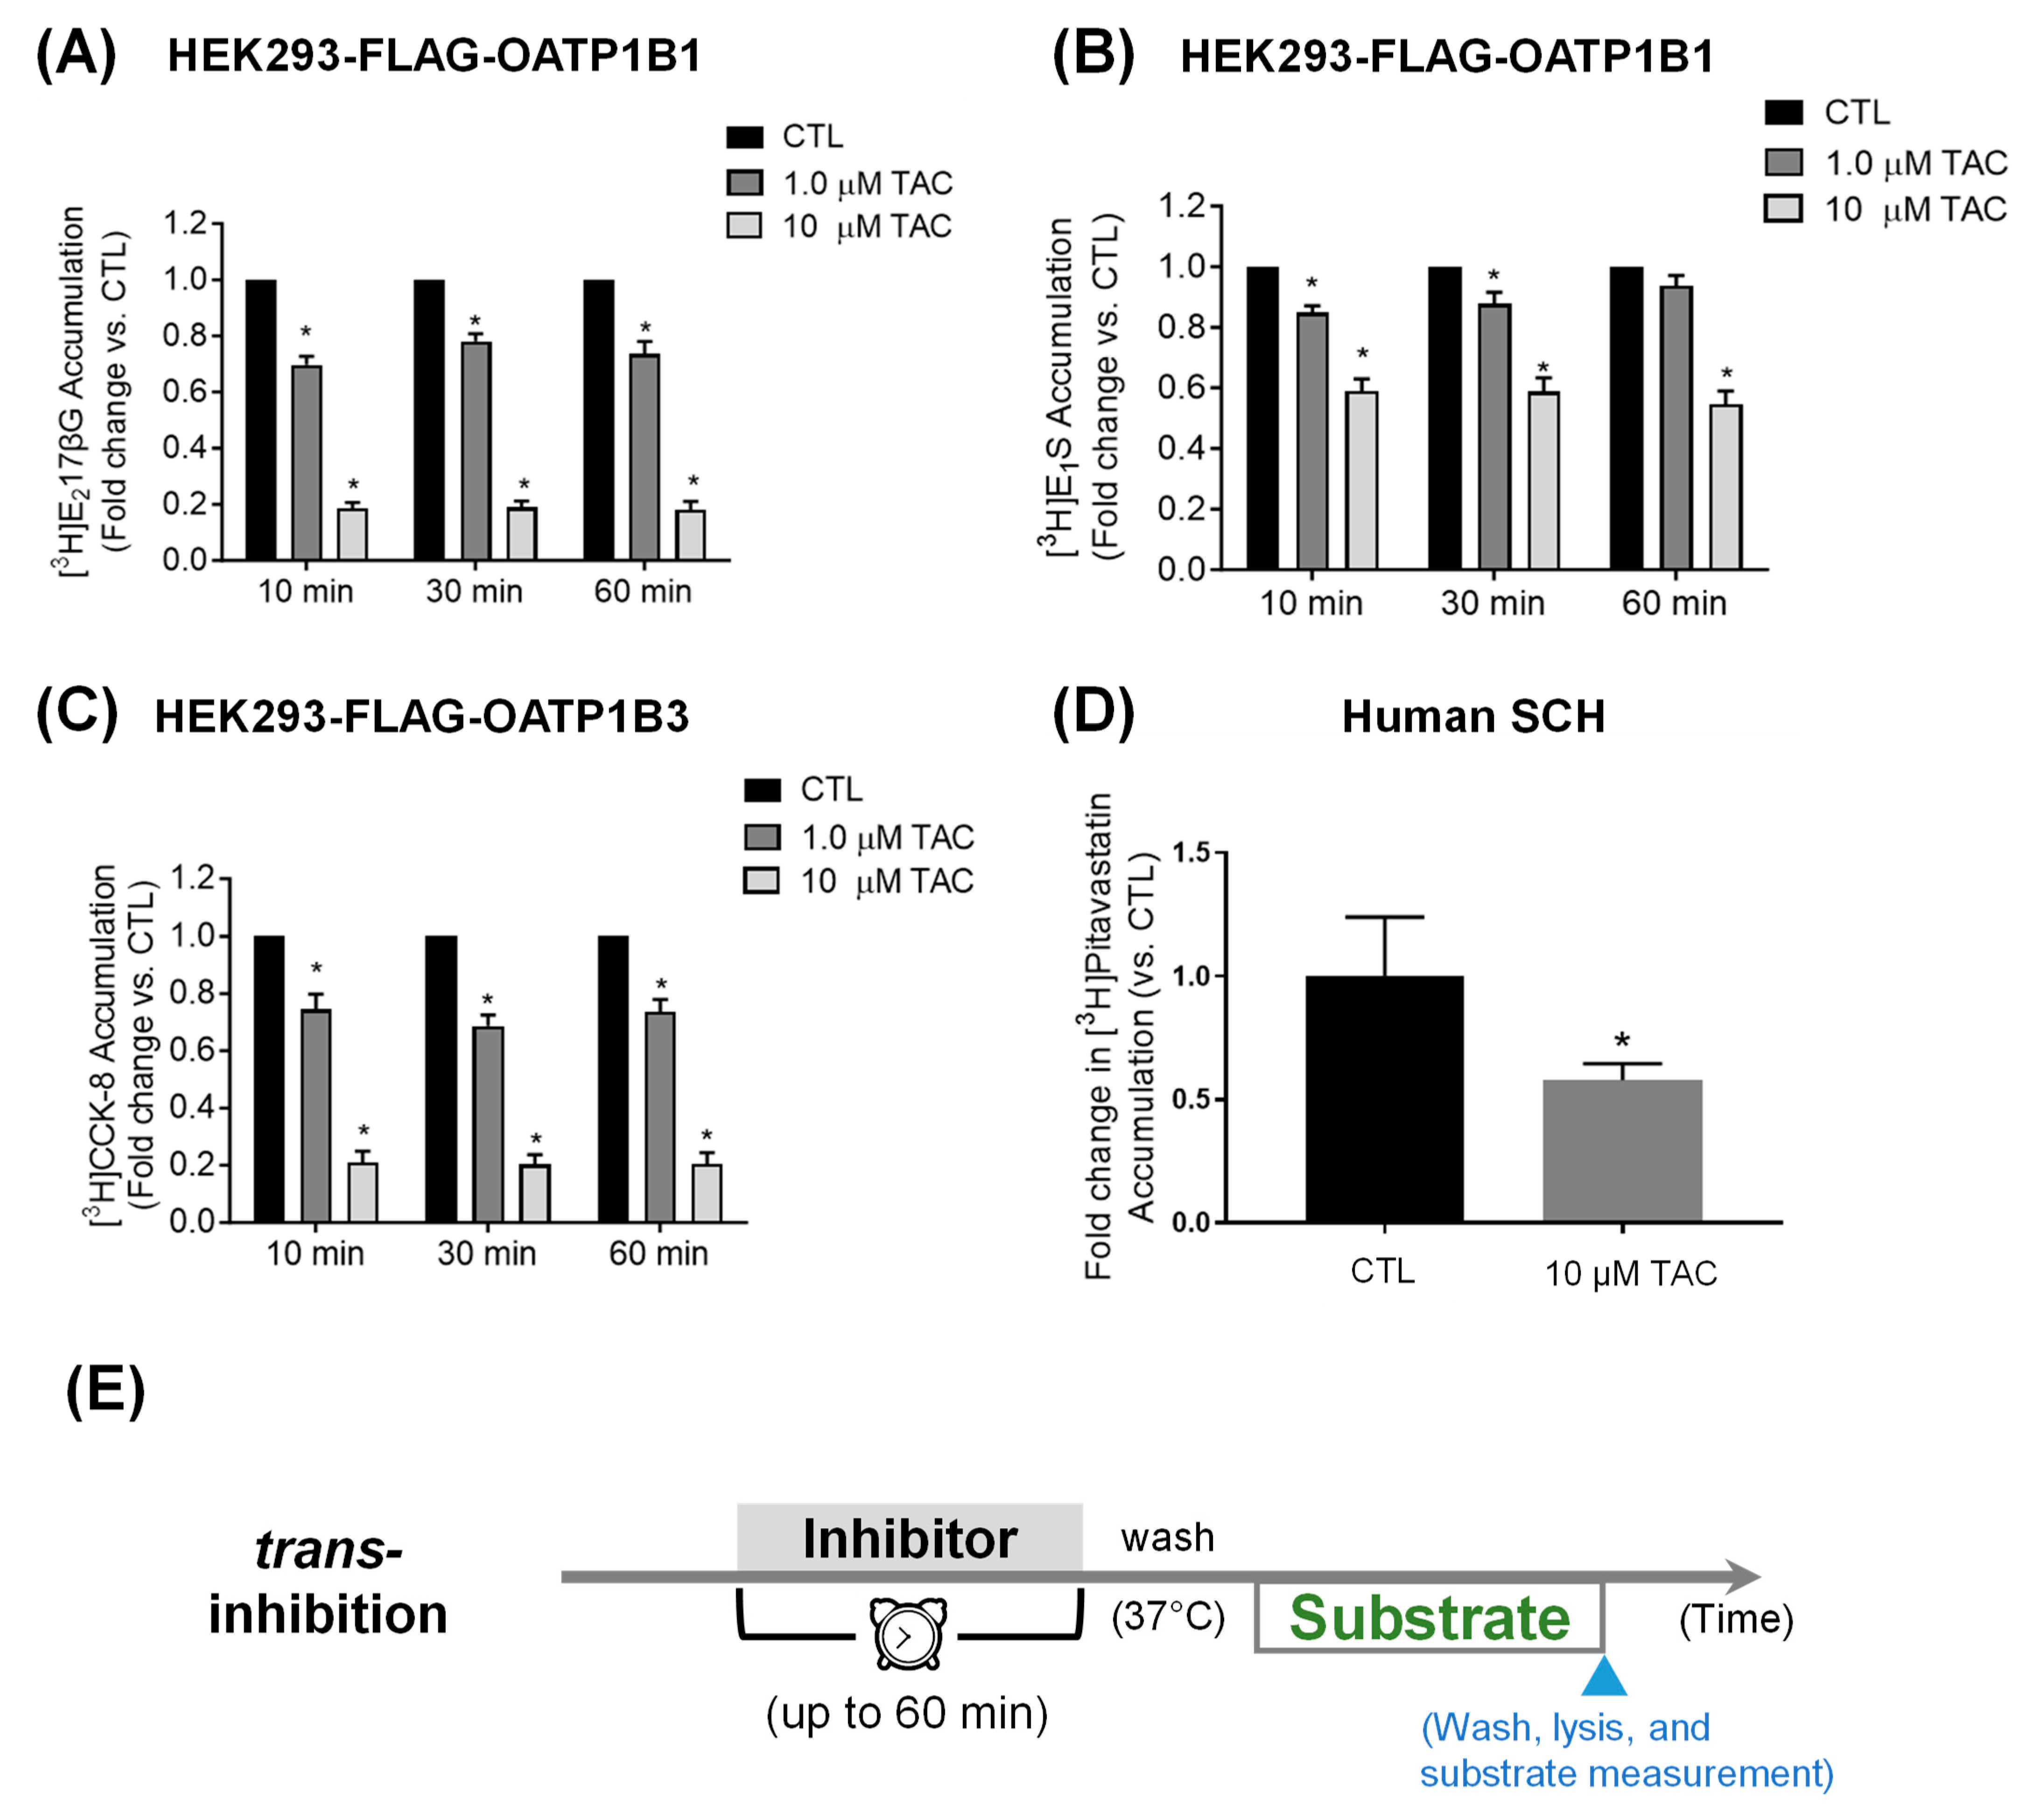
3.2. Pretreatment Effects of Tacrolimus on OATP1B1- and OATP1B3-Mediated Transport
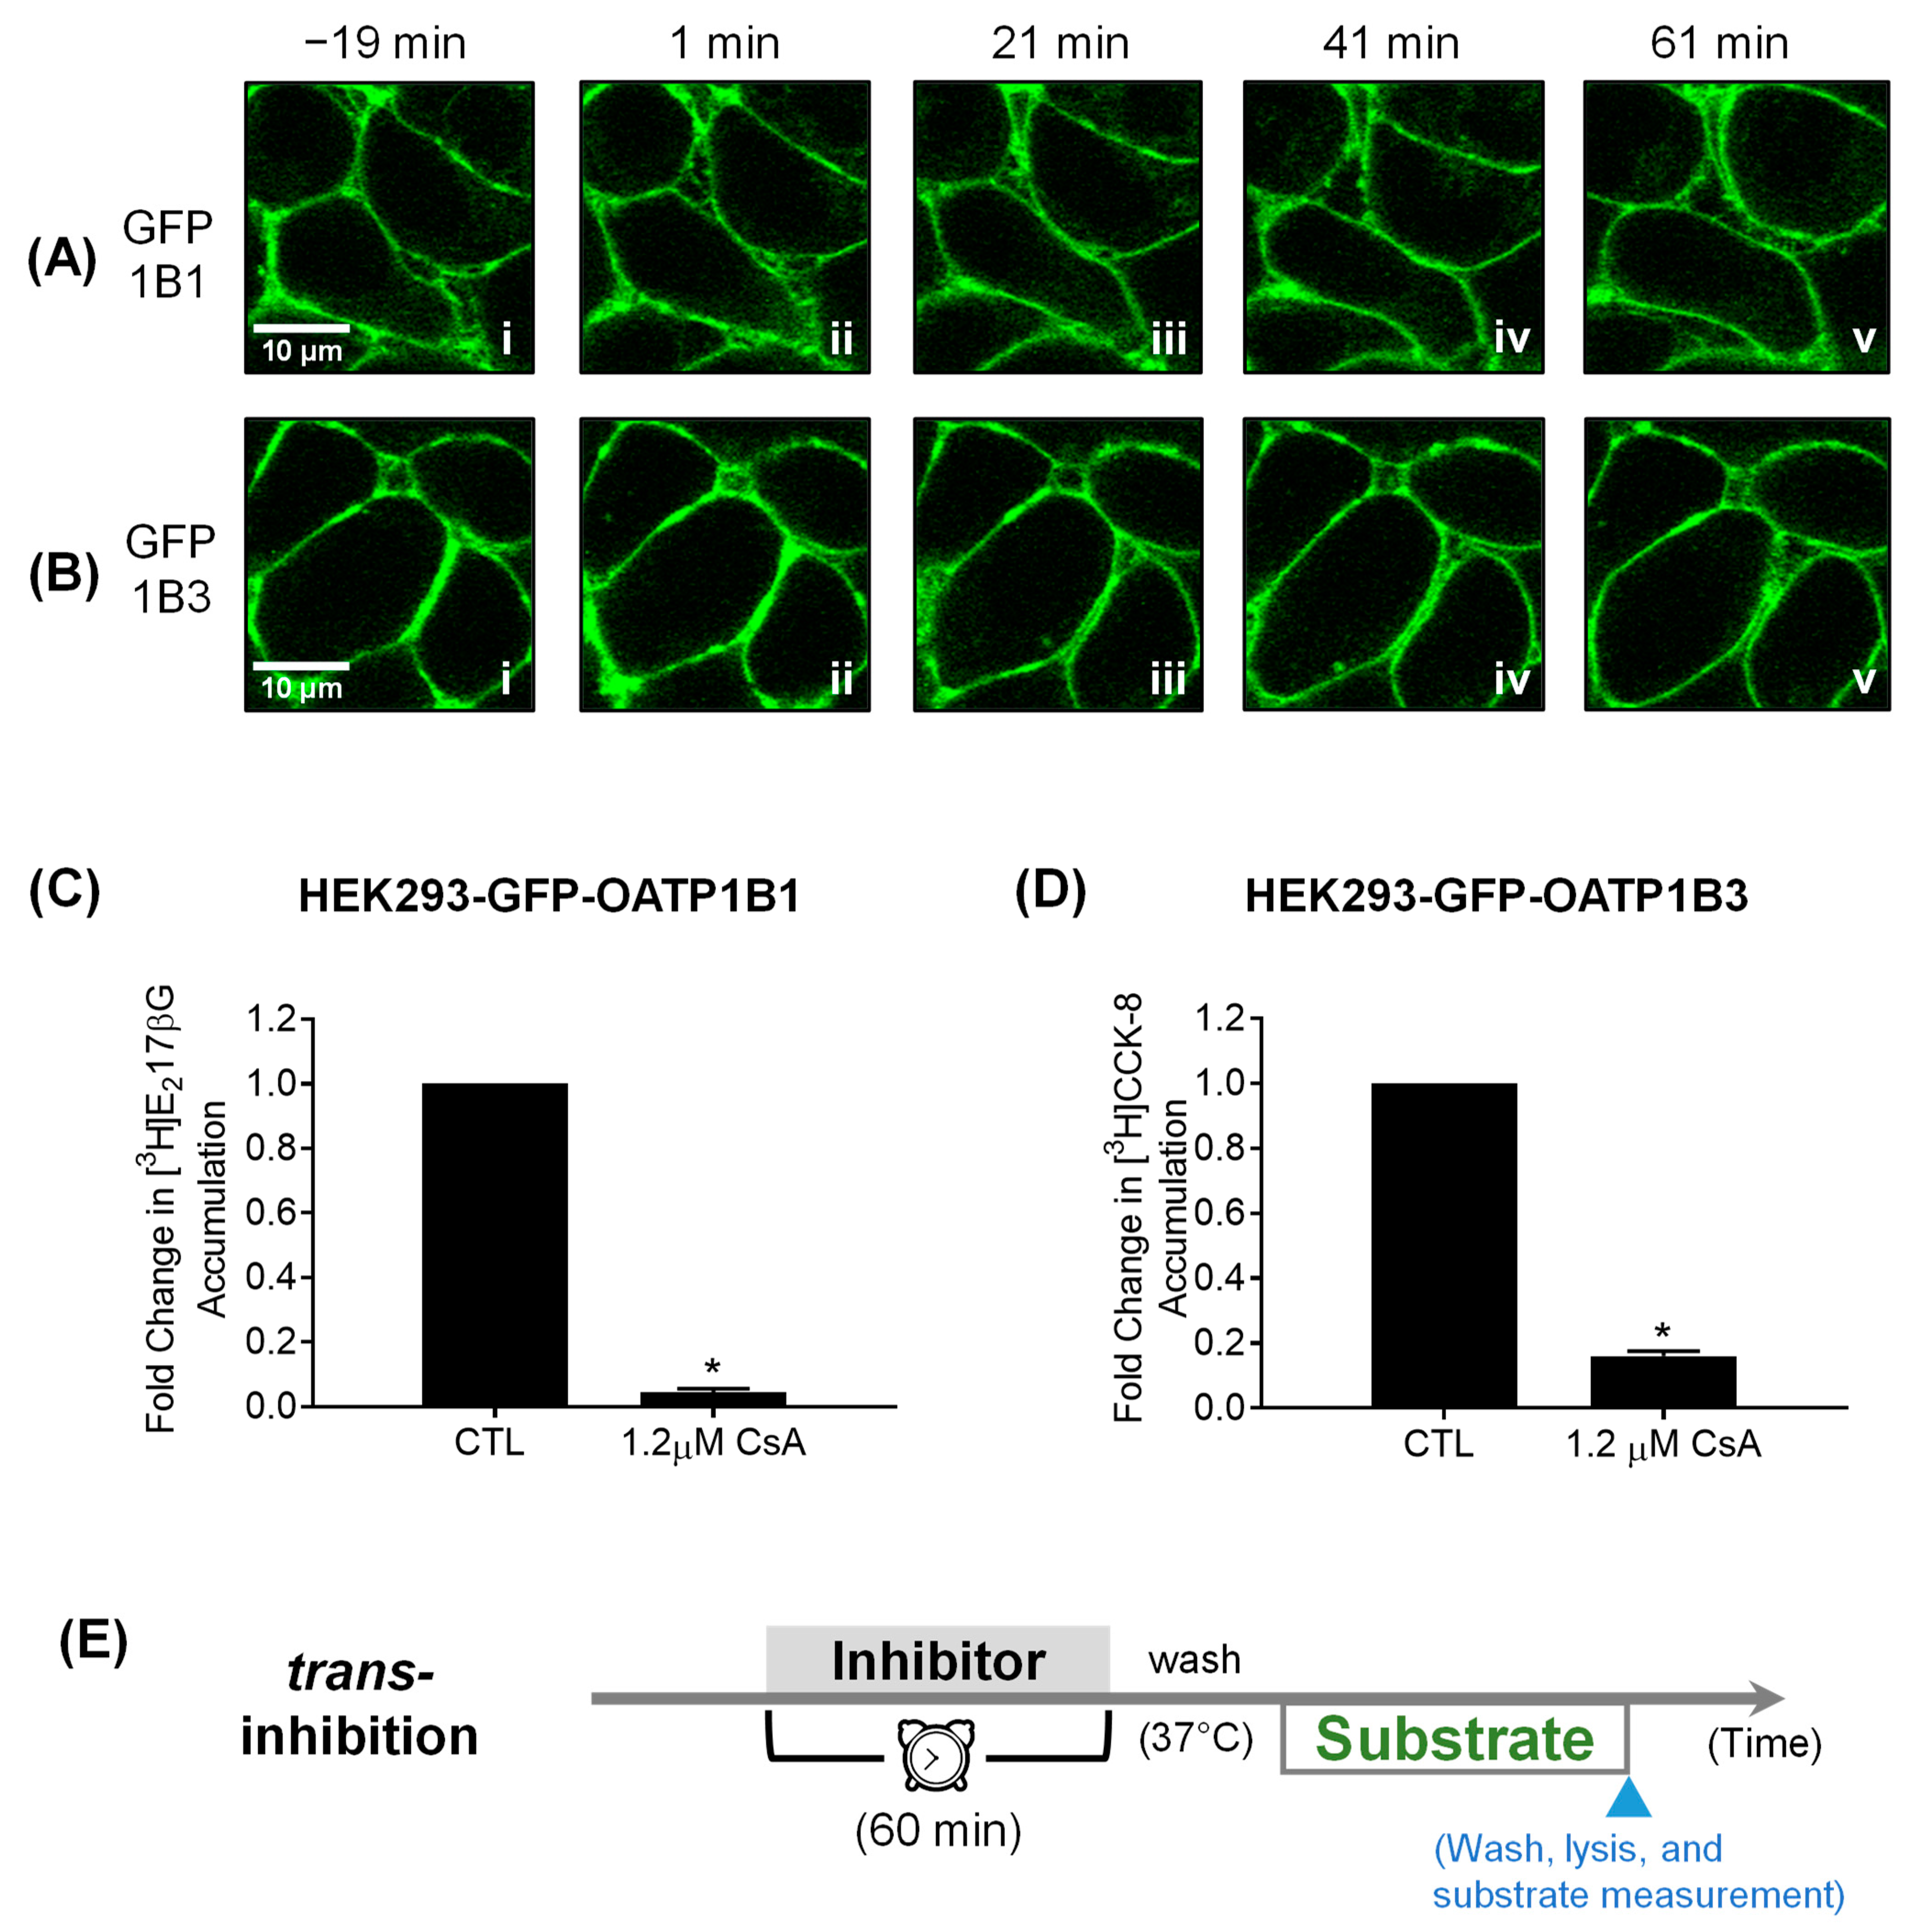
3.3. Confocal Live Cell Imaging
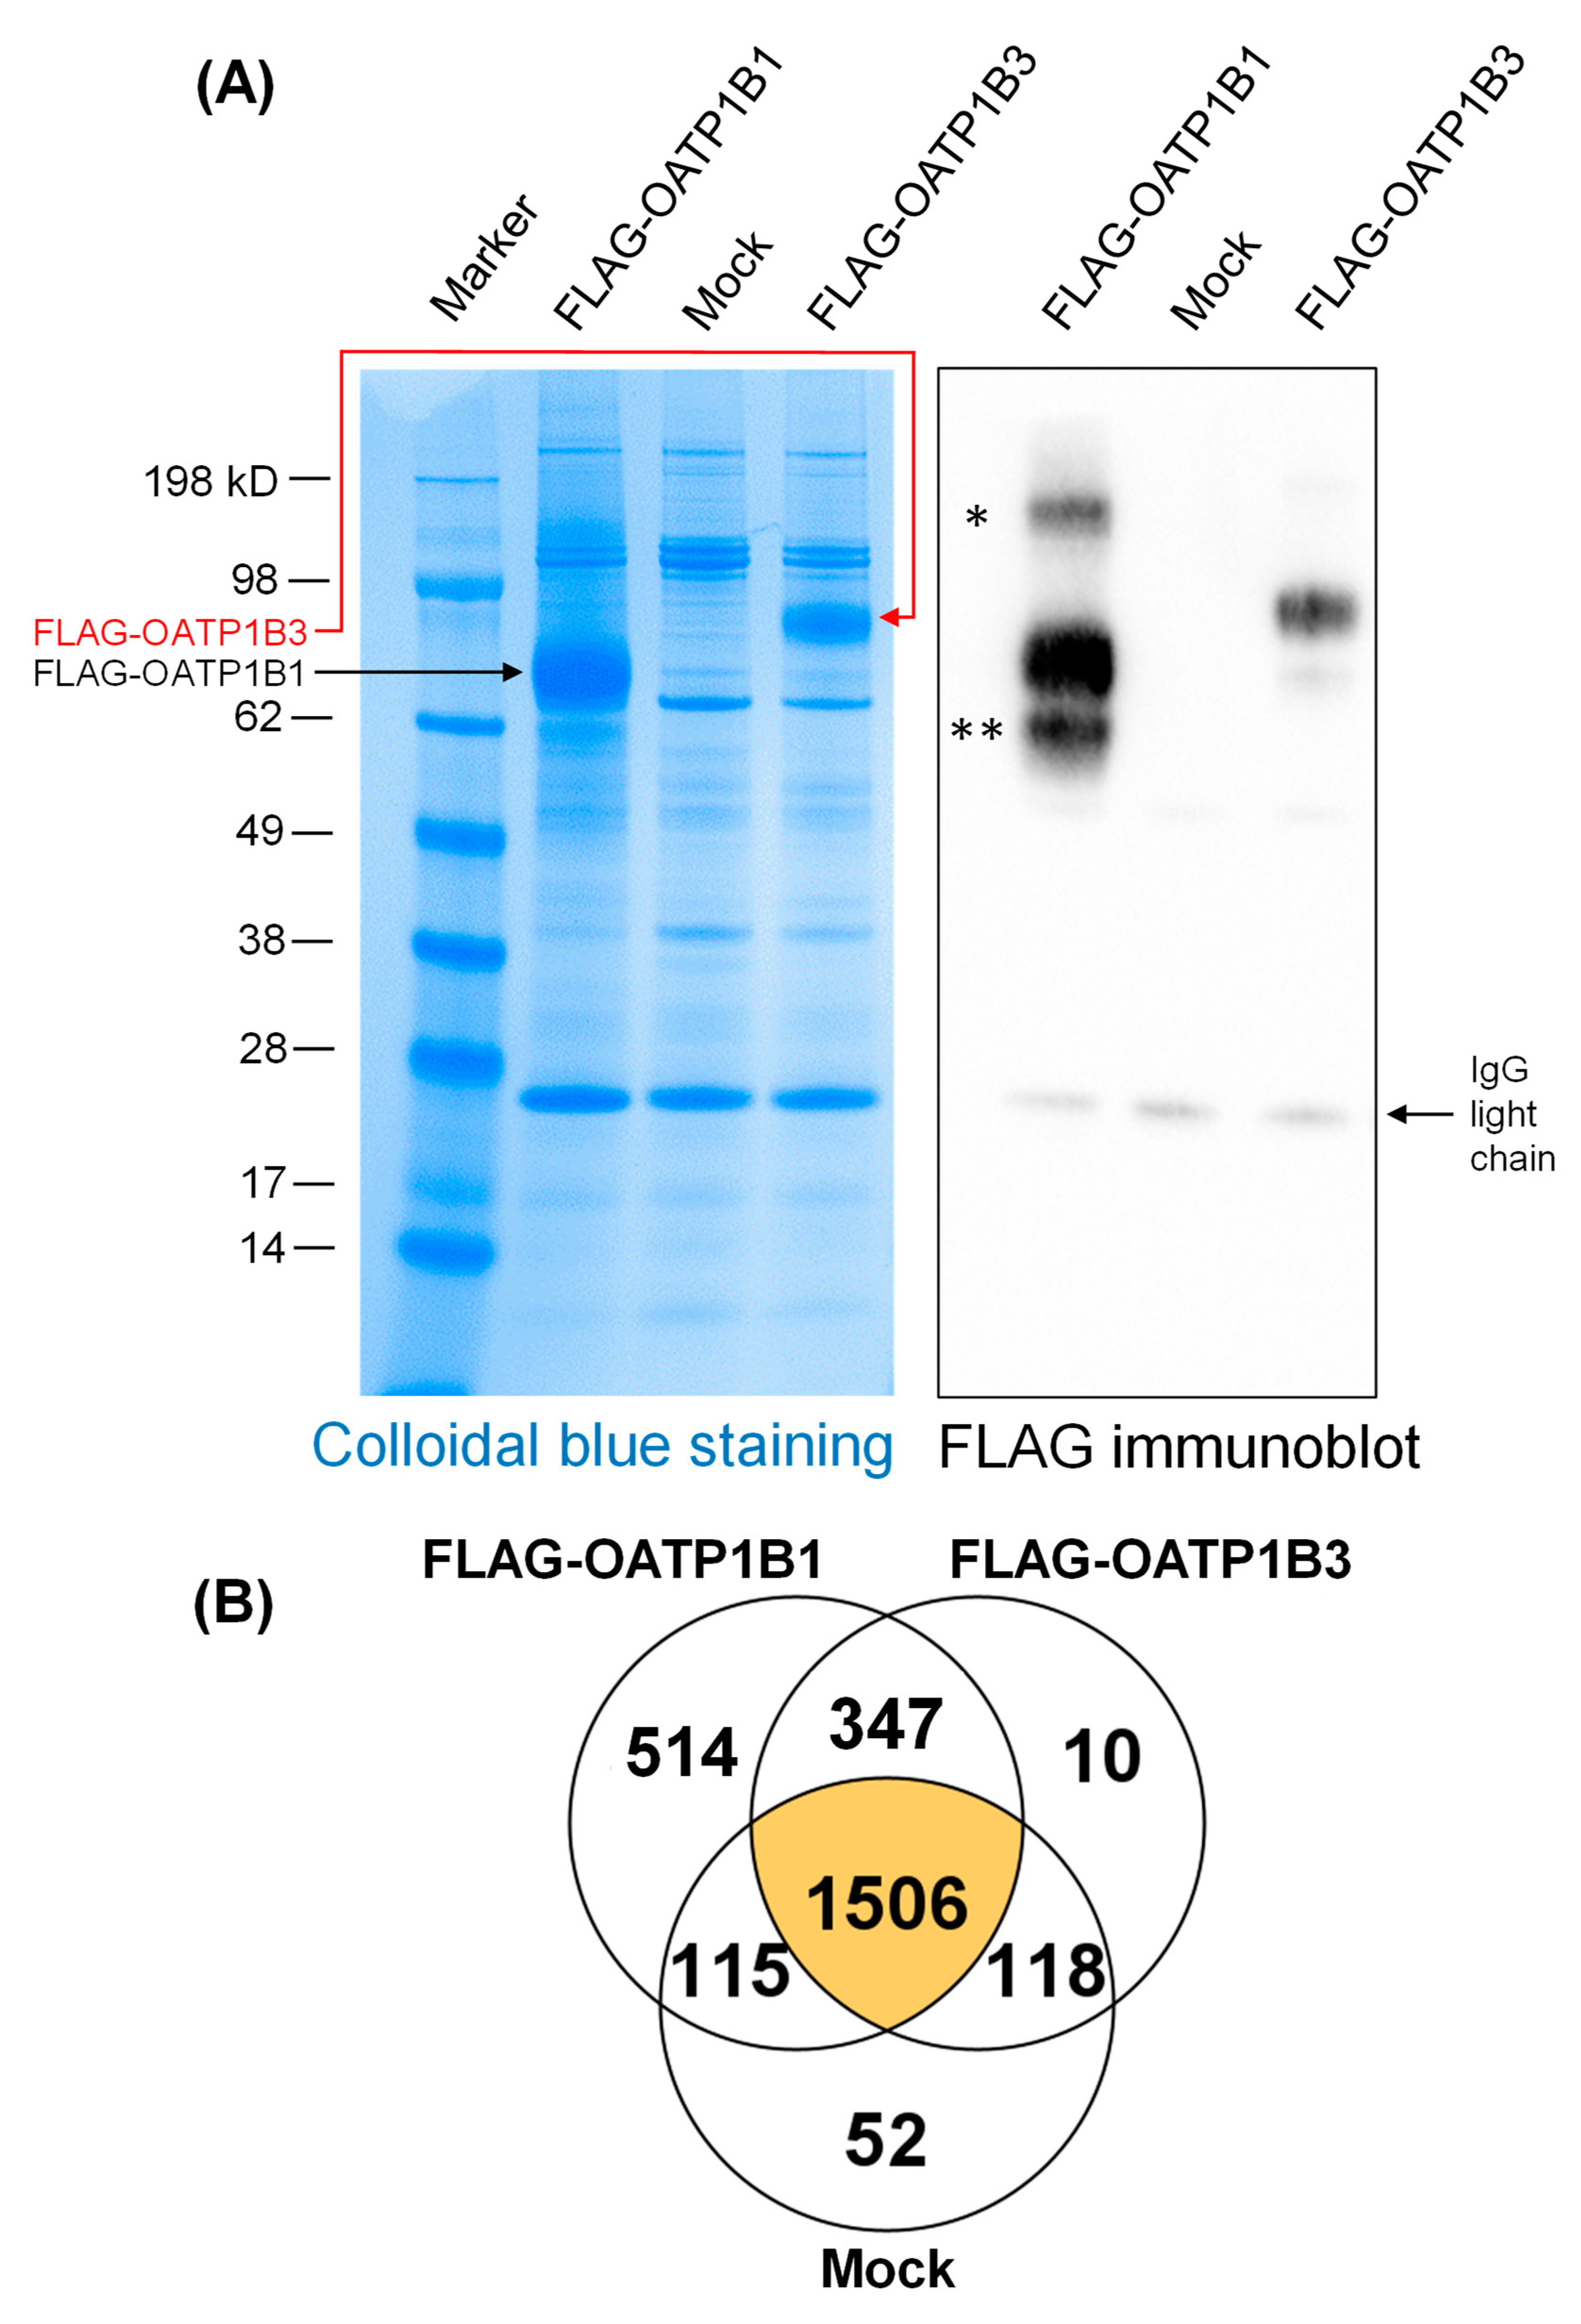
3.4. Proteins associated with FLAG-OATP1B1 and FLAG-OATP1B3

| Types of Preincubation-Induced OATP1B1/1B3 Inhibition | OATP1B1- and OATP1B3-Interacting Proteins | ||||||
|---|---|---|---|---|---|---|---|
| Inhibitors (Affected Transporters, Reference) | Pharmacological Target(s) of Inhibitors, Reference | Relevant Identified Proteins | Accession Number(s) | Alternative Name(s) | OATP 1B1 | OATP 1B3 | Mock |
| TKIs | Relevant Proteins | ||||||
| Nilotinib (OATP1B1 [13] and OATP1B3 [14]) | Tyrosine Kinases Lyn, [13,14,75] Fyn, [75] Yes, [75] MAP2k3 [75] | Tyrosine-protein kinases Lyn, Fyn, Yes, MAP2k3 | LYN_HUMAN FYN_HUMAN YES_HUMAN MP2K3_HUMAN | LYN FYN YES1 MAP2K3 | ++ ++ ++ ++ | ++ ++ ++ - | - - - - |
| Dasatinib (OATP1B1 and OATP1B3) [11] | Tyrosine Kinases Abl, [75,76] Bcr-Abl, [76] Lyn, [75] Fyn, [75] Yes, [75] Src [75] | Abl interactor 2 Tyrosine-protein kinases Lyn, Fyn, Yes, Src | ABI2_HUMAN LYN_HUMAN FYN_HUMAN YES_HUMAN SRC_HUMAN | ABI2 LYN FYN YES1 SRC | + ++ ++ ++ ++ | - ++ ++ ++ ++ | - - - - - |
| Pazopanib (OATP1B1) [65] | Tyrosine Kinases Lyn, [75] Fyn, [75] Yes, [75] Src [75] | Tyrosine-protein kinases Lyn, Fyn, Yes, Src | LYN_HUMAN FYN_HUMAN YES_HUMAN SRC_HUMAN | LYN FYN YES1 SRC | ++ ++ ++ ++ | ++ ++ ++ ++ | - - - - |
| mTOR Inhibitors | Relevant Complexes | ||||||
| Sirolimus (OATP1B1 and OATP1B3) [10] | mTORC1 [77] | Serine/threonine-protein kinase mTOR | MTOR_HUMAN | MTOR | ++ | + | - |
| Everolimus (OATP1B1 and OATP1B3) [10] | mTORC1, [77] mTORC2 [78] | Serine/threonine-protein kinase mTOR | MTOR_HUMAN | MTOR | ++ | + | - |
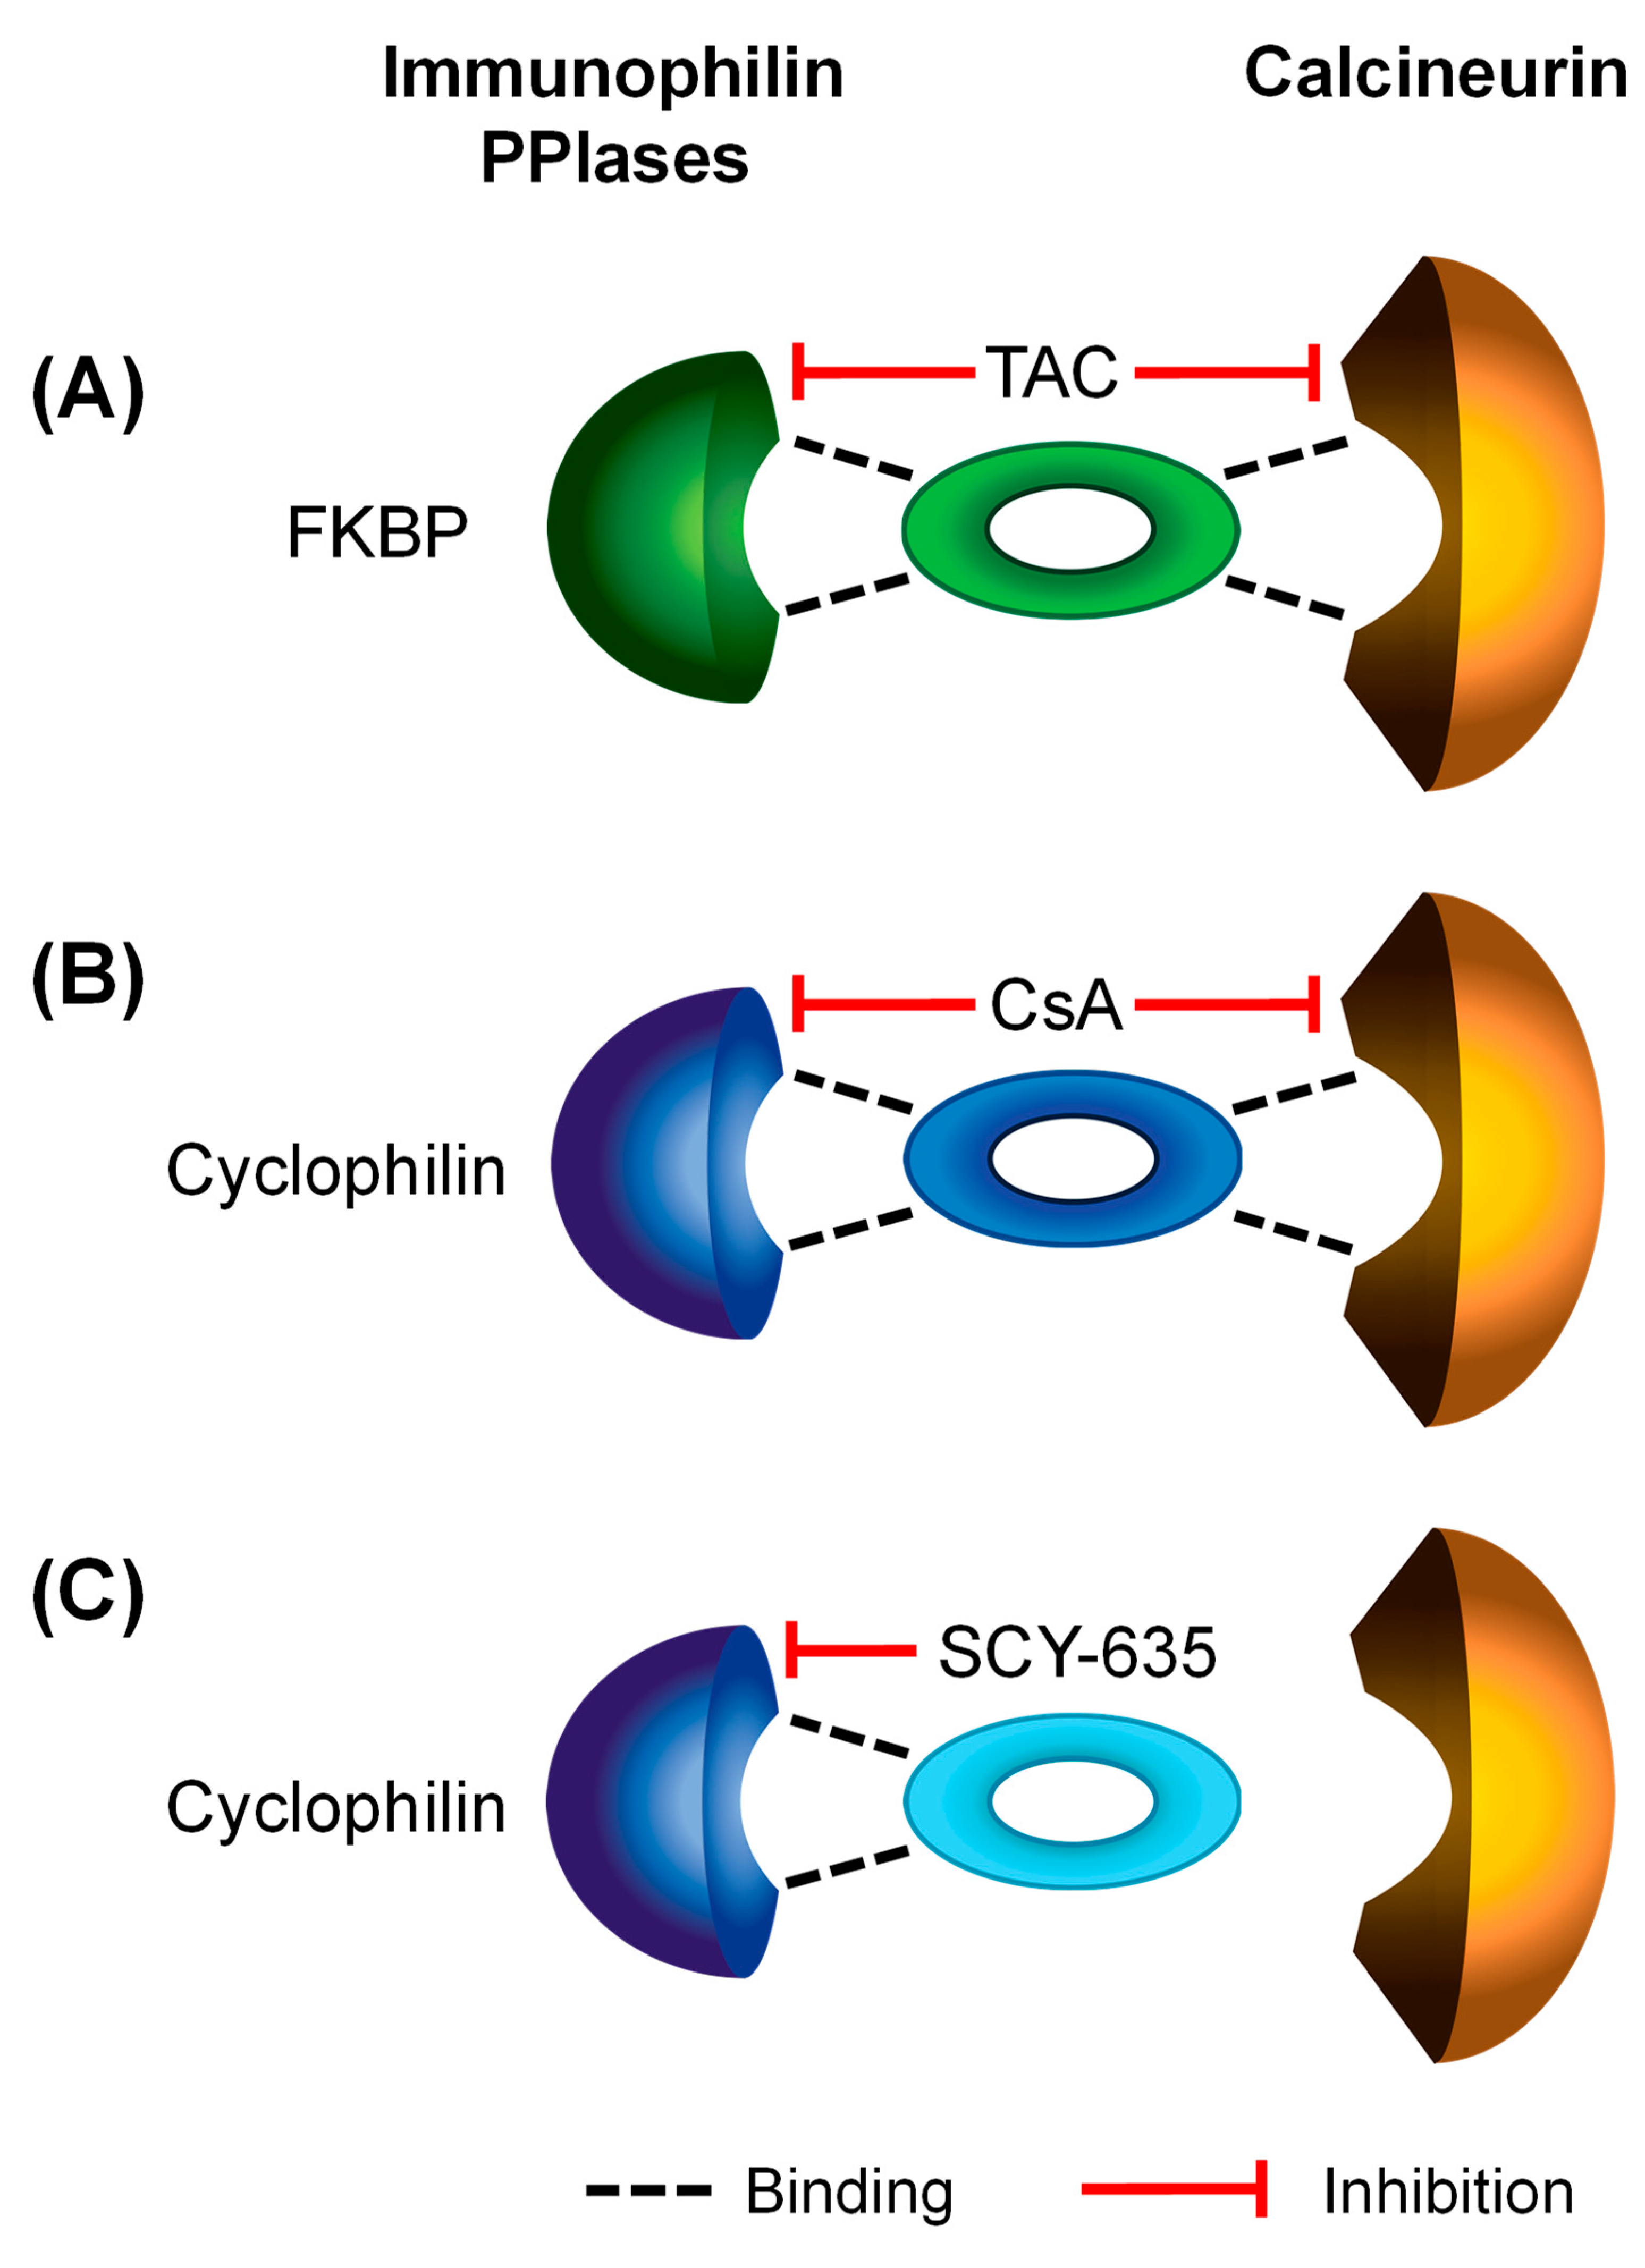
| calcineurin and/or PPIase Inhibitors | Relevant Immunophilins | ||||||
| CsA (OATP1B1 and OATP1B3) [4] | Cyclophilin A [79,80] | Peptidyl-prolyl cis-trans isomerase A (Cyclophilin A) | PPIA_HUMAN | PPIA | ++ | ++ | ++ |
| Cyclophilin B [80] | Peptidyl-prolyl cis-trans isomerase B (Cyclophilin B) | PPIB_HUMAN | PPIB | ++ | ++ | ++ | |
| Tacrolimus (OATP1B1 and OATP1B3, current study) | FKBP5 [81] | Peptidyl-prolyl cis-trans isomerase FKBP5 | FKBP5_HUMAN | FKBP5 | ++ | - | - |
| FKBP8 [82] | Peptidyl-prolyl cis-trans isomerase FKBP8 | FKBP8_HUMAN | FKBP8 | ++ | + | - | |
| SCY-635 (OATP1B1, current study) | Cyclophilin A [32] | Peptidyl-prolyl cis-trans isomerase A (Cyclophilin A) | PPIA_HUMAN | PPIA | ++ | ++ | ++ |
4. Discussion
Supplementary Materials
Author Contributions
Funding
Data Availability Statement
Acknowledgments
Conflicts of Interest
References
- König, J. Uptake transporters of the human OATP family: Molecular characteristics, substrates, their role in drug-drug interactions, and functional consequences of polymorphisms. In Drug Transporters; Handbook of Experimental Pharmacology; Springer: Berlin/Heidelberg, Germany, 2011; pp. 1–28. [Google Scholar]
- Gui, C.; Miao, Y.; Thompson, L.; Wahlgren, B.; Mock, M.; Stieger, B.; Hagenbuch, B. Effect of pregnane X receptor ligands on transport mediated by human OATP1B1 and OATP1B3. Eur. J. Pharmacol. 2008, 584, 57–65. [Google Scholar] [CrossRef] [PubMed]
- Gertz, M.; Cartwright, C.M.; Hobbs, M.J.; Kenworthy, K.E.; Rowland, M.; Houston, J.B.; Galetin, A. Cyclosporine inhibition of hepatic and intestinal CYP3A4, uptake and efflux transporters: Application of PBPK modeling in the assessment of drug-drug interaction potential. Pharm. Res. 2013, 30, 761–780. [Google Scholar] [CrossRef] [PubMed]
- Shitara, Y.; Takeuchi, K.; Nagamatsu, Y.; Wada, S.; Sugiyama, Y.; Horie, T. Long-lasting Inhibitory Effects of Cyclosporin A, but Not Tacrolimus, on OATP1B1- and OATP1B3-mediated Uptake. Drug Metab. Pharmacokinet. 2012, 27, 368–378. [Google Scholar] [CrossRef] [PubMed]
- Simonson, S.G.; Raza, A.; Martin, P.D.; Mitchell, P.D.; Jarcho, J.A.; Brown, C.D.; Windass, A.S.; Schneck, D.W. Rosuvastatin pharmacokinetics in heart transplant recipients administered an antirejection regimen including cyclosporine. Clin. Pharmacol. Ther. 2004, 76, 167–177. [Google Scholar] [CrossRef] [PubMed]
- Prueksaritanont, T.; Chu, X.; Evers, R.; Klopfer, S.O.; Caro, L.; Kothare, P.A.; Dempsey, C.; Rasmussen, S.; Houle, R.; Chan, G.; et al. Pitavastatin is a more sensitive and selective OATP1B clinical probe than rosuvastatin. Br. J. Clin. Pharmacol. 2014, 78, 587–598. [Google Scholar] [CrossRef] [PubMed]
- Powell, J.; Farasyn, T.; Kock, K.; Meng, X.; Pahwa, S.; Brouwer, K.L.; Yue, W. Novel mechanism of impaired function of organic anion-transporting polypeptide 1B3 in human hepatocytes: Post-translational regulation of OATP1B3 by protein kinase C activation. Drug Metab. Dispos. 2014, 42, 1964–1970. [Google Scholar] [CrossRef] [PubMed]
- Nozaki, Y.; Izumi, S. Preincubation Time-Dependent, Long-Lasting Inhibition of Drug Transporters and Impact on the Prediction of Drug-Drug Interactions. Drug Metab. Dispos. 2023, 51, 1077–1088. [Google Scholar] [CrossRef]
- Izumi, S.; Nozaki, Y.; Lee, W.; Sugiyama, Y. Experimental and Modeling Evidence Supporting the Trans-Inhibition Mechanism for Preincubation Time-Dependent, Long-Lasting Inhibition of Organic Anion Transporting Polypeptide 1B1 by Cyclosporine A. Drug Metab. Dispos. 2022, 50, 541–551. [Google Scholar] [CrossRef]
- Farasyn, T.; Crowe, A.; Hatley, O.; Neuhoff, S.; Alam, K.; Kanyo, J.; Lam, T.T.; Ding, K.; Yue, W. Preincubation With Everolimus and Sirolimus Reduces Organic Anion-Transporting Polypeptide (OATP)1B1- and 1B3-Mediated Transport Independently of mTOR Kinase Inhibition: Implication in Assessing OATP1B1- and OATP1B3-Mediated Drug-Drug Interactions. J. Pharm. Sci. 2019, 108, 3443–3456. [Google Scholar] [CrossRef]
- Pahwa, S.; Alam, K.; Crowe, A.; Farasyn, T.; Neuhoff, S.; Hatley, O.; Ding, K.; Yue, W. Pretreatment With Rifampicin and Tyrosine Kinase Inhibitor Dasatinib Potentiates the Inhibitory Effects Toward OATP1B1- and OATP1B3-Mediated Transport. J. Pharm. Sci. 2017, 106, 2123–2135. [Google Scholar] [CrossRef]
- Crowe, A.; Zheng, W.; Miller, J.; Pahwa, S.; Alam, K.; Fung, K.M.; Rubin, E.; Yin, F.; Ding, K.; Yue, W. Characterization of Plasma Membrane Localization and Phosphorylation Status of Organic Anion Transporting Polypeptide (OATP) 1B1 c.521 T>C Nonsynonymous Single-Nucleotide Polymorphism. Pharm. Res. 2019, 36, 101. [Google Scholar] [CrossRef] [PubMed]
- Hayden, E.R.; Chen, M.; Pasquariello, K.Z.; Gibson, A.A.; Petti, J.J.; Shen, S.; Qu, J.; Ong, S.S.; Chen, T.; Jin, Y.; et al. Regulation of OATP1B1 Function by Tyrosine Kinase-mediated Phosphorylation. Clin. Cancer Res. 2021, 27, 4301–4310. [Google Scholar] [CrossRef] [PubMed]
- Hove, V.N.; Anderson, K.; Hayden, E.R.; Pasquariello, K.Z.; Gibson, A.A.; Shen, S.; Qu, J.; Jin, Y.; Miecznikowski, J.C.; Hu, S.; et al. Influence of Tyrosine Kinase Inhibition on Organic Anion Transporting Polypeptide 1B3-Mediated Uptake. Mol. Pharmacol. 2022, 101, 381–389. [Google Scholar] [CrossRef] [PubMed]
- Farasyn, T.; Pahwa, S.; Xu, C.; Yue, W. Pre-incubation with OATP1B1 and OATP1B3 inhibitors potentiates inhibitory effects in physiologically relevant sandwich-cultured primary human hepatocytes. Eur. J. Pharm. Sci. 2021, 165, 105951. [Google Scholar] [CrossRef] [PubMed]
- Tatrai, P.; Schweigler, P.; Poller, B.; Domange, N.; de Wilde, R.; Hanna, I.; Gaborik, Z.; Huth, F. A Systematic In Vitro Investigation of the Inhibitor Preincubation Effect on Multiple Classes of Clinically Relevant Transporters. Drug Metab. Dispos. 2019, 47, 768–778. [Google Scholar] [CrossRef]
- US FDA. In Vitro Metabolism- and Transporter-Mediated Drug-Drug Interaction Studies-Guidance for Industry. 2020. Available online: https://www.fda.gov/media/134582/download (accessed on 4 February 2023).
- Asberg, A.; Hartmann, A.; Fjeldsa, E.; Bergan, S.; Holdaas, H. Bilateral pharmacokinetic interaction between cyclosporine A and atorvastatin in renal transplant recipients. Am. J. Transplant. 2001, 1, 382–386. [Google Scholar] [CrossRef]
- Hermann, M.; Asberg, A.; Christensen, H.; Holdaas, H.; Hartmann, A.; Reubsaet, J.L. Substantially elevated levels of atorvastatin and metabolites in cyclosporine-treated renal transplant recipients. Clin. Pharmacol. Ther. 2004, 76, 388–391. [Google Scholar] [CrossRef]
- Lemahieu, W.P.; Hermann, M.; Asberg, A.; Verbeke, K.; Holdaas, H.; Vanrenterghem, Y.; Maes, B.D. Combined therapy with atorvastatin and calcineurin inhibitors: No interactions with tacrolimus. Am. J. Transplant. 2005, 5, 2236–2243. [Google Scholar] [CrossRef]
- Muck, W.; Mai, I.; Fritsche, L.; Ochmann, K.; Rohde, G.; Unger, S.; Johne, A.; Bauer, S.; Budde, K.; Roots, I.; et al. Increase in cerivastatin systemic exposure after single and multiple dosing in cyclosporine-treated kidney transplant recipients. Clin. Pharmacol. Ther. 1999, 65, 251–261. [Google Scholar] [CrossRef]
- Park, J.W.; Siekmeier, R.; Lattke, P.; Merz, M.; Mix, C.; Schuler, S.; Jaross, W. Pharmacokinetics and pharmacodynamics of fluvastatin in heart transplant recipients taking cyclosporine A. J. Cardiovasc. Pharmacol. Ther. 2001, 6, 351–361. [Google Scholar] [CrossRef]
- Olbricht, C.; Wanner, C.; Eisenhauer, T.; Kliem, V.; Doll, R.; Boddaert, M.; O’Grady, P.; Krekler, M.; Mangold, B.; Christians, U. Accumulation of lovastatin, but not pravastatin, in the blood of cyclosporine-treated kidney graft patients after multiple doses. Clin. Pharmacol. Ther. 1997, 62, 311–321. [Google Scholar] [CrossRef] [PubMed]
- Park, J.W.; Siekmeier, R.; Merz, M.; Krell, B.; Harder, S.; Marz, W.; Seidel, D.; Schuler, S.; Gross, W. Pharmacokinetics of pravastatin in heart-transplant patients taking cyclosporin A. Int. J. Clin. Pharmacol. Ther. 2002, 40, 439–450. [Google Scholar] [CrossRef] [PubMed]
- Hedman, M.; Neuvonen, P.J.; Neuvonen, M.; Holmberg, C.; Antikainen, M. Pharmacokinetics and pharmacodynamics of pravastatin in pediatric and adolescent cardiac transplant recipients on a regimen of triple immunosuppression. Clin. Pharmacol. Ther. 2004, 75, 101–109. [Google Scholar] [CrossRef] [PubMed]
- Kajosaari, L.I.; Niemi, M.; Neuvonen, M.; Laitila, J.; Neuvonen, P.J.; Backman, J.T. Cyclosporine markedly raises the plasma concentrations of repaglinide. Clin. Pharmacol. Ther. 2005, 78, 388–399. [Google Scholar] [CrossRef] [PubMed]
- Ichimaru, N.; Takahara, S.; Kokado, Y.; Wang, J.D.; Hatori, M.; Kameoka, H.; Inoue, T.; Okuyama, A. Changes in lipid metabolism and effect of simvastatin in renal transplant recipients induced by cyclosporine or tacrolimus. Atherosclerosis 2001, 158, 417–423. [Google Scholar] [CrossRef] [PubMed]
- Fuehner, T.; Benden, C.; Gottlieb, J. Initial immunosuppression and managing rejection. Intensive Care Med. 2019, 45, 388–390. [Google Scholar] [CrossRef]
- Liu, J.; Farmer, J.D., Jr.; Lane, W.S.; Friedman, J.; Weissman, I.; Schreiber, S.L. Calcineurin is a common target of cyclophilin-cyclosporin A and FKBP-FK506 complexes. Cell 1991, 66, 807–815. [Google Scholar] [CrossRef]
- Rusnak, F.; Mertz, P. Calcineurin: Form and function. Physiol. Rev. 2000, 80, 1483–1521. [Google Scholar] [CrossRef]
- Park, J.; Yaseen, N.R.; Hogan, P.G.; Rao, A.; Sharma, S. Phosphorylation of the Transcription Factor NFATp Inhibits Its DNA Binding Activity in Cyclosporin A-treated Human B and T Cells. J. Biol. Chem. 1995, 270, 20653–20659. [Google Scholar] [CrossRef]
- Hopkins, S.; Scorneaux, B.; Huang, Z.; Murray, M.G.; Wring, S.; Smitley, C.; Harris, R.; Erdmann, F.; Fischer, G.; Ribeill, Y. SCY-635, a novel nonimmunosuppressive analog of cyclosporine that exhibits potent inhibition of hepatitis C virus RNA replication in vitro. Antimicrob. Agents Chemother. 2010, 54, 660–672. [Google Scholar] [CrossRef]
- Takahashi, N.; Hayano, T.; Suzuki, M. Peptidyl-prolyl cis-trans isomerase is the cyclosporin A-binding protein cyclophilin. Nature 1989, 337, 473–475. [Google Scholar] [CrossRef] [PubMed]
- Aldape, R.A.; Futer, O.; DeCenzo, M.T.; Jarrett, B.P.; Murcko, M.A.; Livingston, D.J. Charged surface residues of FKBP12 participate in formation of the FKBP12-FK506-calcineurin complex. J. Biol. Chem. 1992, 267, 16029–16032. [Google Scholar] [CrossRef] [PubMed]
- Fischer, G.; Wittmann-Liebold, B.; Lang, K.; Kiefhaber, T.; Schmid, F.X. Cyclophilin and peptidyl-prolyl cis-trans isomerase are probably identical proteins. Nature 1989, 337, 476–478. [Google Scholar] [CrossRef] [PubMed]
- Harding, M.W.; Galat, A.; Uehling, D.E.; Schreiber, S.L. A receptor for the immunosuppressant FK506 is a cis-trans peptidyl-prolyl isomerase. Nature 1989, 341, 758–760. [Google Scholar] [CrossRef] [PubMed]
- Lu, K.P.; Finn, G.; Lee, T.H.; Nicholson, L.K. Prolyl cis-trans isomerization as a molecular timer. Nat. Chem. Biol. 2007, 3, 619–629. [Google Scholar] [CrossRef] [PubMed]
- Schiene-Fischer, C.; Fischer, G.; Braun, M. Non-Immunosuppressive Cyclophilin Inhibitors. Angew. Chem. Int. Ed. Engl. 2022, 61, e202201597. [Google Scholar] [CrossRef] [PubMed]
- Ratajczak, T.; Ward, B.K.; Minchin, R.F. Immunophilin chaperones in steroid receptor signalling. Curr. Top. Med. Chem. 2003, 3, 1348–1357. [Google Scholar] [CrossRef] [PubMed]
- Marini, J.C.; Cabral, W.A.; Barnes, A.M.; Chang, W. Components of the collagen prolyl 3-hydroxylation complex are crucial for normal bone development. Cell Cycle 2007, 6, 1675–1681. [Google Scholar] [CrossRef]
- Pan, H.; Luo, C.; Li, R.; Qiao, A.; Zhang, L.; Mines, M.; Nyanda, A.M.; Zhang, J.; Fan, G.H. Cyclophilin A is required for CXCR4-mediated nuclear export of heterogeneous nuclear ribonucleoprotein A2, activation and nuclear translocation of ERK1/2, and chemotactic cell migration. J. Biol. Chem. 2008, 283, 623–637. [Google Scholar] [CrossRef]
- Colgan, J.; Asmal, M.; Neagu, M.; Yu, B.; Schneidkraut, J.; Lee, Y.; Sokolskaja, E.; Andreotti, A.; Luban, J. Cyclophilin A regulates TCR signal strength in CD4+ T cells via a proline-directed conformational switch in Itk. Immunity 2004, 21, 189–201. [Google Scholar] [CrossRef]
- Zhu, C.; Wang, X.; Deinum, J.; Huang, Z.; Gao, J.; Modjtahedi, N.; Neagu, M.R.; Nilsson, M.; Eriksson, P.S.; Hagberg, H.; et al. Cyclophilin A participates in the nuclear translocation of apoptosis-inducing factor in neurons after cerebral hypoxia-ischemia. J. Exp. Med. 2007, 204, 1741–1748. [Google Scholar] [CrossRef] [PubMed]
- Sarkar, P.; Saleh, T.; Tzeng, S.R.; Birge, R.B.; Kalodimos, C.G. Structural basis for regulation of the Crk signaling protein by a proline switch. Nat. Chem. Biol. 2011, 7, 51–57. [Google Scholar] [CrossRef] [PubMed]
- Halestrap, A.P. The mitochondrial permeability transition: Its molecular mechanism and role in reperfusion injury. Biochem. Soc. Symp. 1999, 66, 181–203. [Google Scholar] [CrossRef] [PubMed]
- Rycyzyn, M.A.; Clevenger, C.V. The intranuclear prolactin/cyclophilin B complex as a transcriptional inducer. Proc. Natl. Acad. Sci. USA 2002, 99, 6790–6795. [Google Scholar] [CrossRef] [PubMed]
- Baum, N.; Schiene-Fischer, C.; Frost, M.; Schumann, M.; Sabapathy, K.; Ohlenschlager, O.; Grosse, F.; Schlott, B. The prolyl cis/trans isomerase cyclophilin 18 interacts with the tumor suppressor p53 and modifies its functions in cell cycle regulation and apoptosis. Oncogene 2009, 28, 3915–3925. [Google Scholar] [CrossRef] [PubMed]
- Baines, C.P.; Gutierrez-Aguilar, M. The still uncertain identity of the channel-forming unit(s) of the mitochondrial permeability transition pore. Cell Calcium 2018, 73, 121–130. [Google Scholar] [CrossRef] [PubMed]
- Gallay, P.A.; Lin, K. Profile of alisporivir and its potential in the treatment of hepatitis C. Drug Des. Devel Ther. 2013, 7, 105–115. [Google Scholar] [CrossRef]
- Pawlotsky, J.M. COVID-19 Pandemic: Time to Revive the Cyclophilin Inhibitor Alisporivir. Clin. Infect. Dis. 2020, 71, 2191–2194. [Google Scholar] [CrossRef]
- Hopkins, S.; DiMassimo, B.; Rusnak, P.; Heuman, D.; Lalezari, J.; Sluder, A.; Scorneaux, B.; Mosier, S.; Kowalczyk, P.; Ribeill, Y.; et al. The cyclophilin inhibitor SCY-635 suppresses viral replication and induces endogenous interferons in patients with chronic HCV genotype 1 infection. J. Hepatol. 2012, 57, 47–54. [Google Scholar] [CrossRef]
- Fu, J.; Tjandra, M.; Becker, C.; Bednarczyk, D.; Capparelli, M.; Elling, R.; Hanna, I.; Fujimoto, R.; Furegati, M.; Karur, S.; et al. Potent nonimmunosuppressive cyclophilin inhibitors with improved pharmaceutical properties and decreased transporter inhibition. J. Med. Chem. 2014, 57, 8503–8516. [Google Scholar] [CrossRef]
- Hart, A.; Smith, J.M.; Skeans, M.A.; Gustafson, S.K.; Wilk, A.R.; Robinson, A.; Wainright, J.L.; Haynes, C.R.; Snyder, J.J.; Kasiske, B.L.; et al. OPTN/SRTR 2016 Annual Data Report: Kidney. Am. J. Transplant. 2018, 18, 18–113. [Google Scholar] [CrossRef] [PubMed]
- Migliozzi, D.R.; Asal, N.J. Clinical Controversy in Transplantation: Tacrolimus Versus Cyclosporine in Statin Drug Interactions. Ann. Pharmacother. 2020, 54, 171–177. [Google Scholar] [CrossRef] [PubMed]
- Vaidyanathan, J.; Yoshida, K.; Arya, V.; Zhang, L. Comparing Various In Vitro Prediction Criteria to Assess the Potential of a New Molecular Entity to Inhibit Organic Anion Transporting Polypeptide 1B1. J. Clin. Pharmacol. 2016, 56 (Suppl. S7), S59–S72. [Google Scholar] [CrossRef] [PubMed]
- Tamraz, B.; Fukushima, H.; Wolfe, A.R.; Kaspera, R.; Totah, R.A.; Floyd, J.S.; Ma, B.; Chu, C.; Marciante, K.D.; Heckbert, S.R.; et al. OATP1B1-related drug-drug and drug-gene interactions as potential risk factors for cerivastatin-induced rhabdomyolysis. Pharmacogenet Genom. 2013, 23, 355–364. [Google Scholar] [CrossRef] [PubMed]
- Izumi, S.; Nozaki, Y.; Maeda, K.; Komori, T.; Takenaka, O.; Kusuhara, H.; Sugiyama, Y. Investigation of the impact of substrate selection on in vitro organic anion transporting polypeptide 1B1 inhibition profiles for the prediction of drug-drug interactions. Drug. Metab. Dispos. 2015, 43, 235–247. [Google Scholar] [CrossRef] [PubMed]
- Renders, L.; Haas, C.S.; Liebelt, J.; Oberbarnscheidt, M.; Schocklmann, H.O.; Kunzendorf, U. Tacrolimus and cerivastatin pharmacokinetics and adverse effects after single and multiple dosing with cerivastatin in renal transplant recipients. Br. J. Clin. Pharmacol. 2003, 56, 214–219. [Google Scholar] [CrossRef]
- Moreno, A.; Fortun, J.; Graus, J.; Rodriguez-Gandia, M.A.; Quereda, C.; Perez-Elias, M.J.; Nuno, J.; Wikman, P.; Moreno, S.; Barcena, R. Severe rhabdomyolysis due to rosuvastatin in a liver transplant subject with human immunodeficiency virus and immunosuppressive therapy-related dyslipidemia. Liver Transpl. 2011, 17, 331–333. [Google Scholar] [CrossRef]
- Izumi, S.; Nozaki, Y.; Komori, T.; Maeda, K.; Takenaka, O.; Kusano, K.; Yoshimura, T.; Kusuhara, H.; Sugiyama, Y. Substrate-dependent inhibition of organic anion transporting polypeptide 1B1: Comparative analysis with prototypical probe substrates estradiol-17beta-glucuronide, estrone-3-sulfate, and sulfobromophthalein. Drug Metab. Dispos. 2013, 41, 1859–1866. [Google Scholar] [CrossRef]
- Richards, A.L.; Eckhardt, M.; Krogan, N.J. Mass spectrometry-based protein-protein interaction networks for the study of human diseases. Mol. Syst. Biol. 2021, 17, e8792. [Google Scholar] [CrossRef]
- Wang, P.; Murray, J.W.; Wolkoff, A.W. Interaction of Human OATP1B1 with PDZK1 is Required for its Trafficking to the Hepatocyte Plasma Membrane. Drug Metab. Dispos. 2023, 51, 1342–1349. [Google Scholar] [CrossRef]
- Zhang, Y.; Boxberger, K.H.; Hagenbuch, B. Organic anion transporting polypeptide 1B3 can form homo- and hetero-oligomers. PLoS ONE 2017, 12, e0180257. [Google Scholar] [CrossRef] [PubMed]
- Zhang, Y.C.; Ruggiero, M.; Hagenbuch, B. OATP1B3 Expression and Function is Modulated by Coexpression with OCT1, OATP1B1, and NTCP. Drug Metab. Dispos. 2020, 48, 622–630. [Google Scholar] [CrossRef] [PubMed]
- Taguchi, T.; Masuo, Y.; Sakai, Y.; Kato, Y. Short-lasting inhibition of hepatic uptake transporter OATP1B1 by tyrosine kinase inhibitor pazopanib. Drug Metab. Pharmacokinet. 2019, 34, 372–379. [Google Scholar] [CrossRef] [PubMed]
- Brouwer, K.L.R.; Evers, R.; Hayden, E.; Hu, S.; Li, C.Y.; Meyer Zu Schwabedissen, H.E.; Neuhoff, S.; Oswald, S.; Piquette-Miller, M.; Saran, C.; et al. Regulation of Drug Transport Proteins-From Mechanisms to Clinical Impact: A White Paper on Behalf of the International Transporter Consortium. Clin. Pharmacol. Ther. 2022, 112, 461–484. [Google Scholar] [CrossRef] [PubMed]
- Alam, K.; Pahwa, S.; Wang, X.; Zhang, P.; Ding, K.; Abuznait, A.H.; Li, L.; Yue, W. Downregulation of Organic Anion Transporting Polypeptide (OATP) 1B1 Transport Function by Lysosomotropic Drug Chloroquine: Implication in OATP-Mediated Drug-Drug Interactions. Mol. Pharm. 2016, 13, 839–851. [Google Scholar] [CrossRef] [PubMed]
- Alam, K.; Farasyn, T.; Crowe, A.; Ding, K.; Yue, W. Treatment with proteasome inhibitor bortezomib decreases organic anion transporting polypeptide (OATP) 1B3-mediated transport in a substrate-dependent manner. PLoS ONE 2017, 12, e0186924. [Google Scholar] [CrossRef] [PubMed]
- Konig, J.; Cui, Y.; Nies, A.T.; Keppler, D. A novel human organic anion transporting polypeptide localized to the basolateral hepatocyte membrane. Am. J. Physiol. Gastrointest. Liver Physiol. 2000, 278, G156–G164. [Google Scholar] [CrossRef]
- Keller, A.; Nesvizhskii, A.I.; Kolker, E.; Aebersold, R. Empirical statistical model to estimate the accuracy of peptide identifications made by MS/MS and database search. Anal. Chem. 2002, 74, 5383–5392. [Google Scholar] [CrossRef]
- Valdez-Sinon, A.N.; Gokhale, A.; Faundez, V.; Bassell, G.J. Protocol for Immuno-Enrichment of FLAG-Tagged Protein Complexes. STAR Protoc. 2020, 1, 100083. [Google Scholar] [CrossRef]
- Hong, M.; Hong, W.; Ni, C.; Huang, J.; Zhou, C. Protein kinase C affects the internalization and recycling of organic anion transporting polypeptide 1B1. Biochim. Biophys. Acta 2015, 1848, 2022–2030. [Google Scholar] [CrossRef]
- Uhlen, M.; Fagerberg, L.; Hallstrom, B.M.; Lindskog, C.; Oksvold, P.; Mardinoglu, A.; Sivertsson, A.; Kampf, C.; Sjostedt, E.; Asplund, A.; et al. Proteomics. Tissue-based map of the human proteome. Science 2015, 347, 1260419. [Google Scholar] [CrossRef] [PubMed]
- UniProt, C. UniProt: The Universal Protein Knowledgebase in 2023. Nucleic Acids Res. 2023, 51, D523–D531. [Google Scholar] [CrossRef]
- Kitagawa, D.; Yokota, K.; Gouda, M.; Narumi, Y.; Ohmoto, H.; Nishiwaki, E.; Akita, K.; Kirii, Y. Activity-based kinase profiling of approved tyrosine kinase inhibitors. Genes. Cells 2013, 18, 110–122. [Google Scholar] [CrossRef] [PubMed]
- Dai, Z.; Pendergast, A.M. Abi-2, a novel SH3-containing protein interacts with the c-Abl tyrosine kinase and modulates c-Abl transforming activity. Genes. Dev. 1995, 9, 2569–2582. [Google Scholar] [CrossRef] [PubMed]
- Yang, H.; Rudge, D.G.; Koos, J.D.; Vaidialingam, B.; Yang, H.J.; Pavletich, N.P. mTOR kinase structure, mechanism and regulation. Nature 2013, 497, 217–223. [Google Scholar] [CrossRef] [PubMed]
- Jin, Y.P.; Valenzuela, N.M.; Ziegler, M.E.; Rozengurt, E.; Reed, E.F. Everolimus inhibits anti-HLA I antibody-mediated endothelial cell signaling, migration and proliferation more potently than sirolimus. Am. J. Transplant. 2014, 14, 806–819. [Google Scholar] [CrossRef] [PubMed]
- Handschumacher, R.E.; Harding, M.W.; Rice, J.; Drugge, R.J.; Speicher, D.W. Cyclophilin: A specific cytosolic binding protein for cyclosporin A. Science 1984, 226, 544–547. [Google Scholar] [CrossRef]
- Daum, S.; Schumann, M.; Mathea, S.; Aumuller, T.; Balsley, M.A.; Constant, S.L.; de Lacroix, B.F.; Kruska, F.; Braun, M.; Schiene-Fischer, C. Isoform-specific inhibition of cyclophilins. Biochemistry 2009, 48, 6268–6277. [Google Scholar] [CrossRef]
- Baughman, G.; Wiederrecht, G.J.; Campbell, N.F.; Martin, M.M.; Bourgeois, S. FKBP51, a novel T-cell-specific immunophilin capable of calcineurin inhibition. Mol. Cell Biol. 1995, 15, 4395–4402. [Google Scholar] [CrossRef]
- Edlich, F.; Weiwad, M.; Erdmann, F.; Fanghanel, J.; Jarczowski, F.; Rahfeld, J.U.; Fischer, G. Bcl-2 regulator FKBP38 is activated by Ca2+/calmodulin. Embo J. 2005, 24, 2688–2699. [Google Scholar] [CrossRef]
- Hirano, M.; Maeda, K.; Shitara, Y.; Sugiyama, Y. Contribution of OATP2 (OATP1B1) and OATP8 (OATP1B3) to the hepatic uptake of pitavastatin in humans. J. Pharmacol. Exp. Ther. 2004, 311, 139–146. [Google Scholar] [CrossRef] [PubMed]
- Qian, W.; Yin, X.; Hu, W.; Shi, J.; Gu, J.; Grundke-Iqbal, I.; Iqbal, K.; Gong, C.X.; Liu, F. Activation of protein phosphatase 2B and hyperphosphorylation of Tau in Alzheimer’s disease. J. Alzheimers Dis. 2011, 23, 617–627. [Google Scholar] [CrossRef] [PubMed]
- Arakawa, H.; Omote, S.; Tamai, I. Inhibitory Effect of Crizotinib on Creatinine Uptake by Renal Secretory Transporter OCT2. J. Pharm. Sci. 2017, 106, 2899–2903. [Google Scholar] [CrossRef] [PubMed]
- Panfen, E.; Chen, W.; Zhang, Y.; Sinz, M.; Marathe, P.; Gan, J.; Shen, H. Enhanced and Persistent Inhibition of Organic Cation Transporter 1 Activity by Preincubation of Cyclosporine A. Drug Metab. Dispos. 2019, 47, 1352–1360. [Google Scholar] [CrossRef]
- Ma, L.; Qin, Y.; Shen, Z.; Hu, H.; Zhou, H.; Yu, L.; Jiang, H.; Zeng, S. Time-Dependent Inhibition of hOAT1 and hOAT3 by Anthraquinones. Biol. Pharm. Bull. 2015, 38, 992–995. [Google Scholar] [CrossRef]
- Tatrai, P.; Temesszentandrasi-Ambrus, C.; Varga, T.; Gaborik, Z. The Inhibitor Preincubation Effect Is Universal to SLC Transporter Assays and Is Only Partially Eliminated in the Presence of Extracellular Protein. Drug Metab. Dispos. 2023, 51, 982–994. [Google Scholar] [CrossRef]
- Bierer, B.E.; Mattila, P.S.; Standaert, R.F.; Herzenberg, L.A.; Burakoff, S.J.; Crabtree, G.; Schreiber, S.L. Two distinct signal transmission pathways in T lymphocytes are inhibited by complexes formed between an immunophilin and either FK506 or rapamycin. Proc. Natl. Acad. Sci. USA 1990, 87, 9231–9235. [Google Scholar] [CrossRef]
- Muller, M.C.; Cortes, J.E.; Kim, D.W.; Druker, B.J.; Erben, P.; Pasquini, R.; Branford, S.; Hughes, T.P.; Radich, J.P.; Ploughman, L.; et al. Dasatinib treatment of chronic-phase chronic myeloid leukemia: Analysis of responses according to preexisting BCR-ABL mutations. Blood 2009, 114, 4944–4953. [Google Scholar] [CrossRef]
- Liu, G.Y.; Sabatini, D.M. mTOR at the nexus of nutrition, growth, ageing and disease (vol 29, pg 145, 2020). Nat. Rev. Mol. Cell Bio 2020, 21, 246. [Google Scholar] [CrossRef]
- Zoncu, R.; Efeyan, A.; Sabatini, D.M. mTOR: From growth signal integration to cancer, diabetes and ageing. Nat. Rev. Mol. Cell Biol. 2011, 12, 21–35. [Google Scholar] [CrossRef]
- Hara, K.; Maruki, Y.; Long, X.M.; Yoshino, K.; Oshiro, N.; Hidayat, S.; Tokunaga, C.; Avruch, J.; Yonezawa, K. Raptor, a binding partner of target of rapamycin (TOR), mediates TOR action. Cell 2002, 110, 177–189. [Google Scholar] [CrossRef] [PubMed]
- Yonezawa, K.; Tokunaga, C.; Oshiro, N.; Yoshino, K. Raptor, a binding partner of target of rapamycin. Biochem. Bioph Res. Co. 2004, 313, 437–441. [Google Scholar] [CrossRef] [PubMed]
- Kaizuka, T.; Hara, T.; Oshiro, N.; Kikkawa, U.; Yonezawa, K.; Takehana, K.; Iemura, S.; Natsume, T.; Mizushima, N. Tti1 and Tel2 Are Critical Factors in Mammalian Target of Rapamycin Complex Assembly. J. Biol. Chem. 2010, 285, 20109–20116. [Google Scholar] [CrossRef] [PubMed]
- de Araujo, M.E.G.; Naschberger, A.; Furnrohr, B.G.; Stasyk, T.; Dunzendorfer-Matt, T.; Lechner, S.; Welti, S.; Kremser, L.; Shivalingaiah, G.; Offterdinger, M.; et al. Crystal structure of the human lysosomal mTORC1 scaffold complex and its impact on signaling. Science 2017, 358, 377–381. [Google Scholar] [CrossRef] [PubMed]
- Mochida, S.; Hunt, T. Calcineurin is required to release Xenopus egg extracts from meiotic M phase. Nature 2007, 449, 336–340. [Google Scholar] [CrossRef] [PubMed]
- Yegambaram, M.; Kumar, S.; Wu, X.; Lu, Q.; Sun, X.; Garcia Flores, A.; Meadows, M.L.; Barman, S.; Fulton, D.; Wang, T.; et al. Endothelin-1 acutely increases nitric oxide production via the calcineurin mediated dephosphorylation of Caveolin-1. Nitric Oxide 2023, 140, 50–57. [Google Scholar] [CrossRef]
- Li, H.; Rao, A.; Hogan, P.G. Interaction of calcineurin with substrates and targeting proteins. Trends Cell Biol. 2011, 21, 91–103. [Google Scholar] [CrossRef]
- Liu, Y.V.; Hubbi, M.E.; Pan, F.; McDonald, K.R.; Mansharamani, M.; Cole, R.N.; Liu, J.O.; Semenza, G.L. Calcineurin promotes hypoxia-inducible factor 1alpha expression by dephosphorylating RACK1 and blocking RACK1 dimerization. J. Biol. Chem. 2007, 282, 37064–37073. [Google Scholar] [CrossRef]


| Preincubation Time | IC50 (µM) | |
|---|---|---|
| CsA | SCY-365 | |
| 10 min | 0.30 ± 0.06 | 9.4 ± 16.3 |
| 30 min | 0.16 ± 0.05 | 3.1 ± 3.3 |
| 60 min | 0.12 ± 0.04 | 2.2 ± 1.4 |
| Identified Proteins | Accession Number | Alternative Name | OATP 1B1 | OATP 1B3 |
|---|---|---|---|---|
| Ubiquitin-conjugating enzymes (E2) | ||||
| Ubiquitin-conjugating enzyme E2 Q1 a | UB2Q1_HUMAN | UBE2Q1 | ++ | - |
| Ubiquitin-conjugating enzyme E2 G2 | UB2G2_HUMAN | UBE2G2 | ++ | - |
| Ubiquitin ligases (E3) | ||||
| E3 ubiquitin-protein ligase RNF5 | RNF5_HUMAN | RNF5 | ++ | + |
| E3 ubiquitin-protein ligase HECTD1 | HECD1_HUMAN | HECTD1 | ++ | - |
| E3 ubiquitin-protein ligase AMFR | AMFR_HUMAN | AMFR | ++ | - |
| E3 ubiquitin-protein ligase Itchy homolog | ITCH_HUMAN | ITCH | ++ | - |
| E3 ubiquitin-protein ligase listerin | LTN1_HUMAN | LTN1 | ++ | - |
| E3 ubiquitin-protein ligase RNF126 a | RN126_HUMAN | RNF126 | ++ | + |
| E3 ubiquitin-protein ligase TRIM32 | TRI32_HUMAN | TRIM32 | ++ | - |
| Ubiquitin-protein ligase E3C | UBE3C_HUMAN | UBE3C | ++ | - |
| E3 ubiquitin-protein ligase Praja-1 a | PJA1_HUMAN | PJA1 | ++ | + |
| Ubiquitin conjugation factor E4 A | UBE4A_HUMAN | UBE4A | ++ | - |
| Mitochondrial ubiquitin ligase activator of NFKB 1 | MUL1_HUMAN | MUL1 | + | - |
| Probable E3 ubiquitin-protein ligase HERC1 | HERC1_HUMAN | HERC1 | + | - |
| E3 ubiquitin-protein ligase UBR3 | UBR3_HUMAN | UBR3 | ++ | - |
| Deubiquitinases (DUBs) | ||||
| Ubiquitin carboxyl-terminal hydrolase 24 | UBP24_HUMAN | USP24 | + | + |
| Ubiquitin carboxyl-terminal hydrolase isozymeL1 a | UCHL1_HUMAN | UCHL1 | ++ | + |
| Ubiquitin thioesterase OTUB1 | OTUB1_HUMAN | OTUB1 | ++ | - |
| Identified Proteins | Accession Number | Alternative Name | OATP 1B1 | OATP 1B3 |
|---|---|---|---|---|
| Tyrosine-protein kinase Yes | YES_HUMAN | YES1 | ++ | ++ |
| Tyrosine-protein kinase Fyn | FYN_HUMAN | FYN | ++ | ++ |
| Tyrosine-protein kinase Lyn | LYN_HUMAN | LYN | ++ | ++ |
| Cyclin-dependent kinase 2 | CDK2_HUMAN | CDK2 | ++ | - |
| Cyclin-dependent kinase 4 | CDK4_HUMAN | CDK4 | ++ | - |
| Proto-oncogene tyrosine-protein kinase Src | SRC_HUMAN | SRC | ++ | ++ |
| Non-receptor tyrosine-protein kinase TYK2 | TYK2_HUMAN | TYK2 | ++ | - |
| Serine/threonine-protein kinase VRK2 | VRK2_HUMAN | VRK2 | ++ | - |
| Serine/threonine-protein kinase mTOR | MTOR_HUMAN | MTOR | ++ | + |
| Serine/threonine-protein kinase Nek7 | NEK7_HUMAN | NEK7 | ++ | + |
| Casein kinase I isoform gamma-3 | KC1G3_HUMAN | CSNK1G3 | ++ | ++ |
| Dual specificity mitogen-activated protein kinase kinase 3 | MP2K3_HUMAN | MAP2K3 | ++ | - |
| Serine/threonine-protein kinase LMTK2 | LMTK2_HUMAN | LMTK2 | ++ | - |
| Serine/threonine-protein kinase 17A | ST17A_HUMAN | STK17A | ++ | - |
| Cyclin-G-associated kinase | GAK_HUMAN | GAK | ++ | + |
| STE20/SPS1-related proline-alanine-rich protein kinase | STK39_HUMAN | STK39 | ++ | - |
| G protein-coupled receptor kinase 6 | GRK6_HUMAN | GRK6 | + | + |
| RAC-beta serine/threonine-protein kinase | AKT2_HUMAN | AKT2 | ++ | + |
| Serine/threonine-protein kinase TNNI3K a | TNI3K_HUMAN | TNNI3K | ++ | - |
| 3-phosphoinositide-dependent protein kinase 1 | PDPK1_HUMAN | PDPK1 | ++ | ++ |
| Phosphatidylinositol 4,5-bisphosphate 3-kinase catalytic subunit alpha isoform | PK3CA_HUMAN | PIK3CA | + | + |
| Serine-protein kinase ATM | ATM_HUMAN | ATM | ++ | - |
| Receptor tyrosine-protein kinase erbB-2 | ERBB2_HUMAN | ERBB2 | ++ | - |
| Serine/threonine-protein kinase SMG1 | SMG1_HUMAN | SMG1 | ++ | - |
| Serine/threonine-protein kinase 19 a | STK19_HUMAN | STK19 | + | - |
| TGF-beta receptor type-1 | TGFR1_HUMAN | TGFBR1 | ++ | ++ |
| Bone morphogenetic protein receptor type-2 | BMPR2_HUMAN | BMPR2 | ++ | + |
| Cell division cycle 7-related protein kinase | CDC7_HUMAN | CDC7 | + | - |
Disclaimer/Publisher’s Note: The statements, opinions and data contained in all publications are solely those of the individual author(s) and contributor(s) and not of MDPI and/or the editor(s). MDPI and/or the editor(s) disclaim responsibility for any injury to people or property resulting from any ideas, methods, instructions or products referred to in the content. |
© 2023 by the authors. Licensee MDPI, Basel, Switzerland. This article is an open access article distributed under the terms and conditions of the Creative Commons Attribution (CC BY) license (https://creativecommons.org/licenses/by/4.0/).
Share and Cite
Powell, J.T.; Kayesh, R.; Ballesteros-Perez, A.; Alam, K.; Niyonshuti, P.; Soderblom, E.J.; Ding, K.; Xu, C.; Yue, W. Assessing Trans-Inhibition of OATP1B1 and OATP1B3 by Calcineurin and/or PPIase Inhibitors and Global Identification of OATP1B1/3-Associated Proteins. Pharmaceutics 2024, 16, 63. https://doi.org/10.3390/pharmaceutics16010063
Powell JT, Kayesh R, Ballesteros-Perez A, Alam K, Niyonshuti P, Soderblom EJ, Ding K, Xu C, Yue W. Assessing Trans-Inhibition of OATP1B1 and OATP1B3 by Calcineurin and/or PPIase Inhibitors and Global Identification of OATP1B1/3-Associated Proteins. Pharmaceutics. 2024; 16(1):63. https://doi.org/10.3390/pharmaceutics16010063
Chicago/Turabian StylePowell, John T., Ruhul Kayesh, Alexandra Ballesteros-Perez, Khondoker Alam, Pascaline Niyonshuti, Erik J. Soderblom, Kai Ding, Chao Xu, and Wei Yue. 2024. "Assessing Trans-Inhibition of OATP1B1 and OATP1B3 by Calcineurin and/or PPIase Inhibitors and Global Identification of OATP1B1/3-Associated Proteins" Pharmaceutics 16, no. 1: 63. https://doi.org/10.3390/pharmaceutics16010063