
Leveraging Physiologically Based Modelling to Provide Insights on the Absorption of Paliperidone Extended-Release Formulation under Fed and Fasting Conditions

 , , , and
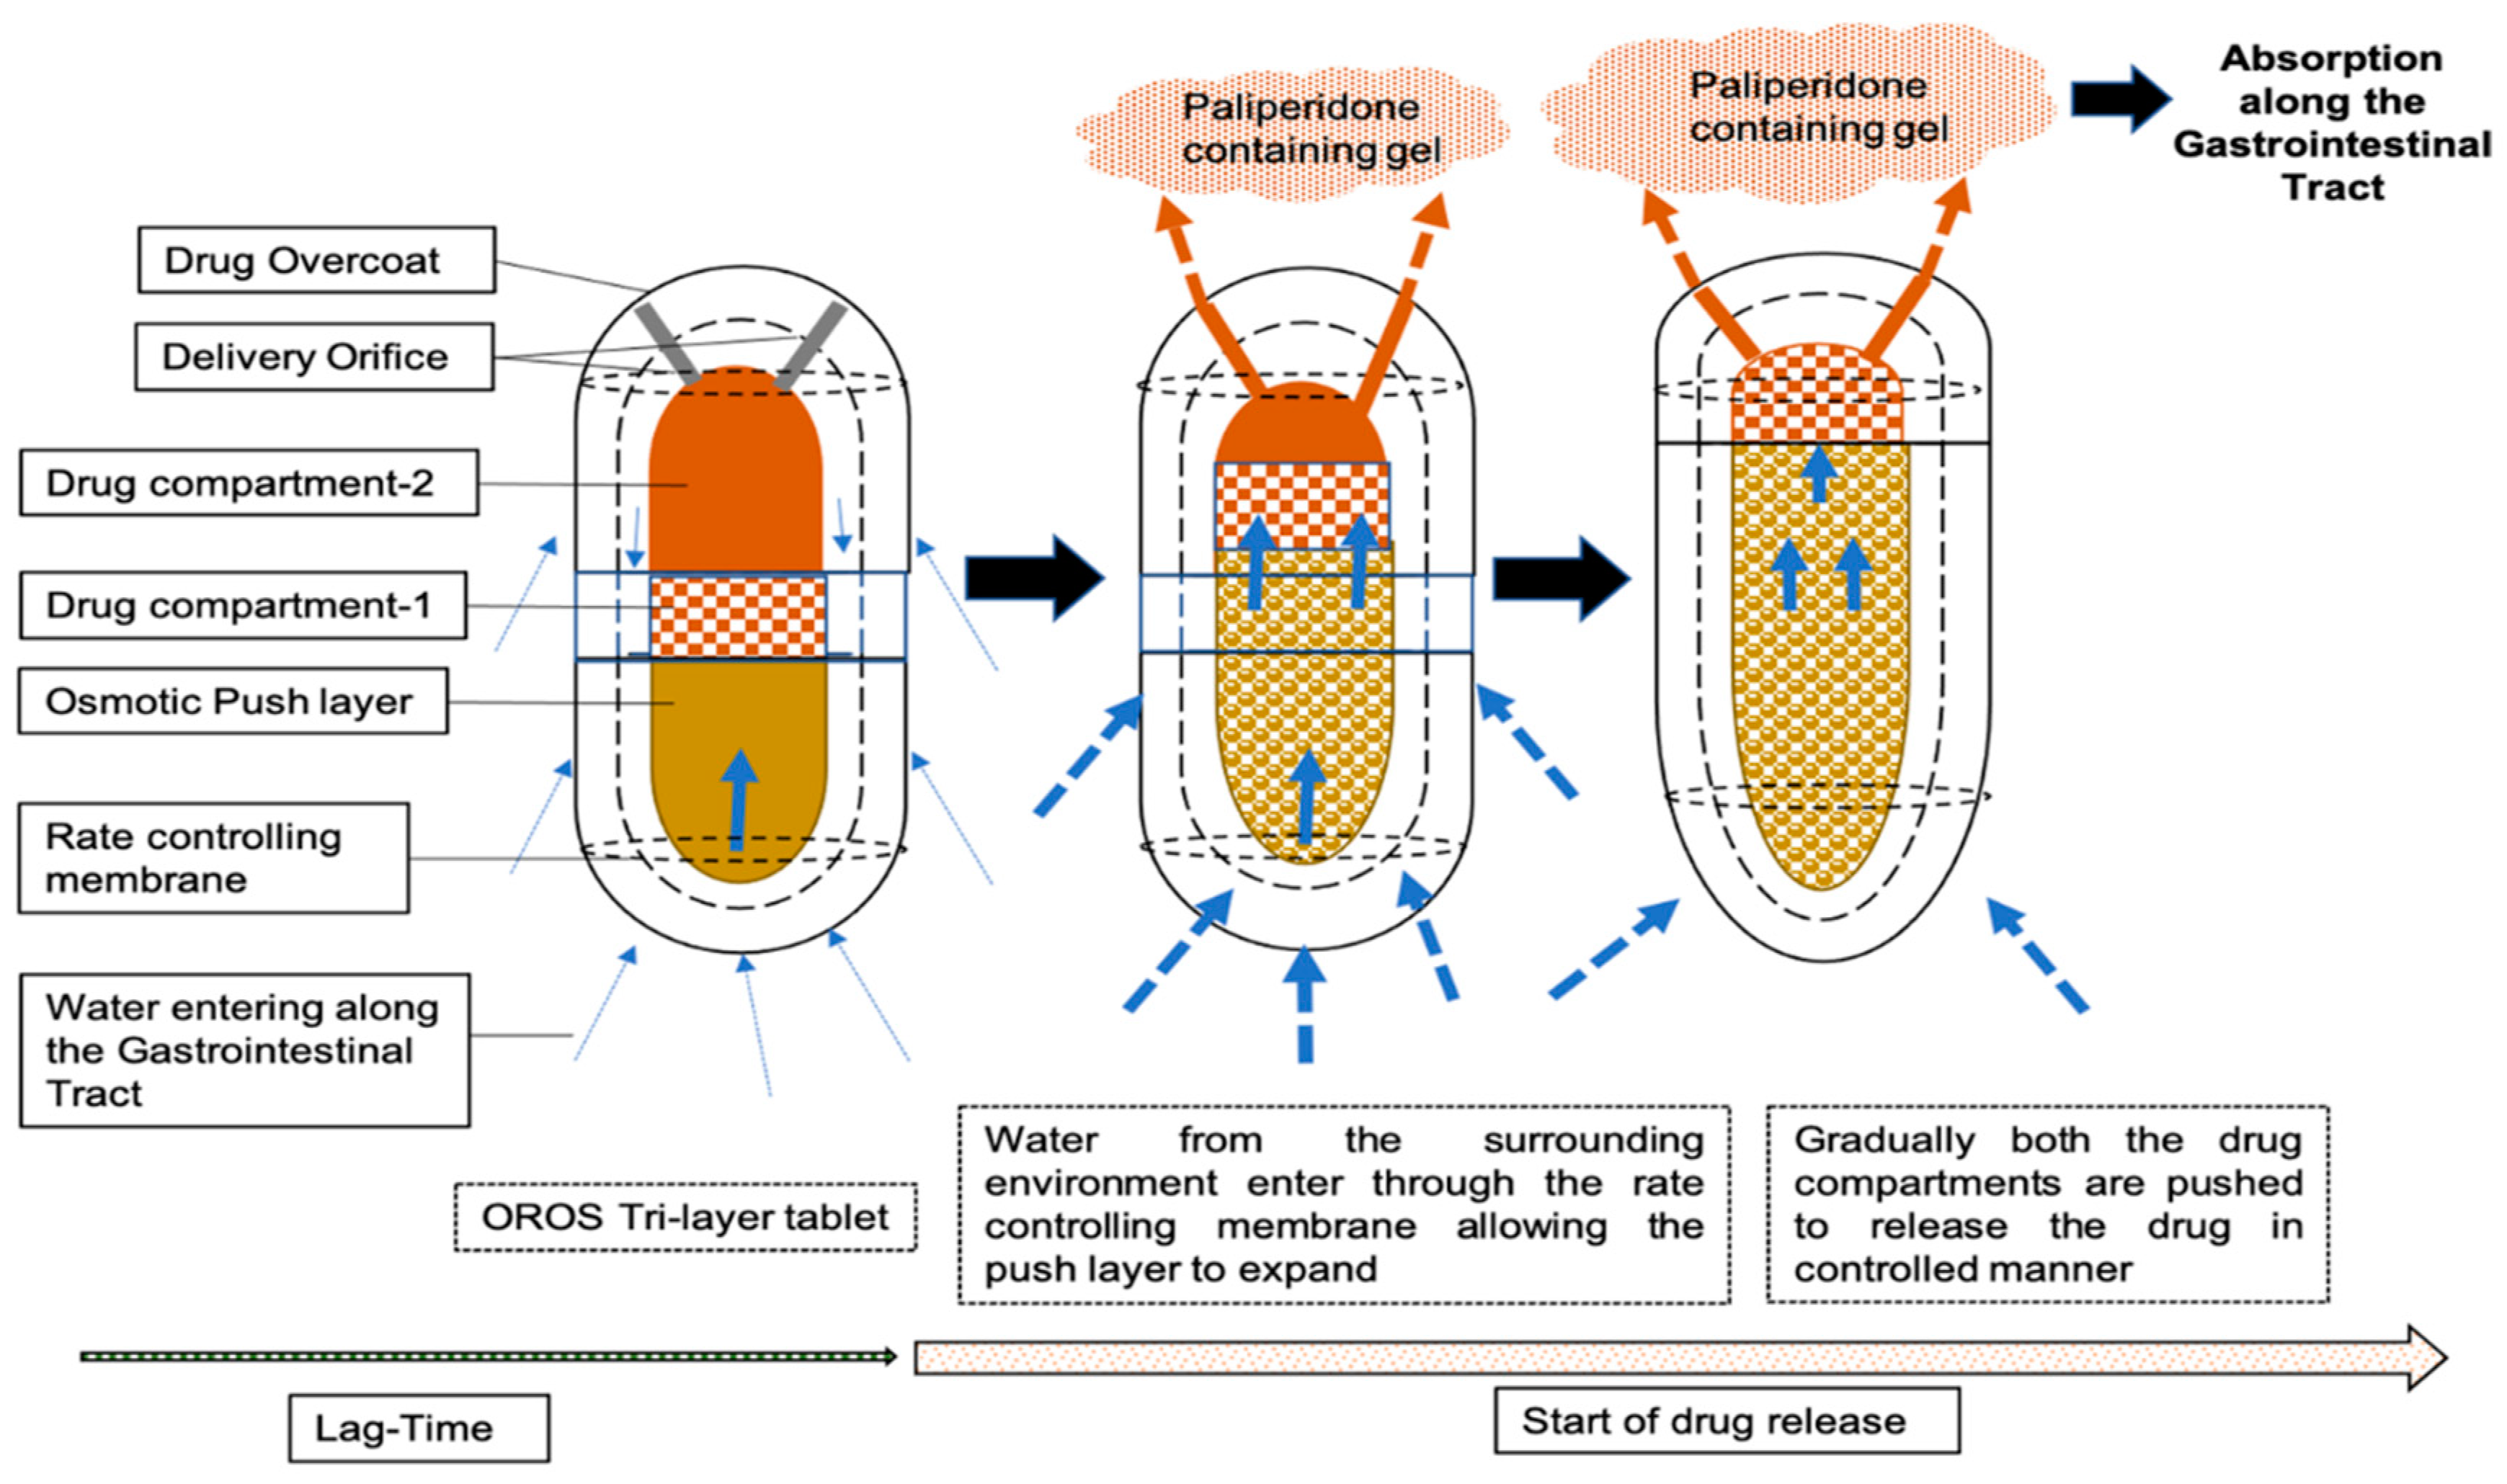
Abstract
:1. Introduction
2. Materials and Methods
2.1. Description of Dosage Form and Dissolution Data Input
2.2. Clinical PK Study Data
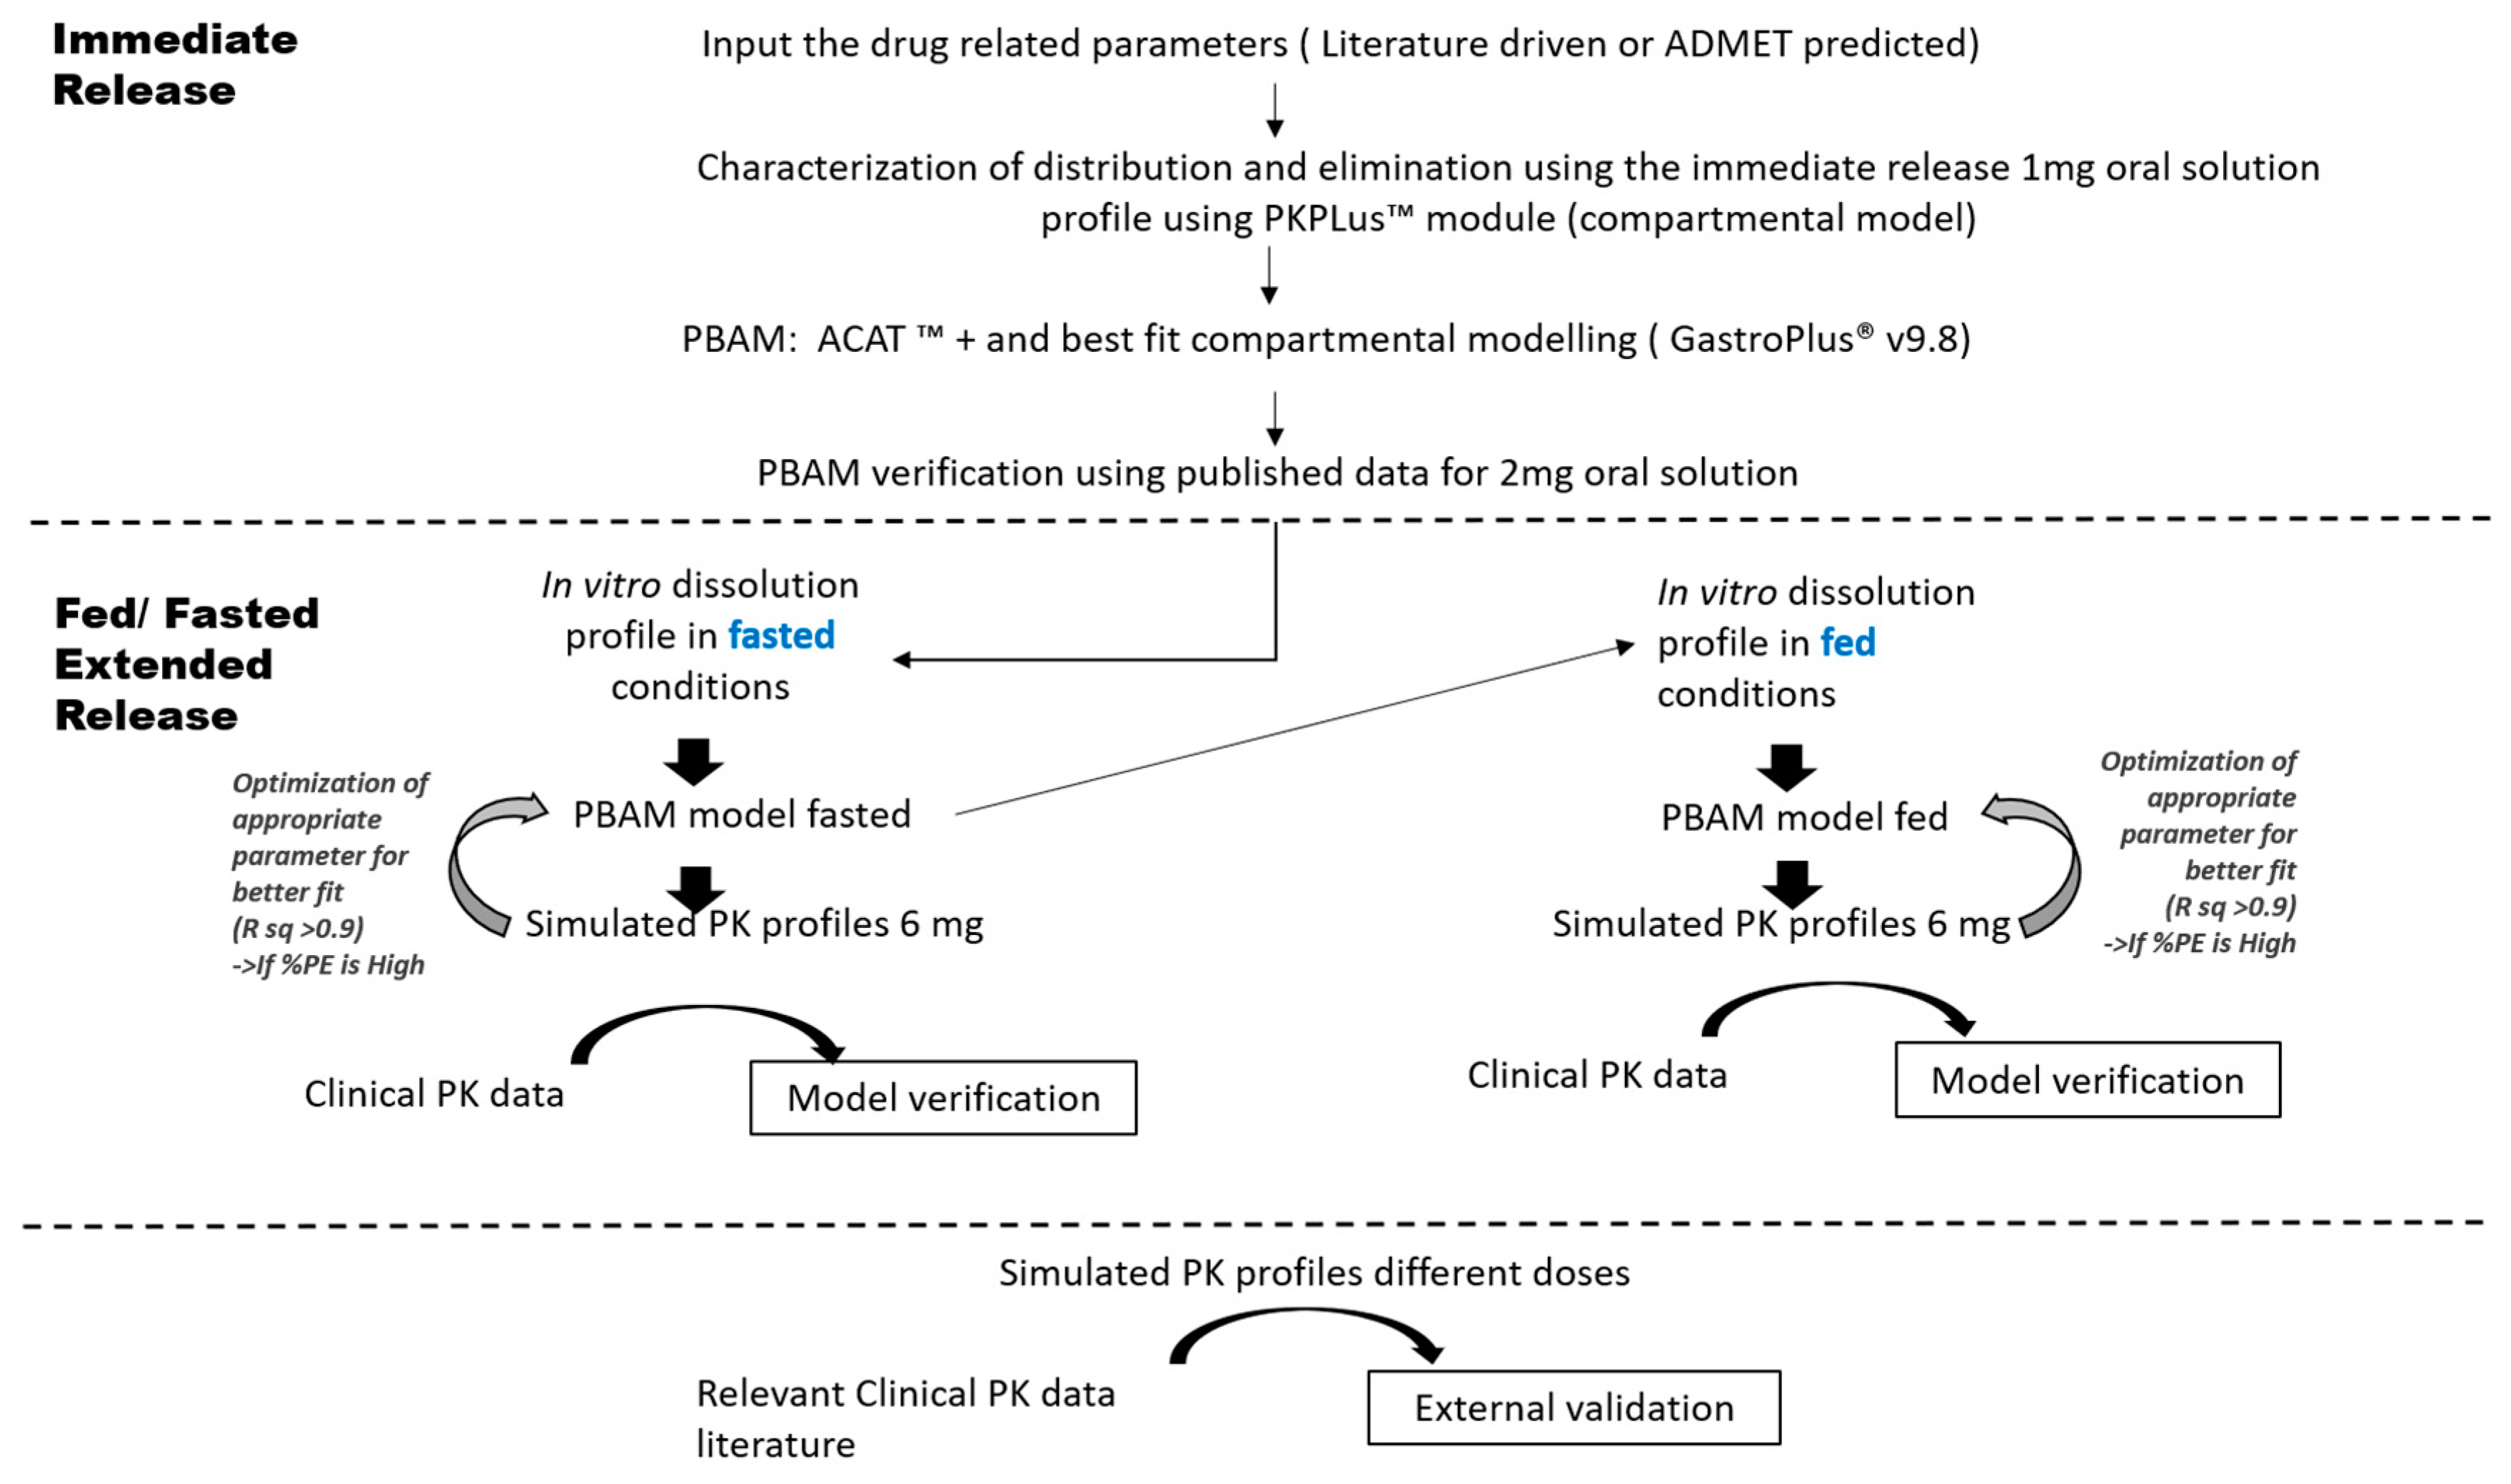
2.3. PBAM Model Development, Verification and Validation
2.4. Model Application: Virtual Population Simulations
3. Results
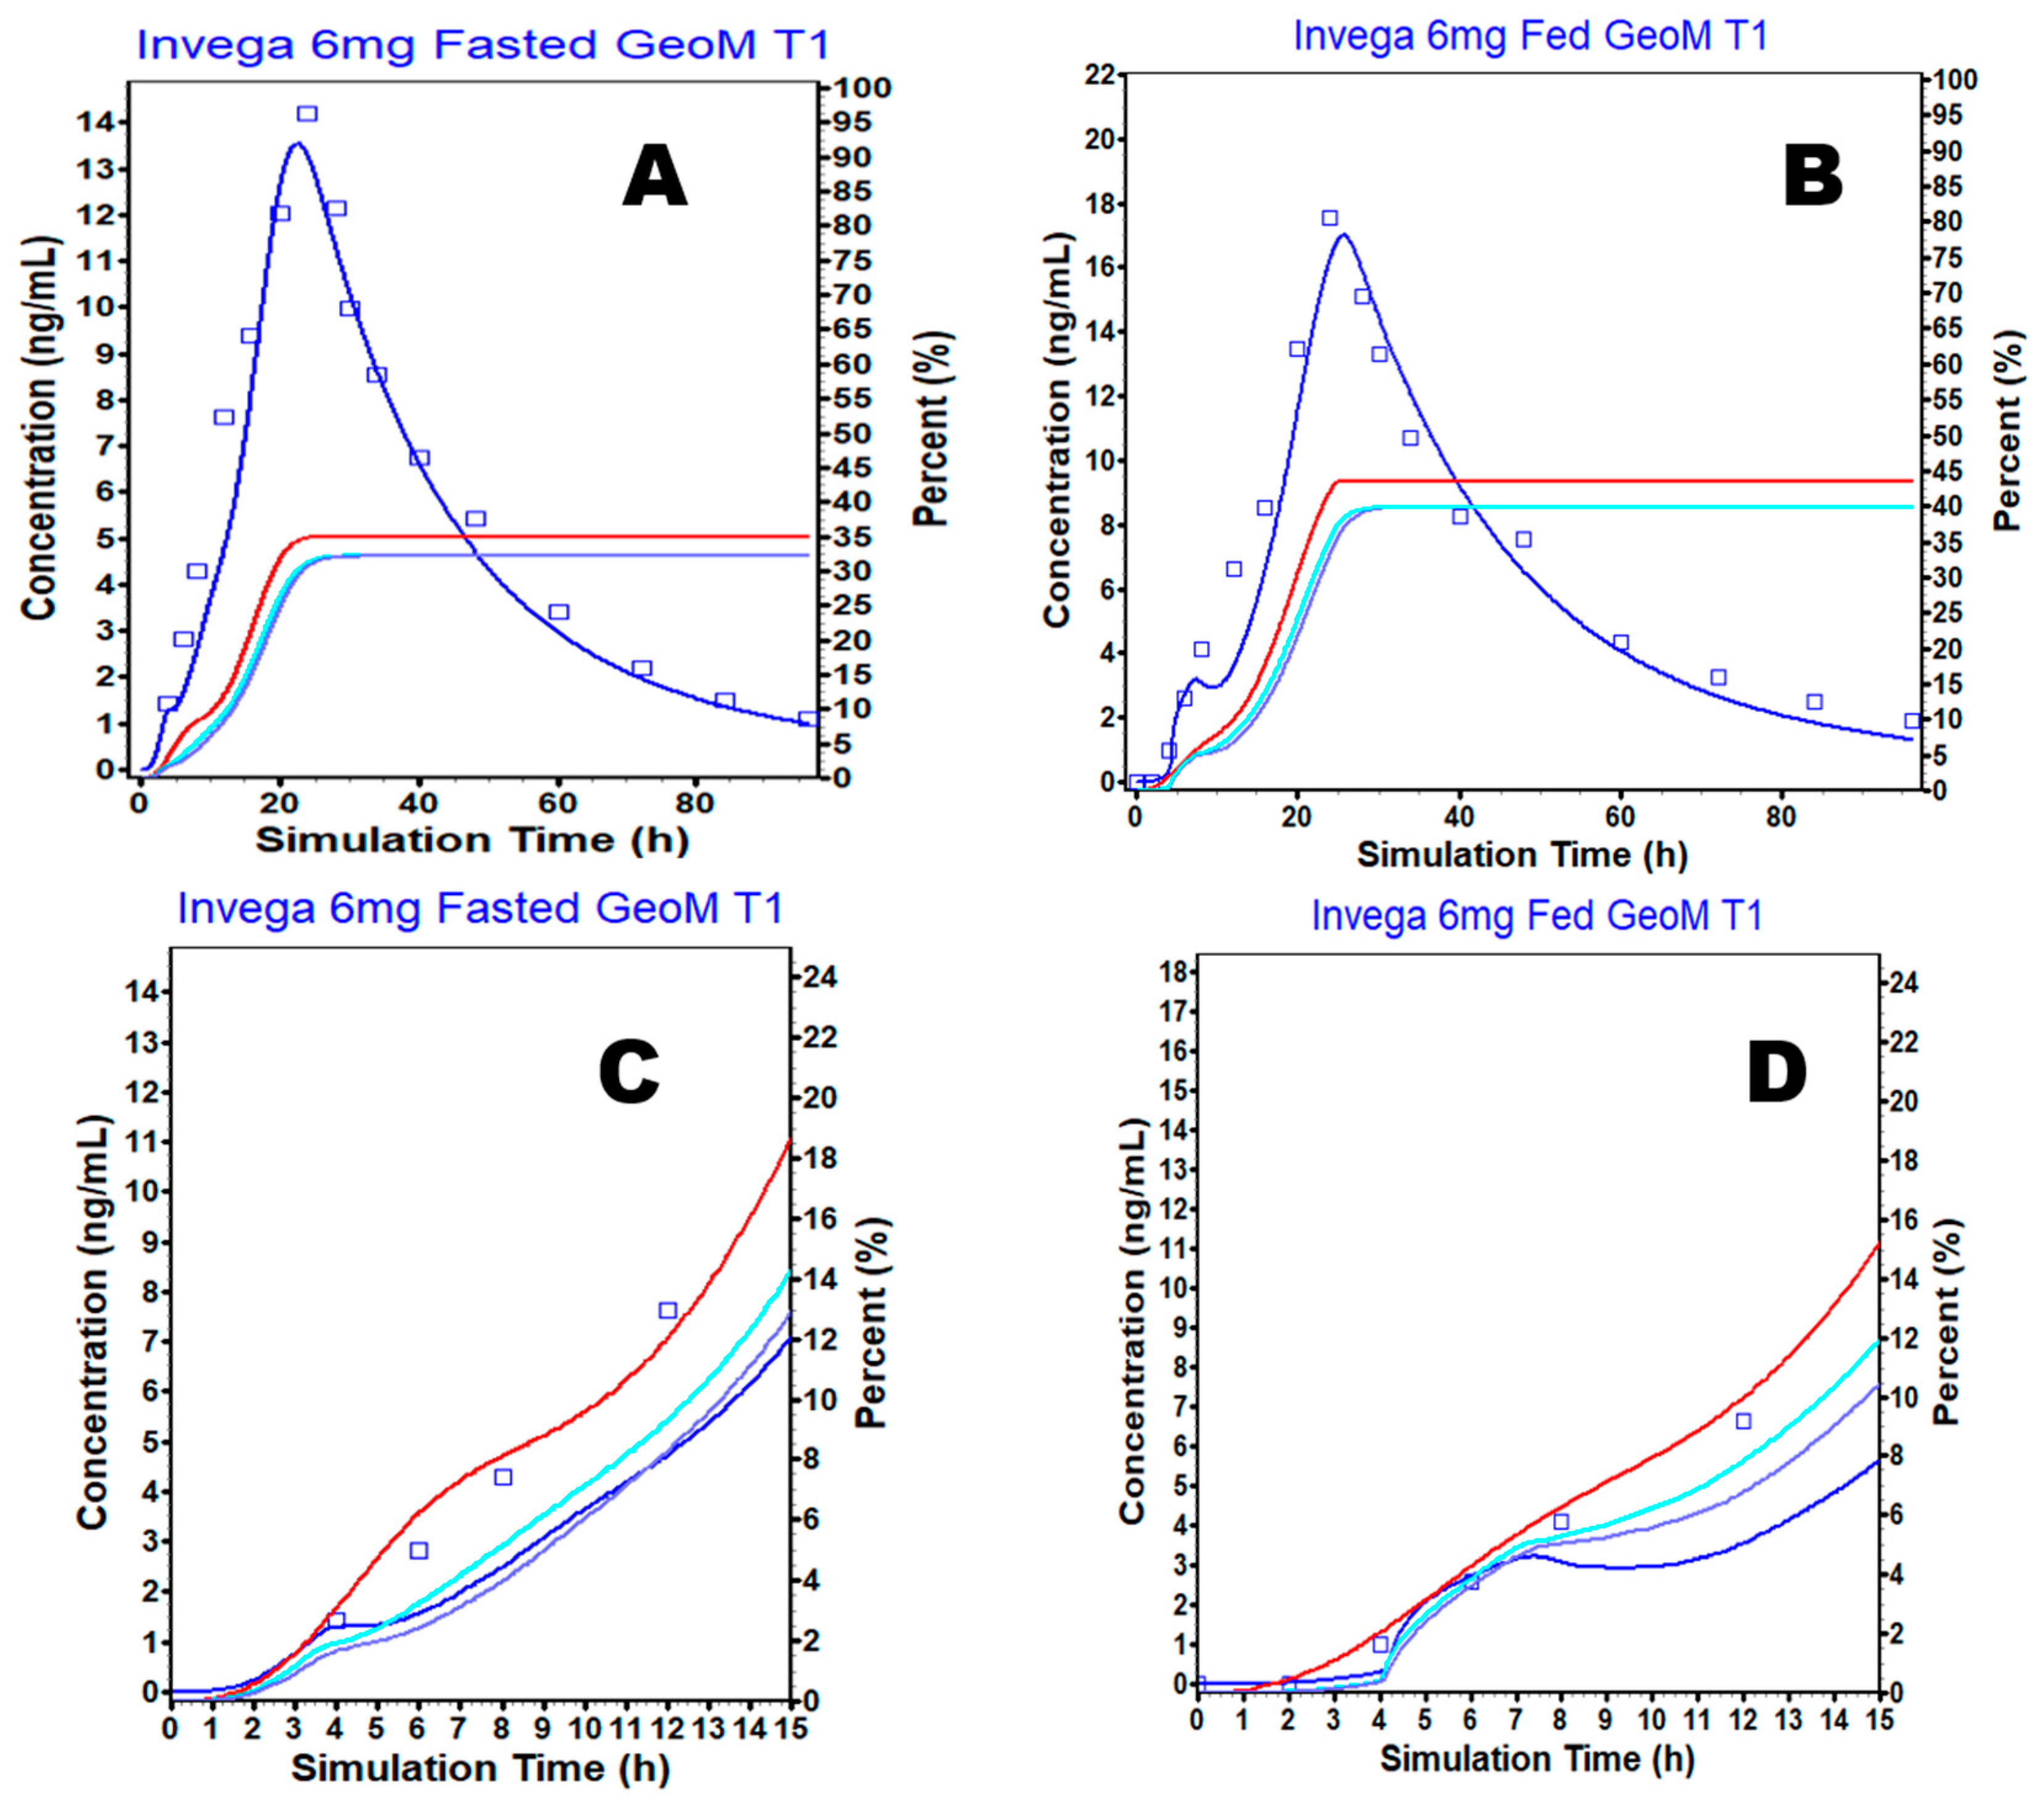
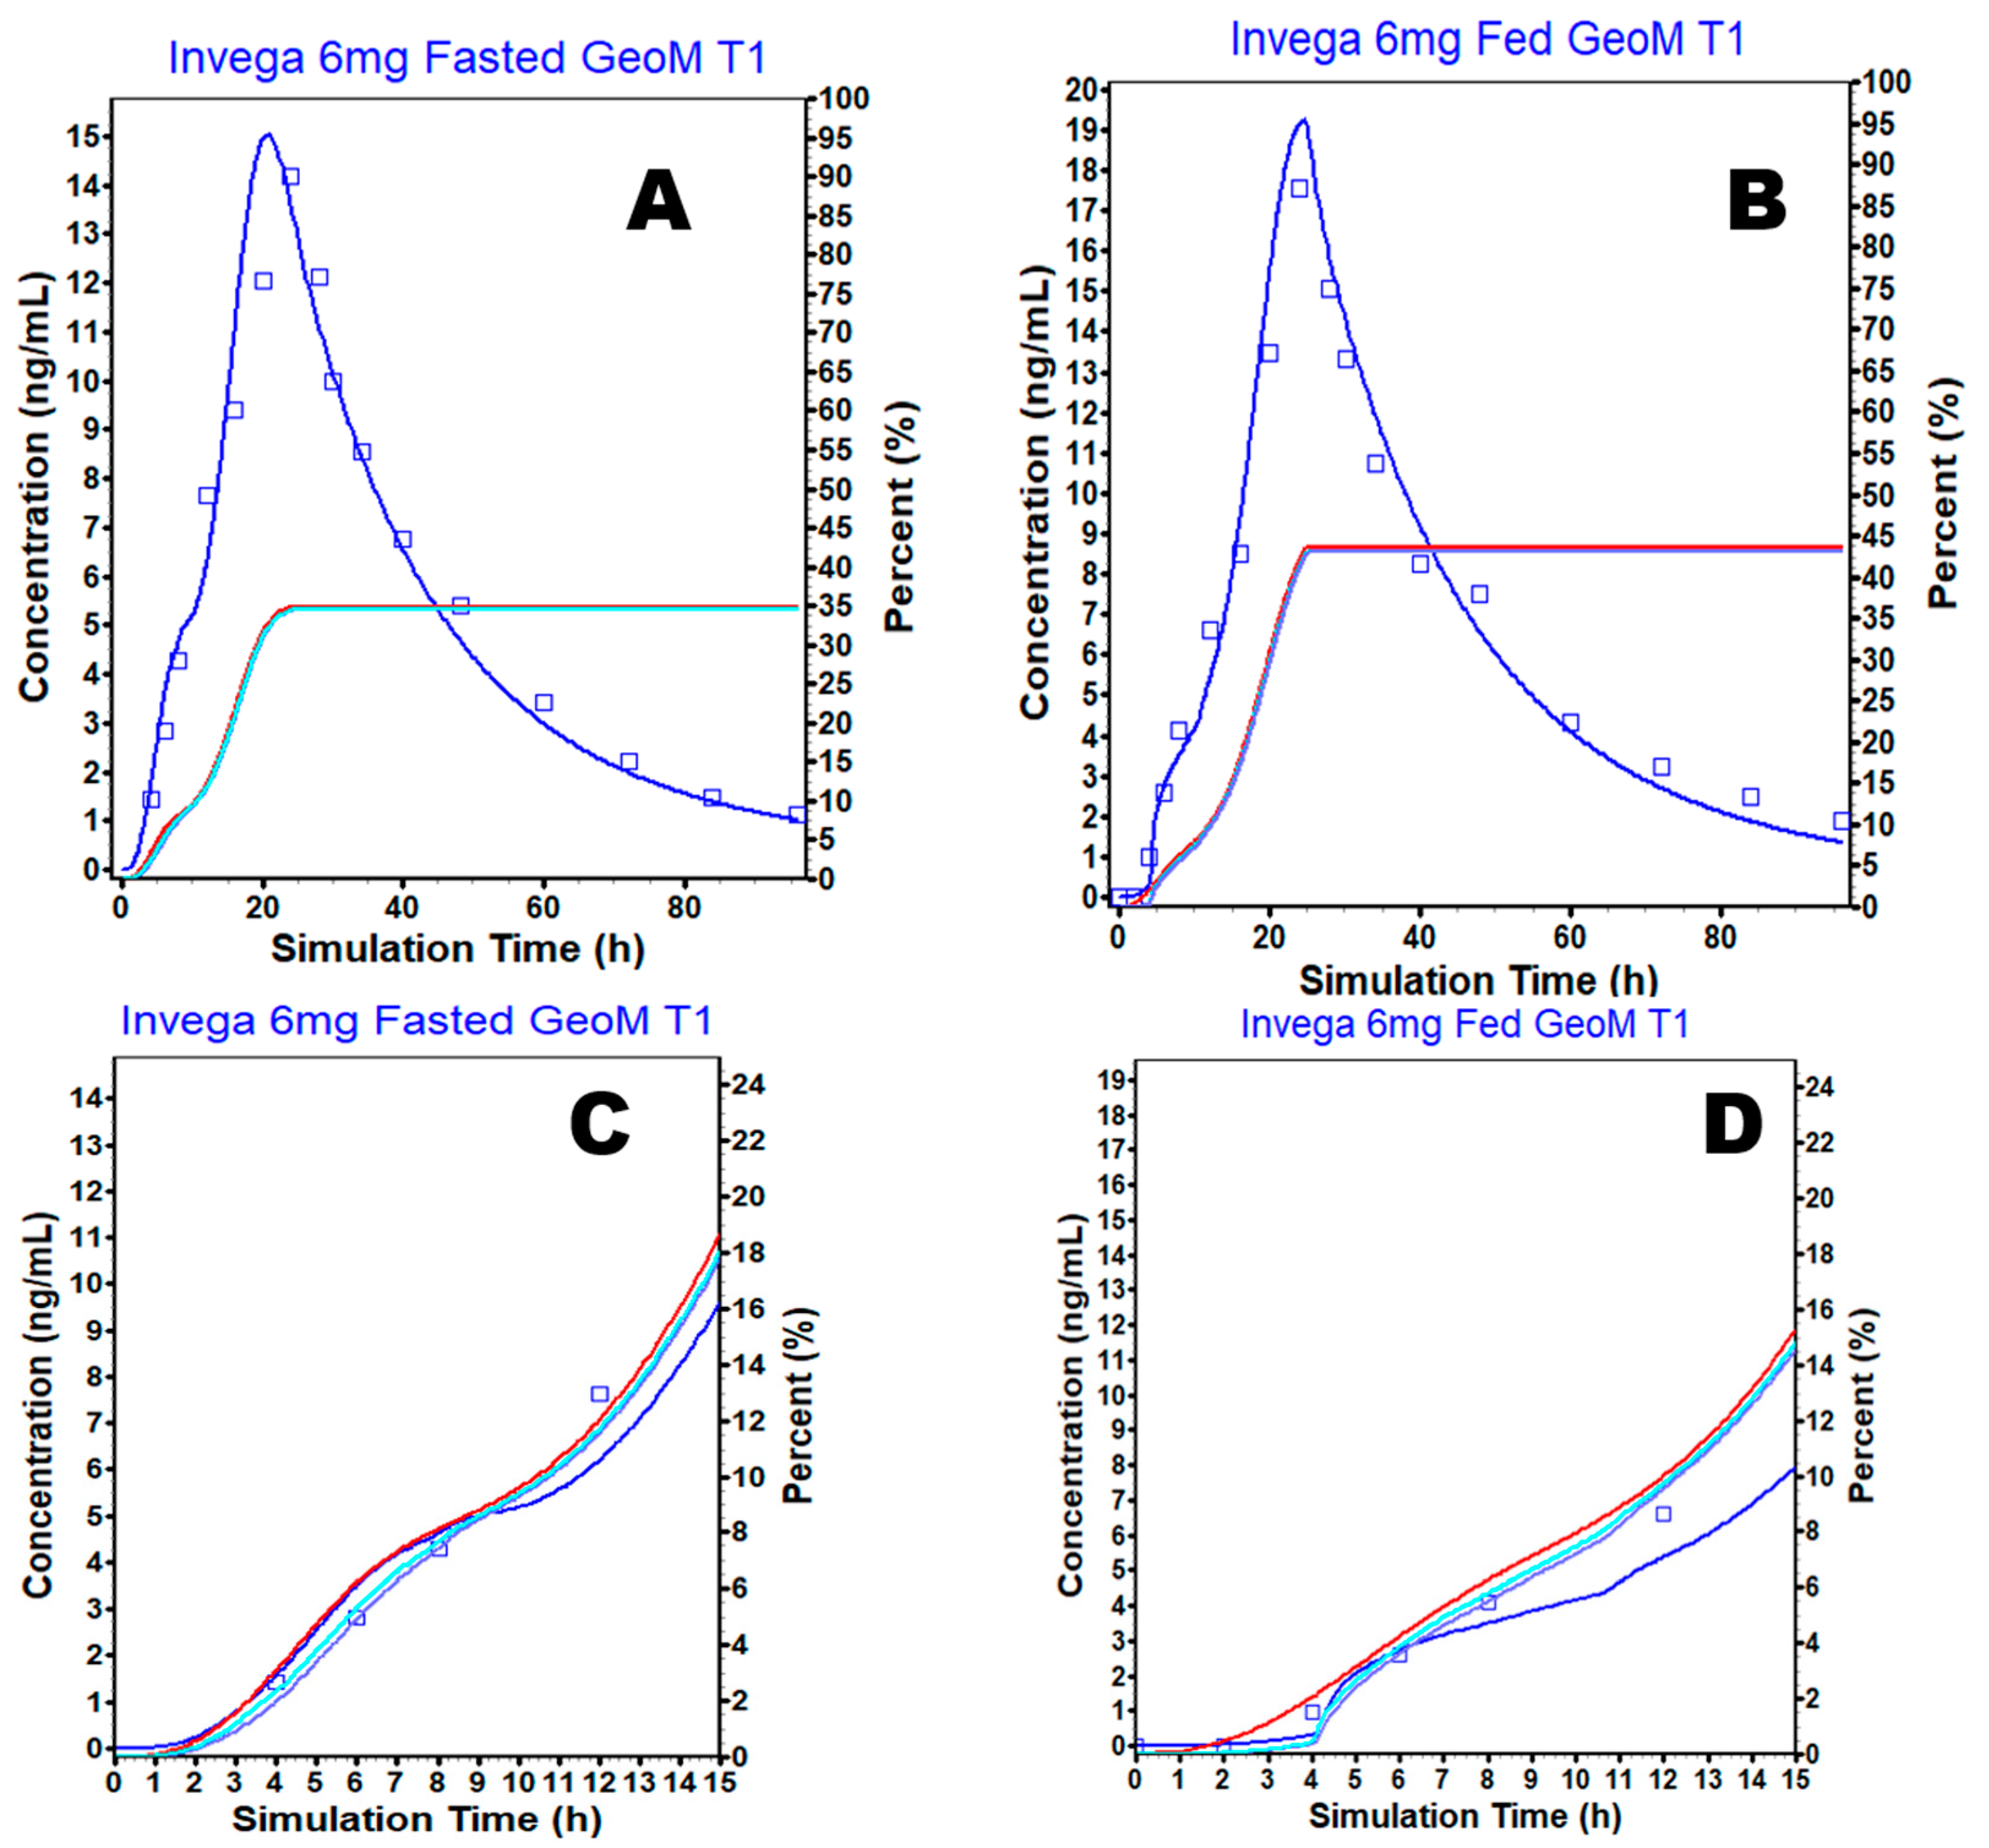
3.1. Physiologically Based Absorption Model for the Oral Solution and ER OROS Formulation
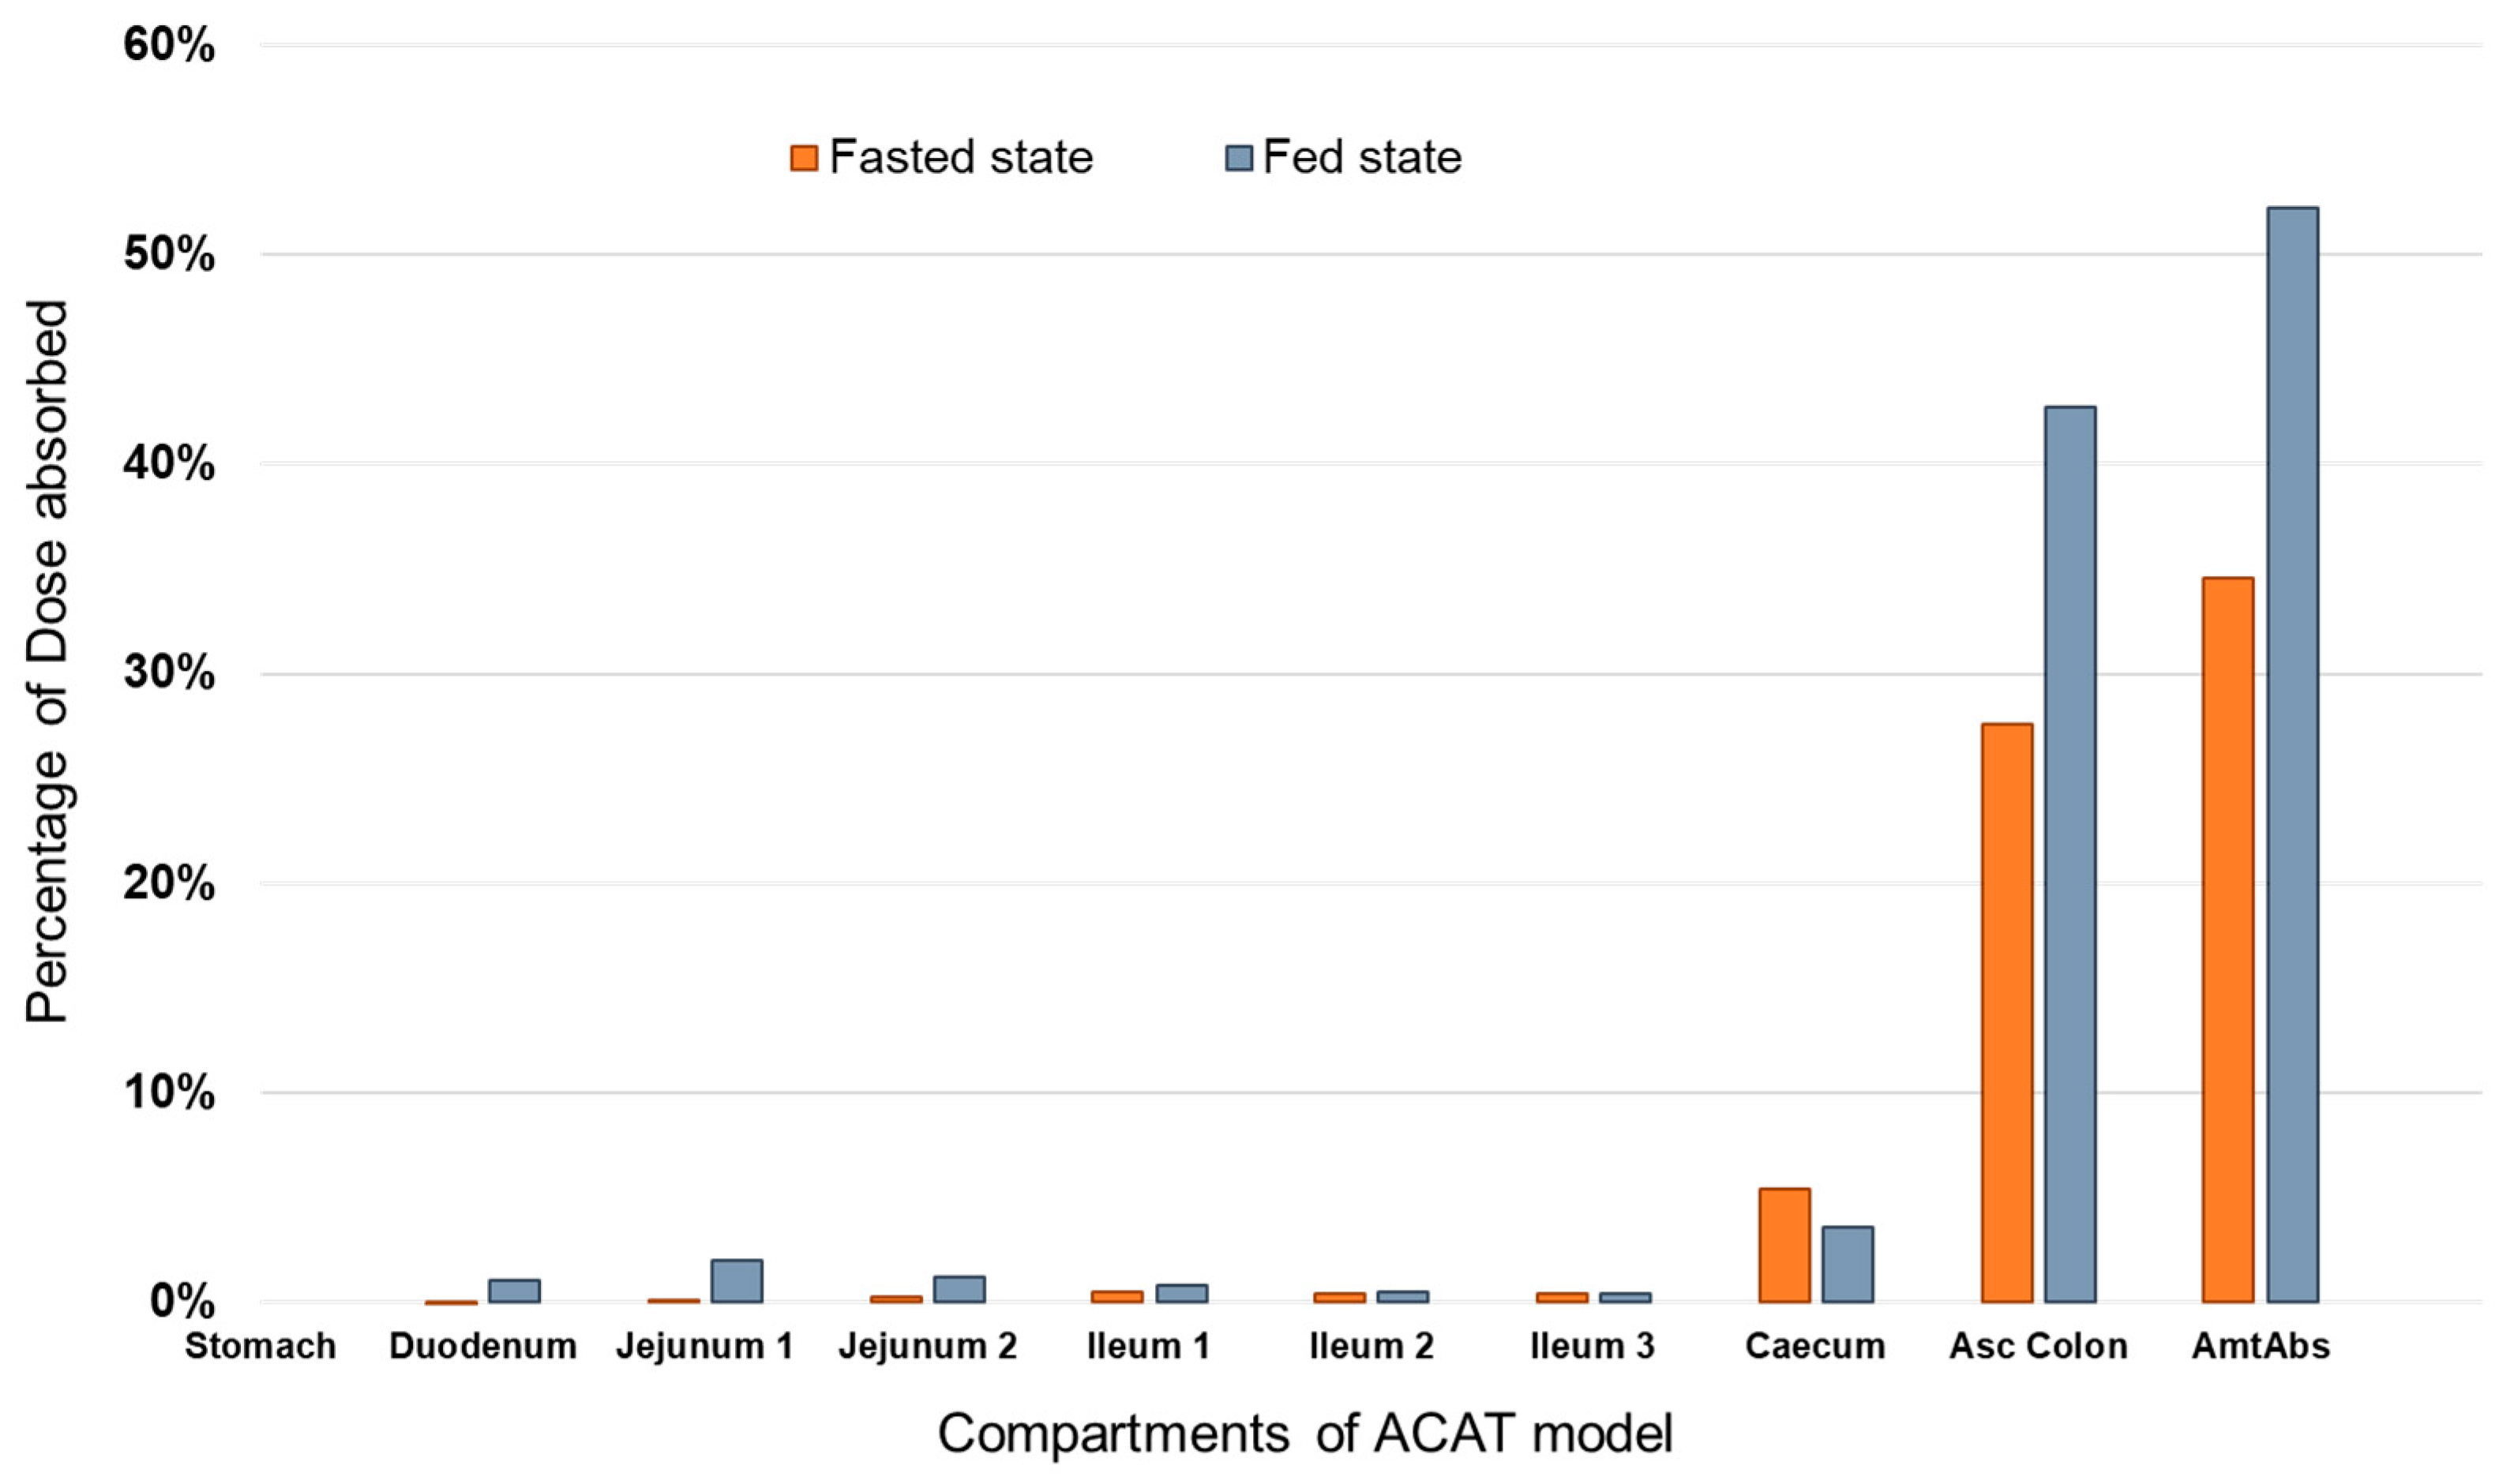
3.2. Prediction of PAL Regional Absorption from the Different Formulations
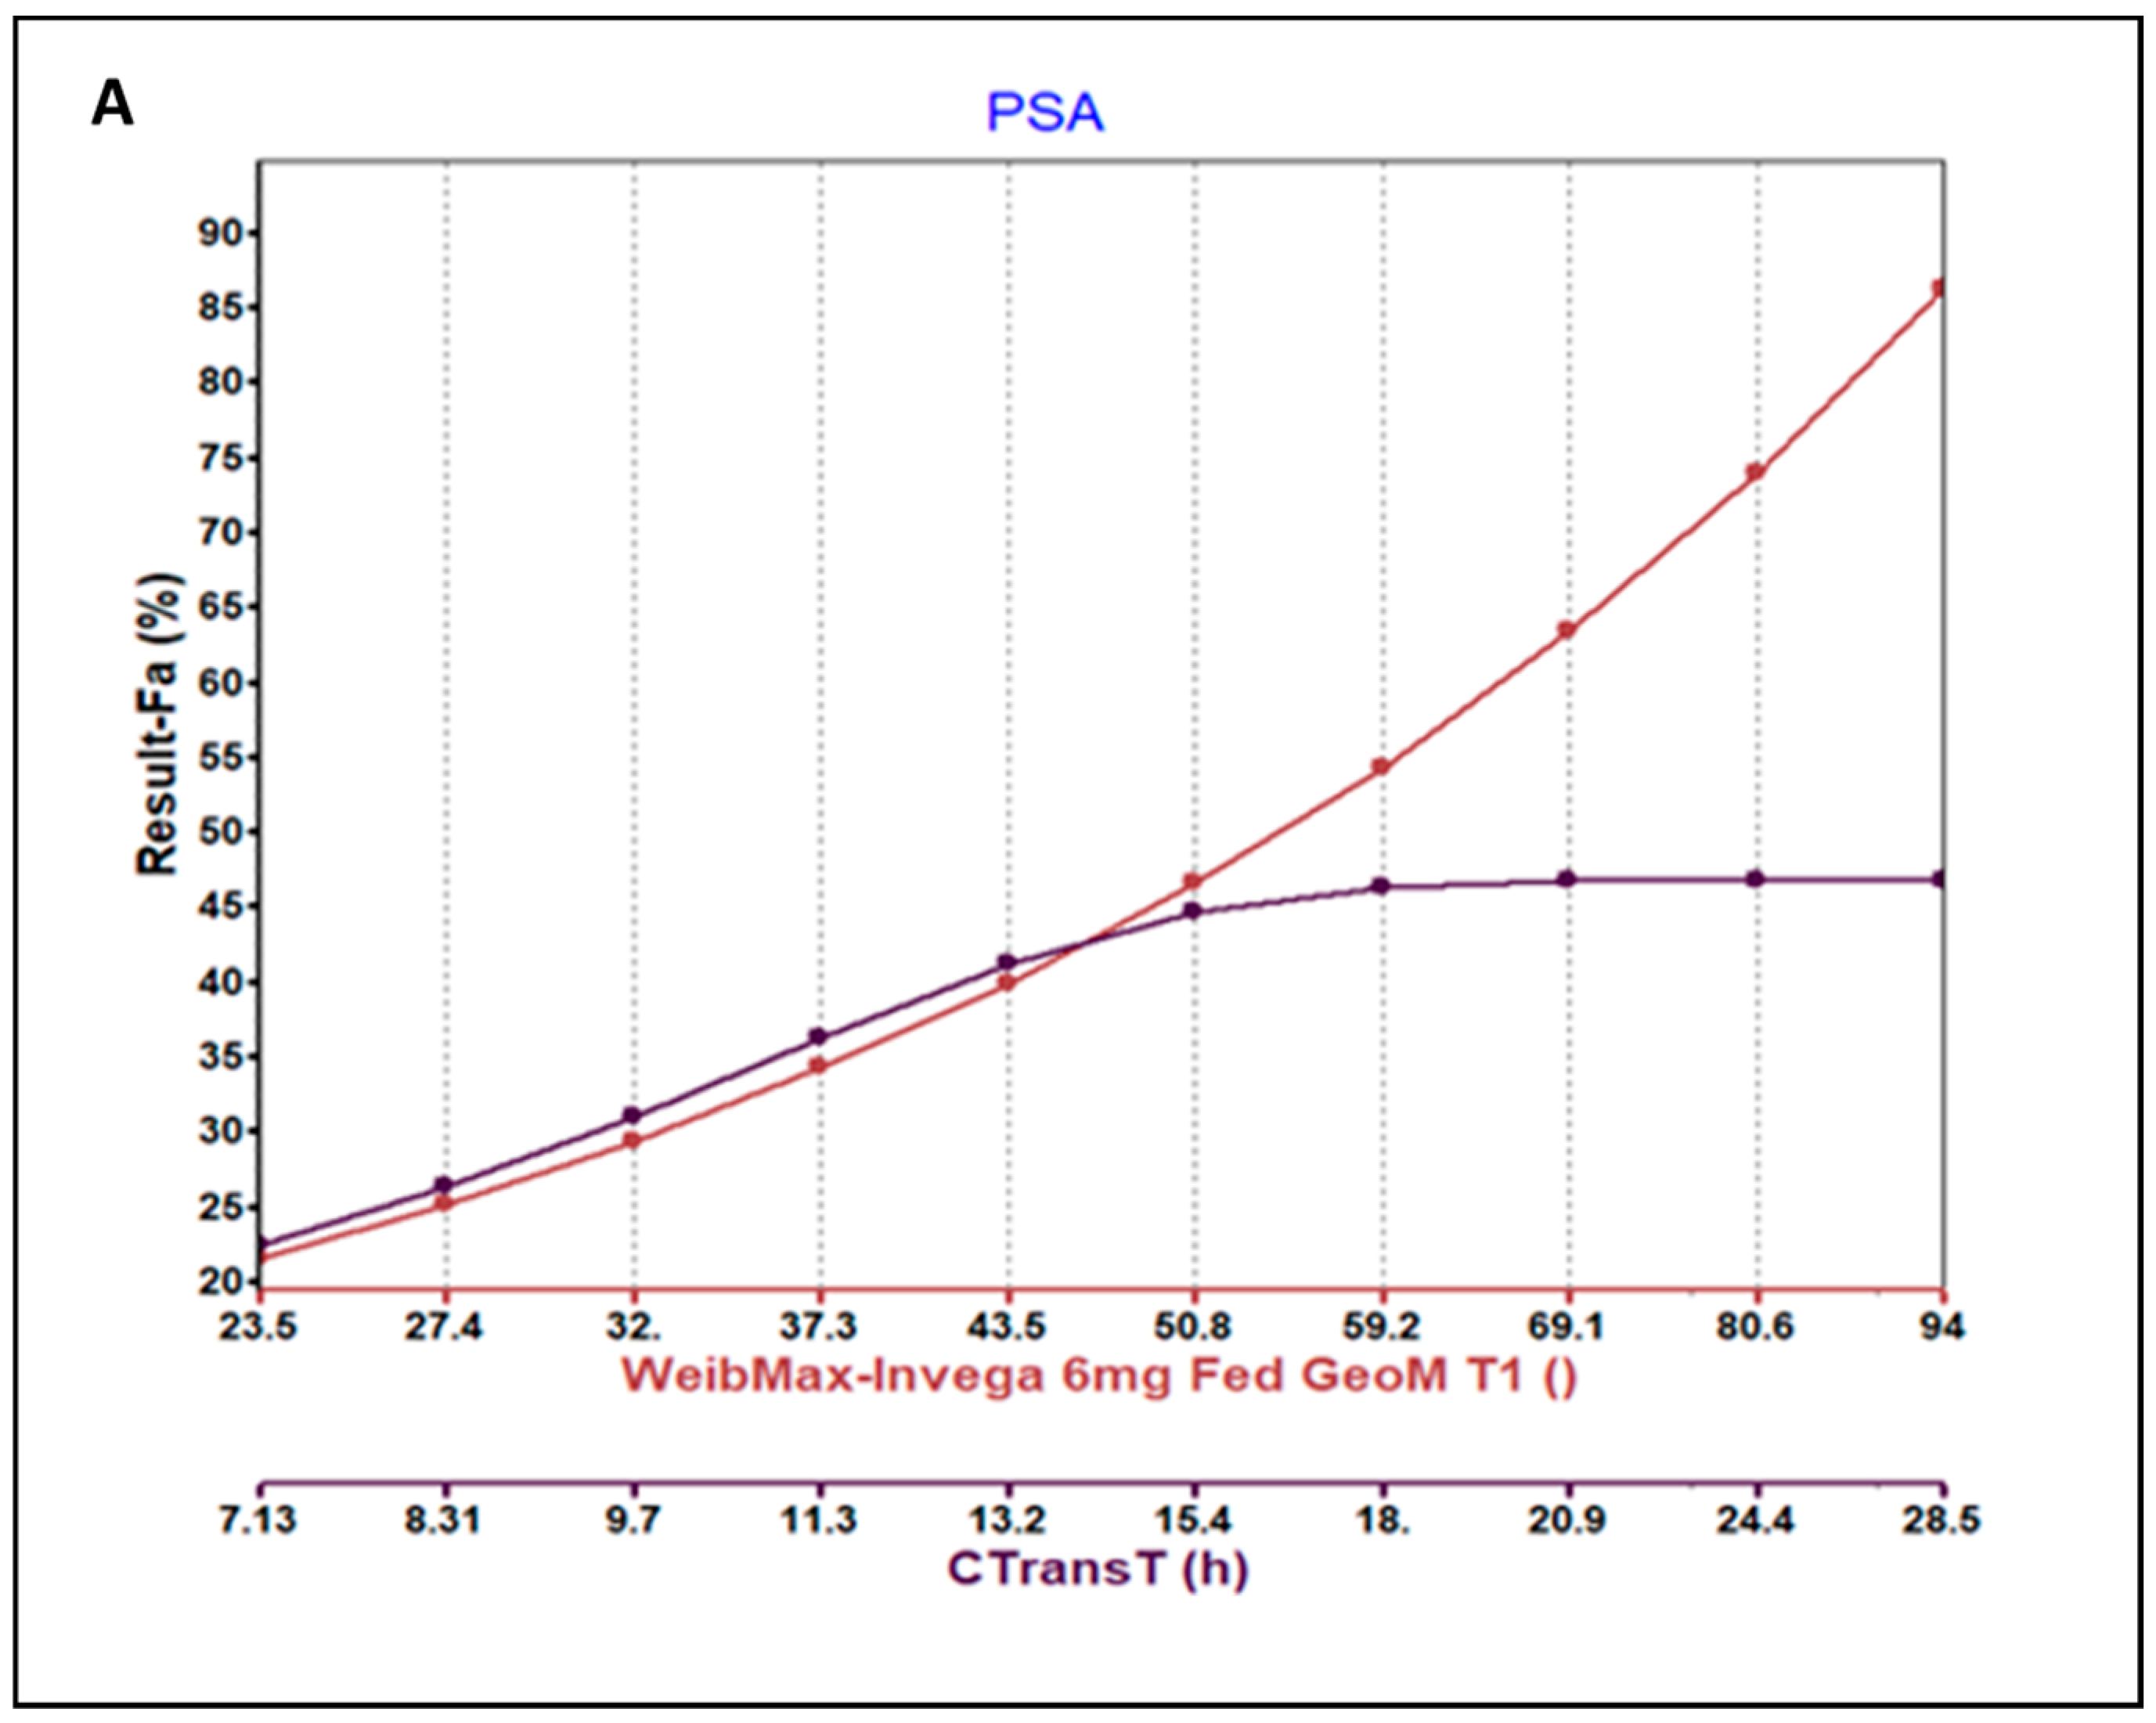
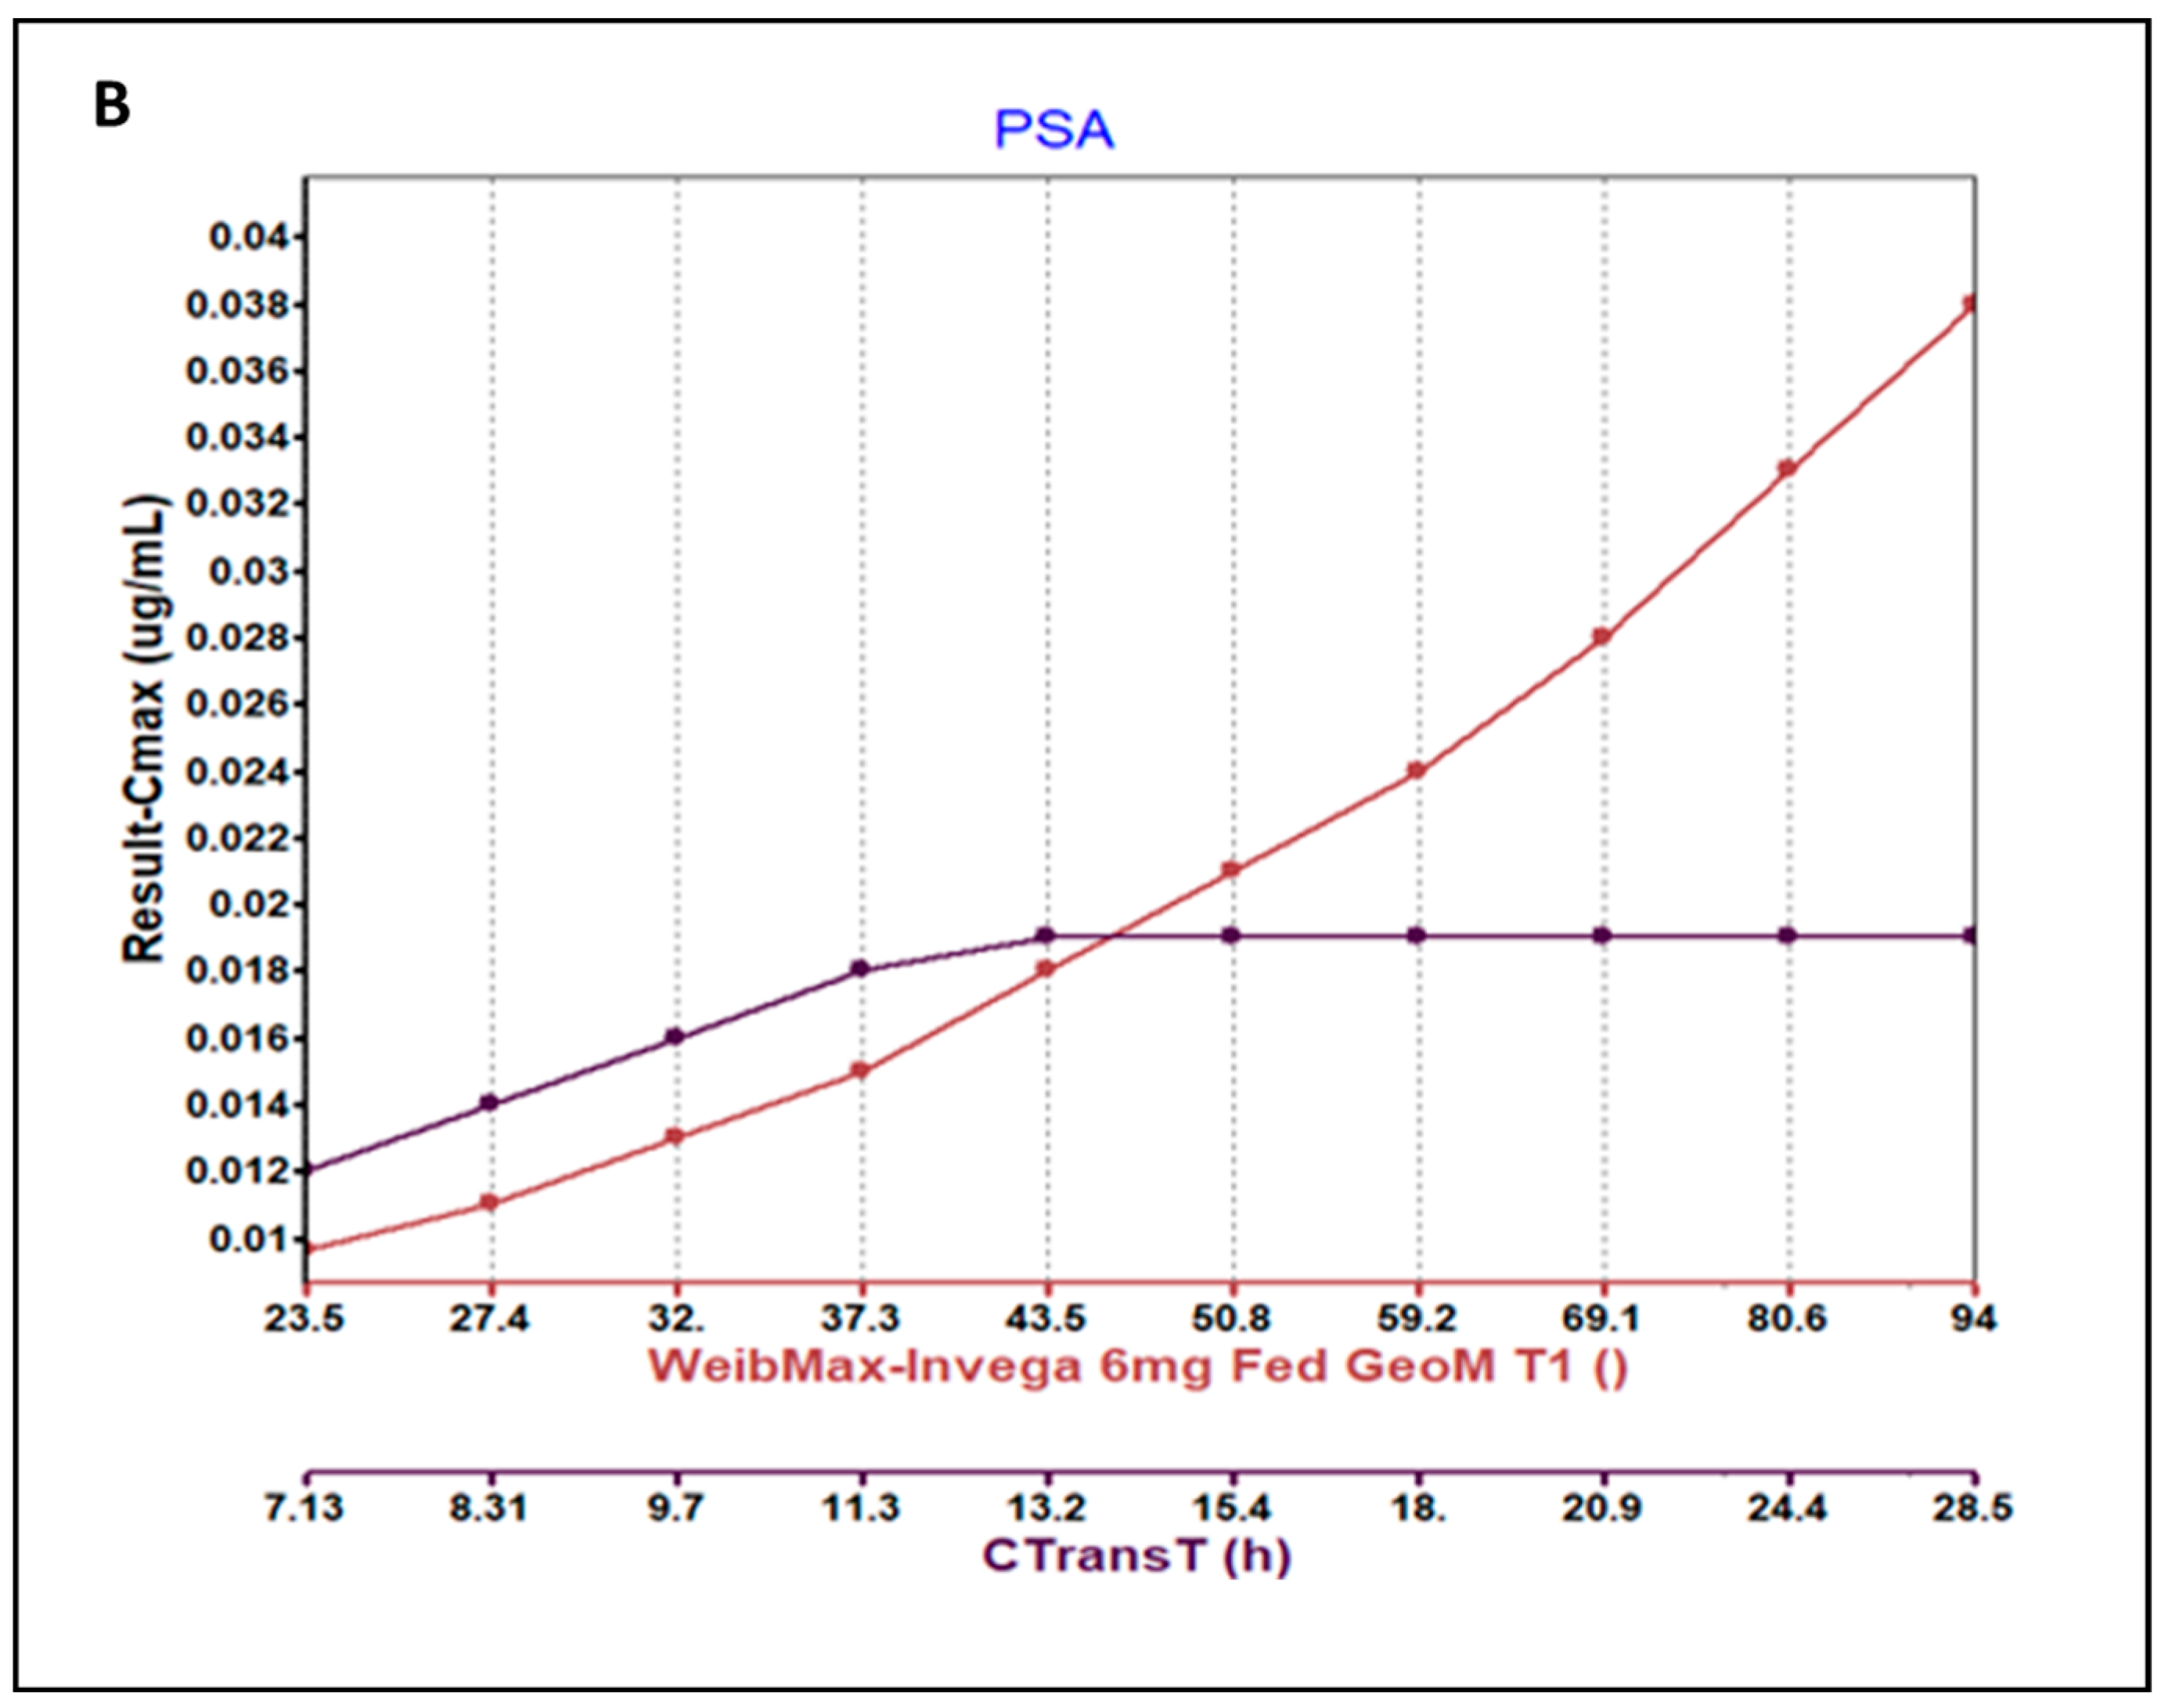
3.3. Parameter Sensitivity Analysis (PSA) of the Developed Model
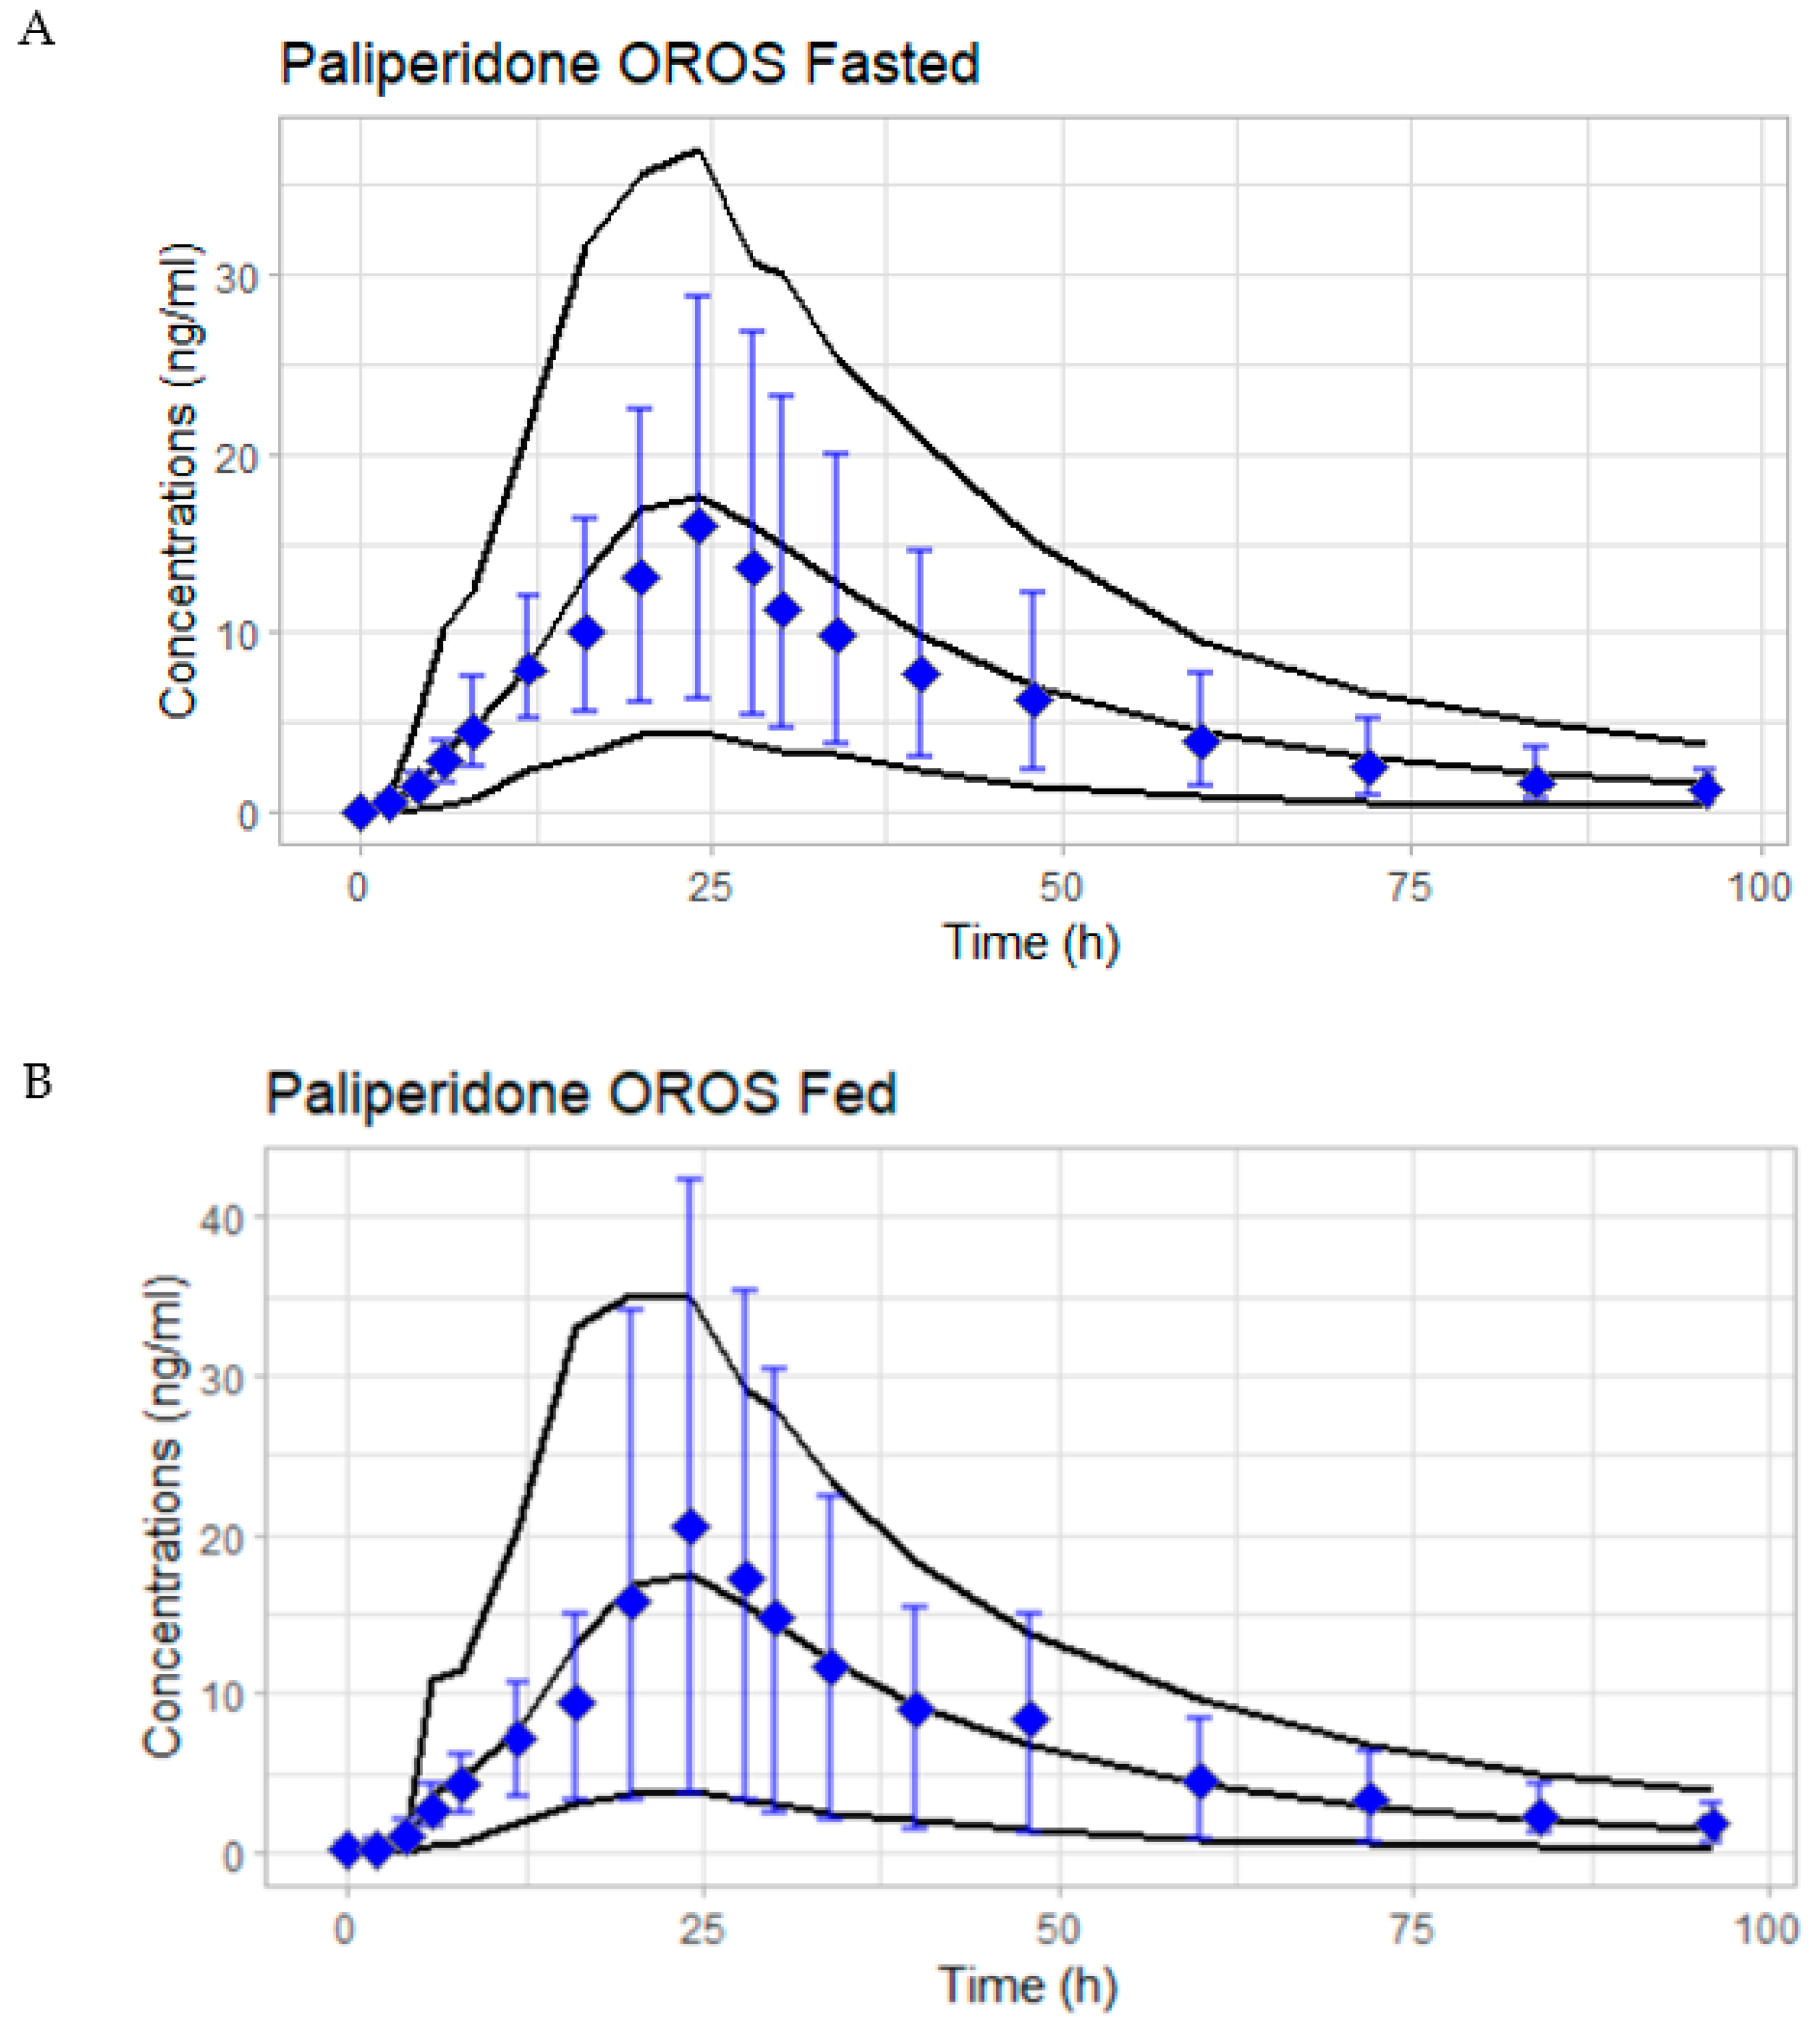
3.4. External Validation
3.5. Simulation Based Evaluation of PAL Variability in Fed and Fasted Conditions
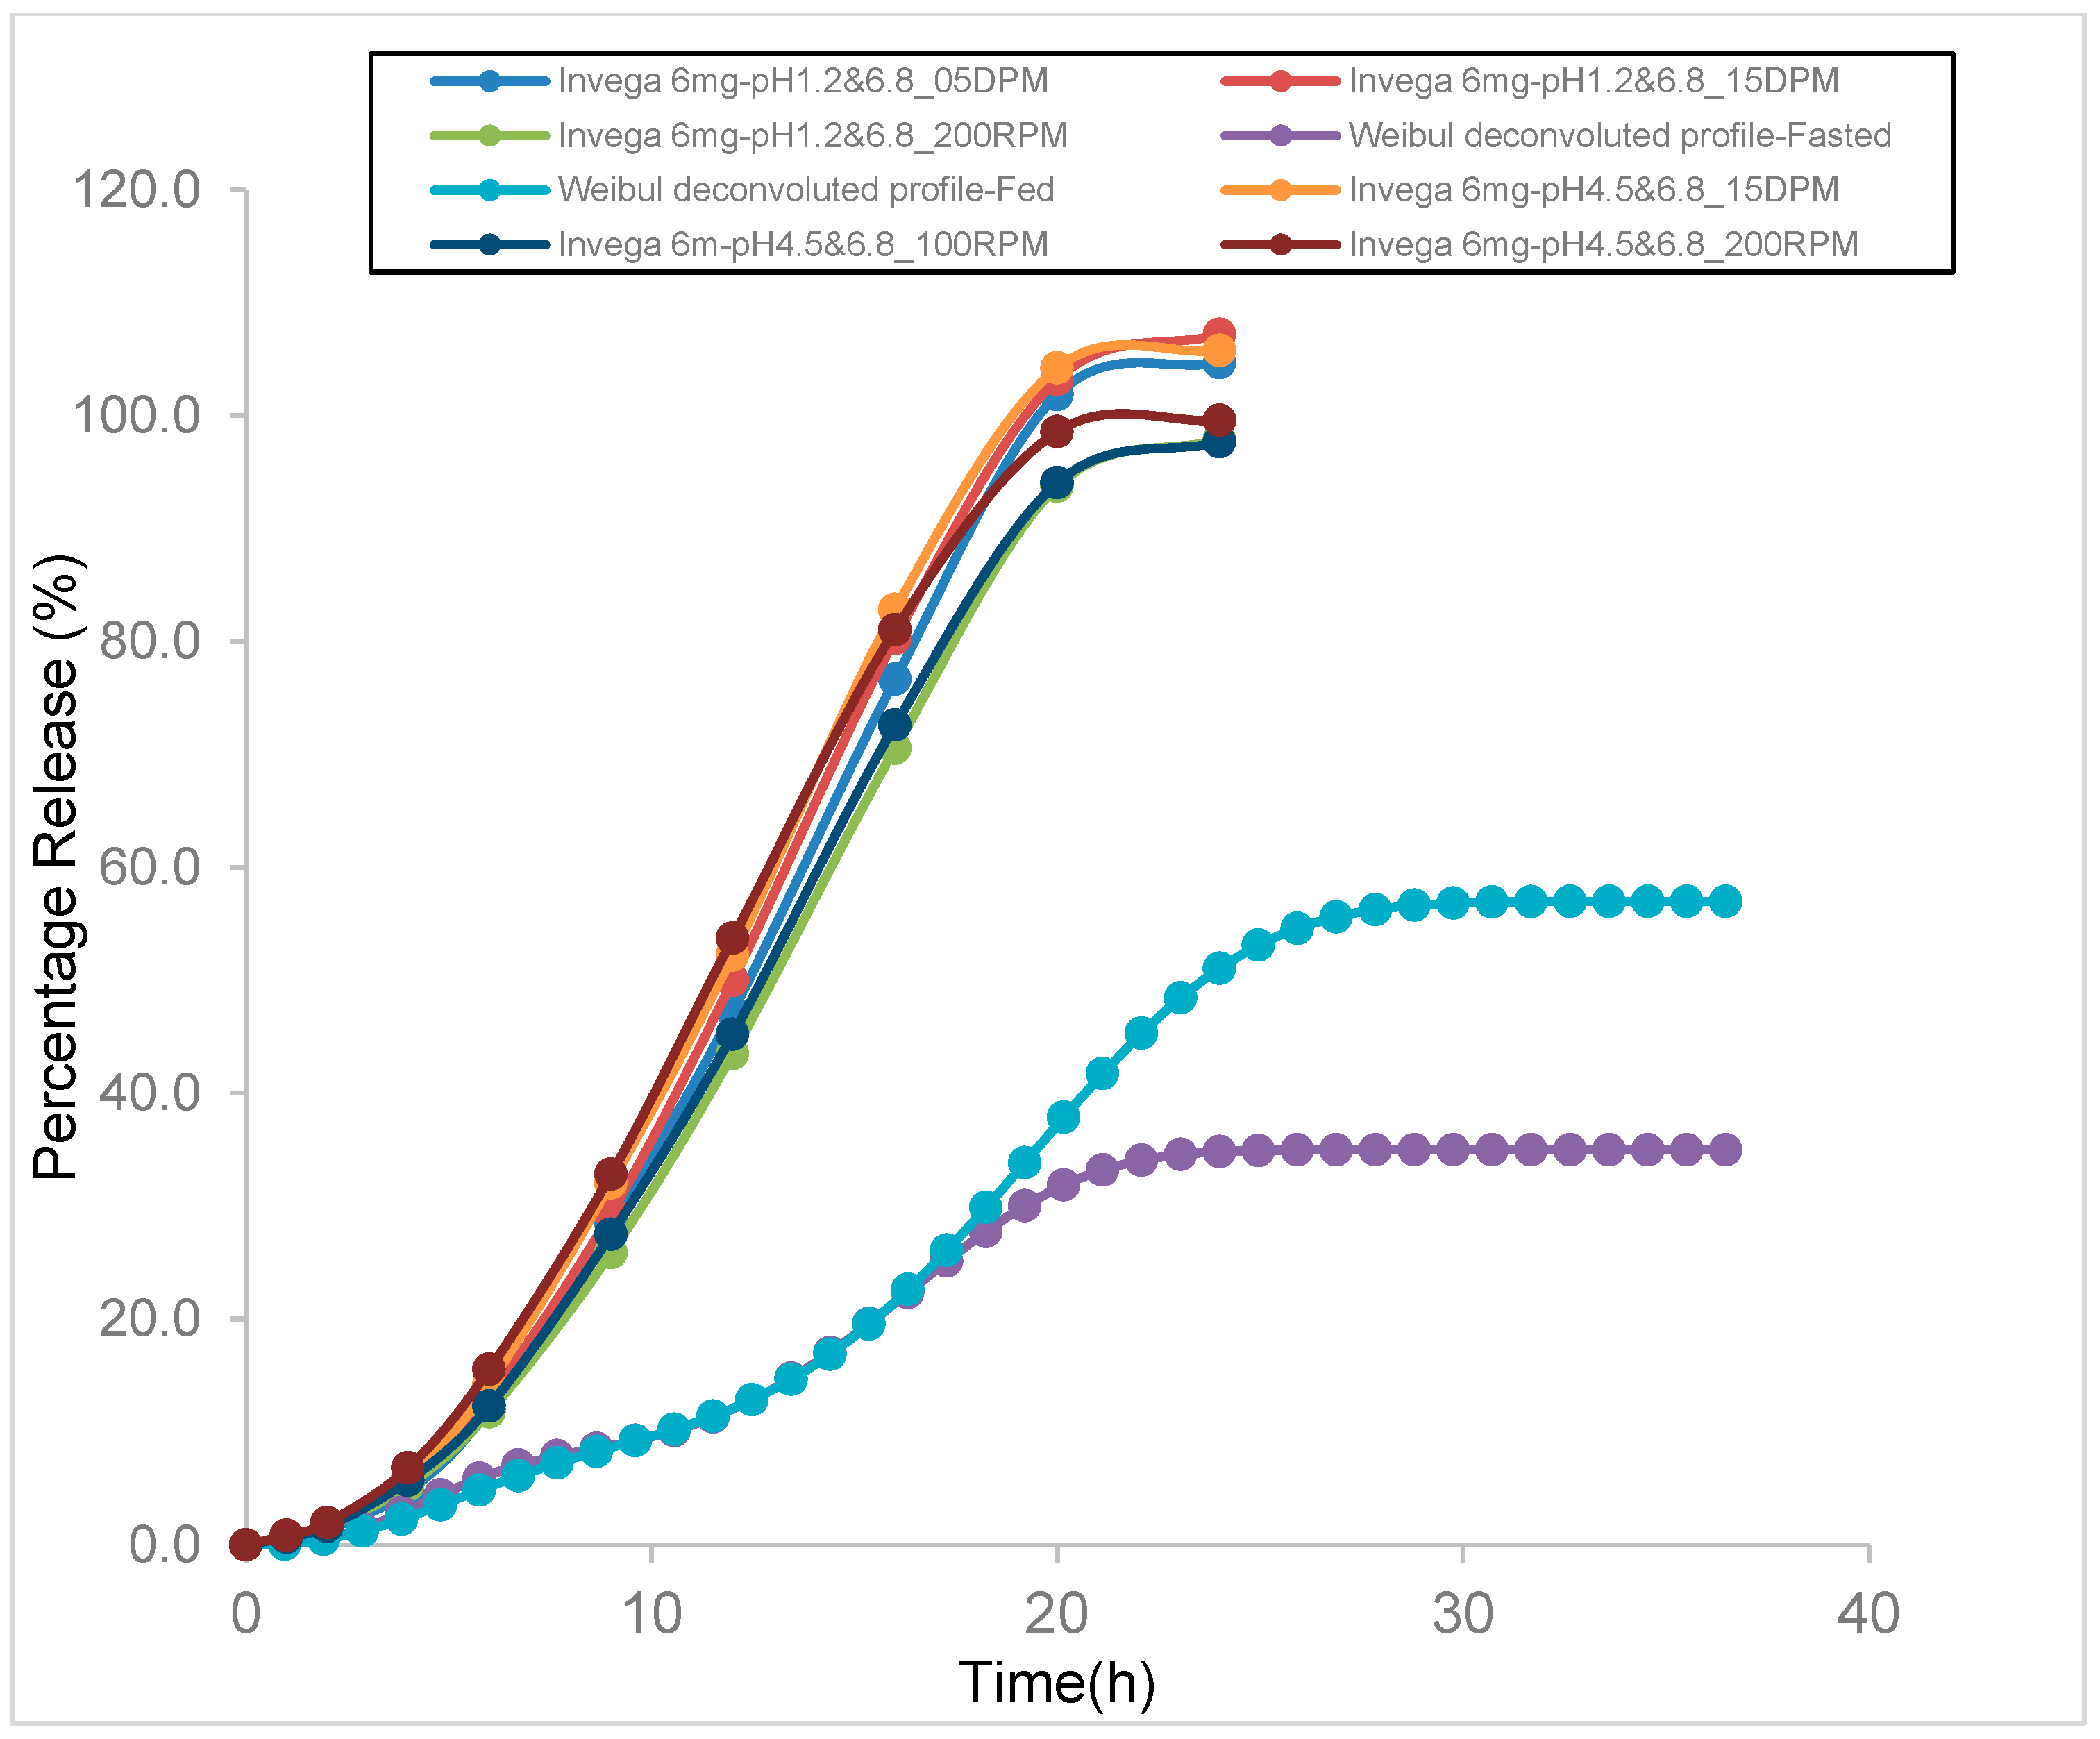
3.6. Comparison of In Vitro Tested Dissolution and Weibull Deconvoluted Profiles Used as Input for Fed and Fasted Model
4. Discussion
5. Conclusions
Supplementary Materials
Author Contributions
Funding
Institutional Review Board Statement
Informed Consent Statement
Data Availability Statement
Conflicts of Interest
References
- Vinarov, Z.; Abdallah, M.; Agundez, J.A.G.; Allegaert, K.; Basit, A.W.; Braeckmans, M.; Ceulemans, J.; Corsetti, M.; Griffin, B.T.; Grimm, M.; et al. Impact of gastrointestinal tract variability on oral drug absorption and pharmacokinetics: An UNGAP review. Eur. J. Pharm. Sci. 2021, 162, 105812. [Google Scholar] [CrossRef] [PubMed]
- Koziolek, M.; Alcaro, S.; Augustijns, P.; Basit, A.W.; Grimm, M.; Hens, B.; Hoad, C.L.; Jedamzik, P.; Madla, C.M.; Maliepaard, M.; et al. The mechanisms of pharmacokinetic food-drug interactions—A perspective from the UNGAP group. Eur. J. Pharm. Sci. 2019, 134, 31–59. [Google Scholar] [CrossRef] [PubMed]
- Guidance for Industry: Assessing the Effects of Food on Drugs in INDs and NDAs—Clinical Pharmacology Considerations. Available online: https://www.fda.gov/regulatory-information/search-fda-guidance-documents/assessing-effects-food-drugs-inds-and-ndas-clinical-pharmacology-considerations (accessed on 23 January 2023).
- Corena-McLeod, M. Comparative Pharmacology of Risperidone and Paliperidone. Drugs R 2015, 15, 163–174. [Google Scholar] [CrossRef] [PubMed]
- Invega (Paliperidone) Extended Release Tablet-Highlights of prescribing information. Available online: https://www.accessdata.fda.gov/drugsatfda_docs/label/2010/021999s018lbl.pdf (accessed on 20 January 2023).
- Vermeir, M.; Naessens, I.; Remmerie, B.; Mannens, G.; Hendrickx, J.; Sterkens, P.; Talluri, K.; Boom, S.; Eerdekens, M.; van Osselaer, N.; et al. Absorption, metabolism, and excretion of paliperidone, a new monoaminergic antagonist, in humans. Drug Metab. Dispos. 2008, 36, 769–779. [Google Scholar] [CrossRef] [PubMed]
- FDA. Paliperidone-New Drug Application: Amendment-Clinical Pharmacology and Biopharmaceutics Review (Application No. 21-999). 2006. Available online: https://www.accessdata.fda.gov/drugsatfda_docs/nda/2009/021999Orig1s004.pdf (accessed on 3 March 2022).
- Invega-Paliperidone-Scientific Discussion. Available online: https://www.ema.europa.eu/en/documents/scientific-discussion/invega-epar-scientific-discussion_en.pdf (accessed on 3 March 2022).
- Ogueri, K.S.; Shamblin, S.L. Osmotic-controlled release oral tablets: Technology and functional insights. Trends Biotechnol. 2022, 40, 606–619. [Google Scholar] [CrossRef] [PubMed]
- Enhanced Efficacy Benzisoxazole Derivative Dosage Forms and Methods. Available online: https://patents.google.com/patent/WO2007050377A1/en (accessed on 3 March 2022).
- Otsuka, K.; Shono, Y.; Dressman, J. Coupling biorelevant dissolution methods with physiologically based pharmacokinetic modelling to forecast in-vivo performance of solid oral dosage forms. J. Pharm. Pharmacol. 2013, 65, 937–952. [Google Scholar] [CrossRef] [PubMed]
- Conley, R.; Gupta, S.K.; Sathyan, G. Clinical spectrum of the osmotic-controlled release oral delivery system (OROS), an advanced oral delivery form. Curr. Med. Res. Opin. 2006, 22, 1879–1892. [Google Scholar] [CrossRef] [PubMed]
- Senekowitsch, S.; Schick, P.; Abrahamsson, B.; Augustijns, P.; Gießmann, T.; Lennernäs, H.; Matthys, C.; Marciani, L.; Pepin, X.; Perkins, A.; et al. Application of In Vivo Imaging Techniques and Diagnostic Tools in Oral Drug Delivery Research. Pharmaceutics 2022, 14, 801. [Google Scholar] [CrossRef] [PubMed]
- Kaur, N.; Narang, A.; Bansal, A.K. Use of biorelevant dissolution and PBPK modeling to predict oral drug absorption. Eur. J. Pharm. Biopharm. 2018, 129, 222–246. [Google Scholar] [CrossRef] [PubMed]
- Patel, N.; Polak, S.; Jamei, M.; Rostami-Hodjegan, A.; Turner, D.B. Quantitative prediction of formulation-specific food effects and their population variability from in vitro data with the physiologically-based ADAM model: A case study using the BCS/BDDCS Class II drug nifedipine. Eur. J. Pharm. Sci. 2014, 57, 240–249. [Google Scholar] [CrossRef] [PubMed]
- Pathak, S.M.; Schaefer, K.J.; Jamei, M.; Turner, D.B. Biopharmaceutic IVIVE-Mechanistic Modeling of Single- and Two-Phase In Vitro Experiments to Obtain Drug-Specific Parameters for Incorporation into PBPK Models. J. Pharm. Sci. 2019, 108, 1604–1618. [Google Scholar] [CrossRef]
- Wagner, C.; Kesisoglou, F.; Pepin, X.J.H.; Parrott, N.; Emami Riedmaier, A. Use of Physiologically Based Pharmacokinetic Modeling for Predicting Drug-Food Interactions: Recommendations for Improving Predictive Performance of Low Confidence Food Effect Models. AAPS J. 2021, 23, 85. [Google Scholar] [CrossRef]
- Cheng, L.; Wong, H. Food Effects on Oral Drug Absorption: Application of Physiologically-Based Pharmacokinetic Modeling as a Predictive Tool. Pharmaceutics 2020, 12, 672. [Google Scholar] [CrossRef] [PubMed]
- Riedmaier, A.E.; DeMent, K.; Huckle, J.; Bransford, P.; Stillhart, C.; Lloyd, R.; Alluri, R.; Basu, S.; Chen, Y.; Dhamankar, V.; et al. Use of Physiologically Based Pharmacokinetic (PBPK) Modeling for Predicting Drug-Food Interactions: An Industry Perspective. AAPS J. 2020, 22, 123. [Google Scholar] [CrossRef] [PubMed]
- FDA. Guidance for Industry the Use of Physiologically Based Pharmacokinetic Analyses—Biopharmaceutics Applications for Oral Drug Product Development, Manufacturing Changes, and Controls. Available online: https://www.fda.gov/media/142500/download (accessed on 23 January 2023).
- Prabhakar, D.; Divya, A.; Prathyusha, R.; Kumar, K.S. Augmentation of Dissolution Profile of Poorly Soluble Paliperidone by Employing Liquisolid Technology. Available online: https://sphinxsai.com/2014/PTVOL6/PT=39(710-719)AJ14.pdf (accessed on 28 February 2022).
- Product Monograph—Invega® Paliperidone Extended-Release Tablets (3 mg, 6 mg, 9 mg and 12 mg). Available online: https://pdf.hres.ca/dpd_pm/00043904.PDF (accessed on 10 January 2022).
- PubChem Compound Summary for CID 115237, Paliperidone. Available online: https://pubchem.ncbi.nlm.nih.gov/compound/Paliperidone (accessed on 10 January 2022).
- Sutton, S.C. Role of physiological intestinal water in oral absorption. AAPS J. 2009, 11, 277–285. [Google Scholar] [CrossRef]
- Rossenu, S.; Crauwels, H.; Cleton, A. Comparison of the pharmacokinetics of an oral immediate-release and extended-release formulation of paliperidone in healthy subjects. Presented at the Annual Meeting and Exposition of the American Association of Pharmaceutical Sciences (AAPS), San Antonio, TX, USA, 29 October–2 November 2006. [Google Scholar]
- Si, T.; Shu, L.; Liu, Y.; Su, Y.A.; Guo, C.; Zhang, H. Single-dose pharmacokinetics of paliperidone extended-release tablets in healthy Chinese subjects. Hum. Psychopharmacol. 2010, 25, 404–409. [Google Scholar] [PubMed]
- Boom, S.; Talluri, K.; Janssens, L.; Remmerie, B.; De Meulder, M.; Rossenu, S.; van Osselaer, N.; Eerdekens, M.; Cleton, A. Single- and multiple-dose pharmacokinetics and dose proportionality of the psychotropic agent paliperidone extended release. J. Clin. Pharm. 2009, 49, 1318–1330. [Google Scholar] [CrossRef] [PubMed]


Disclaimer/Publisher’s Note: The statements, opinions and data contained in all publications are solely those of the individual author(s) and contributor(s) and not of MDPI and/or the editor(s). MDPI and/or the editor(s) disclaim responsibility for any injury to people or property resulting from any ideas, methods, instructions or products referred to in the content. |
© 2023 by the authors. Licensee MDPI, Basel, Switzerland. This article is an open access article distributed under the terms and conditions of the Creative Commons Attribution (CC BY) license (https://creativecommons.org/licenses/by/4.0/).
Share and Cite
Subhani, S.; Lukacova, V.; Kim, C.; Rodriguez-Vera, L.; Muniz, P.; Rodriguez, M.; Cristofoletti, R.; Van Os, S.; Suarez, E.; Schmidt, S.; et al. Leveraging Physiologically Based Modelling to Provide Insights on the Absorption of Paliperidone Extended-Release Formulation under Fed and Fasting Conditions. Pharmaceutics 2023, 15, 629. https://doi.org/10.3390/pharmaceutics15020629
Subhani S, Lukacova V, Kim C, Rodriguez-Vera L, Muniz P, Rodriguez M, Cristofoletti R, Van Os S, Suarez E, Schmidt S, et al. Leveraging Physiologically Based Modelling to Provide Insights on the Absorption of Paliperidone Extended-Release Formulation under Fed and Fasting Conditions. Pharmaceutics. 2023; 15(2):629. https://doi.org/10.3390/pharmaceutics15020629
Chicago/Turabian StyleSubhani, Saima, Viera Lukacova, Chaejin Kim, Leyanis Rodriguez-Vera, Paula Muniz, Monica Rodriguez, Rodrigo Cristofoletti, Sandra Van Os, Elena Suarez, Stephan Schmidt, and et al. 2023. "Leveraging Physiologically Based Modelling to Provide Insights on the Absorption of Paliperidone Extended-Release Formulation under Fed and Fasting Conditions" Pharmaceutics 15, no. 2: 629. https://doi.org/10.3390/pharmaceutics15020629